2016 texas child care market rate survey - · pdf file · 2016-07-282016 texas...
TRANSCRIPT

Child & Family Research Institute
School of Social Work
The University of Texas at Austin
2016 TEXAS CHILD CARE MARKET RATE SURVEY FINAL REPORT
Conducted for:
The Texas Workforce Commission
By:
Ray Marshall Center for the Study of Human Resources
LBJ School of Public Affairs
The University of Texas at Austin


i
TABLE OF CONTENTS
1. Introduction and Overview ....................................................................................................... 1
1.1 Introduction ............................................................................................................................ 1 1.2 Overview of Study Design ....................................................................................................... 5
Sample of Child Care Facilities .............................................................................................. 5
Data Collection ...................................................................................................................... 6
Final Call Disposition ............................................................................................................. 7
Measures ............................................................................................................................... 8
Analytic Approach ................................................................................................................. 9
Analysis and Trends: Market Rates and Other Statistical Descriptions .............................. 10
2. Child Care Daily Market Rates ................................................................................................. 15
2.1 Child Care Daily Market Rates — State of Texas ................................................................... 17 2.2 Child Care Daily Market Rates by LWDA ............................................................................... 21 2.3 Child Care Daily Market Rates: Summary Tables by LWDA by Age Group ........................... 51 2.4 Child Care Daily Market Rates: Summary Tables by LWDA by Facility Type ......................... 67
3. Child Care Daily Market Rates and LWDA Established Rates: Percentile Analysis ...................... 83
3.1 Percentile Analysis ................................................................................................................ 85
4. Special Analyses ................................................................................................................... 101
4.1 Special Analyses — Services and Enrollment ...................................................................... 103 4.2 Special Analyses — Administrative Categories ................................................................... 119
Appendix A. Data Analysis ........................................................................................................ A-1
Appendix B. Questionnaires: Licensed Child Care Centers ......................................................... B-1
Appendix C. Questionnaire: Registered and Licensed Child Care Homes ..................................... C-1

ii
List of Figures
Figure 1.2.1 Share of Centers Offering Part-Day Care over Time ................................................. 12
Figure 1.2.2 Share of Licensed Homes Offering Part-Day Care over Time ..................................... 13
Figure 1.2.3 Share of Registered Homes Offering Part-Day Care over Time ................................. 14

iii
List of Tables
Table 1.1.1 Overview of Sample and Response Rate by Child Care Facility Type ........................... 3
Table 1.2.1 Eligibility Status of Child Care Facilities...................................................................... 7
Table 1.2.2 Final Call Disposition of Eligible Child Care Facilities .................................................. 8
Table 1.2.3 Summary of Survey Data Collected by Facility Type ................................................... 9
Table 2.1 Child Care Daily Market Rates — State of Texas .......................................................... 19
Table 2.1.1 Child Care Daily Market Rates by Age Group — State of Texas .................................. 20
Table 2.1.2 Child Care Daily Market Rates by Facility Type — State of Texas ............................... 20
Table 2.2.1 Child Care Daily Market Rates by LWDA ................................................................... 23
LWDA 1 Panhandle ................................................................................................................ 23
LWDA 2 South Plains .............................................................................................................. 24
LWDA 3 North Texas .............................................................................................................. 25
LWDA 4 North Central Texas ................................................................................................. 26
LWDA 5 Tarrant County ......................................................................................................... 27
LWDA 6 Dallas ........................................................................................................................ 28
LWDA 7 North East Texas ...................................................................................................... 29
LWDA 8 East Texas ................................................................................................................. 30
LWDA 9 West Central Texas .................................................................................................. 31
LWDA 10 Upper Rio Grande .................................................................................................. 32
LWDA 11 Permian Basin ........................................................................................................ 33
LWDA 12 Concho Valley ......................................................................................................... 34
LWDA 13 Heart of Texas ........................................................................................................ 35
LWDA 14 Capital Area ............................................................................................................ 36
LWDA 15 Rural Capital ........................................................................................................... 37
LWDA 16 Brazos Valley .......................................................................................................... 38
LWDA 17 Deep East Texas ..................................................................................................... 39
LWDA 18 South East Texas .................................................................................................... 40
LWDA 19 Golden Crescent ..................................................................................................... 41
LWDA 20 Alamo ..................................................................................................................... 42
LWDA 21 South Texas ............................................................................................................ 43
LWDA 22 Coastal Bend .......................................................................................................... 44
LWDA 23 Lower Rio Grande Valley ........................................................................................ 45
LWDA 24 Cameron County .................................................................................................... 46
LWDA 25 Texoma ................................................................................................................... 47
LWDA 26 Central Texas .......................................................................................................... 48
LWDA 27 Middle Rio Grande ................................................................................................. 49
LWDA 28 Gulf Coast ............................................................................................................... 50
iv
Table 2.3.1 Child Care Daily Market Rates: Summary Tables by LWDA by Age Group .................. 53
LWDA 1 Panhandle ................................................................................................................ 53
LWDA 2 South Plains .............................................................................................................. 53
LWDA 3 North Texas .............................................................................................................. 54
LWDA 4 North Central Texas ................................................................................................. 54
LWDA 5 Tarrant County ......................................................................................................... 55
LWDA 6 Dallas ........................................................................................................................ 55
LWDA 7 North East Texas ...................................................................................................... 56
LWDA 8 East Texas ................................................................................................................. 56
LWDA 9 West Central Texas .................................................................................................. 57
LWDA 10 Upper Rio Grande .................................................................................................. 57
LWDA 11 Permian Basin ........................................................................................................ 58
LWDA 12 Concho Valley ......................................................................................................... 58
LWDA 13 Heart of Texas ........................................................................................................ 59
LWDA 14 Capital Area ............................................................................................................ 59
LWDA 15 Rural Capital ........................................................................................................... 60
LWDA 16 Brazos Valley .......................................................................................................... 60
LWDA 17 Deep East Texas ..................................................................................................... 61
LWDA 18 South East Texas .................................................................................................... 61
LWDA 19 Golden Crescent ..................................................................................................... 62
LWDA 20 Alamo ..................................................................................................................... 62
LWDA 21 South Texas ............................................................................................................ 63
LWDA 22 Coastal Bend .......................................................................................................... 63
LWDA 23 Lower Rio Grande Valley ........................................................................................ 64
LWDA 24 Cameron County .................................................................................................... 64
LWDA 25 Texoma ................................................................................................................... 65
LWDA 26 Central Texas .......................................................................................................... 65
LWDA 27 Middle Rio Grande ................................................................................................. 66
LWDA 28 Gulf Coast ............................................................................................................... 66
Table 2.4.1 Child Care Daily Market Rates: Summary Tables by LWDA by Facility Type ................ 69
LWDA 1 Panhandle ................................................................................................................ 69
LWDA 2 South Plains .............................................................................................................. 69
LWDA 3 North Texas .............................................................................................................. 70
LWDA 4 North Central Texas ................................................................................................. 70
LWDA 5 Tarrant County ......................................................................................................... 71
LWDA 6 Dallas ........................................................................................................................ 71
LWDA 7 North East Texas ...................................................................................................... 72
LWDA 8 East Texas ................................................................................................................. 72
LWDA 9 West Central Texas .................................................................................................. 73
LWDA 10 Upper Rio Grande .................................................................................................. 73
LWDA 11 Permian Basin ........................................................................................................ 74
LWDA 12 Concho Valley ......................................................................................................... 74

v
LWDA 13 Heart of Texas ........................................................................................................ 75
LWDA 14 Capital Area ............................................................................................................ 75
LWDA 15 Rural Capital ........................................................................................................... 76
LWDA 16 Brazos Valley .......................................................................................................... 76
LWDA 17 Deep East Texas ..................................................................................................... 77
LWDA 18 South East Texas .................................................................................................... 77
LWDA 19 Golden Crescent ..................................................................................................... 78
LWDA 20 Alamo ..................................................................................................................... 78
LWDA 21 South Texas ............................................................................................................ 79
LWDA 22 Coastal Bend .......................................................................................................... 79
LWDA 23 Lower Rio Grande Valley ........................................................................................ 80
LWDA 24 Cameron County .................................................................................................... 80
LWDA 25 Texoma ................................................................................................................... 81
LWDA 26 Central Texas .......................................................................................................... 81
LWDA 27 Middle Rio Grande ................................................................................................. 82
LWDA 28 Gulf Coast ............................................................................................................... 82
Table 3.1.1 Percentile Analyses by Facility Type ......................................................................... 86
Table 3.1.2 Percentile Analyses by Rate Type ............................................................................. 86
Table 3.1.3 Percentile Analyses by Age Group ............................................................................ 86
Table 3.1.4 Percentile Analyses by LWDA ................................................................................... 88
Table 3.1.5 Board Maximum Rates ............................................................................................ 89
Licensed Centers: Board Maximum Rate by Age Group ........................................................ 89
Licensed Centers: Percentile of Board Maximum Rate by Age Group .................................. 90
Licensed Homes: Board Maximum Rate by Age Group ......................................................... 91
Licensed Homes: Percentile of Board Maximum Rate by Age Group .................................... 92
Registered Homes: Board Maximum Rate ............................................................................. 93
Registered Homes: Percentile of Board Maximum Rate ....................................................... 94
Table 3.1.6 Board Maximum Enhanced Rates............................................................................. 95
Licensed Centers: Board Maximum Enhanced Rate .............................................................. 95
Licensed Centers: Percentile of Board Maximum Enhanced Rate......................................... 96
Licensed Homes: Board Maximum Enhanced Rate ............................................................... 97
Licensed Homes: Percentile of Board Maximum Enhanced Rate .......................................... 98
Registered Homes: Board Maximum Enhanced Rate ............................................................ 99
Registered Homes: Percentile of Board Maximum Enhanced Rate .................................... 100

vi
Table 4.1.1 Special Analyses: Texas Services and Enrollment .................................................... 103
Table 4.1.2 Special Analyses: Services and Enrollment by LWDA ............................................... 104
LWDA 1 Panhandle .............................................................................................................. 104
LWDA 2 South Plains ............................................................................................................ 104
LWDA 3 North Texas ............................................................................................................ 105
LWDA 4 North Central Texas ............................................................................................... 105
LWDA 5 Tarrant County ....................................................................................................... 106
LWDA 6 Dallas ...................................................................................................................... 106
LWDA 7 North East Texas .................................................................................................... 107
LWDA 8 East Texas ............................................................................................................... 107
LWDA 9 West Central Texas ................................................................................................ 108
LWDA 10 Upper Rio Grande ................................................................................................ 108
LWDA 11 Permian Basin ...................................................................................................... 109
LWDA 12 Concho Valley ....................................................................................................... 109
LWDA 13 Heart of Texas ...................................................................................................... 110
LWDA 14 Capital Area .......................................................................................................... 110
LWDA 15 Rural Capital ......................................................................................................... 111
LWDA 16 Brazos Valley ........................................................................................................ 111
LWDA 17 Deep East Texas ................................................................................................... 112
LWDA 18 South East Texas .................................................................................................. 112
LWDA 19 Golden Crescent ................................................................................................... 113
LWDA 20 Alamo ................................................................................................................... 113
LWDA 21 South Texas .......................................................................................................... 114
LWDA 22 Coastal Bend ........................................................................................................ 114
LWDA 23 Lower Rio Grande Valley ...................................................................................... 115
LWDA 24 Cameron County .................................................................................................. 115
LWDA 25 Texoma ................................................................................................................. 116
LWDA 26 Central Texas ........................................................................................................ 116
LWDA 27 Middle Rio Grande ............................................................................................... 117
LWDA 28 Gulf Coast ............................................................................................................. 117
Table 4.2.1 Special Analyses: Texas Administrative Categories ................................................. 121
Table 4.2.2 Special Analyses: Administrative Categories by LWDA ............................................ 122
LWDA 1 Panhandle .............................................................................................................. 122
LWDA 2 South Plains ............................................................................................................ 122
LWDA 3 North Texas ............................................................................................................ 123
LWDA 4 North Central Texas ............................................................................................... 123
LWDA 5 Tarrant County ....................................................................................................... 124
LWDA 6 Dallas ...................................................................................................................... 124
LWDA 7 North East Texas .................................................................................................... 125
LWDA 8 East Texas ............................................................................................................... 125
LWDA 9 West Central Texas ................................................................................................ 126

vii
LWDA 10 Upper Rio Grande ................................................................................................ 126
LWDA 11 Permian Basin ...................................................................................................... 127
LWDA 12 Concho Valley ....................................................................................................... 127
LWDA 13 Heart of Texas ...................................................................................................... 128
LWDA 14 Capital Area .......................................................................................................... 128
LWDA 15 Rural Capital ......................................................................................................... 129
LWDA 16 Brazos Valley ........................................................................................................ 129
LWDA 17 Deep East Texas ................................................................................................... 130
LWDA 18 South East Texas .................................................................................................. 130
LWDA 19 Golden Crescent ................................................................................................... 131
LWDA 20 Alamo ................................................................................................................... 131
LWDA 21 South Texas .......................................................................................................... 132
LWDA 22 Coastal Bend ........................................................................................................ 132
LWDA 23 Lower Rio Grande Valley ...................................................................................... 133
LWDA 24 Cameron County .................................................................................................. 133
LWDA 25 Texoma ................................................................................................................. 134
LWDA 26 Central Texas ........................................................................................................ 134
LWDA 27 Middle Rio Grande ............................................................................................... 135
LWDA 28 Gulf Coast ............................................................................................................. 135
Table A-1. Area Effects, Untransformed Rates ......................................................................... A-5
Table A-2. Rate Type Effects ................................................................................................... A-6

1. INTRODUCTION AND OVERVIEW


3
1.1 INTRODUCTION
The Child and Family Research Institute (CFRI), in partnership with the Ray Marshall Center for
the Study of Human Resources (RMC), has undertaken the 2016 Texas Child Care Market Rate Survey as
contracted by the Texas Workforce Commission (TWC) via Purchase Order number 201202409.
This report summarizes child care market rate data for the entire state of Texas and for each of
its 28 local workforce development areas (LWDAs). Three types of child care facilities were surveyed
between September 2015 and March 2016: licensed child care centers, registered homes and licensed
homes. In the survey, licensed and registered homes are grouped together, but separated for analysis.
Table 1.1 below details the sample for the survey.
Table 1.1.1 Overview of Sample and Response Rate by Child Care Facility Type
Facility Type Total
Sampled Total
Eligible Total
Respondents Response
Rate*
Licensed child care centers 2624 2411 1850 76.7%
Registered and licensed child care homes
1873 1610 838 52.0%
Total 4497 4021 2688 66.8%
*Response rate is calculated by taking the number of respondents who completed the survey and dividing it by the number of facilities determined to be eligible to take the survey.
The report includes four sections, followed by several technical appendices. The first section, this
introduction, briefly describes the research methods used for this survey and provides an analytic
overview of key findings.
The second section is comprised of four sub-sections: first, statistics describing the distributions
of statewide market rates for child care are presented. Second, daily market rates for child care are
presented for each LWDA by: type of facility, age group, and full-day vs. part-day status. In addition to
the mean daily rates, the following percentiles are provided: 30th, 40th, 50th (median), 60th, 70th, and 75th.
Third, tables for each LWDA include a summary of rate data by age group (collapsed across facility types).
Finally, tables for each LWDA summarize rate data by facility type (collapsed across age groups).
The third section consists of a percentile analysis that compares data on local areas’ maximum
allowable reimbursement rates with actual market rate distributions. This section first includes a
presentation of maximum allowable reimbursement rates by LWDA by type of facility, age group, and
part- or full-day care, followed by an analysis of the percentiles at which such rates will allow
reimbursement. These analyses are presented in two groups: one for regular maximum reimbursement
4
rates, and another for maximum ‘enhanced’ reimbursement rates that may be available to certain
providers, depending on local rules.
The fourth section contains two sub-sections. The first sub section reports the percentages of
respondents offering care at non-traditional hours, and transportation services offered by LWDA and
facility type. Also included in this sub section are percentages of facilities with national accreditation and
Texas Rising Star status, as well as two similar but distinct measures of the percentage of facilities serving
any subsidized children, and the proportion of the enrolled children receiving a child care subsidy. The
second sub-section includes percentages of non-sectarian providers (non-profit and for-profit), sectarian
providers (non-profit and for-profit), and community-based organizations (non-profit and for-profit).

5
1.2 OVERVIEW OF STUDY DESIGN
This discussion of the study design briefly describes the sampling technique, the interview
process, and the analysis for the 2016 Child Care Market Rate Survey. A more detailed technical
description of the analytic approach for the project is supplied in Appendix A. This section concludes with
a brief analysis of trends by comparing results of this market rate survey to those of the prior year’s survey,
which was based on 2014-2015 data and completed in early 2015.
Sample of Child Care Facilities
The population of interest in this study is the priced child care market in Texas. Licensed and
registered facilities that charge families directly and do not discount rates based on prior relationships
with families are included in this study to determine child care market rates. The 2016 study sample was
drawn from a list of all 15,850 licensed and registered child care facilities provided by the Texas
Department of Family and Protective Services (TDFPS) in August 2015. The list included three types of
child care facilities in each of the 28 local workforce development areas (LWDAs):
● Licensed Child Care Centers (LCCCs)
● Licensed Child Care Homes (LCCHs)
● Registered Child Care Homes (RCCHs)
Head Start facilities were removed from the list prior to sampling because they do not charge
families directly. Next, a small statewide representative sample of 1,000 facilities was randomly selected
in order to 1) provide greater statistical power for estimating statewide rates and trends and 2) increase
the precision of rate estimates for the largest local boards that provide the bulk of care in the state. A
second random sample was drawn from the remaining facilities to estimate rates at the LWDA level. For
this latter sample, we chose a target number of centers and a separate target for homes from every LWDA
based on projections of the number needed to yield an average of 35 independent rate observations in
center and home full-day rate categories.1 Projections based on detailed response rates to the last three
annual surveys indicated that, on average, 77 LCCCs, 11 LCCHs, and 60 RCCHs per LWDA were needed to
reach this goal. These target numbers were then increased by between 6 percent and 14 percent for
LWDA and facility type combinations that showed low response rates in recent surveys. The target
number of facilities was then randomly selected from each LWDA, or if fewer providers were available in
any given combination of LWDA and facility type, the entire population was selected (a complete census).
Implementation of this sampling scheme resulted in all facilities of any type being selected from two
1 Starting with the 2013 survey, licensed and registered homes were combined for sampling projection and selection purposes, thus resulting in a higher proportion of registered homes being targeted, but also more in line with their greater representation among home providers statewide.

6
LWDAs: 12 and 27. In addition to these two, a complete census of LCCCs was necessary in 6 more LWDAs,
and a complete census of RCCHs was necessary in fourteen more LWDAs.
Before final local rates were estimated, data from the statewide sample were added to that from
the local samples in their respective areas, and the weighting schemes (for estimating statewide rates)
were adjusted accordingly. Due to changes in the estimation procedures, originally implemented in the
2010 survey and described in the small area estimation section of Appendix A, the number of rate
observations collected by this design was adequate to provide stable rate estimates for all LWDAs, without
needing to rely on rates from adjacent areas or any other kinds of estimates or approximations.
Data Collection
Detailed training and supervision was provided to research staff members on survey
methodology, interviewing protocols, data entry and collection, and tracking procedures by advanced
graduate students and the project manager.
Prior to interviews, the research staff mailed an introductory letter to all facilities in the sample
explaining the survey purpose, goals and objectives, confidentiality policies, and the voluntary nature of
participation. Information was presented in both English and Spanish unless providers’ surnames
suggested they were of Vietnamese origin, in which case information was presented in both English and
Vietnamese.
A seven-station call center at CFRI operated Monday through Friday between 8:00 AM to 7:00
PM. Research staff members maintained a tracking database containing basic provider information
(facility name, LWDA, phone number, facility identification number) and call history (number of attempts,
date and time of attempt, preferred calling times, appointments, call results, final status). A minimum of
two morning and two afternoon/evening calls were made to contact each provider beginning in
September 2015 and ending in March 2016. The research staff administered calls at least one week apart
unless an appointment or preferred calling time was established with a provider. In these cases, the staff
made up to three additional attempts to complete the survey.
In order to prevent any delay in data collection and increase participation, bilingual research staff
members (5 English/Spanish and 1 English/Vietnamese) conducted interviews with centers and homes.
An additional research staff member conducted interviews with all identified multi-site facilities. A
website was also constructed to present further information about the survey to providers. Finally, a toll
free number was available for providers to return missed calls, return a message, or ask further questions
about the survey.
If research staff were unable to complete the survey after all attempts had been made to reach a
provider, the facility would be marked as ‘overdialed’ and no more attempts to contact that facility would
be made. In cases where the phone number provided was disconnected or no longer in service, the

7
research staff attempted to contact the facility three times at least one week apart. If the number was
still not working and no additional information was available online, the staff determined the facility to
be ineligible.
During an interview, research staff members screened out facilities that did not represent the
true price market for child care in Texas. These facilities include those that only offered drop-in care, part-
time care with no after-school care, summer camps, care provided to specific populations only (i.e.
children with special needs, children of teen moms, children of staff at a company, etc.), and free/family-
discounted child care services. School and kindergarten programs that did not offer regular afterschool
care and Head Start programs were also excluded. Finally, facilities that had closed or no longer had
children enrolled were determined to be ineligible.
Final Call Disposition
A total of 4497 child care facilities (2624 centers and 1873 homes) were included in the sample
this year. Of these facilities, 476 (10.6%) did not meet study eligibility criteria and were dropped from the
response rate calculations. For centers, the top reasons for not meeting eligibility criteria included:
1) Drop-in care, part day program, or school with no afterschool program (26.9%);
2) Care to specific population only (20.8%);
3) Disconnected number or non-working number (17.5%).
For homes, top reasons for ineligibility included:
1) Disconnected number or non-working number (40.3%);
2) Closed or not providing care (34.6%);
3) Free/Family-discounted child care (17.1%).
Table 1.2.1 below details the eligibility of child care providers who were contacted.
Table 1.2.1 Eligibility Status of Child Care Facilities
Homes Centers Total
Not Eligible 263 (14.0%) 213 (8.1%) 476 (10.6%)
Eligible 1610 (86.0%) 2411 (91.1%) 4021 (89.4%)
Total 1873 2624 4497

8
The number of eligible providers is used to calculate the overall response rate. Of the 4021 eligible
child care providers, 2688 (66.8%) completed the survey. This overall response rate is consistent with the
2015 survey, and reflects the same pattern in which homes have lower response rates than centers. The
overall response rate for homes was 52.0% and the overall response rate for centers was 76.7%. Table
1.2.2 below details the final call disposition of all eligible child care facilities.
Table 1.2.2 Final Call Disposition of Eligible Child Care Facilities
Homes Centers Total
Completed 838 (52.0%) 1850 (76.7%) 2688 (66.8%)
Refused 49 (3.0%) 61 (2.5%) 110 (2.7%)
Overdialed 708 (44.0%) 494 (20.5%) 1202 (29.9%)
Withdrew 11 (0.7%) 4 (0.2%) 15 (0.4%)
Partial 5 (0.3%) 2 (0.1%) 7 (0.2%)
Total 1610 (100.0%) 2411 (100.0%) 3905 (100.0%)
HOMES: Both licensed and registered homes were combined into a single sample of 1873 homes.
Of these, 838 (52.0%) completed interviews, 49 (3.0%) refused to complete interviews, and 11 (0.7%)
withdrew or declined to participate in the study after they began an interview. An additional five
providers (0.3%) completed only a portion of the interview. Finally, 708 (44.0%) providers were
overdialed.
CENTERS: A total of 2624 centers were sampled. Of these, 1850 (76.7%) completed interviews,
61 (2.5%) refused to complete interviews, and 4 (0.2%) withdrew or declined to participate in the study
after they began an interview. An additional two providers (0.1%) completed only a portion of the
interview. Finally, 494 (20.5%) providers were overdialed.
Measures
The Market Rate Surveys for home-based and center-based facilities covered similar topics.
However, home-based facilities provided detailed information concerning each child under their care
(age, exact schedule of care, and rate charged), whereas center-based facilities provided rates by age
group and by whether care was full-day or part-day (six hours or less per day). See Table 1.2.3 for a
summary of information collected on home-based and center-based surveys.

9
Table 1.2.3 Summary of Survey Data Collected by Facility Type
Topics Home-based survey Center-based survey
Hours of operation Yes Yes
Vacation schedules Yes Yes
Child age and enrollment Individual age and schedule for
each child in care *Facility-determined age groups
and enrollment by age group
Rates Rate Type (CCS/Non-CCS) and
individual rate charged per child Full-time and part-day rates by
age group
Additional Fees
Yes Yes Registration
Enrollment
Activity
Administrative Categories
Yes Yes Non-profit/for-profit
Associations
Transportation
National Accreditations Yes Yes
Texas Rising Star Program Yes Yes
*Center rate data were gathered for children in various age groups, using the facility-determined age group cutoffs to set rates. These data were then collapsed into the following standard age groups for reporting: Infants (0-17 months); toddlers (18-35 months); preschoolers (36-71 months); and school age children (72 months and over).
Analytic Approach
The technical appendix provides a detailed account of the analytic approach taken in producing
the rates in this report. It is particularly important to note, however, that virtually all of the daily market
rate percentiles and other statistics presented in this report are based on large and statistically reliable
sample sizes. Even in the scarcest categories of care, such as part-day infant and toddler care in LCCHs,
and part-day infant care in RCCHs, the numbers of rates gathered were sufficient for estimating stable
rates.
Because different types of facilities tend to set their rates differently, analysis of center rates was
based on the rates for a category of care (for example, full-day care for toddlers), while the rates for home-
based care (LCCH and RCCH) were determined by the amounts charged for individual children. That is, as
mentioned earlier, in interviews with centers the researchers asked for the rates charged for a particular

10
age group following a particular schedule. In contrast, researchers asked home-based facilities for the
age and rate charged for each individual child.
After the data were collected, all rates that appeared extremely high or low (known as outliers)
were identified, and researchers individually checked each rate report and corrected any errors they
found. Subsequent to these corrections, a small portion of the most extreme outliers remaining in the
sample were corrected to remove their excessive influence on statistical measures of the rates
distributions. In addition, similar procedures were implemented to detect instances in which the number
of slots reported for a given rate was too extreme, whether too high or too low, and to correct these
extremes to more reasonable values. In general, as one might expect in a large and diverse state, extreme
rates, whether at the low or high end of the scale, were typically the result of unusual services provided
by an individual facility and/or variations in subsidies and financing rather than research error.
Analysis and Trends: Market Rates and Other Statistical Descriptions
The basic outcomes for this report are presented in two sections: the first provides the child care
rates; the second describes the prevalence of services and financial and organizational arrangements
among child care facilities. Several interesting trends emerge from this analysis.
The data and analysis in this report are voluminous. The primary tables of daily child care market
rates that form the next section of this report give seven statistics for each of four age groups in each of
two schedule types (part-day and full-day) in three types of facilities for each of the 28 LWDA Boards.
These data yield a total of 4704 statistics. It is likely that in such a massive report, some anomalies will
emerge in the numbers. A systematic analysis was done of all possible comparisons looking for common
rate anomalies, such as when an older child rate significantly exceeds the corresponding rate for a younger
child, or a part-day rate exceeds the corresponding full-day rate. However, with the changes to the
estimation method beginning with the 2010 survey (see small area estimation, Appendix A), none of these
types of anomalies are present.
A comparison of the daily market rates reported in this 2016 survey to those observed in 2015
reveal several interesting trends that are evident on a statewide level.2 Overall, across facility types and
age groups, median daily rates increased by about 3.9 percent during this period, or about $0.77 per day,
when compared to 2015 median daily rates. This rate of increase is fairly typical, as rates often increase
from around two to five percent per.
2 Median rates are compared over time as the better measure of central tendency, though higher percentiles may be deemed more appropriate for rate-setting. Comparisons were made of all 672 median rates (28 areas multiplied by 24 rate categories) reported in this survey versus the same rates from the prior annual survey, and are weighted to be representative of care provided on a statewide basis.

11
This increasing trend in rates from the prior year’s report to this report is the result of combining
slightly greater increases among Homes with slightly lesser increases among Centers:
In Licensed Child Care Centers, median rates increased by an average of 2.5 percent, or about $0.55 per day.
In Licensed Child Care Homes, median rates increased by an average of 4 percent, or about $0.78 per day.
In Registered Child Care Homes, median rates increased by an average of 5.1 percent, or about $0.96 per day.
Changes in the market rates varied slightly by age groups of the children served:
Median rates for infants increased by an average of 2 percent, or about $0.44 per day.
Median rates for toddlers increased by an average of 6.1 percent, or about $1.28 per day.
Median rates for preschoolers increased by an average of 3.2 percent, or about $0.59 per day.
Median rates for school aged children increased by an average of 4.6 percent, or about $0.77 per day.
Daily rates for full-day care did not increase as much as rates for part-day:
Median full-day rates increased by an average of 3 percent, or about $0.66 per day.
Median part-day rates increased by an average of 5.2 percent, or about $0.88 per day.
Finally, comparing rates across regions, continuing a trend seen in prior years, parts of the DFW
area (including North Central Texas, LWDA 4; and Tarrant County, LWDA 5) and the Austin region
(including Capital Area, LWDA 14; and Rural Capital, LWDA 15) have the most expensive child care in the
state. Rounding out the fairly expensive care group are local boards covering most of the remaining large
metro areas of the state, including Alamo (LWDA 20), Gulf Coast (LWDA 28), and Dallas (LWDA 6) are not
far behind in terms of high rates. The least expensive care in the state is in Lower Rio Grande Valley (LWDA
23), with Cameron County (LWDA 24) and other areas of the Rio Grande Valley not far behind.

12
Other trends noted in previous surveys were again evident in 2016. For a number of years now a
short supply of part-day infant care, as well as part-day care in general, has been noted in most areas of
the state. As an illustration of this trend, the following figures show percentages of facilities surveyed
that offer part-day care for each of four age groups. These are shown for each of the last ten annual
market rate surveys.3
Figure 1.2.1 Share of Centers Offering Part-Day Care over Time
Figure 1.2.1 illustrates these trends for Licensed Centers. This figure makes it clear that part-day
infant and toddler care are the most difficult to find. Furthermore, as will be seen below, these low rates
of availability are the best the market offers to those needing part-day care, as availability among homes
is worse. Shares of centers offering part-day preschool or school age care have fluctuated over time, but
since around 2009 a clear trend toward greater availability of part time care for these older children is
seen in centers.
3 Survey was not conducted in 2008. No other years were skipped, but a change in the naming convention in 2015 to reflect the year the survey was completed, rather than begun, makes it appear that 2014 was skipped.

13
Figure 1.2.2 shows these trends over time for Licensed Homes. Part-day care in licensed homes
was scarce even at its peak in 2005, with fewer than ten percent of facilities offering such care to children
of any age. After continuing a more or less downward trend since then, availability of part day care in
licensed homes is still quite low as of 2016, at less than five percent of facilities.
Figure 1.2.2 Share of Licensed Homes Offering Part-Day Care over Time

14
Figure 1.2.3 illustrates trends in availability of part day care in registered homes, which is quite
low but slightly better than licensed homes. As with the other facility types, greater shares of registered
homes have been offering part-day care for older children in the last few years. Aside from this slight
bump, the generally low availability of part-day care seen across the market persists among registered
homes as well.
Figure 1.2.3 Share of Registered Homes Offering Part-Day Care over Time
Due to this generally low availability of part-day care, it is difficult to gather sufficient rate data to
estimate stable part-day rates for all areas. Appendix A describes efforts to estimate part-day rates in
some categories of care in licensed and registered homes with the least availability of part-day care.

2. CHILD CARE DAILY MARKET RATES


2.1 CHILD CARE DAILY MARKET RATES — STATE OF TEXAS

19
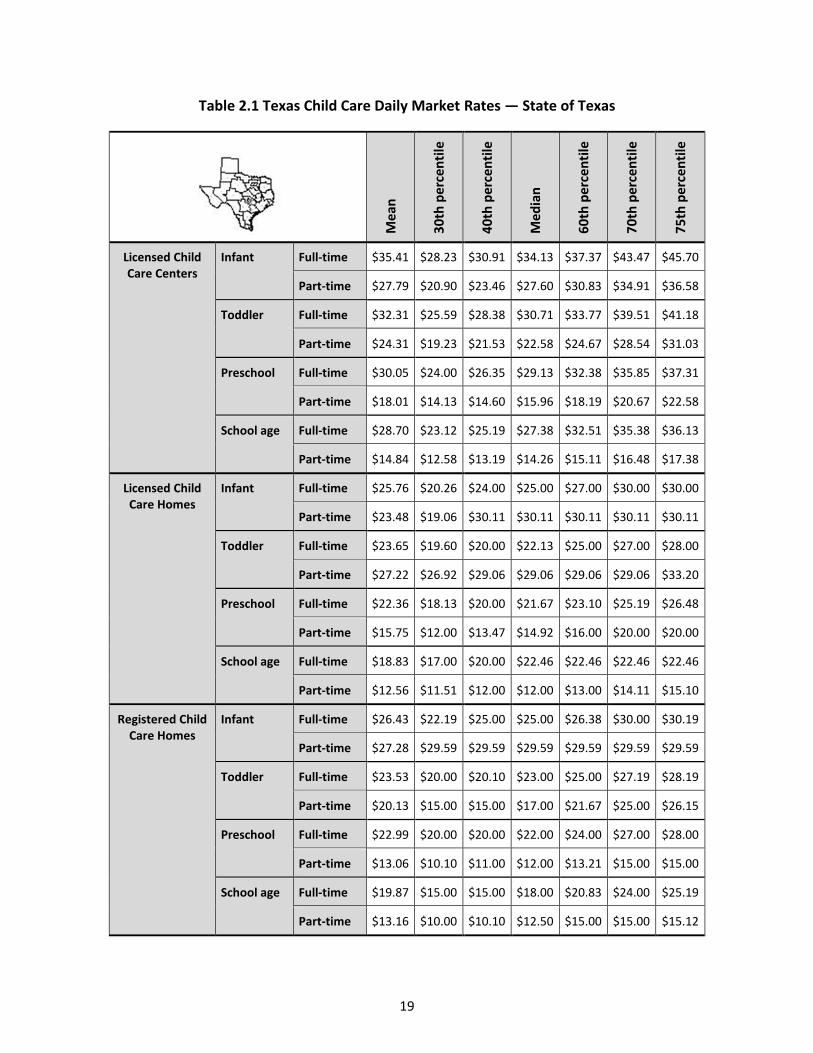
Table 2.1 Texas Child Care Daily Market Rates — State of Texas
Mea
n
30
th p
erce
nti
le
40
th p
erce
nti
le
Med
ian
60
th p
erce
nti
le
70
th p
erce
nti
le
75
th p
erce
nti
le
Licensed Child Care Centers
Infant Full-time $35.41 $28.23 $30.91 $34.13 $37.37 $43.47 $45.70
Part-time $27.79 $20.90 $23.46 $27.60 $30.83 $34.91 $36.58
Toddler Full-time $32.31 $25.59 $28.38 $30.71 $33.77 $39.51 $41.18
Part-time $24.31 $19.23 $21.53 $22.58 $24.67 $28.54 $31.03
Preschool Full-time $30.05 $24.00 $26.35 $29.13 $32.38 $35.85 $37.31
Part-time $18.01 $14.13 $14.60 $15.96 $18.19 $20.67 $22.58
School age Full-time $28.70 $23.12 $25.19 $27.38 $32.51 $35.38 $36.13
Part-time $14.84 $12.58 $13.19 $14.26 $15.11 $16.48 $17.38
Licensed Child Care Homes
Infant Full-time $25.76 $20.26 $24.00 $25.00 $27.00 $30.00 $30.00
Part-time $23.48 $19.06 $30.11 $30.11 $30.11 $30.11 $30.11
Toddler Full-time $23.65 $19.60 $20.00 $22.13 $25.00 $27.00 $28.00
Part-time $27.22 $26.92 $29.06 $29.06 $29.06 $29.06 $33.20
Preschool Full-time $22.36 $18.13 $20.00 $21.67 $23.10 $25.19 $26.48
Part-time $15.75 $12.00 $13.47 $14.92 $16.00 $20.00 $20.00
School age Full-time $18.83 $17.00 $20.00 $22.46 $22.46 $22.46 $22.46
Part-time $12.56 $11.51 $12.00 $12.00 $13.00 $14.11 $15.10
Registered Child Care Homes
Infant Full-time $26.43 $22.19 $25.00 $25.00 $26.38 $30.00 $30.19
Part-time $27.28 $29.59 $29.59 $29.59 $29.59 $29.59 $29.59
Toddler Full-time $23.53 $20.00 $20.10 $23.00 $25.00 $27.19 $28.19
Part-time $20.13 $15.00 $15.00 $17.00 $21.67 $25.00 $26.15
Preschool Full-time $22.99 $20.00 $20.00 $22.00 $24.00 $27.00 $28.00
Part-time $13.06 $10.10 $11.00 $12.00 $13.21 $15.00 $15.00
School age Full-time $19.87 $15.00 $15.00 $18.00 $20.83 $24.00 $25.19
Part-time $13.16 $10.00 $10.10 $12.50 $15.00 $15.00 $15.12
20
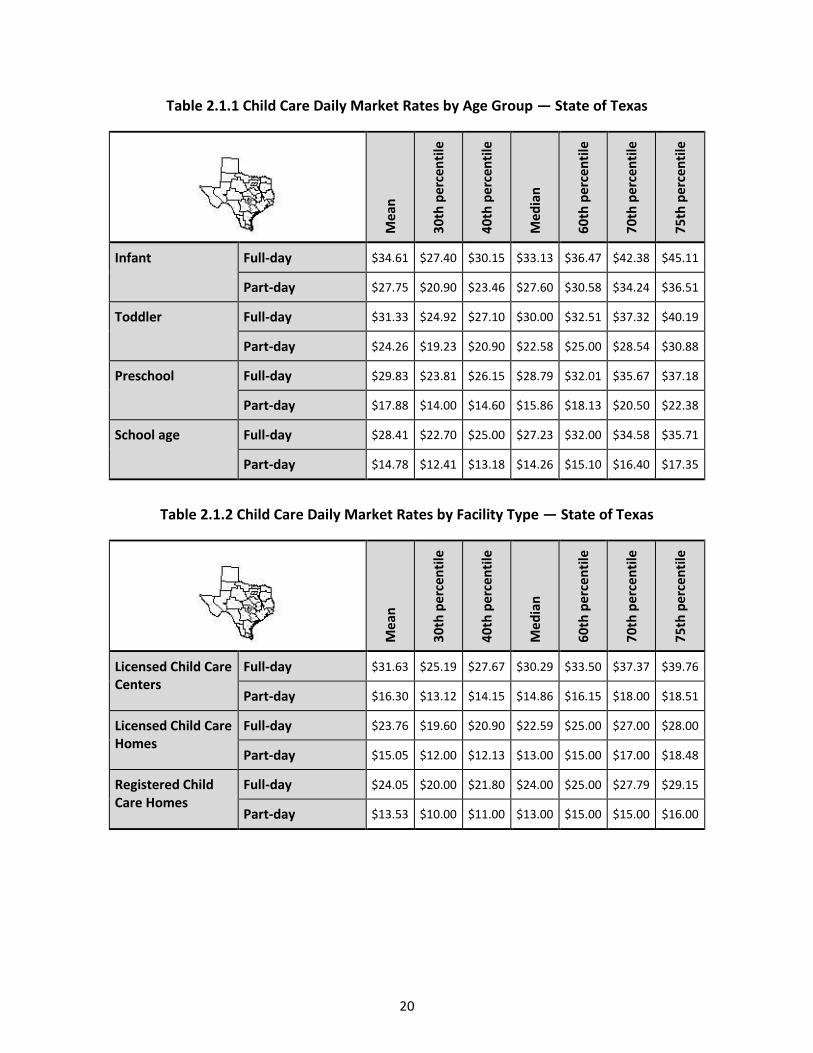
Table 2.1.1 Child Care Daily Market Rates by Age Group — State of Texas
Mea
n
30
th p
erce
nti
le
40
th p
erce
nti
le
Med
ian
60
th p
erce
nti
le
70
th p
erce
nti
le
75
th p
erce
nti
le
Infant Full-day $34.61 $27.40 $30.15 $33.13 $36.47 $42.38 $45.11
Part-day $27.75 $20.90 $23.46 $27.60 $30.58 $34.24 $36.51
Toddler Full-day $31.33 $24.92 $27.10 $30.00 $32.51 $37.32 $40.19
Part-day $24.26 $19.23 $20.90 $22.58 $25.00 $28.54 $30.88
Preschool Full-day $29.83 $23.81 $26.15 $28.79 $32.01 $35.67 $37.18
Part-day $17.88 $14.00 $14.60 $15.86 $18.13 $20.50 $22.38
School age Full-day $28.41 $22.70 $25.00 $27.23 $32.00 $34.58 $35.71
Part-day $14.78 $12.41 $13.18 $14.26 $15.10 $16.40 $17.35
Table 2.1.2 Child Care Daily Market Rates by Facility Type — State of Texas
Me
an
30
th p
erce
nti
le
40
th p
erce
nti
le
Me
dia
n
60
th p
erce
nti
le
70
th p
erce
nti
le
75
th p
erc
en
tile
Licensed Child Care Centers
Full-day $31.63 $25.19 $27.67 $30.29 $33.50 $37.37 $39.76
Part-day $16.30 $13.12 $14.15 $14.86 $16.15 $18.00 $18.51
Licensed Child Care Homes
Full-day $23.76 $19.60 $20.90 $22.59 $25.00 $27.00 $28.00
Part-day $15.05 $12.00 $12.13 $13.00 $15.00 $17.00 $18.48
Registered Child Care Homes
Full-day $24.05 $20.00 $21.80 $24.00 $25.00 $27.79 $29.15
Part-day $13.53 $10.00 $11.00 $13.00 $15.00 $15.00 $16.00

2.2 CHILD CARE DAILY MARKET RATES BY LWDA

23
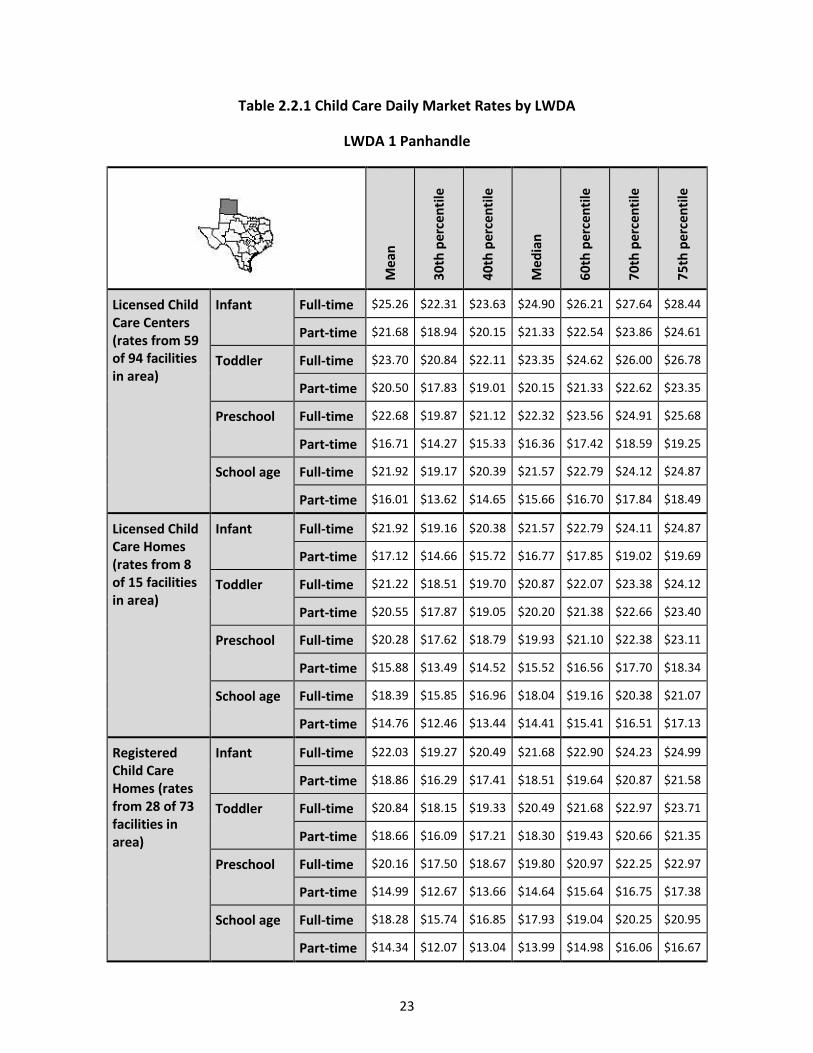
Table 2.2.1 Child Care Daily Market Rates by LWDA
LWDA 1 Panhandle
Mea
n
30
th p
erce
nti
le
40
th p
erce
nti
le
Med
ian
60
th p
erce
nti
le
70
th p
erce
nti
le
75
th p
erce
nti
le
Licensed Child Care Centers (rates from 59 of 94 facilities in area)
Infant Full-time $25.26 $22.31 $23.63 $24.90 $26.21 $27.64 $28.44
Part-time $21.68 $18.94 $20.15 $21.33 $22.54 $23.86 $24.61
Toddler Full-time $23.70 $20.84 $22.11 $23.35 $24.62 $26.00 $26.78
Part-time $20.50 $17.83 $19.01 $20.15 $21.33 $22.62 $23.35
Preschool Full-time $22.68 $19.87 $21.12 $22.32 $23.56 $24.91 $25.68
Part-time $16.71 $14.27 $15.33 $16.36 $17.42 $18.59 $19.25
School age Full-time $21.92 $19.17 $20.39 $21.57 $22.79 $24.12 $24.87
Part-time $16.01 $13.62 $14.65 $15.66 $16.70 $17.84 $18.49
Licensed Child Care Homes (rates from 8 of 15 facilities in area)
Infant Full-time $21.92 $19.16 $20.38 $21.57 $22.79 $24.11 $24.87
Part-time $17.12 $14.66 $15.72 $16.77 $17.85 $19.02 $19.69
Toddler Full-time $21.22 $18.51 $19.70 $20.87 $22.07 $23.38 $24.12
Part-time $20.55 $17.87 $19.05 $20.20 $21.38 $22.66 $23.40
Preschool Full-time $20.28 $17.62 $18.79 $19.93 $21.10 $22.38 $23.11
Part-time $15.88 $13.49 $14.52 $15.52 $16.56 $17.70 $18.34
School age Full-time $18.39 $15.85 $16.96 $18.04 $19.16 $20.38 $21.07
Part-time $14.76 $12.46 $13.44 $14.41 $15.41 $16.51 $17.13
Registered Child Care Homes (rates from 28 of 73 facilities in area)
Infant Full-time $22.03 $19.27 $20.49 $21.68 $22.90 $24.23 $24.99
Part-time $18.86 $16.29 $17.41 $18.51 $19.64 $20.87 $21.58
Toddler Full-time $20.84 $18.15 $19.33 $20.49 $21.68 $22.97 $23.71
Part-time $18.66 $16.09 $17.21 $18.30 $19.43 $20.66 $21.35
Preschool Full-time $20.16 $17.50 $18.67 $19.80 $20.97 $22.25 $22.97
Part-time $14.99 $12.67 $13.66 $14.64 $15.64 $16.75 $17.38
School age Full-time $18.28 $15.74 $16.85 $17.93 $19.04 $20.25 $20.95
Part-time $14.34 $12.07 $13.04 $13.99 $14.98 $16.06 $16.67

24
LWDA 2 South Plains
Mea
n
30
th p
erce
nti
le
40
th p
erce
nti
le
Med
ian
60
th p
erce
nti
le
70
th p
erce
nti
le
75
th p
erce
nti
le
Licensed Child Care Centers (rates from 63 of 112 facilities in area)
Infant Full-time $22.75 $20.23 $21.37 $22.47 $23.59 $24.81 $25.51
Part-time $19.67 $17.32 $18.36 $19.38 $20.43 $21.57 $22.21
Toddler Full-time $21.41 $18.96 $20.06 $21.12 $22.22 $23.40 $24.08
Part-time $18.66 $16.35 $17.37 $18.37 $19.39 $20.50 $21.12
Preschool Full-time $20.53 $18.13 $19.20 $20.24 $21.31 $22.47 $23.13
Part-time $15.37 $13.26 $14.18 $15.08 $16.00 $17.01 $17.59
School age Full-time $19.88 $17.51 $18.57 $19.59 $20.65 $21.79 $22.44
Part-time $14.76 $12.69 $13.59 $14.47 $15.38 $16.37 $16.93
Licensed Child Care Homes (rates from 6 of 49 facilities in area)
Infant Full-time $19.88 $17.51 $18.56 $19.59 $20.64 $21.78 $22.43
Part-time $15.72 $13.59 $14.53 $15.43 $16.37 $17.39 $17.97
Toddler Full-time $19.28 $16.94 $17.98 $18.99 $20.02 $21.15 $21.79
Part-time $18.69 $16.39 $17.41 $18.40 $19.43 $20.54 $21.17
Preschool Full-time $18.46 $16.17 $17.19 $18.18 $19.19 $20.29 $20.92
Part-time $14.64 $12.58 $13.48 $14.35 $15.25 $16.24 $16.80
School age Full-time $16.83 $14.63 $15.60 $16.54 $17.51 $18.56 $19.16
Part-time $13.67 $11.67 $12.54 $13.38 $14.25 $15.21 $15.75
Registered Child Care Homes (rates from 15 of 40 facilities in area)
Infant Full-time $19.97 $17.60 $18.66 $19.68 $20.74 $21.89 $22.54
Part-time $17.23 $15.01 $15.99 $16.94 $17.92 $18.99 $19.60
Toddler Full-time $18.95 $16.63 $17.66 $18.66 $19.69 $20.80 $21.44
Part-time $17.05 $14.85 $15.82 $16.77 $17.74 $18.80 $19.41
Preschool Full-time $18.35 $16.07 $17.08 $18.07 $19.08 $20.18 $20.80
Part-time $13.87 $11.85 $12.73 $13.58 $14.45 $15.41 $15.96
School age Full-time $16.73 $14.54 $15.50 $16.44 $17.40 $18.46 $19.05
Part-time $13.30 $11.33 $12.18 $13.01 $13.87 $14.81 $15.35

25
LWDA 3 North Texas
Mea
n
30
th p
erce
nti
le
40
th p
erce
nti
le
Med
ian
60
th p
erce
nti
le
70
th p
erce
nti
le
75
th p
erce
nti
le
Licensed Child Care Centers (rates from 47 of 77 facilities in area)
Infant Full-time $21.63 $18.75 $20.01 $21.24 $22.51 $23.89 $24.67
Part-time $18.19 $15.53 $16.68 $17.81 $18.97 $20.24 $20.96
Toddler Full-time $20.13 $17.34 $18.56 $19.74 $20.96 $22.29 $23.05
Part-time $17.07 $14.49 $15.60 $16.69 $17.81 $19.04 $19.74
Preschool Full-time $19.14 $16.42 $17.60 $18.76 $19.95 $21.25 $21.99
Part-time $13.49 $11.17 $12.15 $13.11 $14.11 $15.20 $15.83
School age Full-time $18.42 $15.75 $16.91 $18.04 $19.21 $20.48 $21.21
Part-time $12.84 $10.56 $11.52 $12.45 $13.43 $14.50 $15.11
Licensed Child Care Homes (rates from 10 of 24 facilities in area)
Infant Full-time $18.42 $15.74 $16.90 $18.03 $19.20 $20.48 $21.20
Part-time $13.88 $11.52 $12.51 $13.49 $14.50 $15.62 $16.25
Toddler Full-time $17.75 $15.12 $16.26 $17.37 $18.52 $19.77 $20.48
Part-time $17.11 $14.53 $15.64 $16.73 $17.85 $19.08 $19.79
Preschool Full-time $16.86 $14.29 $15.40 $16.48 $17.59 $18.82 $19.51
Part-time $12.71 $10.45 $11.40 $12.33 $13.30 $14.36 $14.97
School age Full-time $15.07 $12.63 $13.67 $14.69 $15.74 $16.90 $17.56
Part-time $11.68 $9.50 $10.40 $11.29 $12.22 $13.24 $13.83
Registered Child Care Homes (rates from 19 of 41 facilities in area)
Infant Full-time $18.52 $15.84 $17.01 $18.14 $19.31 $20.59 $21.32
Part-time $15.51 $13.04 $14.09 $15.13 $16.20 $17.37 $18.04
Toddler Full-time $17.39 $14.79 $15.91 $17.01 $18.14 $19.38 $20.09
Part-time $15.32 $12.86 $13.91 $14.93 $16.00 $17.17 $17.83
Preschool Full-time $16.74 $14.18 $15.28 $16.35 $17.47 $18.69 $19.38
Part-time $11.89 $9.69 $10.60 $11.50 $12.44 $13.47 $14.06
School age Full-time $14.96 $12.53 $13.56 $14.58 $15.63 $16.78 $17.44
Part-time $11.29 $9.14 $10.03 $10.91 $11.82 $12.82 $13.40

26
LWDA 4 North Central Texas
Mea
n
30
th p
erce
nti
le
40
th p
erce
nti
le
Med
ian
60
th p
erce
nti
le
70
th p
erce
nti
le
75
th p
erce
nti
le
Licensed Child Care Centers (rates from 105 of 899 facilities in area)
Infant Full-time $36.37 $31.53 $33.65 $35.72 $37.85 $40.17 $41.49
Part-time $30.60 $26.13 $28.06 $29.95 $31.90 $34.03 $35.25
Toddler Full-time $33.85 $29.17 $31.21 $33.20 $35.25 $37.49 $38.77
Part-time $28.71 $24.37 $26.24 $28.06 $29.95 $32.02 $33.20
Preschool Full-time $32.19 $27.62 $29.61 $31.55 $33.55 $35.74 $36.98
Part-time $22.70 $18.79 $20.43 $22.05 $23.73 $25.57 $26.63
School age Full-time $30.99 $26.49 $28.44 $30.34 $32.30 $34.45 $35.67
Part-time $21.60 $17.77 $19.37 $20.95 $22.59 $24.39 $25.42
Licensed Child Care Homes (rates from 10 of 249 facilities in area)
Infant Full-time $30.98 $26.48 $28.43 $30.33 $32.29 $34.44 $35.66
Part-time $23.34 $19.38 $21.05 $22.69 $24.39 $26.26 $27.33
Toddler Full-time $29.86 $25.44 $27.35 $29.21 $31.14 $33.25 $34.45
Part-time $28.78 $24.43 $26.30 $28.13 $30.03 $32.10 $33.28
Preschool Full-time $28.36 $24.04 $25.89 $27.71 $29.59 $31.64 $32.82
Part-time $21.38 $17.58 $19.17 $20.74 $22.37 $24.16 $25.18
School age Full-time $25.35 $21.24 $22.99 $24.70 $26.48 $28.42 $29.54
Part-time $19.65 $15.98 $17.50 $19.00 $20.56 $22.28 $23.26
Registered Child Care Homes (rates from 32 of 416 facilities in area)
Infant Full-time $31.16 $26.65 $28.60 $30.51 $32.48 $34.63 $35.85
Part-time $26.09 $21.93 $23.71 $25.45 $27.25 $29.22 $30.35
Toddler Full-time $29.25 $24.87 $26.76 $28.60 $30.51 $32.60 $33.79
Part-time $25.77 $21.63 $23.39 $25.12 $26.91 $28.87 $29.99
Preschool Full-time $28.15 $23.85 $25.70 $27.51 $29.38 $31.43 $32.59
Part-time $20.00 $16.30 $17.84 $19.35 $20.92 $22.66 $23.65
School age Full-time $25.17 $21.07 $22.81 $24.52 $26.29 $28.23 $29.34
Part-time $18.99 $15.38 $16.87 $18.35 $19.88 $21.57 $22.54

27
LWDA 5 Tarrant County
Mea
n
30
th p
erce
nti
le
40
th p
erce
nti
le
Med
ian
60
th p
erce
nti
le
70
th p
erce
nti
le
75
th p
erce
nti
le
Licensed Child Care Centers (rates from 93 of 609 facilities in area)
Infant Full-time $34.55 $29.97 $31.98 $33.94 $35.95 $38.15 $39.40
Part-time $29.08 $24.84 $26.68 $28.47 $30.32 $32.34 $33.49
Toddler Full-time $32.16 $27.73 $29.66 $31.55 $33.49 $35.62 $36.82
Part-time $27.29 $23.18 $24.95 $26.68 $28.47 $30.43 $31.55
Preschool Full-time $30.59 $26.26 $28.14 $29.98 $31.88 $33.95 $35.13
Part-time $21.59 $17.88 $19.44 $20.98 $22.57 $24.32 $25.32
School age Full-time $29.45 $25.19 $27.03 $28.84 $30.70 $32.73 $33.89
Part-time $20.55 $16.92 $18.44 $19.94 $21.49 $23.19 $24.17
Licensed Child Care Homes (rates from 14 of 113 facilities in area)
Infant Full-time $29.44 $25.18 $27.03 $28.83 $30.69 $32.72 $33.88
Part-time $22.20 $18.45 $20.03 $21.59 $23.20 $24.97 $25.99
Toddler Full-time $28.38 $24.19 $26.00 $27.77 $29.60 $31.59 $32.73
Part-time $27.36 $23.24 $25.01 $26.75 $28.54 $30.50 $31.62
Preschool Full-time $26.96 $22.86 $24.62 $26.35 $28.13 $30.07 $31.18
Part-time $20.35 $16.74 $18.25 $19.73 $21.28 $22.98 $23.95
School age Full-time $24.11 $20.21 $21.87 $23.49 $25.18 $27.02 $28.08
Part-time $18.70 $15.22 $16.66 $18.09 $19.57 $21.20 $22.13
Registered Child Care Homes (rates from 44 of 570 facilities in area)
Infant Full-time $29.61 $25.34 $27.19 $29.00 $30.86 $32.90 $34.06
Part-time $24.81 $20.87 $22.55 $24.20 $25.90 $27.78 $28.84
Toddler Full-time $27.80 $23.65 $25.44 $27.19 $29.00 $30.98 $32.10
Part-time $24.50 $20.58 $22.25 $23.89 $25.58 $27.44 $28.50
Preschool Full-time $26.76 $22.68 $24.44 $26.15 $27.93 $29.87 $30.97
Part-time $19.03 $15.53 $16.98 $18.42 $19.91 $21.55 $22.50
School age Full-time $23.93 $20.05 $21.70 $23.32 $25.00 $26.84 $27.89
Part-time $18.08 $14.65 $16.07 $17.47 $18.92 $20.52 $21.44

28
LWDA 6 Dallas
Mea
n
30
th p
erce
nti
le
40
th p
erce
nti
le
Med
ian
60
th p
erce
nti
le
70
th p
erce
nti
le
75
th p
erce
nti
le
Licensed Child Care Centers (rates from 81 of 726 facilities in area)
Infant Full-time $30.51 $25.98 $27.93 $29.84 $31.81 $33.97 $35.20
Part-time $25.19 $21.03 $22.80 $24.52 $26.32 $28.28 $29.40
Toddler Full-time $28.18 $23.81 $25.68 $27.51 $29.41 $31.48 $32.67
Part-time $23.46 $19.44 $21.13 $22.80 $24.53 $26.43 $27.51
Preschool Full-time $26.65 $22.39 $24.21 $25.99 $27.83 $29.86 $31.01
Part-time $18.01 $14.43 $15.90 $17.35 $18.86 $20.53 $21.49
School age Full-time $25.54 $21.36 $23.14 $24.88 $26.69 $28.66 $29.79
Part-time $17.03 $13.54 $14.96 $16.36 $17.83 $19.46 $20.39
Licensed Child Care Homes (rates from 5 of 129 facilities in area)
Infant Full-time $25.54 $21.36 $23.13 $24.87 $26.68 $28.66 $29.79
Part-time $18.59 $14.96 $16.45 $17.93 $19.46 $21.16 $22.13
Toddler Full-time $24.51 $20.41 $22.15 $23.85 $25.62 $27.56 $28.67
Part-time $23.53 $19.50 $21.20 $22.86 $24.59 $26.50 $27.58
Preschool Full-time $23.14 $19.14 $20.82 $22.48 $24.19 $26.08 $27.16
Part-time $16.84 $13.36 $14.77 $16.17 $17.63 $19.25 $20.18
School age Full-time $20.41 $16.63 $18.20 $19.74 $21.35 $23.13 $24.14
Part-time $15.29 $11.96 $13.29 $14.62 $16.01 $17.55 $18.44
Registered Child Care Homes (rates from 38 of 500 facilities in area)
Infant Full-time $25.70 $21.51 $23.29 $25.04 $26.85 $28.83 $29.97
Part-time $21.08 $17.24 $18.84 $20.42 $22.05 $23.86 $24.89
Toddler Full-time $23.96 $19.89 $21.61 $23.29 $25.04 $26.96 $28.05
Part-time $20.78 $16.97 $18.56 $20.12 $21.74 $23.53 $24.56
Preschool Full-time $22.95 $18.97 $20.64 $22.29 $24.00 $25.88 $26.95
Part-time $15.60 $12.24 $13.59 $14.93 $16.34 $17.89 $18.79
School age Full-time $20.24 $16.47 $18.04 $19.58 $21.18 $22.95 $23.96
Part-time $14.71 $11.43 $12.74 $14.04 $15.41 $16.92 $17.79

29
LWDA 7 North East Texas
Mea
n
30
th p
erce
nti
le
40
th p
erce
nti
le
Med
ian
60
th p
erce
nti
le
70
th p
erce
nti
le
75
th p
erce
nti
le
Licensed Child Care Centers (rates from 55 of 71 facilities in area)
Infant Full-time $21.11 $18.55 $19.69 $20.79 $21.93 $23.16 $23.86
Part-time $18.02 $15.64 $16.69 $17.70 $18.75 $19.89 $20.54
Toddler Full-time $19.76 $17.28 $18.38 $19.45 $20.54 $21.74 $22.42
Part-time $17.00 $14.69 $15.70 $16.69 $17.71 $18.82 $19.45
Preschool Full-time $18.88 $16.45 $17.52 $18.56 $19.63 $20.80 $21.46
Part-time $13.74 $11.64 $12.54 $13.43 $14.34 $15.34 $15.91
School age Full-time $18.23 $15.84 $16.89 $17.91 $18.97 $20.11 $20.77
Part-time $13.14 $11.08 $11.96 $12.83 $13.72 $14.70 $15.26
Licensed Child Care Homes (rates from 6 of 19 facilities in area)
Infant Full-time $18.22 $15.83 $16.88 $17.91 $18.96 $20.11 $20.76
Part-time $14.09 $11.97 $12.88 $13.78 $14.70 $15.72 $16.29
Toddler Full-time $17.62 $15.27 $16.30 $17.31 $18.34 $19.47 $20.11
Part-time $17.04 $14.72 $15.74 $16.73 $17.74 $18.86 $19.49
Preschool Full-time $16.81 $14.51 $15.52 $16.50 $17.51 $18.61 $19.24
Part-time $13.03 $10.97 $11.85 $12.71 $13.60 $14.57 $15.13
School age Full-time $15.19 $12.99 $13.94 $14.87 $15.83 $16.88 $17.48
Part-time $12.07 $10.09 $10.93 $11.76 $12.61 $13.55 $14.09
Registered Child Care Homes (rates from 8 of 22 facilities in area)
Infant Full-time $18.32 $15.92 $16.98 $18.00 $19.06 $20.21 $20.86
Part-time $15.59 $13.36 $14.33 $15.27 $16.25 $17.31 $17.92
Toddler Full-time $17.30 $14.96 $15.98 $16.98 $18.00 $19.12 $19.76
Part-time $15.41 $13.20 $14.16 $15.10 $16.06 $17.12 $17.72
Preschool Full-time $16.70 $14.41 $15.41 $16.39 $17.40 $18.50 $19.12
Part-time $12.26 $10.27 $11.12 $11.95 $12.81 $13.76 $14.30
School age Full-time $15.09 $12.89 $13.84 $14.77 $15.73 $16.78 $17.37
Part-time $11.71 $9.76 $10.58 $11.40 $12.24 $13.17 $13.70

30
LWDA 8 East Texas
Mea
n
30
th p
erce
nti
le
40
th p
erce
nti
le
Med
ian
60
th p
erce
nti
le
70
th p
erce
nti
le
75
th p
erce
nti
le
Licensed Child Care Centers (rates from 76 of 220 facilities in area)
Infant Full-time $22.69 $19.90 $21.13 $22.34 $23.57 $24.92 $25.68
Part-time $19.32 $16.73 $17.87 $18.97 $20.11 $21.36 $22.06
Toddler Full-time $21.22 $18.51 $19.71 $20.87 $22.06 $23.37 $24.10
Part-time $18.22 $15.69 $16.79 $17.87 $18.97 $20.18 $20.87
Preschool Full-time $20.25 $17.61 $18.77 $19.91 $21.07 $22.34 $23.07
Part-time $14.67 $12.38 $13.36 $14.32 $15.32 $16.40 $17.02
School age Full-time $19.55 $16.94 $18.09 $19.20 $20.35 $21.60 $22.31
Part-time $14.02 $11.78 $12.73 $13.67 $14.64 $15.70 $16.31
Licensed Child Care Homes (rates from 7 of 34 facilities in area)
Infant Full-time $19.54 $16.94 $18.08 $19.19 $20.34 $21.59 $22.30
Part-time $15.05 $12.74 $13.73 $14.70 $15.71 $16.81 $17.44
Toddler Full-time $18.89 $16.33 $17.45 $18.54 $19.67 $20.90 $21.60
Part-time $18.26 $15.73 $16.83 $17.91 $19.02 $20.23 $20.91
Preschool Full-time $18.01 $15.50 $16.59 $17.66 $18.76 $19.96 $20.65
Part-time $13.89 $11.66 $12.61 $13.54 $14.51 $15.57 $16.17
School age Full-time $16.24 $13.85 $14.88 $15.89 $16.94 $18.08 $18.73
Part-time $12.86 $10.70 $11.62 $12.51 $13.44 $14.46 $15.04
Registered Child Care Homes (rates from 14 of 37 facilities in area)
Infant Full-time $19.65 $17.04 $18.18 $19.30 $20.45 $21.70 $22.41
Part-time $16.68 $14.25 $15.30 $16.33 $17.39 $18.54 $19.20
Toddler Full-time $18.53 $15.99 $17.10 $18.18 $19.30 $20.52 $21.21
Part-time $16.49 $14.07 $15.12 $16.14 $17.19 $18.34 $18.99
Preschool Full-time $17.89 $15.39 $16.48 $17.54 $18.64 $19.83 $20.52
Part-time $13.07 $10.90 $11.82 $12.72 $13.66 $14.68 $15.27
School age Full-time $16.13 $13.74 $14.78 $15.78 $16.82 $17.96 $18.61
Part-time $12.47 $10.34 $11.24 $12.12 $13.04 $14.04 $14.61

31
LWDA 9 West Central Texas
Mea
n
30
th p
erce
nti
le
40
th p
erce
nti
le
Med
ian
60
th p
erce
nti
le
70
th p
erce
nti
le
75
th p
erce
nti
le
Licensed Child Care Centers (rates from 59 of 93 facilities in area)
Infant Full-time $22.59 $19.55 $20.88 $22.18 $23.52 $24.97 $25.80
Part-time $18.97 $16.17 $17.38 $18.56 $19.79 $21.12 $21.89
Toddler Full-time $21.01 $18.07 $19.35 $20.60 $21.89 $23.29 $24.09
Part-time $17.79 $15.06 $16.23 $17.38 $18.56 $19.86 $20.60
Preschool Full-time $19.97 $17.10 $18.35 $19.56 $20.82 $22.19 $22.97
Part-time $14.02 $11.57 $12.60 $13.61 $14.66 $15.82 $16.48
School age Full-time $19.22 $16.39 $17.61 $18.81 $20.04 $21.38 $22.15
Part-time $13.33 $10.94 $11.94 $12.92 $13.95 $15.08 $15.72
Licensed Child Care Homes (rates from 6 of 22 facilities in area)
Infant Full-time $19.21 $16.39 $17.61 $18.80 $20.03 $21.38 $22.14
Part-time $14.42 $11.94 $12.99 $14.01 $15.08 $16.25 $16.92
Toddler Full-time $18.51 $15.73 $16.93 $18.10 $19.31 $20.63 $21.38
Part-time $17.83 $15.10 $16.28 $17.42 $18.61 $19.91 $20.65
Preschool Full-time $17.57 $14.86 $16.02 $17.16 $18.34 $19.62 $20.36
Part-time $13.20 $10.82 $11.81 $12.79 $13.81 $14.93 $15.57
School age Full-time $15.68 $13.11 $14.20 $15.27 $16.39 $17.61 $18.30
Part-time $12.11 $9.82 $10.77 $11.70 $12.68 $13.76 $14.37
Registered Child Care Homes (rates from 21 of 66 facilities in area)
Infant Full-time $19.32 $16.49 $17.72 $18.91 $20.15 $21.50 $22.27
Part-time $16.15 $13.54 $14.65 $15.74 $16.87 $18.10 $18.81
Toddler Full-time $18.13 $15.38 $16.56 $17.72 $18.91 $20.22 $20.97
Part-time $15.94 $13.35 $14.45 $15.53 $16.65 $17.88 $18.59
Preschool Full-time $17.44 $14.74 $15.90 $17.03 $18.20 $19.49 $20.22
Part-time $12.33 $10.02 $10.98 $11.92 $12.91 $13.99 $14.61
School age Full-time $15.57 $13.00 $14.09 $15.16 $16.27 $17.48 $18.18
Part-time $11.71 $9.45 $10.38 $11.30 $12.26 $13.31 $13.92

32
LWDA 10 Upper Rio Grande
Mea
n
30
th p
erce
nti
le
40
th p
erce
nti
le
Med
ian
60
th p
erce
nti
le
70
th p
erce
nti
le
75
th p
erce
nti
le
Licensed Child Care Centers (rates from 69 of 248 facilities in area)
Infant Full-time $23.10 $19.93 $21.32 $22.67 $24.06 $25.58 $26.44
Part-time $19.34 $16.41 $17.67 $18.90 $20.17 $21.57 $22.36
Toddler Full-time $21.46 $18.39 $19.72 $21.02 $22.36 $23.83 $24.66
Part-time $18.11 $15.27 $16.48 $17.67 $18.90 $20.25 $21.02
Preschool Full-time $20.38 $17.38 $18.68 $19.94 $21.25 $22.68 $23.49
Part-time $14.20 $11.65 $12.71 $13.76 $14.85 $16.05 $16.74
School age Full-time $19.59 $16.65 $17.91 $19.15 $20.44 $21.84 $22.64
Part-time $13.49 $11.00 $12.03 $13.05 $14.11 $15.28 $15.95
Licensed Child Care Homes (rates from 12 of 116 facilities in area)
Infant Full-time $19.58 $16.64 $17.91 $19.15 $20.43 $21.83 $22.63
Part-time $14.62 $12.03 $13.12 $14.18 $15.28 $16.50 $17.20
Toddler Full-time $18.86 $15.96 $17.21 $18.42 $19.68 $21.05 $21.84
Part-time $18.15 $15.31 $16.53 $17.72 $18.95 $20.30 $21.07
Preschool Full-time $17.88 $15.05 $16.26 $17.44 $18.67 $20.01 $20.77
Part-time $13.35 $10.87 $11.90 $12.91 $13.97 $15.13 $15.80
School age Full-time $15.92 $13.24 $14.37 $15.49 $16.64 $17.91 $18.63
Part-time $12.22 $9.84 $10.82 $11.79 $12.80 $13.91 $14.55
Registered Child Care Homes (rates from 32 of 77 facilities in area)
Infant Full-time $19.70 $16.75 $18.02 $19.26 $20.55 $21.96 $22.76
Part-time $16.40 $13.69 $14.84 $15.97 $17.14 $18.42 $19.16
Toddler Full-time $18.46 $15.59 $16.82 $18.02 $19.27 $20.63 $21.41
Part-time $16.19 $13.49 $14.63 $15.76 $16.92 $18.20 $18.93
Preschool Full-time $17.74 $14.93 $16.13 $17.31 $18.53 $19.86 $20.63
Part-time $12.45 $10.05 $11.04 $12.01 $13.03 $14.16 $14.80
School age Full-time $15.80 $13.13 $14.26 $15.37 $16.52 $17.78 $18.50
Part-time $11.80 $9.45 $10.42 $11.37 $12.36 $13.45 $14.08

33
LWDA 11 Permian Basin
Mea
n
30
th p
erce
nti
le
40
th p
erce
nti
le
Med
ian
60
th p
erce
nti
le
70
th p
erce
nti
le
75
th p
erce
nti
le
Licensed Child Care Centers (rates from 69 of 126 facilities in area)
Infant Full-time $24.45 $21.82 $23.00 $24.15 $25.33 $26.60 $27.32
Part-time $21.22 $18.76 $19.86 $20.93 $22.03 $23.22 $23.89
Toddler Full-time $23.05 $20.49 $21.64 $22.75 $23.89 $25.13 $25.83
Part-time $20.16 $17.76 $18.83 $19.87 $20.93 $22.09 $22.75
Preschool Full-time $22.12 $19.61 $20.74 $21.83 $22.95 $24.16 $24.85
Part-time $16.71 $14.50 $15.47 $16.42 $17.39 $18.45 $19.05
School age Full-time $21.44 $18.97 $20.08 $21.15 $22.25 $23.45 $24.12
Part-time $16.07 $13.90 $14.85 $15.78 $16.73 $17.77 $18.36
Licensed Child Care Homes (rates from 10 of 29 facilities in area)
Infant Full-time $21.44 $18.97 $20.07 $21.14 $22.25 $23.44 $24.12
Part-time $17.08 $14.86 $15.84 $16.79 $17.77 $18.84 $19.45
Toddler Full-time $20.81 $18.37 $19.46 $20.52 $21.60 $22.78 $23.45
Part-time $20.20 $17.79 $18.87 $19.91 $20.97 $22.14 $22.79
Preschool Full-time $19.96 $17.57 $18.63 $19.67 $20.73 $21.88 $22.54
Part-time $15.94 $13.79 $14.73 $15.65 $16.60 $17.64 $18.22
School age Full-time $18.24 $15.95 $16.96 $17.95 $18.96 $20.07 $20.70
Part-time $14.92 $12.83 $13.74 $14.63 $15.55 $16.55 $17.12
Registered Child Care Homes (rates from 7 of 21 facilities in area)
Infant Full-time $21.54 $19.06 $20.17 $21.25 $22.35 $23.55 $24.23
Part-time $18.67 $16.35 $17.38 $18.37 $19.40 $20.52 $21.15
Toddler Full-time $20.46 $18.05 $19.12 $20.17 $21.25 $22.42 $23.08
Part-time $18.48 $16.17 $17.19 $18.19 $19.21 $20.32 $20.95
Preschool Full-time $19.84 $17.46 $18.52 $19.55 $20.61 $21.76 $22.41
Part-time $15.13 $13.02 $13.94 $14.84 $15.76 $16.77 $17.34
School age Full-time $18.14 $15.85 $16.86 $17.84 $18.86 $19.96 $20.58
Part-time $14.54 $12.47 $13.36 $14.24 $15.15 $16.14 $16.70

34
LWDA 12 Concho Valley
Mea
n
30
th p
erce
nti
le
40
th p
erce
nti
le
Med
ian
60
th p
erce
nti
le
70
th p
erce
nti
le
75
th p
erce
nti
le
Licensed Child Care Centers (rates from 42 of 52 facilities in area)
Infant Full-time $21.62 $19.41 $20.41 $21.38 $22.37 $23.45 $24.05
Part-time $18.90 $16.82 $17.75 $18.66 $19.59 $20.59 $21.16
Toddler Full-time $20.44 $18.29 $19.26 $20.20 $21.16 $22.21 $22.80
Part-time $17.99 $15.97 $16.87 $17.76 $18.66 $19.64 $20.20
Preschool Full-time $19.65 $17.54 $18.50 $19.42 $20.36 $21.39 $21.97
Part-time $15.06 $13.19 $14.02 $14.82 $15.65 $16.55 $17.06
School age Full-time $19.08 $17.00 $17.94 $18.84 $19.78 $20.79 $21.36
Part-time $14.51 $12.68 $13.49 $14.28 $15.09 $15.97 $16.48
Licensed Child Care Homes (rates from 4 of 8 facilities in area)
Infant Full-time $19.08 $16.99 $17.93 $18.84 $19.77 $20.78 $21.35
Part-time $15.38 $13.49 $14.33 $15.14 $15.98 $16.89 $17.40
Toddler Full-time $18.54 $16.49 $17.41 $18.31 $19.23 $20.22 $20.79
Part-time $18.03 $16.00 $16.91 $17.79 $18.70 $19.68 $20.24
Preschool Full-time $17.82 $15.80 $16.71 $17.59 $18.49 $19.46 $20.02
Part-time $14.41 $12.58 $13.39 $14.17 $14.98 $15.86 $16.36
School age Full-time $16.37 $14.42 $15.29 $16.13 $16.99 $17.93 $18.46
Part-time $13.54 $11.76 $12.54 $13.30 $14.08 $14.94 $15.42
Registered Child Care Homes (rates from 14 of 24 facilities in area)
Infant Full-time $19.16 $17.07 $18.01 $18.93 $19.86 $20.87 $21.44
Part-time $16.73 $14.77 $15.64 $16.49 $17.36 $18.31 $18.85
Toddler Full-time $18.25 $16.21 $17.13 $18.02 $18.93 $19.92 $20.48
Part-time $16.57 $14.62 $15.49 $16.33 $17.20 $18.14 $18.68
Preschool Full-time $17.72 $15.71 $16.61 $17.49 $18.39 $19.36 $19.91
Part-time $13.71 $11.92 $12.71 $13.48 $14.27 $15.13 $15.61
School age Full-time $16.28 $14.34 $15.20 $16.04 $16.90 $17.84 $18.37
Part-time $13.20 $11.44 $12.22 $12.97 $13.74 $14.59 $15.07

35
LWDA 13 Heart of Texas
Mea
n
30
th p
erce
nti
le
40
th p
erce
nti
le
Med
ian
60
th p
erce
nti
le
70
th p
erce
nti
le
75
th p
erce
nti
le
Licensed Child Care Centers (rates from 67 of 121 facilities in area)
Infant Full-time $23.26 $20.08 $21.47 $22.82 $24.22 $25.75 $26.61
Part-time $19.48 $16.54 $17.80 $19.04 $20.32 $21.72 $22.51
Toddler Full-time $21.61 $18.53 $19.86 $21.17 $22.52 $23.99 $24.82
Part-time $18.24 $15.39 $16.61 $17.81 $19.04 $20.40 $21.17
Preschool Full-time $20.52 $17.52 $18.82 $20.09 $21.40 $22.83 $23.65
Part-time $14.31 $11.76 $12.83 $13.88 $14.97 $16.18 $16.87
School age Full-time $19.73 $16.78 $18.05 $19.29 $20.58 $21.99 $22.79
Part-time $13.60 $11.10 $12.14 $13.16 $14.23 $15.40 $16.08
Licensed Child Care Homes (rates from 6 of 29 facilities in area)
Infant Full-time $19.72 $16.77 $18.04 $19.29 $20.57 $21.98 $22.78
Part-time $14.73 $12.14 $13.23 $14.30 $15.41 $16.63 $17.33
Toddler Full-time $18.99 $16.09 $17.34 $18.56 $19.82 $21.20 $21.99
Part-time $18.29 $15.43 $16.66 $17.85 $19.09 $20.45 $21.22
Preschool Full-time $18.01 $15.18 $16.39 $17.57 $18.80 $20.15 $20.92
Part-time $13.46 $10.97 $12.01 $13.02 $14.08 $15.25 $15.92
School age Full-time $16.05 $13.35 $14.49 $15.61 $16.77 $18.04 $18.77
Part-time $12.33 $9.94 $10.92 $11.89 $12.91 $14.03 $14.67
Registered Child Care Homes (rates from 12 of 33 facilities in area)
Infant Full-time $19.84 $16.88 $18.16 $19.41 $20.70 $22.11 $22.91
Part-time $16.53 $13.80 $14.96 $16.09 $17.27 $18.56 $19.30
Toddler Full-time $18.60 $15.72 $16.95 $18.16 $19.41 $20.77 $21.55
Part-time $16.32 $13.60 $14.75 $15.88 $17.05 $18.33 $19.07
Preschool Full-time $17.88 $15.05 $16.26 $17.44 $18.67 $20.01 $20.77
Part-time $12.56 $10.14 $11.14 $12.12 $13.15 $14.27 $14.92
School age Full-time $15.93 $13.24 $14.38 $15.49 $16.65 $17.91 $18.64
Part-time $11.91 $9.55 $10.52 $11.47 $12.47 $13.57 $14.20
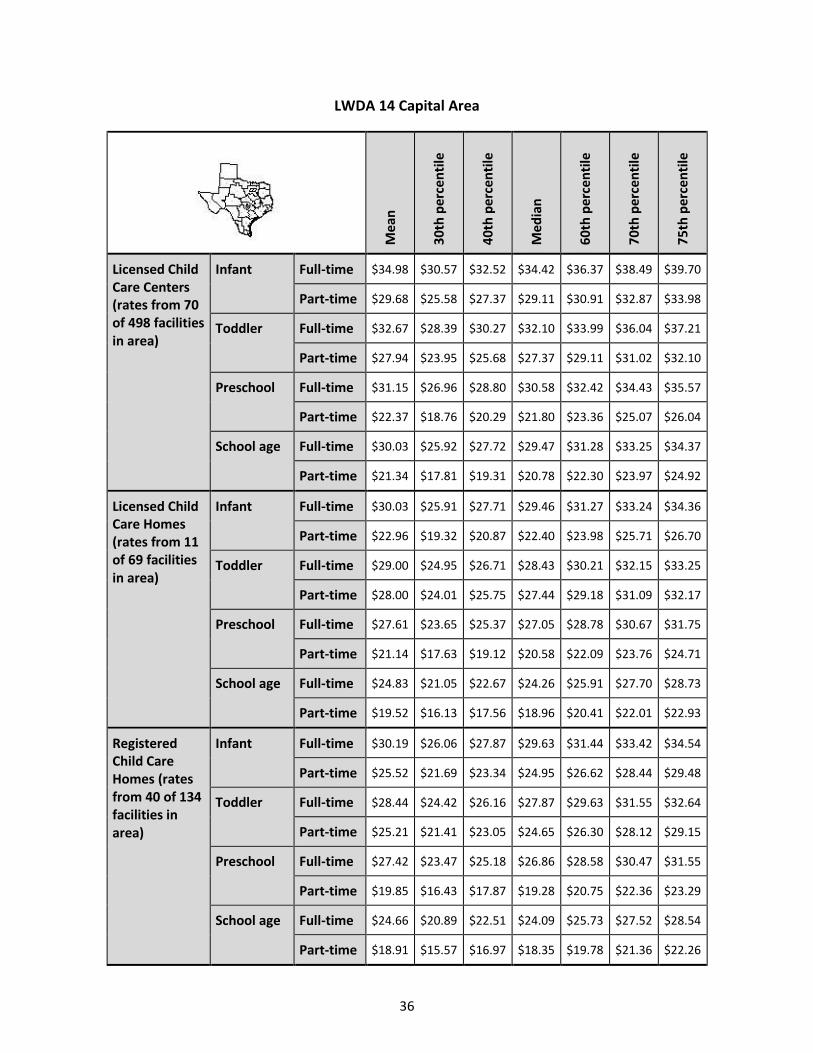
36
LWDA 14 Capital Area
Mea
n
30
th p
erce
nti
le
40
th p
erce
nti
le
Med
ian
60
th p
erce
nti
le
70
th p
erce
nti
le
75
th p
erce
nti
le
Licensed Child Care Centers (rates from 70 of 498 facilities in area)
Infant Full-time $34.98 $30.57 $32.52 $34.42 $36.37 $38.49 $39.70
Part-time $29.68 $25.58 $27.37 $29.11 $30.91 $32.87 $33.98
Toddler Full-time $32.67 $28.39 $30.27 $32.10 $33.99 $36.04 $37.21
Part-time $27.94 $23.95 $25.68 $27.37 $29.11 $31.02 $32.10
Preschool Full-time $31.15 $26.96 $28.80 $30.58 $32.42 $34.43 $35.57
Part-time $22.37 $18.76 $20.29 $21.80 $23.36 $25.07 $26.04
School age Full-time $30.03 $25.92 $27.72 $29.47 $31.28 $33.25 $34.37
Part-time $21.34 $17.81 $19.31 $20.78 $22.30 $23.97 $24.92
Licensed Child Care Homes (rates from 11 of 69 facilities in area)
Infant Full-time $30.03 $25.91 $27.71 $29.46 $31.27 $33.24 $34.36
Part-time $22.96 $19.32 $20.87 $22.40 $23.98 $25.71 $26.70
Toddler Full-time $29.00 $24.95 $26.71 $28.43 $30.21 $32.15 $33.25
Part-time $28.00 $24.01 $25.75 $27.44 $29.18 $31.09 $32.17
Preschool Full-time $27.61 $23.65 $25.37 $27.05 $28.78 $30.67 $31.75
Part-time $21.14 $17.63 $19.12 $20.58 $22.09 $23.76 $24.71
School age Full-time $24.83 $21.05 $22.67 $24.26 $25.91 $27.70 $28.73
Part-time $19.52 $16.13 $17.56 $18.96 $20.41 $22.01 $22.93
Registered Child Care Homes (rates from 40 of 134 facilities in area)
Infant Full-time $30.19 $26.06 $27.87 $29.63 $31.44 $33.42 $34.54
Part-time $25.52 $21.69 $23.34 $24.95 $26.62 $28.44 $29.48
Toddler Full-time $28.44 $24.42 $26.16 $27.87 $29.63 $31.55 $32.64
Part-time $25.21 $21.41 $23.05 $24.65 $26.30 $28.12 $29.15
Preschool Full-time $27.42 $23.47 $25.18 $26.86 $28.58 $30.47 $31.55
Part-time $19.85 $16.43 $17.87 $19.28 $20.75 $22.36 $23.29
School age Full-time $24.66 $20.89 $22.51 $24.09 $25.73 $27.52 $28.54
Part-time $18.91 $15.57 $16.97 $18.35 $19.78 $21.36 $22.26

37
LWDA 15 Rural Capital
Mea
n
30
th p
erce
nti
le
40
th p
erce
nti
le
Med
ian
60
th p
erce
nti
le
70
th p
erce
nti
le
75
th p
erce
nti
le
Licensed Child Care Centers (rates from 78 of 384 facilities in area)
Infant Full-time $33.36 $28.78 $30.78 $32.73 $34.74 $36.94 $38.19
Part-time $27.92 $23.69 $25.51 $27.29 $29.13 $31.14 $32.29
Toddler Full-time $30.98 $26.55 $28.47 $30.35 $32.29 $34.41 $35.61
Part-time $26.14 $22.04 $23.79 $25.51 $27.29 $29.24 $30.35
Preschool Full-time $29.42 $25.09 $26.96 $28.79 $30.68 $32.75 $33.92
Part-time $20.49 $16.81 $18.35 $19.86 $21.44 $23.17 $24.16
School age Full-time $28.28 $24.03 $25.86 $27.65 $29.51 $31.53 $32.68
Part-time $19.46 $15.87 $17.36 $18.83 $20.37 $22.06 $23.02
Licensed Child Care Homes (rates from 8 of 77 facilities in area)
Infant Full-time $28.28 $24.02 $25.85 $27.65 $29.50 $31.52 $32.68
Part-time $21.10 $17.37 $18.93 $20.47 $22.06 $23.82 $24.82
Toddler Full-time $27.22 $23.04 $24.84 $26.59 $28.41 $30.40 $31.53
Part-time $26.21 $22.10 $23.86 $25.58 $27.36 $29.31 $30.43
Preschool Full-time $25.81 $21.73 $23.47 $25.18 $26.95 $28.89 $29.99
Part-time $19.27 $15.68 $17.17 $18.64 $20.16 $21.84 $22.80
School age Full-time $22.98 $19.11 $20.75 $22.35 $24.02 $25.85 $26.90
Part-time $17.64 $14.20 $15.61 $17.01 $18.47 $20.08 $21.00
Registered Child Care Homes (rates from 32 of 121 facilities in area)
Infant Full-time $28.44 $24.18 $26.02 $27.81 $29.67 $31.70 $32.86
Part-time $23.68 $19.75 $21.42 $23.05 $24.74 $26.60 $27.66
Toddler Full-time $26.65 $22.51 $24.28 $26.02 $27.82 $29.78 $30.91
Part-time $23.37 $19.47 $21.12 $22.74 $24.42 $26.27 $27.32
Preschool Full-time $25.62 $21.55 $23.29 $24.99 $26.75 $28.68 $29.78
Part-time $17.97 $14.50 $15.93 $17.34 $18.81 $20.43 $21.36
School age Full-time $22.81 $18.95 $20.58 $22.18 $23.84 $25.67 $26.71
Part-time $17.03 $13.64 $15.03 $16.40 $17.83 $19.42 $20.32

38
LWDA 16 Brazos Valley
Mea
n
30
th p
erce
nti
le
40
th p
erce
nti
le
Med
ian
60
th p
erce
nti
le
70
th p
erce
nti
le
75
th p
erce
nti
le
Licensed Child Care Centers (rates from 64 of 94 facilities in area)
Infant Full-time $27.99 $23.94 $25.69 $27.41 $29.18 $31.12 $32.22
Part-time $23.21 $19.49 $21.07 $22.63 $24.24 $26.01 $27.02
Toddler Full-time $25.90 $21.98 $23.67 $25.32 $27.02 $28.89 $29.95
Part-time $21.66 $18.05 $19.57 $21.08 $22.63 $24.34 $25.32
Preschool Full-time $24.53 $20.71 $22.35 $23.95 $25.61 $27.42 $28.46
Part-time $16.74 $13.52 $14.85 $16.16 $17.52 $19.03 $19.89
School age Full-time $23.53 $19.78 $21.38 $22.95 $24.57 $26.35 $27.37
Part-time $15.85 $12.70 $13.99 $15.26 $16.59 $18.06 $18.90
Licensed Child Care Homes (rates from 7 of 35 facilities in area)
Infant Full-time $23.53 $19.78 $21.38 $22.94 $24.57 $26.35 $27.36
Part-time $17.26 $14.00 $15.35 $16.68 $18.07 $19.60 $20.47
Toddler Full-time $22.61 $18.92 $20.49 $22.02 $23.61 $25.36 $26.35
Part-time $21.72 $18.10 $19.63 $21.13 $22.69 $24.40 $25.38
Preschool Full-time $21.37 $17.78 $19.30 $20.79 $22.33 $24.03 $25.00
Part-time $15.68 $12.55 $13.83 $15.09 $16.41 $17.87 $18.71
School age Full-time $18.90 $15.50 $16.92 $18.32 $19.77 $21.37 $22.29
Part-time $14.27 $11.27 $12.48 $13.69 $14.95 $16.34 $17.15
Registered Child Care Homes (rates from 18 of 42 facilities in area)
Infant Full-time $23.67 $19.91 $21.52 $23.09 $24.72 $26.50 $27.52
Part-time $19.51 $16.06 $17.51 $18.93 $20.40 $22.03 $22.96
Toddler Full-time $22.10 $18.46 $20.00 $21.52 $23.09 $24.82 $25.80
Part-time $19.24 $15.81 $17.25 $18.66 $20.13 $21.74 $22.66
Preschool Full-time $21.20 $17.62 $19.13 $20.62 $22.16 $23.85 $24.82
Part-time $14.55 $11.52 $12.75 $13.97 $15.24 $16.65 $17.46
School age Full-time $18.75 $15.36 $16.78 $18.17 $19.62 $21.21 $22.12
Part-time $13.75 $10.79 $11.98 $13.16 $14.40 $15.77 $16.56

39
LWDA 17 Deep East Texas
Mea
n
30
th p
erce
nti
le
40
th p
erce
nti
le
Med
ian
60
th p
erce
nti
le
70
th p
erce
nti
le
75
th p
erce
nti
le
Licensed Child Care Centers (rates from 58 of 80 facilities in area)
Infant Full-time $21.56 $18.87 $20.06 $21.22 $22.40 $23.70 $24.43
Part-time $18.32 $15.83 $16.92 $17.98 $19.08 $20.27 $20.95
Toddler Full-time $20.15 $17.54 $18.69 $19.81 $20.95 $22.21 $22.92
Part-time $17.26 $14.83 $15.89 $16.92 $17.98 $19.14 $19.81
Preschool Full-time $19.22 $16.67 $17.79 $18.88 $20.00 $21.22 $21.92
Part-time $13.86 $11.66 $12.60 $13.52 $14.47 $15.51 $16.11
School age Full-time $18.54 $16.03 $17.13 $18.20 $19.30 $20.50 $21.19
Part-time $13.23 $11.08 $12.00 $12.89 $13.82 $14.84 $15.43
Licensed Child Care Homes (rates from 6 of 12 facilities in area)
Infant Full-time $18.54 $16.03 $17.13 $18.20 $19.30 $20.50 $21.18
Part-time $14.22 $12.00 $12.95 $13.88 $14.85 $15.91 $16.51
Toddler Full-time $17.91 $15.44 $16.52 $17.57 $18.65 $19.83 $20.50
Part-time $17.30 $14.87 $15.93 $16.96 $18.02 $19.19 $19.85
Preschool Full-time $17.06 $14.65 $15.70 $16.72 $17.78 $18.93 $19.59
Part-time $13.11 $10.97 $11.88 $12.77 $13.70 $14.71 $15.29
School age Full-time $15.36 $13.06 $14.05 $15.02 $16.03 $17.12 $17.75
Part-time $12.12 $10.05 $10.93 $11.78 $12.67 $13.65 $14.21
Registered Child Care Homes (rates from 7 of 18 facilities in area)
Infant Full-time $18.64 $16.12 $17.22 $18.30 $19.40 $20.61 $21.29
Part-time $15.78 $13.45 $14.46 $15.44 $16.46 $17.57 $18.20
Toddler Full-time $17.56 $15.12 $16.18 $17.22 $18.30 $19.47 $20.13
Part-time $15.60 $13.28 $14.28 $15.26 $16.27 $17.37 $18.00
Preschool Full-time $16.95 $14.54 $15.59 $16.61 $17.66 $18.81 $19.47
Part-time $12.32 $10.24 $11.12 $11.98 $12.88 $13.86 $14.43
School age Full-time $15.26 $12.96 $13.95 $14.92 $15.92 $17.01 $17.64
Part-time $11.75 $9.71 $10.57 $11.41 $12.29 $13.25 $13.80

40
LWDA 18 South East Texas
Mea
n
30
th p
erce
nti
le
40
th p
erce
nti
le
Med
ian
60
th p
erce
nti
le
70
th p
erce
nti
le
75
th p
erce
nti
le
Licensed Child Care Centers (rates from 61 of 109 facilities in area)
Infant Full-time $23.48 $20.54 $21.84 $23.10 $24.40 $25.81 $26.62
Part-time $19.94 $17.22 $18.41 $19.57 $20.77 $22.07 $22.82
Toddler Full-time $21.94 $19.09 $20.34 $21.56 $22.82 $24.18 $24.96
Part-time $18.79 $16.14 $17.29 $18.41 $19.57 $20.84 $21.56
Preschool Full-time $20.92 $18.14 $19.36 $20.55 $21.78 $23.11 $23.87
Part-time $15.07 $12.67 $13.70 $14.70 $15.74 $16.88 $17.53
School age Full-time $20.18 $17.45 $18.64 $19.81 $21.01 $22.33 $23.07
Part-time $14.39 $12.04 $13.04 $14.02 $15.03 $16.15 $16.78
Licensed Child Care Homes (rates from 10 of 12 facilities in area)
Infant Full-time $20.18 $17.44 $18.64 $19.81 $21.01 $22.32 $23.07
Part-time $15.47 $13.04 $14.08 $15.10 $16.15 $17.31 $17.96
Toddler Full-time $19.49 $16.80 $17.97 $19.12 $20.30 $21.59 $22.33
Part-time $18.83 $16.18 $17.33 $18.46 $19.62 $20.89 $21.61
Preschool Full-time $18.57 $15.93 $17.08 $18.20 $19.35 $20.61 $21.33
Part-time $14.26 $11.92 $12.91 $13.89 $14.90 $16.01 $16.64
School age Full-time $16.72 $14.20 $15.29 $16.34 $17.44 $18.64 $19.32
Part-time $13.18 $10.92 $11.87 $12.81 $13.78 $14.84 $15.45
Registered Child Care Homes (rates from 13 of 35 facilities in area)
Infant Full-time $20.29 $17.54 $18.74 $19.91 $21.12 $22.44 $23.19
Part-time $17.17 $14.63 $15.73 $16.80 $17.91 $19.12 $19.82
Toddler Full-time $19.12 $16.45 $17.61 $18.75 $19.92 $21.19 $21.92
Part-time $16.97 $14.44 $15.53 $16.60 $17.70 $18.91 $19.60
Preschool Full-time $18.44 $15.82 $16.96 $18.07 $19.22 $20.48 $21.19
Part-time $13.40 $11.12 $12.08 $13.02 $14.00 $15.08 $15.69
School age Full-time $16.60 $14.10 $15.18 $16.23 $17.32 $18.51 $19.20
Part-time $12.77 $10.54 $11.48 $12.40 $13.36 $14.41 $15.01

41
LWDA 19 Golden Crescent
Mea
n
30
th p
erce
nti
le
40
th p
erce
nti
le
Med
ian
60
th p
erce
nti
le
70
th p
erce
nti
le
75
th p
erce
nti
le
Licensed Child Care Centers (rates from 47 of 58 facilities in area)
Infant Full-time $22.59 $20.22 $21.29 $22.33 $23.39 $24.54 $25.20
Part-time $19.67 $17.45 $18.44 $19.41 $20.40 $21.48 $22.09
Toddler Full-time $21.32 $19.01 $20.05 $21.06 $22.09 $23.21 $23.85
Part-time $18.70 $16.53 $17.50 $18.44 $19.41 $20.46 $21.06
Preschool Full-time $20.48 $18.22 $19.24 $20.22 $21.24 $22.33 $22.96
Part-time $15.57 $13.57 $14.46 $15.31 $16.20 $17.16 $17.70
School age Full-time $19.87 $17.63 $18.64 $19.61 $20.61 $21.69 $22.30
Part-time $14.99 $13.03 $13.89 $14.73 $15.60 $16.54 $17.08
Licensed Child Care Homes (rates from 5 of 38 facilities in area)
Infant Full-time $19.86 $17.63 $18.63 $19.60 $20.60 $21.68 $22.30
Part-time $15.91 $13.89 $14.79 $15.65 $16.54 $17.52 $18.07
Toddler Full-time $19.29 $17.09 $18.08 $19.03 $20.02 $21.08 $21.69
Part-time $18.74 $16.56 $17.54 $18.48 $19.45 $20.50 $21.10
Preschool Full-time $18.52 $16.36 $17.33 $18.26 $19.23 $20.27 $20.87
Part-time $14.88 $12.92 $13.78 $14.62 $15.48 $16.42 $16.96
School age Full-time $16.97 $14.89 $15.81 $16.71 $17.63 $18.63 $19.20
Part-time $13.95 $12.05 $12.88 $13.69 $14.52 $15.43 $15.95
Registered Child Care Homes (rates from 7 of 21 facilities in area)
Infant Full-time $19.95 $17.72 $18.72 $19.69 $20.69 $21.78 $22.39
Part-time $17.35 $15.25 $16.18 $17.09 $18.02 $19.04 $19.61
Toddler Full-time $18.98 $16.79 $17.77 $18.72 $19.70 $20.76 $21.36
Part-time $17.18 $15.09 $16.02 $16.92 $17.85 $18.86 $19.43
Preschool Full-time $18.42 $16.26 $17.22 $18.16 $19.12 $20.16 $20.75
Part-time $14.14 $12.22 $13.06 $13.88 $14.72 $15.63 $16.16
School age Full-time $16.87 $14.80 $15.72 $16.61 $17.53 $18.53 $19.10
Part-time $13.60 $11.72 $12.54 $13.34 $14.16 $15.06 $15.57

42
LWDA 20 Alamo
Mea
n
30
th p
erce
nti
le
40
th p
erce
nti
le
Med
ian
60
th p
erce
nti
le
70
th p
erce
nti
le
75
th p
erce
nti
le
Licensed Child Care Centers (rates from 83 of 623 facilities in area)
Infant Full-time $30.93 $27.17 $28.84 $30.46 $32.13 $33.94 $34.97
Part-time $26.39 $22.89 $24.42 $25.92 $27.46 $29.14 $30.09
Toddler Full-time $28.95 $25.30 $26.91 $28.48 $30.09 $31.85 $32.85
Part-time $24.89 $21.49 $22.98 $24.43 $25.92 $27.55 $28.48
Preschool Full-time $27.65 $24.08 $25.65 $27.18 $28.76 $30.47 $31.45
Part-time $20.10 $17.01 $18.34 $19.64 $20.98 $22.45 $23.29
School age Full-time $26.69 $23.18 $24.72 $26.23 $27.77 $29.46 $30.42
Part-time $19.22 $16.19 $17.49 $18.75 $20.07 $21.51 $22.33
Licensed Child Care Homes (rates from 8 of 74 facilities in area)
Infant Full-time $26.69 $23.17 $24.72 $26.22 $27.77 $29.46 $30.41
Part-time $20.62 $17.49 $18.84 $20.15 $21.51 $23.00 $23.85
Toddler Full-time $25.80 $22.34 $23.86 $25.34 $26.86 $28.52 $29.46
Part-time $24.95 $21.54 $23.03 $24.48 $25.98 $27.61 $28.54
Preschool Full-time $24.61 $21.23 $22.71 $24.15 $25.63 $27.26 $28.18
Part-time $19.05 $16.03 $17.32 $18.58 $19.89 $21.32 $22.14
School age Full-time $22.22 $18.99 $20.39 $21.76 $23.17 $24.71 $25.59
Part-time $17.65 $14.73 $15.97 $17.18 $18.44 $19.82 $20.61
Registered Child Care Homes (rates from 44 of 393 facilities in area)
Infant Full-time $26.83 $23.31 $24.85 $26.36 $27.91 $29.60 $30.57
Part-time $22.82 $19.54 $20.96 $22.35 $23.78 $25.34 $26.23
Toddler Full-time $25.32 $21.89 $23.39 $24.86 $26.36 $28.01 $28.94
Part-time $22.55 $19.30 $20.71 $22.09 $23.51 $25.07 $25.95
Preschool Full-time $24.45 $21.08 $22.55 $23.99 $25.47 $27.09 $28.00
Part-time $17.93 $15.00 $16.24 $17.47 $18.73 $20.12 $20.92
School age Full-time $22.08 $18.85 $20.25 $21.61 $23.02 $24.56 $25.43
Part-time $17.12 $14.25 $15.46 $16.66 $17.89 $19.25 $20.03

43
LWDA 21 South Texas
Mea
n
30
th p
erce
nti
le
40
th p
erce
nti
le
Med
ian
60
th p
erce
nti
le
70
th p
erce
nti
le
75
th p
erce
nti
le
Licensed Child Care Centers (rates from 49 of 80 facilities in area)
Infant Full-time $23.80 $20.55 $21.97 $23.36 $24.78 $26.34 $27.23
Part-time $19.94 $16.94 $18.23 $19.49 $20.80 $22.23 $23.04
Toddler Full-time $22.11 $18.97 $20.33 $21.67 $23.04 $24.55 $25.40
Part-time $18.68 $15.76 $17.01 $18.23 $19.49 $20.88 $21.67
Preschool Full-time $21.01 $17.93 $19.26 $20.56 $21.90 $23.37 $24.20
Part-time $14.66 $12.05 $13.14 $14.22 $15.33 $16.57 $17.27
School age Full-time $20.20 $17.18 $18.48 $19.75 $21.07 $22.50 $23.32
Part-time $13.93 $11.37 $12.44 $13.48 $14.57 $15.77 $16.46
Licensed Child Care Homes (rates from 8 of 35 facilities in area)
Infant Full-time $20.19 $17.17 $18.47 $19.75 $21.06 $22.50 $23.32
Part-time $15.09 $12.44 $13.55 $14.64 $15.78 $17.03 $17.74
Toddler Full-time $19.44 $16.48 $17.75 $19.00 $20.29 $21.70 $22.51
Part-time $18.72 $15.81 $17.05 $18.28 $19.54 $20.93 $21.72
Preschool Full-time $18.44 $15.54 $16.78 $17.99 $19.25 $20.63 $21.41
Part-time $13.79 $11.24 $12.30 $13.34 $14.43 $15.62 $16.31
School age Full-time $16.43 $13.68 $14.84 $15.99 $17.17 $18.47 $19.21
Part-time $12.63 $10.19 $11.19 $12.19 $13.23 $14.37 $15.03
Registered Child Care Homes (rates from 9 of 25 facilities in area)
Infant Full-time $20.31 $17.28 $18.59 $19.87 $21.18 $22.63 $23.45
Part-time $16.93 $14.14 $15.32 $16.48 $17.68 $19.00 $19.76
Toddler Full-time $19.04 $16.10 $17.36 $18.59 $19.87 $21.26 $22.06
Part-time $16.71 $13.94 $15.11 $16.26 $17.46 $18.77 $19.52
Preschool Full-time $18.30 $15.42 $16.65 $17.86 $19.11 $20.48 $21.26
Part-time $12.86 $10.40 $11.42 $12.42 $13.47 $14.62 $15.28
School age Full-time $16.31 $13.57 $14.73 $15.86 $17.04 $18.34 $19.08
Part-time $12.20 $9.79 $10.78 $11.75 $12.77 $13.90 $14.54

44
LWDA 22 Coastal Bend
Mea
n
30
th p
erce
nti
le
40
th p
erce
nti
le
Med
ian
60
th p
erce
nti
le
70
th p
erce
nti
le
75
th p
erce
nti
le
Licensed Child Care Centers (rates from 65 of 177 facilities in area)
Infant Full-time $26.56 $22.03 $23.94 $25.81 $27.76 $29.90 $31.12
Part-time $21.36 $17.25 $18.94 $20.61 $22.36 $24.28 $25.38
Toddler Full-time $24.27 $19.92 $21.74 $23.53 $25.39 $27.43 $28.60
Part-time $19.69 $15.72 $17.34 $18.95 $20.62 $22.47 $23.53
Preschool Full-time $22.78 $18.56 $20.31 $22.04 $23.84 $25.83 $26.96
Part-time $14.49 $11.02 $12.39 $13.74 $15.17 $16.77 $17.68
School age Full-time $21.70 $17.57 $19.27 $20.96 $22.72 $24.66 $25.77
Part-time $13.56 $10.20 $11.51 $12.82 $14.20 $15.74 $16.63
Licensed Child Care Homes (rates from 9 of 43 facilities in area)
Infant Full-time $21.70 $17.56 $19.27 $20.95 $22.71 $24.65 $25.76
Part-time $15.03 $11.51 $12.90 $14.29 $15.75 $17.37 $18.30
Toddler Full-time $20.70 $16.65 $18.32 $19.96 $21.68 $23.57 $24.66
Part-time $19.75 $15.78 $17.40 $19.01 $20.68 $22.53 $23.60
Preschool Full-time $19.38 $15.44 $17.05 $18.64 $20.29 $22.13 $23.18
Part-time $13.38 $10.04 $11.34 $12.64 $14.01 $15.54 $16.43
School age Full-time $16.76 $13.07 $14.54 $16.01 $17.56 $19.26 $20.25
Part-time $11.94 $8.76 $9.98 $11.20 $12.49 $13.94 $14.78
Registered Child Care Homes (rates from 22 of 56 facilities in area)
Infant Full-time $21.86 $17.70 $19.42 $21.11 $22.88 $24.82 $25.93
Part-time $17.40 $13.65 $15.16 $16.66 $18.23 $19.97 $20.97
Toddler Full-time $20.17 $16.16 $17.80 $19.42 $21.11 $22.98 $24.06
Part-time $17.12 $13.39 $14.89 $16.37 $17.93 $19.66 $20.65
Preschool Full-time $19.20 $15.28 $16.88 $18.46 $20.11 $21.93 $22.98
Part-time $12.23 $9.01 $10.25 $11.49 $12.80 $14.26 $15.11
School age Full-time $16.60 $12.92 $14.39 $15.86 $17.39 $19.09 $20.07
Part-time $11.41 $8.28 $9.47 $10.66 $11.93 $13.34 $14.16

45
LWDA 23 Lower Rio Grande Valley
Mea
n
30
th p
erce
nti
le
40
th p
erce
nti
le
Med
ian
60
th p
erce
nti
le
70
th p
erce
nti
le
75
th p
erce
nti
le
Licensed Child Care Centers (rates from 61 of 364 facilities in area)
Infant Full-time $21.20 $17.62 $19.13 $20.61 $22.16 $23.85 $24.82
Part-time $17.08 $13.83 $15.17 $16.50 $17.88 $19.40 $20.27
Toddler Full-time $19.39 $15.94 $17.39 $18.80 $20.28 $21.90 $22.83
Part-time $15.76 $12.62 $13.90 $15.17 $16.50 $17.96 $18.80
Preschool Full-time $18.21 $14.86 $16.25 $17.63 $19.05 $20.63 $21.53
Part-time $11.63 $8.88 $9.96 $11.04 $12.18 $13.44 $14.17
School age Full-time $17.35 $14.08 $15.43 $16.77 $18.16 $19.70 $20.58
Part-time $10.89 $8.22 $9.26 $10.31 $11.41 $12.63 $13.34
Licensed Child Care Homes (rates from 12 of 86 facilities in area)
Infant Full-time $17.35 $14.07 $15.43 $16.76 $18.16 $19.69 $20.57
Part-time $12.06 $9.27 $10.37 $11.48 $12.63 $13.92 $14.66
Toddler Full-time $16.56 $13.35 $14.67 $15.98 $17.34 $18.84 $19.70
Part-time $15.81 $12.66 $13.95 $15.22 $16.55 $18.02 $18.86
Preschool Full-time $15.51 $12.39 $13.66 $14.93 $16.24 $17.70 $18.53
Part-time $10.75 $8.09 $9.13 $10.17 $11.26 $12.47 $13.17
School age Full-time $13.43 $10.50 $11.68 $12.85 $14.07 $15.42 $16.20
Part-time $9.60 $7.07 $8.04 $9.02 $10.05 $11.20 $11.86
Registered Child Care Homes (rates from 29 of 95 facilities in area)
Infant Full-time $17.47 $14.19 $15.55 $16.89 $18.29 $19.83 $20.71
Part-time $13.94 $10.96 $12.16 $13.35 $14.60 $15.98 $16.78
Toddler Full-time $16.13 $12.96 $14.26 $15.55 $16.89 $18.37 $19.22
Part-time $13.71 $10.76 $11.95 $13.13 $14.37 $15.74 $16.52
Preschool Full-time $15.37 $12.26 $13.53 $14.78 $16.09 $17.54 $18.37
Part-time $9.83 $7.28 $8.26 $9.25 $10.29 $11.45 $12.13
School age Full-time $13.30 $10.39 $11.56 $12.72 $13.94 $15.29 $16.06
Part-time $9.18 $6.70 $7.64 $8.59 $9.60 $10.72 $11.37

46
LWDA 24 Cameron County
Mea
n
30
th p
erce
nti
le
40
th p
erce
nti
le
Med
ian
60
th p
erce
nti
le
70
th p
erce
nti
le
75
th p
erce
nti
le
Licensed Child Care Centers (rates from 56 of 158 facilities in area)
Infant Full-time $22.12 $18.71 $20.17 $21.61 $23.09 $24.71 $25.64
Part-time $18.14 $15.02 $16.33 $17.62 $18.96 $20.44 $21.28
Toddler Full-time $20.38 $17.09 $18.49 $19.86 $21.28 $22.84 $23.73
Part-time $16.85 $13.83 $15.09 $16.33 $17.63 $19.05 $19.86
Preschool Full-time $19.24 $16.03 $17.39 $18.72 $20.10 $21.62 $22.48
Part-time $12.79 $10.12 $11.20 $12.28 $13.40 $14.64 $15.36
School age Full-time $18.41 $15.26 $16.59 $17.89 $19.24 $20.72 $21.57
Part-time $12.06 $9.46 $10.50 $11.55 $12.64 $13.84 $14.54
Licensed Child Care Homes (rates from 8 of 21 facilities in area)
Infant Full-time $18.40 $15.26 $16.58 $17.88 $19.23 $20.72 $21.56
Part-time $13.22 $10.51 $11.61 $12.71 $13.85 $15.11 $15.84
Toddler Full-time $17.64 $14.55 $15.85 $17.12 $18.44 $19.89 $20.72
Part-time $16.90 $13.87 $15.14 $16.38 $17.68 $19.10 $19.91
Preschool Full-time $16.61 $13.61 $14.86 $16.09 $17.38 $18.79 $19.59
Part-time $11.92 $9.33 $10.37 $11.40 $12.49 $13.69 $14.38
School age Full-time $14.57 $11.74 $12.91 $14.06 $15.26 $16.58 $17.34
Part-time $10.77 $8.30 $9.28 $10.26 $11.29 $12.43 $13.09
Registered Child Care Homes (rates from 10 of 22 facilities in area)
Infant Full-time $18.52 $15.37 $16.70 $18.01 $19.36 $20.85 $21.70
Part-time $15.07 $12.20 $13.38 $14.56 $15.78 $17.12 $17.89
Toddler Full-time $17.22 $14.17 $15.45 $16.70 $18.01 $19.44 $20.27
Part-time $14.85 $12.00 $13.17 $14.34 $15.55 $16.88 $17.65
Preschool Full-time $16.47 $13.48 $14.73 $15.95 $17.23 $18.64 $19.44
Part-time $11.00 $8.50 $9.50 $10.49 $11.53 $12.68 $13.35
School age Full-time $14.45 $11.63 $12.79 $13.93 $15.13 $16.45 $17.20
Part-time $10.35 $7.91 $8.87 $9.83 $10.84 $11.96 $12.60

47
LWDA 25 Texoma
Mea
n
30
th p
erce
nti
le
40
th p
erce
nti
le
Med
ian
60
th p
erce
nti
le
70
th p
erce
nti
le
75
th p
erce
nti
le
Licensed Child Care Centers (rates from 36 of 48 facilities in area)
Infant Full-time $24.78 $21.81 $23.13 $24.42 $25.74 $27.17 $27.99
Part-time $21.18 $18.41 $19.63 $20.82 $22.04 $23.37 $24.12
Toddler Full-time $23.21 $20.33 $21.61 $22.85 $24.13 $25.52 $26.31
Part-time $20.00 $17.30 $18.48 $19.63 $20.82 $22.11 $22.85
Preschool Full-time $22.18 $19.35 $20.60 $21.82 $23.07 $24.43 $25.20
Part-time $16.20 $13.74 $14.80 $15.83 $16.90 $18.06 $18.73
School age Full-time $21.43 $18.64 $19.87 $21.06 $22.29 $23.63 $24.39
Part-time $15.49 $13.09 $14.12 $15.13 $16.17 $17.31 $17.97
Licensed Child Care Homes (rates from 6 of 15 facilities in area)
Infant Full-time $21.42 $18.64 $19.86 $21.06 $22.28 $23.62 $24.38
Part-time $16.60 $14.12 $15.19 $16.24 $17.32 $18.50 $19.17
Toddler Full-time $20.72 $17.98 $19.18 $20.36 $21.56 $22.88 $23.63
Part-time $20.04 $17.34 $18.53 $19.68 $20.87 $22.16 $22.90
Preschool Full-time $19.78 $17.09 $18.27 $19.41 $20.59 $21.88 $22.61
Part-time $15.36 $12.96 $13.99 $14.99 $16.03 $17.17 $17.82
School age Full-time $17.88 $15.32 $16.43 $17.51 $18.64 $19.86 $20.56
Part-time $14.25 $11.93 $12.91 $13.88 $14.88 $15.98 $16.60
Registered Child Care Homes (rates from 12 of 29 facilities in area)
Infant Full-time $21.53 $18.74 $19.97 $21.17 $22.40 $23.74 $24.50
Part-time $18.35 $15.76 $16.88 $17.98 $19.12 $20.36 $21.07
Toddler Full-time $20.34 $17.62 $18.81 $19.97 $21.17 $22.47 $23.21
Part-time $18.14 $15.56 $16.68 $17.78 $18.91 $20.14 $20.84
Preschool Full-time $19.65 $16.97 $18.14 $19.28 $20.46 $21.74 $22.47
Part-time $14.47 $12.14 $13.13 $14.10 $15.11 $16.22 $16.85
School age Full-time $17.76 $15.21 $16.32 $17.40 $18.52 $19.74 $20.43
Part-time $13.83 $11.54 $12.51 $13.46 $14.44 $15.53 $16.14

48
LWDA 26 Central Texas
Mea
n
30
th p
erce
nti
le
40
th p
erce
nti
le
Med
ian
60
th p
erce
nti
le
70
th p
erce
nti
le
75
th p
erce
nti
le
Licensed Child Care Centers (rates from 62 of 169 facilities in area)
Infant Full-time $22.75 $20.35 $21.44 $22.49 $23.56 $24.72 $25.38
Part-time $19.80 $17.56 $18.57 $19.54 $20.54 $21.63 $22.25
Toddler Full-time $21.47 $19.14 $20.19 $21.21 $22.25 $23.38 $24.02
Part-time $18.83 $16.64 $17.62 $18.57 $19.54 $20.61 $21.21
Preschool Full-time $20.63 $18.34 $19.37 $20.36 $21.38 $22.49 $23.12
Part-time $15.67 $13.65 $14.54 $15.41 $16.30 $17.27 $17.82
School age Full-time $20.00 $17.75 $18.76 $19.74 $20.75 $21.84 $22.46
Part-time $15.08 $13.10 $13.97 $14.82 $15.69 $16.65 $17.19
Licensed Child Care Homes (rates from 4 of 59 facilities in area)
Infant Full-time $20.00 $17.74 $18.76 $19.74 $20.74 $21.84 $22.46
Part-time $16.01 $13.98 $14.88 $15.75 $16.65 $17.63 $18.19
Toddler Full-time $19.43 $17.20 $18.20 $19.16 $20.15 $21.23 $21.84
Part-time $18.87 $16.67 $17.65 $18.60 $19.58 $20.64 $21.25
Preschool Full-time $18.65 $16.46 $17.44 $18.38 $19.36 $20.41 $21.01
Part-time $14.97 $12.99 $13.86 $14.71 $15.58 $16.53 $17.06
School age Full-time $17.08 $14.98 $15.91 $16.81 $17.74 $18.75 $19.33
Part-time $14.03 $12.11 $12.95 $13.77 $14.61 $15.53 $16.05
Registered Child Care Homes (rates from 29 of 121 facilities in area)
Infant Full-time $20.09 $17.83 $18.85 $19.83 $20.84 $21.93 $22.55
Part-time $17.47 $15.35 $16.29 $17.20 $18.14 $19.17 $19.75
Toddler Full-time $19.11 $16.90 $17.89 $18.85 $19.83 $20.90 $21.51
Part-time $17.29 $15.18 $16.12 $17.03 $17.97 $18.98 $19.56
Preschool Full-time $18.54 $16.36 $17.33 $18.28 $19.25 $20.30 $20.90
Part-time $14.22 $12.29 $13.14 $13.96 $14.81 $15.73 $16.26
School age Full-time $16.98 $14.89 $15.82 $16.72 $17.64 $18.65 $19.23
Part-time $13.68 $11.78 $12.61 $13.41 $14.25 $15.15 $15.67

49
LWDA 27 Middle Rio Grande
Mea
n
30
th p
erce
nti
le
40
th p
erce
nti
le
Med
ian
60
th p
erce
nti
le
70
th p
erce
nti
le
75
th p
erce
nti
le
Licensed Child Care Centers (rates from 24 of 47 facilities in area)
Infant Full-time $22.18 $19.25 $20.54 $21.79 $23.08 $24.48 $25.28
Part-time $18.68 $15.98 $17.15 $18.29 $19.48 $20.77 $21.50
Toddler Full-time $20.65 $17.82 $19.06 $20.26 $21.51 $22.86 $23.63
Part-time $17.54 $14.91 $16.04 $17.15 $18.30 $19.55 $20.26
Preschool Full-time $19.65 $16.88 $18.09 $19.26 $20.47 $21.80 $22.55
Part-time $13.89 $11.52 $12.52 $13.50 $14.52 $15.64 $16.28
School age Full-time $18.92 $16.20 $17.38 $18.53 $19.72 $21.02 $21.76
Part-time $13.22 $10.91 $11.88 $12.84 $13.83 $14.92 $15.55
Licensed Child Care Homes (rates from 3 of 8 facilities in area)
Infant Full-time $18.91 $16.19 $17.37 $18.52 $19.71 $21.01 $21.75
Part-time $14.28 $11.88 $12.90 $13.89 $14.93 $16.06 $16.71
Toddler Full-time $18.24 $15.56 $16.72 $17.85 $19.02 $20.29 $21.02
Part-time $17.58 $14.95 $16.08 $17.19 $18.34 $19.59 $20.31
Preschool Full-time $17.33 $14.71 $15.84 $16.94 $18.07 $19.32 $20.03
Part-time $13.10 $10.79 $11.76 $12.71 $13.70 $14.78 $15.40
School age Full-time $15.50 $13.01 $14.07 $15.11 $16.19 $17.37 $18.04
Part-time $12.04 $9.82 $10.74 $11.65 $12.60 $13.64 $14.24
Registered Child Care Homes (rates from 4 of 10 facilities in area)
Infant Full-time $19.02 $16.29 $17.48 $18.63 $19.82 $21.13 $21.87
Part-time $15.95 $13.43 $14.51 $15.56 $16.65 $17.85 $18.53
Toddler Full-time $17.87 $15.21 $16.36 $17.48 $18.63 $19.90 $20.62
Part-time $15.75 $13.25 $14.32 $15.36 $16.45 $17.64 $18.32
Preschool Full-time $17.20 $14.59 $15.72 $16.81 $17.95 $19.19 $19.90
Part-time $12.25 $10.01 $10.95 $11.86 $12.82 $13.87 $14.47
School age Full-time $15.39 $12.91 $13.97 $15.00 $16.07 $17.25 $17.92
Part-time $11.64 $9.46 $10.36 $11.26 $12.19 $13.21 $13.80

50
LWDA 28 Gulf Coast
Mea
n
30
th p
erce
nti
le
40
th p
erce
nti
le
Med
ian
60
th p
erce
nti
le
70
th p
erce
nti
le
75
th p
erce
nti
le
Licensed Child Care Centers (rates from 156 of 2268 facilities in area)
Infant Full-time $30.73 $26.48 $28.34 $30.14 $32.01 $34.04 $35.20
Part-time $25.69 $21.77 $23.45 $25.10 $26.80 $28.67 $29.73
Toddler Full-time $28.53 $24.42 $26.20 $27.94 $29.73 $31.70 $32.81
Part-time $24.04 $20.24 $21.87 $23.46 $25.10 $26.91 $27.94
Preschool Full-time $27.08 $23.07 $24.80 $26.49 $28.24 $30.16 $31.25
Part-time $18.82 $15.41 $16.83 $18.23 $19.69 $21.29 $22.20
School age Full-time $26.03 $22.09 $23.78 $25.44 $27.15 $29.03 $30.10
Part-time $17.87 $14.54 $15.92 $17.28 $18.70 $20.26 $21.15
Licensed Child Care Homes (rates from 21 of 301 facilities in area)
Infant Full-time $26.02 $22.08 $23.77 $25.43 $27.15 $29.02 $30.09
Part-time $19.38 $15.92 $17.37 $18.79 $20.26 $21.89 $22.82
Toddler Full-time $25.05 $21.17 $22.83 $24.46 $26.14 $27.98 $29.03
Part-time $24.11 $20.30 $21.92 $23.52 $25.17 $26.97 $28.01
Preschool Full-time $23.74 $19.96 $21.57 $23.15 $24.79 $26.58 $27.60
Part-time $17.68 $14.37 $15.74 $17.09 $18.50 $20.06 $20.95
School age Full-time $21.12 $17.53 $19.05 $20.53 $22.08 $23.77 $24.74
Part-time $16.18 $12.99 $14.30 $15.59 $16.94 $18.43 $19.28
Registered Child Care Homes (rates from 71 of 1628 facilities in area)
Infant Full-time $26.18 $22.22 $23.92 $25.59 $27.31 $29.19 $30.26
Part-time $21.77 $18.13 $19.67 $21.18 $22.74 $24.46 $25.45
Toddler Full-time $24.51 $20.68 $22.32 $23.93 $25.59 $27.41 $28.45
Part-time $21.48 $17.87 $19.39 $20.89 $22.45 $24.16 $25.13
Preschool Full-time $23.56 $19.79 $21.40 $22.97 $24.60 $26.39 $27.41
Part-time $16.48 $13.27 $14.59 $15.89 $17.26 $18.76 $19.62
School age Full-time $20.96 $17.39 $18.89 $20.37 $21.91 $23.60 $24.56
Part-time $15.62 $12.48 $13.76 $15.03 $16.35 $17.82 $18.66

2.3 CHILD CARE DAILY MARKET RATES:
SUMMARY TABLES BY LWDA BY AGE GROUP


53
Table 2.3.1 Child Care Daily Market Rates: Summary Tables by LWDA by Age Group
LWDA 1 Panhandle
Mea
n
30
th p
erce
nti
le
40
th p
erce
nti
le
Med
ian
60
th p
erce
nti
le
70
th p
erce
nti
le
75
th p
erce
nti
le
Infant Full-time $22.83 $20.02 $21.27 $22.48 $23.72 $25.08 $25.85
Part-time $19.04 $16.45 $17.58 $18.68 $19.82 $21.06 $21.77
Toddler Full-time $21.70 $18.96 $20.17 $21.35 $22.56 $23.88 $24.64
Part-time $19.72 $17.09 $18.24 $19.36 $20.52 $21.78 $22.50
Preschool Full-time $20.85 $18.15 $19.34 $20.50 $21.69 $22.98 $23.72
Part-time $15.71 $13.34 $14.36 $15.36 $16.39 $17.52 $18.16
School age Full-time $19.25 $16.65 $17.79 $18.90 $20.04 $21.29 $22.00
Part-time $14.91 $12.59 $13.58 $14.56 $15.56 $16.66 $17.29
LWDA 2 South Plains
Mea
n
30
th p
erce
nti
le
40
th p
erce
nti
le
Med
ian
60
th p
erce
nti
le
70
th p
erce
nti
le
75
th p
erce
nti
le
Infant Full-time $20.29 $17.90 $18.97 $20.00 $21.07 $22.22 $22.88
Part-time $16.57 $14.39 $15.35 $16.28 $17.24 $18.29 $18.88
Toddler Full-time $19.50 $17.15 $18.20 $19.21 $20.25 $21.39 $22.03
Part-time $18.34 $16.05 $17.06 $18.05 $19.06 $20.16 $20.78
Preschool Full-time $18.73 $16.42 $17.44 $18.44 $19.46 $20.57 $21.20
Part-time $14.58 $12.52 $13.41 $14.29 $15.19 $16.17 $16.73
School age Full-time $17.22 $15.00 $15.98 $16.93 $17.91 $18.98 $19.58
Part-time $13.74 $11.74 $12.61 $13.45 $14.33 $15.28 $15.83
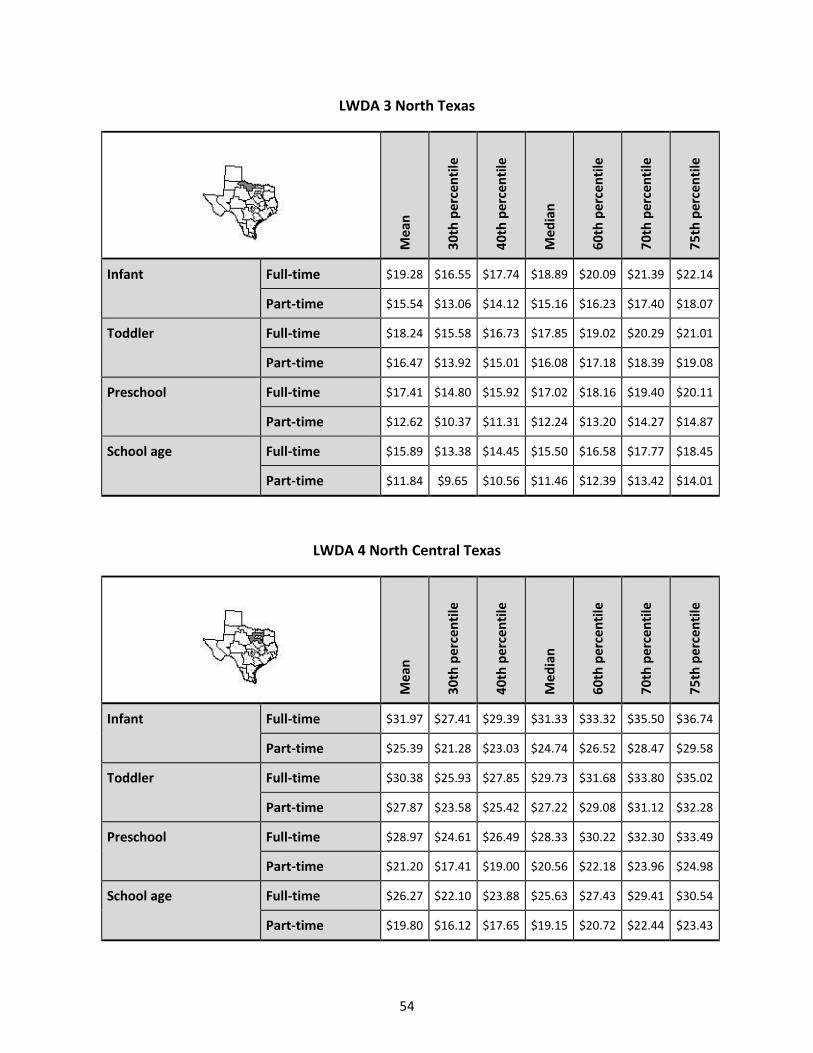
54
LWDA 3 North Texas
Mea
n
30
th p
erce
nti
le
40
th p
erce
nti
le
Med
ian
60
th p
erce
nti
le
70
th p
erce
nti
le
75
th p
erce
nti
le
Infant Full-time $19.28 $16.55 $17.74 $18.89 $20.09 $21.39 $22.14
Part-time $15.54 $13.06 $14.12 $15.16 $16.23 $17.40 $18.07
Toddler Full-time $18.24 $15.58 $16.73 $17.85 $19.02 $20.29 $21.01
Part-time $16.47 $13.92 $15.01 $16.08 $17.18 $18.39 $19.08
Preschool Full-time $17.41 $14.80 $15.92 $17.02 $18.16 $19.40 $20.11
Part-time $12.62 $10.37 $11.31 $12.24 $13.20 $14.27 $14.87
School age Full-time $15.89 $13.38 $14.45 $15.50 $16.58 $17.77 $18.45
Part-time $11.84 $9.65 $10.56 $11.46 $12.39 $13.42 $14.01
LWDA 4 North Central Texas
Mea
n
30
th p
erce
nti
le
40
th p
erce
nti
le
Med
ian
60
th p
erce
nti
le
70
th p
erce
nti
le
75
th p
erce
nti
le
Infant Full-time $31.97 $27.41 $29.39 $31.33 $33.32 $35.50 $36.74
Part-time $25.39 $21.28 $23.03 $24.74 $26.52 $28.47 $29.58
Toddler Full-time $30.38 $25.93 $27.85 $29.73 $31.68 $33.80 $35.02
Part-time $27.87 $23.58 $25.42 $27.22 $29.08 $31.12 $32.28
Preschool Full-time $28.97 $24.61 $26.49 $28.33 $30.22 $32.30 $33.49
Part-time $21.20 $17.41 $19.00 $20.56 $22.18 $23.96 $24.98
School age Full-time $26.27 $22.10 $23.88 $25.63 $27.43 $29.41 $30.54
Part-time $19.80 $16.12 $17.65 $19.15 $20.72 $22.44 $23.43

55
LWDA 5 Tarrant County
Mea
n
30
th p
erce
nti
le
40
th p
erce
nti
le
Med
ian
60
th p
erce
nti
le
70
th p
erce
nti
le
75
th p
erce
nti
le
Infant Full-time $30.66 $26.33 $28.21 $30.05 $31.95 $34.02 $35.21
Part-time $24.95 $21.00 $22.69 $24.34 $26.05 $27.93 $29.00
Toddler Full-time $28.96 $24.73 $26.56 $28.35 $30.19 $32.21 $33.36
Part-time $25.98 $21.96 $23.68 $25.37 $27.12 $29.03 $30.12
Preschool Full-time $27.68 $23.54 $25.33 $27.07 $28.88 $30.85 $31.97
Part-time $20.00 $16.42 $17.92 $19.39 $20.92 $22.61 $23.57
School age Full-time $25.21 $21.24 $22.93 $24.60 $26.32 $28.20 $29.28
Part-time $18.82 $15.34 $16.78 $18.21 $19.70 $21.33 $22.27
LWDA 6 Dallas
Mea
n
30
th p
erce
nti
le
40
th p
erce
nti
le
Med
ian
60
th p
erce
nti
le
70
th p
erce
nti
le
75
th p
erce
nti
le
Infant Full-time $26.38 $22.14 $23.94 $25.71 $27.55 $29.56 $30.71
Part-time $20.24 $16.47 $18.03 $19.57 $21.18 $22.94 $23.96
Toddler Full-time $24.97 $20.83 $22.58 $24.30 $26.09 $28.05 $29.16
Part-time $22.83 $18.85 $20.52 $22.16 $23.87 $25.74 $26.81
Preschool Full-time $23.66 $19.62 $21.33 $23.00 $24.74 $26.64 $27.73
Part-time $16.72 $13.26 $14.66 $16.05 $17.51 $19.12 $20.05
School age Full-time $21.18 $17.34 $18.94 $20.52 $22.16 $23.97 $25.00
Part-time $15.43 $12.08 $13.43 $14.76 $16.16 $17.71 $18.60

56
LWDA 7 North East Texas
Mea
n
30
th p
erce
nti
le
40
th p
erce
nti
le
Med
ian
60
th p
erce
nti
le
70
th p
erce
nti
le
75
th p
erce
nti
le
Infant Full-time $18.77 $16.35 $17.41 $18.45 $19.52 $20.69 $21.35
Part-time $15.34 $13.13 $14.09 $15.03 $15.99 $17.05 $17.65
Toddler Full-time $17.88 $15.51 $16.55 $17.56 $18.60 $19.74 $20.39
Part-time $16.41 $14.13 $15.12 $16.09 $17.09 $18.18 $18.80
Preschool Full-time $17.14 $14.81 $15.83 $16.82 $17.84 $18.96 $19.59
Part-time $12.86 $10.82 $11.69 $12.55 $13.43 $14.40 $14.95
School age Full-time $15.68 $13.45 $14.42 $15.36 $16.34 $17.41 $18.02
Part-time $12.13 $10.14 $10.98 $11.81 $12.67 $13.61 $14.15
LWDA 8 East Texas
Mea
n
30
th p
erce
nti
le
40
th p
erce
nti
le
Med
ian
60
th p
erce
nti
le
70
th p
erce
nti
le
75
th p
erce
nti
le
Infant Full-time $20.42 $17.76 $18.93 $20.07 $21.24 $22.52 $23.25
Part-time $16.61 $14.19 $15.23 $16.26 $17.31 $18.47 $19.13
Toddler Full-time $19.43 $16.83 $17.97 $19.08 $20.23 $21.47 $22.18
Part-time $17.79 $15.29 $16.38 $17.44 $18.53 $19.73 $20.41
Preschool Full-time $18.59 $16.04 $17.16 $18.24 $19.36 $20.58 $21.27
Part-time $13.89 $11.66 $12.61 $13.55 $14.51 $15.57 $16.17
School age Full-time $17.10 $14.65 $15.71 $16.75 $17.83 $19.00 $19.66
Part-time $13.08 $10.90 $11.82 $12.73 $13.66 $14.69 $15.28

57
LWDA 9 West Central Texas
Mea
n
30
th p
erce
nti
le
40
th p
erce
nti
le
Med
ian
60
th p
erce
nti
le
70
th p
erce
nti
le
75
th p
erce
nti
le
Infant Full-time $19.87 $17.00 $18.24 $19.46 $20.71 $22.08 $22.86
Part-time $15.88 $13.29 $14.39 $15.47 $16.59 $17.82 $18.52
Toddler Full-time $18.82 $16.03 $17.23 $18.41 $19.63 $20.96 $21.72
Part-time $17.10 $14.43 $15.57 $16.69 $17.86 $19.13 $19.85
Preschool Full-time $17.96 $15.22 $16.40 $17.55 $18.74 $20.04 $20.79
Part-time $13.02 $10.65 $11.64 $12.61 $13.62 $14.74 $15.38
School age Full-time $16.28 $13.66 $14.77 $15.87 $17.00 $18.24 $18.95
Part-time $12.18 $9.88 $10.83 $11.77 $12.75 $13.83 $14.45
LWDA 10 Upper Rio Grande
Me
an
30
th p
erce
nti
le
40
th p
erce
nti
le
Me
dia
n
60
th p
erce
nti
le
70
th p
erce
nti
le
75
th p
erce
nti
le
Infant Full-time $20.38 $17.39 $18.68 $19.95 $21.26 $22.68 $23.50
Part-time $15.92 $13.23 $14.37 $15.48 $16.63 $17.90 $18.62
Toddler Full-time $19.38 $16.45 $17.71 $18.94 $20.21 $21.61 $22.40
Part-time $17.83 $15.01 $16.22 $17.40 $18.62 $19.96 $20.72
Preschool Full-time $18.42 $15.55 $16.78 $17.98 $19.22 $20.58 $21.36
Part-time $13.40 $10.92 $11.95 $12.96 $14.02 $15.19 $15.85
School age Full-time $16.71 $13.97 $15.13 $16.27 $17.46 $18.75 $19.49
Part-time $12.44 $10.04 $11.03 $12.01 $13.02 $14.15 $14.79

58
LWDA 11 Permian Basin
Mea
n
30
th p
erce
nti
le
40
th p
erce
nti
le
Med
ian
60
th p
erce
nti
le
70
th p
erce
nti
le
75
th p
erce
nti
le
Infant Full-time $22.17 $19.66 $20.79 $21.88 $23.00 $24.21 $24.90
Part-time $18.64 $16.33 $17.35 $18.35 $19.38 $20.49 $21.13
Toddler Full-time $21.19 $18.73 $19.83 $20.90 $21.99 $23.18 $23.86
Part-time $19.51 $17.15 $18.20 $19.22 $20.27 $21.41 $22.06
Preschool Full-time $20.41 $18.00 $19.07 $20.12 $21.20 $22.36 $23.03
Part-time $15.80 $13.65 $14.59 $15.51 $16.45 $17.48 $18.07
School age Full-time $18.93 $16.60 $17.63 $18.64 $19.67 $20.80 $21.44
Part-time $15.04 $12.94 $13.85 $14.74 $15.67 $16.67 $17.24
LWDA 12 Concho Valley
Mea
n
30
th p
erce
nti
le
40
th p
erce
nti
le
Med
ian
60
th p
erce
nti
le
70
th p
erce
nti
le
75
th p
erce
nti
le
Infant Full-time $19.65 $17.54 $18.49 $19.41 $20.36 $21.38 $21.96
Part-time $16.54 $14.59 $15.46 $16.30 $17.17 $18.11 $18.64
Toddler Full-time $18.86 $16.79 $17.72 $18.63 $19.55 $20.56 $21.13
Part-time $17.57 $15.56 $16.46 $17.33 $18.23 $19.20 $19.75
Preschool Full-time $18.19 $16.15 $17.07 $17.95 $18.86 $19.85 $20.41
Part-time $14.34 $12.51 $13.31 $14.10 $14.91 $15.79 $16.28
School age Full-time $16.92 $14.95 $15.83 $16.68 $17.56 $18.51 $19.05
Part-time $13.65 $11.86 $12.65 $13.41 $14.20 $15.06 $15.54

59
LWDA 13 Heart of Texas
Mea
n
30
th p
erce
nti
le
40
th p
erce
nti
le
Med
ian
60
th p
erce
nti
le
70
th p
erce
nti
le
75
th p
erce
nti
le
Infant Full-time $20.42 $17.42 $18.71 $19.98 $21.29 $22.72 $23.53
Part-time $16.12 $13.43 $14.57 $15.69 $16.85 $18.13 $18.85
Toddler Full-time $19.36 $16.44 $17.70 $18.93 $20.20 $21.60 $22.39
Part-time $17.69 $14.88 $16.08 $17.25 $18.47 $19.81 $20.57
Preschool Full-time $18.44 $15.58 $16.80 $18.01 $19.25 $20.61 $21.39
Part-time $13.35 $10.87 $11.90 $12.92 $13.97 $15.14 $15.80
School age Full-time $16.69 $13.95 $15.11 $16.25 $17.43 $18.73 $19.47
Part-time $12.44 $10.04 $11.03 $12.01 $13.03 $14.15 $14.80
LWDA 14 Capital Area
Mea
n
30
th p
erce
nti
le
40
th p
erce
nti
le
Med
ian
60
th p
erce
nti
le
70
th p
erce
nti
le
75
th p
erce
nti
le
Infant Full-time $32.04 $27.80 $29.66 $31.48 $33.35 $35.38 $36.54
Part-time $26.12 $22.25 $23.92 $25.55 $27.24 $29.08 $30.13
Toddler Full-time $30.36 $26.22 $28.03 $29.80 $31.62 $33.60 $34.73
Part-time $27.43 $23.47 $25.19 $26.86 $28.59 $30.48 $31.55
Preschool Full-time $29.00 $24.94 $26.71 $28.43 $30.21 $32.15 $33.25
Part-time $21.38 $17.85 $19.35 $20.82 $22.34 $24.01 $24.97
School age Full-time $26.87 $22.95 $24.65 $26.30 $28.01 $29.88 $30.94
Part-time $20.14 $16.70 $18.15 $19.57 $21.05 $22.68 $23.60

60
LWDA 15 Rural Capital
Mea
n
30
th p
erce
nti
le
40
th p
erce
nti
le
Med
ian
60
th p
erce
nti
le
70
th p
erce
nti
le
75
th p
erce
nti
le
Infant Full-time $29.67 $25.32 $27.20 $29.04 $30.93 $33.00 $34.19
Part-time $23.42 $19.52 $21.17 $22.79 $24.48 $26.32 $27.38
Toddler Full-time $28.11 $23.87 $25.69 $27.48 $29.32 $31.34 $32.49
Part-time $25.58 $21.52 $23.25 $24.95 $26.71 $28.64 $29.74
Preschool Full-time $26.74 $22.59 $24.37 $26.11 $27.91 $29.88 $31.00
Part-time $19.32 $15.74 $17.22 $18.69 $20.22 $21.90 $22.86
School age Full-time $24.35 $20.37 $22.06 $23.72 $25.43 $27.31 $28.39
Part-time $18.00 $14.53 $15.96 $17.37 $18.85 $20.47 $21.40
LWDA 16 Brazos Valley
Mea
n
30
th p
erce
nti
le
40
th p
erce
nti
le
Med
ian
60
th p
erce
nti
le
70
th p
erce
nti
le
75
th p
erce
nti
le
Infant Full-time $24.26 $20.46 $22.09 $23.68 $25.33 $27.14 $28.17
Part-time $18.81 $15.42 $16.84 $18.23 $19.68 $21.28 $22.19
Toddler Full-time $22.97 $19.26 $20.84 $22.39 $24.00 $25.75 $26.76
Part-time $20.98 $17.42 $18.92 $20.39 $21.93 $23.61 $24.57
Preschool Full-time $21.82 $18.19 $19.73 $21.23 $22.80 $24.51 $25.49
Part-time $15.51 $12.40 $13.67 $14.93 $16.25 $17.70 $18.53
School age Full-time $19.57 $16.12 $17.56 $18.99 $20.47 $22.09 $23.02
Part-time $14.37 $11.36 $12.57 $13.78 $15.05 $16.45 $17.25

61
LWDA 17 Deep East Texas
Mea
n
30
th p
erce
nti
le
40
th p
erce
nti
le
Med
ian
60
th p
erce
nti
le
70
th p
erce
nti
le
75
th p
erce
nti
le
Infant Full-time $19.26 $16.71 $17.83 $18.92 $20.04 $21.27 $21.96
Part-time $15.81 $13.48 $14.49 $15.47 $16.49 $17.60 $18.23
Toddler Full-time $18.26 $15.77 $16.86 $17.92 $19.02 $20.21 $20.89
Part-time $16.55 $14.16 $15.20 $16.20 $17.25 $18.38 $19.03
Preschool Full-time $17.50 $15.06 $16.12 $17.16 $18.23 $19.40 $20.06
Part-time $12.94 $10.81 $11.71 $12.60 $13.52 $14.53 $15.10
School age Full-time $16.03 $13.68 $14.70 $15.69 $16.71 $17.83 $18.47
Part-time $12.21 $10.14 $11.01 $11.87 $12.77 $13.75 $14.31
LWDA 18 South East Texas
Me
an
30
th p
erce
nti
le
40
th p
erce
nti
le
Me
dia
n
60
th p
erce
nti
le
70
th p
erce
nti
le
75
th p
erc
en
tile
Infant Full-time $21.16 $18.37 $19.60 $20.79 $22.02 $23.37 $24.13
Part-time $17.61 $15.04 $16.15 $17.24 $18.36 $19.59 $20.29
Toddler Full-time $19.99 $17.26 $18.45 $19.62 $20.81 $22.12 $22.86
Part-time $17.85 $15.26 $16.38 $17.47 $18.61 $19.84 $20.55
Preschool Full-time $19.17 $16.50 $17.66 $18.80 $19.97 $21.25 $21.98
Part-time $14.04 $11.72 $12.70 $13.67 $14.67 $15.77 $16.40
School age Full-time $17.63 $15.05 $16.17 $17.25 $18.38 $19.61 $20.31
Part-time $13.31 $11.04 $12.00 $12.94 $13.91 $14.99 $15.60

62
LWDA 19 Golden Crescent
Mea
n
30
th p
erce
nti
le
40
th p
erce
nti
le
Med
ian
60
th p
erce
nti
le
70
th p
erce
nti
le
75
th p
erce
nti
le
Infant Full-time $20.16 $17.91 $18.92 $19.90 $20.91 $22.00 $22.62
Part-time $16.65 $14.59 $15.50 $16.39 $17.30 $18.29 $18.86
Toddler Full-time $19.42 $17.21 $18.20 $19.16 $20.15 $21.22 $21.82
Part-time $18.34 $16.18 $17.14 $18.08 $19.03 $20.07 $20.67
Preschool Full-time $18.70 $16.52 $17.49 $18.44 $19.40 $20.45 $21.05
Part-time $14.76 $12.81 $13.66 $14.50 $15.36 $16.30 $16.83
School age Full-time $17.23 $15.14 $16.07 $16.97 $17.90 $18.91 $19.49
Part-time $13.97 $12.06 $12.89 $13.71 $14.54 $15.45 $15.97
LWDA 20 Alamo
Mea
n
30
th p
erce
nti
le
40
th p
erce
nti
le
Med
ian
60
th p
erce
nti
le
70
th p
erce
nti
le
75
th p
erc
en
tile
Infant Full-time $27.93 $24.35 $25.93 $27.47 $29.05 $30.78 $31.76
Part-time $23.01 $19.72 $21.15 $22.54 $23.98 $25.55 $26.44
Toddler Full-time $26.52 $23.02 $24.56 $26.06 $27.60 $29.28 $30.24
Part-time $24.07 $20.72 $22.18 $23.61 $25.08 $26.68 $27.60
Preschool Full-time $25.42 $21.98 $23.48 $24.95 $26.46 $28.11 $29.05
Part-time $18.95 $15.94 $17.23 $18.48 $19.79 $21.22 $22.03
School age Full-time $23.42 $20.11 $21.55 $22.96 $24.41 $25.99 $26.89
Part-time $17.91 $14.97 $16.22 $17.44 $18.71 $20.10 $20.89

63
LWDA 21 South Texas
Mea
n
30
th p
erce
nti
le
40
th p
erce
nti
le
Med
ian
60
th p
erce
nti
le
70
th p
erce
nti
le
75
th p
erce
nti
le
Infant Full-time $20.86 $17.79 $19.12 $20.41 $21.75 $23.21 $24.04
Part-time $16.54 $13.78 $14.95 $16.09 $17.28 $18.59 $19.33
Toddler Full-time $19.77 $16.78 $18.06 $19.32 $20.62 $22.04 $22.86
Part-time $18.01 $15.15 $16.37 $17.57 $18.81 $20.17 $20.94
Preschool Full-time $18.84 $15.91 $17.17 $18.39 $19.66 $21.05 $21.85
Part-time $13.62 $11.09 $12.14 $13.18 $14.25 $15.44 $16.12
School age Full-time $17.03 $14.24 $15.42 $16.59 $17.79 $19.12 $19.87
Part-time $12.71 $10.26 $11.27 $12.26 $13.30 $14.45 $15.11
LWDA 22 Coastal Bend
Mea
n
30
th p
erce
nti
le
40
th p
erce
nti
le
Med
ian
60
th p
erce
nti
le
70
th p
erce
nti
le
75
th p
erc
en
tile
Infant Full-time $23.01 $18.76 $20.52 $22.26 $24.07 $26.07 $27.21
Part-time $17.25 $13.51 $15.01 $16.50 $18.07 $19.80 $20.80
Toddler Full-time $21.50 $17.38 $19.08 $20.76 $22.51 $24.44 $25.54
Part-time $19.05 $15.14 $16.73 $18.31 $19.95 $21.77 $22.81
Preschool Full-time $20.23 $16.22 $17.86 $19.48 $21.18 $23.05 $24.13
Part-time $13.38 $10.03 $11.33 $12.63 $14.01 $15.54 $16.42
School age Full-time $17.99 $14.18 $15.72 $17.25 $18.85 $20.61 $21.63
Part-time $12.23 $9.01 $10.25 $11.49 $12.80 $14.26 $15.11

64
LWDA 23 Lower Rio Grande Valley
Mea
n
30
th p
erce
nti
le
40
th p
erce
nti
le
Med
ian
60
th p
erce
nti
le
70
th p
erce
nti
le
75
th p
erce
nti
le
Infant Full-time $18.70 $15.31 $16.72 $18.12 $19.56 $21.16 $22.07
Part-time $14.17 $11.17 $12.38 $13.58 $14.84 $16.23 $17.03
Toddler Full-time $17.44 $14.16 $15.52 $16.86 $18.26 $19.80 $20.68
Part-time $15.32 $12.22 $13.48 $14.74 $16.04 $17.49 $18.32
Preschool Full-time $16.41 $13.21 $14.53 $15.83 $17.18 $18.68 $19.53
Part-time $10.85 $8.18 $9.23 $10.27 $11.36 $12.58 $13.29
School age Full-time $14.74 $11.69 $12.93 $14.15 $15.43 $16.85 $17.67
Part-time $9.95 $7.39 $8.38 $9.37 $10.42 $11.59 $12.27
LWDA 24 Cameron County
Mea
n
30
th p
erce
nti
le
40
th p
erce
nti
le
Med
ian
60
th p
erce
nti
le
70
th p
erc
en
tile
75
th p
erce
nti
le
Infant Full-time $19.68 $16.45 $17.82 $19.17 $20.56 $22.10 $22.97
Part-time $15.39 $12.49 $13.69 $14.88 $16.11 $17.47 $18.25
Toddler Full-time $18.43 $15.29 $16.61 $17.92 $19.27 $20.75 $21.60
Part-time $16.27 $13.29 $14.53 $15.75 $17.02 $18.42 $19.22
Preschool Full-time $17.45 $14.38 $15.67 $16.94 $18.25 $19.70 $20.52
Part-time $11.94 $9.35 $10.39 $11.42 $12.51 $13.71 $14.40
School age Full-time $15.81 $12.87 $14.09 $15.29 $16.54 $17.92 $18.71
Part-time $11.08 $8.57 $9.57 $10.56 $11.61 $12.77 $13.43
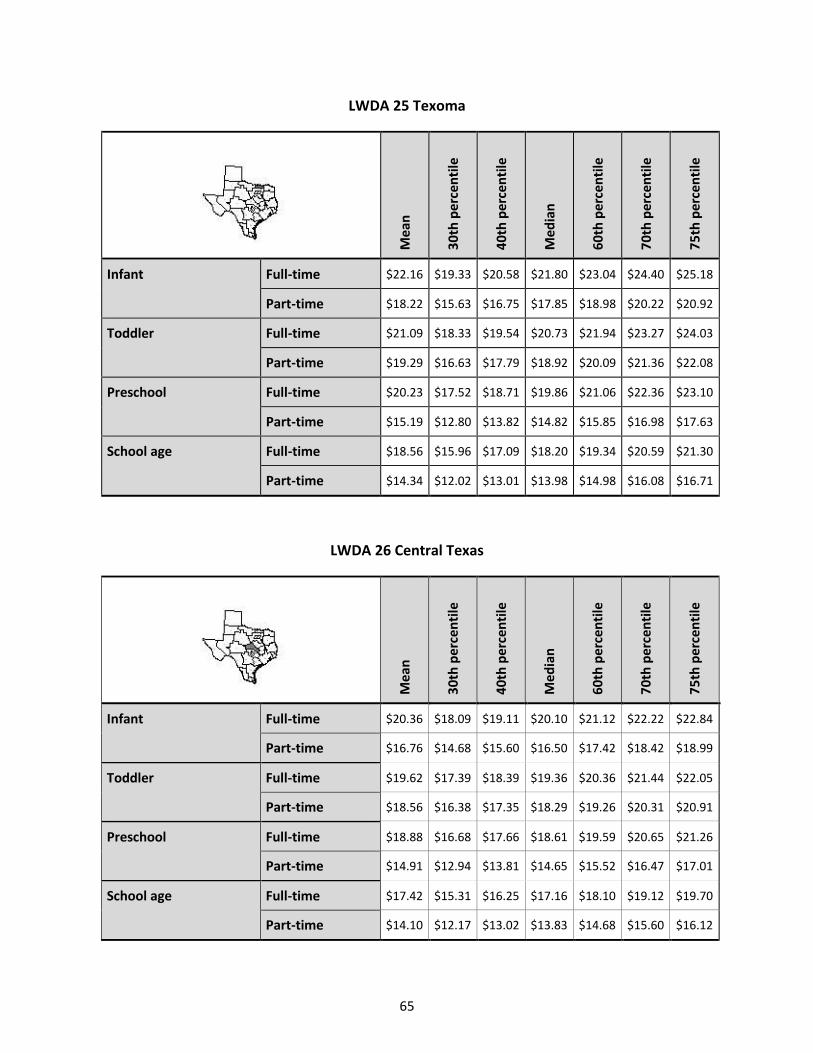
65
LWDA 25 Texoma
Mea
n
30
th p
erce
nti
le
40
th p
erce
nti
le
Med
ian
60
th p
erce
nti
le
70
th p
erce
nti
le
75
th p
erce
nti
le
Infant Full-time $22.16 $19.33 $20.58 $21.80 $23.04 $24.40 $25.18
Part-time $18.22 $15.63 $16.75 $17.85 $18.98 $20.22 $20.92
Toddler Full-time $21.09 $18.33 $19.54 $20.73 $21.94 $23.27 $24.03
Part-time $19.29 $16.63 $17.79 $18.92 $20.09 $21.36 $22.08
Preschool Full-time $20.23 $17.52 $18.71 $19.86 $21.06 $22.36 $23.10
Part-time $15.19 $12.80 $13.82 $14.82 $15.85 $16.98 $17.63
School age Full-time $18.56 $15.96 $17.09 $18.20 $19.34 $20.59 $21.30
Part-time $14.34 $12.02 $13.01 $13.98 $14.98 $16.08 $16.71
LWDA 26 Central Texas
Mea
n
30
th p
erce
nti
le
40
th p
erce
nti
le
Med
ian
60
th p
erce
nti
le
70
th p
erc
en
tile
75
th p
erce
nti
le
Infant Full-time $20.36 $18.09 $19.11 $20.10 $21.12 $22.22 $22.84
Part-time $16.76 $14.68 $15.60 $16.50 $17.42 $18.42 $18.99
Toddler Full-time $19.62 $17.39 $18.39 $19.36 $20.36 $21.44 $22.05
Part-time $18.56 $16.38 $17.35 $18.29 $19.26 $20.31 $20.91
Preschool Full-time $18.88 $16.68 $17.66 $18.61 $19.59 $20.65 $21.26
Part-time $14.91 $12.94 $13.81 $14.65 $15.52 $16.47 $17.01
School age Full-time $17.42 $15.31 $16.25 $17.16 $18.10 $19.12 $19.70
Part-time $14.10 $12.17 $13.02 $13.83 $14.68 $15.60 $16.12
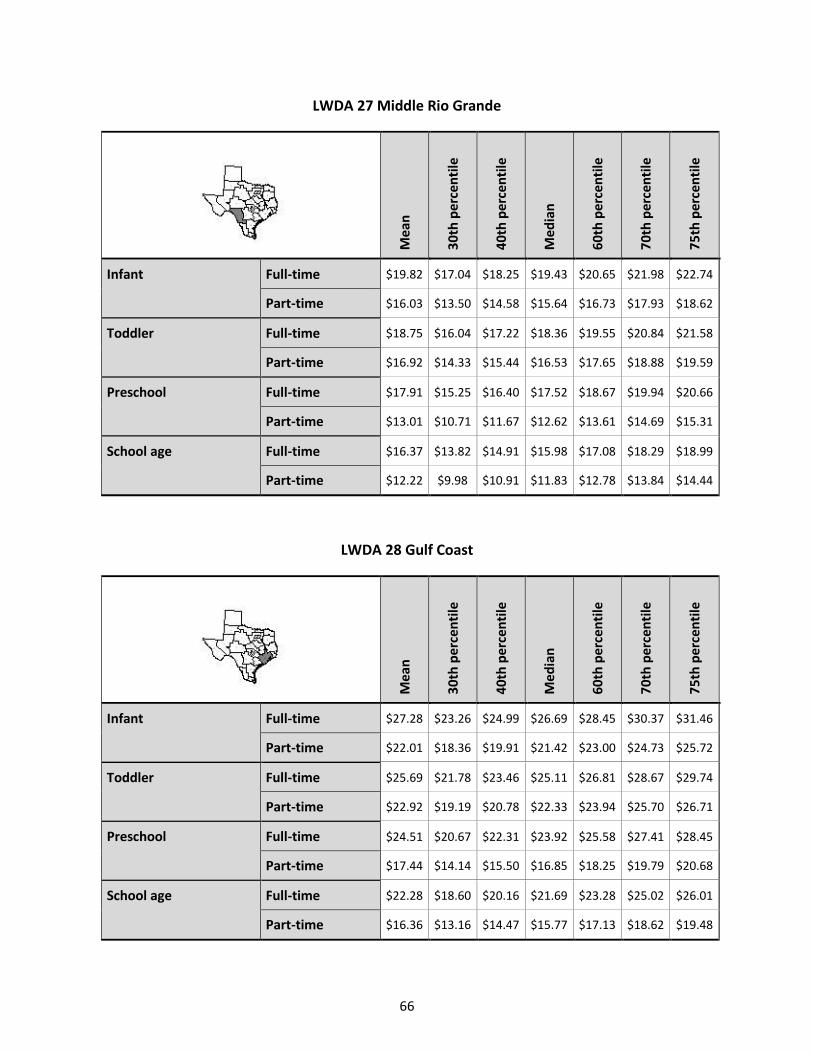
66
LWDA 27 Middle Rio Grande
Mea
n
30
th p
erce
nti
le
40
th p
erce
nti
le
Med
ian
60
th p
erce
nti
le
70
th p
erce
nti
le
75
th p
erce
nti
le
Infant Full-time $19.82 $17.04 $18.25 $19.43 $20.65 $21.98 $22.74
Part-time $16.03 $13.50 $14.58 $15.64 $16.73 $17.93 $18.62
Toddler Full-time $18.75 $16.04 $17.22 $18.36 $19.55 $20.84 $21.58
Part-time $16.92 $14.33 $15.44 $16.53 $17.65 $18.88 $19.59
Preschool Full-time $17.91 $15.25 $16.40 $17.52 $18.67 $19.94 $20.66
Part-time $13.01 $10.71 $11.67 $12.62 $13.61 $14.69 $15.31
School age Full-time $16.37 $13.82 $14.91 $15.98 $17.08 $18.29 $18.99
Part-time $12.22 $9.98 $10.91 $11.83 $12.78 $13.84 $14.44
LWDA 28 Gulf Coast
Me
an
30
th p
erce
nti
le
40
th p
erce
nti
le
Me
dia
n
60
th p
erce
nti
le
70
th p
erc
en
tile
75
th p
erce
nti
le
Infant Full-time $27.28 $23.26 $24.99 $26.69 $28.45 $30.37 $31.46
Part-time $22.01 $18.36 $19.91 $21.42 $23.00 $24.73 $25.72
Toddler Full-time $25.69 $21.78 $23.46 $25.11 $26.81 $28.67 $29.74
Part-time $22.92 $19.19 $20.78 $22.33 $23.94 $25.70 $26.71
Preschool Full-time $24.51 $20.67 $22.31 $23.92 $25.58 $27.41 $28.45
Part-time $17.44 $14.14 $15.50 $16.85 $18.25 $19.79 $20.68
School age Full-time $22.28 $18.60 $20.16 $21.69 $23.28 $25.02 $26.01
Part-time $16.36 $13.16 $14.47 $15.77 $17.13 $18.62 $19.48

2.4 CHILD CARE DAILY MARKET RATES: SUMMARY TABLES BY LWDA BY FACILITY TYPE


69
Table 2.4.1 Child Care Daily Market Rates: Summary Tables by LWDA by Facility Type
LWDA 1 Panhandle
Mea
n
30
th p
erce
nti
le
40
th p
erce
nti
le
Med
ian
60
th p
erce
nti
le
70
th p
erce
nti
le
75
th p
erce
nti
le
Licensed Child Care Centers
Full-time $23.00 $20.19 $21.44 $22.65 $23.90 $25.26 $26.03
Part-time $17.92 $15.40 $16.50 $17.57 $18.67 $19.87 $20.56
Licensed Child Care Homes
Full-time $20.16 $17.51 $18.67 $19.81 $20.98 $22.25 $22.98
Part-time $16.71 $14.28 $15.33 $16.36 $17.43 $18.59 $19.25
Registered Child Care Homes
Full-time $20.01 $17.36 $18.52 $19.66 $20.82 $22.09 $22.81
Part-time $16.06 $13.66 $14.69 $15.70 $16.75 $17.89 $18.54
LWDA 2 South Plains
Me
an
30
th p
erce
nti
le
40
th p
erce
nti
le
Me
dia
n
60
th p
erce
nti
le
70
th p
erce
nti
le
75
th p
erce
nti
le
Licensed Child Care Centers
Full-time $20.81 $18.40 $19.48 $20.53 $21.60 $22.77 $23.44
Part-time $16.42 $14.24 $15.20 $16.13 $17.08 $18.12 $18.72
Licensed Child Care Homes
Full-time $18.36 $16.07 $17.09 $18.07 $19.08 $20.18 $20.81
Part-time $15.37 $13.26 $14.18 $15.08 $16.01 $17.01 $17.59
Registered Child Care Homes
Full-time $18.23 $15.95 $16.96 $17.94 $18.95 $20.04 $20.66
Part-time $14.80 $12.73 $13.63 $14.51 $15.41 $16.41 $16.97

70
LWDA 3 North Texas
Mea
n
30
th p
erce
nti
le
40
th p
erce
nti
le
Med
ian
60
th p
erce
nti
le
70
th p
erce
nti
le
75
th p
erce
nti
le
Licensed Child Care Centers
Full-time $19.46 $16.72 $17.91 $19.07 $20.27 $21.59 $22.33
Part-time $14.62 $12.21 $13.24 $14.24 $15.28 $16.42 $17.07
Licensed Child Care Homes
Full-time $16.74 $14.18 $15.28 $16.36 $17.47 $18.69 $19.39
Part-time $13.49 $11.17 $12.15 $13.11 $14.11 $15.21 $15.83
Registered Child Care Homes
Full-time $16.60 $14.05 $15.14 $16.21 $17.32 $18.54 $19.23
Part-time $12.88 $10.60 $11.56 $12.49 $13.47 $14.54 $15.16
LWDA 4 North Central Texas
Me
an
30
th p
erce
nti
le
40
th p
erce
nti
le
Me
dia
n
60
th p
erce
nti
le
70
th p
erce
nti
le
75
th p
erc
en
tile
Licensed Child Care Centers
Full-time $32.72 $28.12 $30.12 $32.08 $34.10 $36.30 $37.55
Part-time $24.60 $20.55 $22.26 $23.95 $25.70 $27.62 $28.71
Licensed Child Care Homes
Full-time $28.16 $23.86 $25.71 $27.52 $29.39 $31.44 $32.60
Part-time $22.70 $18.79 $20.43 $22.05 $23.73 $25.57 $26.63
Registered Child Care Homes
Full-time $27.92 $23.63 $25.47 $27.27 $29.13 $31.17 $32.34
Part-time $21.66 $17.84 $19.44 $21.02 $22.66 $24.46 $25.49

71
LWDA 5 Tarrant County
Mea
n
30
th p
erce
nti
le
40
th p
erce
nti
le
Med
ian
60
th p
erce
nti
le
70
th p
erce
nti
le
75
th p
erce
nti
le
Licensed Child Care Centers
Full-time $31.10 $26.73 $28.63 $30.48 $32.40 $34.48 $35.67
Part-time $23.39 $19.55 $21.18 $22.78 $24.44 $26.26 $27.29
Licensed Child Care Homes
Full-time $26.77 $22.69 $24.44 $26.16 $27.93 $29.88 $30.98
Part-time $21.59 $17.89 $19.45 $20.98 $22.57 $24.32 $25.32
Registered Child Care Homes
Full-time $26.54 $22.48 $24.22 $25.93 $27.70 $29.63 $30.73
Part-time $20.61 $16.98 $18.50 $20.00 $21.55 $23.26 $24.24
LWDA 6 Dallas
Me
an
30
th p
erce
nti
le
40
th p
erce
nti
le
Me
dia
n
60
th p
erce
nti
le
70
th p
erce
nti
le
75
th p
erce
nti
le
Licensed Child Care Centers
Full-time $27.14 $22.85 $24.68 $26.48 $28.34 $30.38 $31.54
Part-time $19.73 $16.00 $17.54 $19.06 $20.65 $22.39 $23.39
Licensed Child Care Homes
Full-time $22.96 $18.98 $20.65 $22.30 $24.01 $25.89 $26.96
Part-time $18.01 $14.44 $15.90 $17.35 $18.86 $20.53 $21.49
Registered Child Care Homes
Full-time $22.74 $18.77 $20.44 $22.08 $23.78 $25.65 $26.72
Part-time $17.09 $13.59 $15.01 $16.42 $17.89 $19.52 $20.46

72
LWDA 7 North East Texas
Mea
n
30
th p
erce
nti
le
40
th p
erce
nti
le
Med
ian
60
th p
erce
nti
le
70
th p
erce
nti
le
75
th p
erce
nti
le
Licensed Child Care Centers
Full-time $19.16 $16.72 $17.80 $18.85 $19.93 $21.10 $21.77
Part-time $14.78 $12.61 $13.54 $14.46 $15.41 $16.45 $17.04
Licensed Child Care Homes
Full-time $16.71 $14.41 $15.41 $16.39 $17.40 $18.50 $19.13
Part-time $13.74 $11.64 $12.54 $13.43 $14.34 $15.34 $15.91
Registered Child Care Homes
Full-time $16.58 $14.29 $15.29 $16.26 $17.26 $18.36 $18.98
Part-time $13.18 $11.12 $12.00 $12.86 $13.76 $14.74 $15.30
LWDA 8 East Texas
Me
an
30
th p
erce
nti
le
40
th p
erce
nti
le
Me
dia
n
60
th p
erce
nti
le
70
th p
erce
nti
le
75
th p
erce
nti
le
Licensed Child Care Centers
Full-time $20.56 $17.90 $19.07 $20.21 $21.39 $22.67 $23.40
Part-time $15.80 $13.43 $14.45 $15.45 $16.48 $17.61 $18.25
Licensed Child Care Homes
Full-time $17.89 $15.39 $16.48 $17.55 $18.64 $19.84 $20.52
Part-time $14.67 $12.39 $13.37 $14.32 $15.32 $16.40 $17.03
Registered Child Care Homes
Full-time $17.75 $15.26 $16.34 $17.40 $18.49 $19.69 $20.37
Part-time $14.06 $11.82 $12.77 $13.71 $14.68 $15.75 $16.36

73
LWDA 9 West Central Texas
Mea
n
30
th p
erce
nti
le
40
th p
erce
nti
le
Med
ian
60
th p
erce
nti
le
70
th p
erce
nti
le
75
th p
erce
nti
le
Licensed Child Care Centers
Full-time $20.31 $17.41 $18.67 $19.90 $21.16 $22.55 $23.33
Part-time $15.21 $12.67 $13.75 $14.80 $15.90 $17.10 $17.79
Licensed Child Care Homes
Full-time $17.45 $14.74 $15.90 $17.04 $18.21 $19.49 $20.23
Part-time $14.02 $11.57 $12.60 $13.61 $14.66 $15.82 $16.48
Registered Child Care Homes
Full-time $17.29 $14.60 $15.75 $16.88 $18.05 $19.33 $20.06
Part-time $13.38 $10.98 $11.98 $12.97 $13.99 $15.12 $15.77
LWDA 10 Upper Rio Grande
Me
an
30
th p
erce
nti
le
40
th p
erce
nti
le
Me
dia
n
60
th p
erce
nti
le
70
th p
erce
nti
le
75
th p
erce
nti
le
Licensed Child Care Centers
Full-time $20.72 $17.71 $19.01 $20.29 $21.61 $23.05 $23.87
Part-time $15.43 $12.79 $13.90 $15.00 $16.13 $17.38 $18.09
Licensed Child Care Homes
Full-time $17.75 $14.94 $16.14 $17.31 $18.53 $19.87 $20.63
Part-time $14.20 $11.65 $12.72 $13.76 $14.85 $16.05 $16.74
Registered Child Care Homes
Full-time $17.59 $14.79 $15.98 $17.16 $18.37 $19.70 $20.46
Part-time $13.53 $11.04 $12.07 $13.09 $14.16 $15.33 $16.00

74
LWDA 11 Permian Basin
Mea
n
30
th p
erce
nti
le
40
th p
erce
nti
le
Med
ian
60
th p
erce
nti
le
70
th p
erce
nti
le
75
th p
erce
nti
le
Licensed Child Care Centers
Full-time $22.42 $19.90 $21.03 $22.13 $23.25 $24.47 $25.17
Part-time $17.81 $15.54 $16.54 $17.52 $18.52 $19.61 $20.23
Licensed Child Care Homes
Full-time $19.85 $17.46 $18.52 $19.55 $20.61 $21.77 $22.42
Part-time $16.71 $14.51 $15.47 $16.42 $17.39 $18.45 $19.05
Registered Child Care Homes
Full-time $19.71 $17.33 $18.39 $19.42 $20.47 $21.62 $22.27
Part-time $16.11 $13.94 $14.89 $15.82 $16.77 $17.81 $18.40
LWDA 12 Concho Valley
Me
an
30
th p
erce
nti
le
40
th p
erce
nti
le
Me
dia
n
60
th p
erce
nti
le
70
th p
erce
nti
le
75
th p
erce
nti
le
Licensed Child Care Centers
Full-time $19.91 $17.78 $18.74 $19.67 $20.62 $21.65 $22.24
Part-time $16.00 $14.08 $14.93 $15.76 $16.61 $17.54 $18.07
Licensed Child Care Homes
Full-time $17.73 $15.72 $16.62 $17.49 $18.39 $19.37 $19.92
Part-time $15.06 $13.19 $14.02 $14.83 $15.65 $16.55 $17.07
Registered Child Care Homes
Full-time $17.61 $15.60 $16.50 $17.38 $18.27 $19.24 $19.79
Part-time $14.55 $12.71 $13.52 $14.31 $15.13 $16.01 $16.51

75
LWDA 13 Heart of Texas
Mea
n
30
th p
erce
nti
le
40
th p
erce
nti
le
Med
ian
60
th p
erce
nti
le
70
th p
erce
nti
le
75
th p
erce
nti
le
Licensed Child Care Centers
Full-time $20.87 $17.84 $19.15 $20.43 $21.76 $23.20 $24.03
Part-time $15.55 $12.90 $14.02 $15.12 $16.26 $17.51 $18.23
Licensed Child Care Homes
Full-time $17.88 $15.06 $16.26 $17.45 $18.67 $20.01 $20.78
Part-time $14.32 $11.76 $12.83 $13.88 $14.97 $16.18 $16.87
Registered Child Care Homes
Full-time $17.72 $14.91 $16.11 $17.29 $18.51 $19.84 $20.60
Part-time $13.64 $11.14 $12.18 $13.21 $14.27 $15.45 $16.12
LWDA 14 Capital Area
Me
an
30
th p
erce
nti
le
40
th p
erce
nti
le
Me
dia
n
60
th p
erce
nti
le
70
th p
erce
nti
le
75
th p
erce
nti
le
Licensed Child Care Centers
Full-time $31.64 $27.42 $29.27 $31.07 $32.93 $34.95 $36.10
Part-time $24.13 $20.40 $22.00 $23.57 $25.19 $26.96 $27.97
Licensed Child Care Homes
Full-time $27.43 $23.48 $25.19 $26.86 $28.59 $30.48 $31.55
Part-time $22.37 $18.76 $20.30 $21.80 $23.36 $25.07 $26.05
Registered Child Care Homes
Full-time $27.21 $23.27 $24.97 $26.64 $28.36 $30.24 $31.31
Part-time $21.41 $17.87 $19.37 $20.84 $22.36 $24.04 $24.99

76
LWDA 15 Rural Capital
Mea
n
30
th p
erce
nti
le
40
th p
erce
nti
le
Med
ian
60
th p
erce
nti
le
70
th p
erce
nti
le
75
th p
erce
nti
le
Licensed Child Care Centers
Full-time $29.92 $25.56 $27.45 $29.29 $31.20 $33.28 $34.47
Part-time $22.28 $18.46 $20.07 $21.65 $23.29 $25.09 $26.12
Licensed Child Care Homes
Full-time $25.63 $21.56 $23.29 $25.00 $26.76 $28.69 $29.79
Part-time $20.50 $16.82 $18.35 $19.87 $21.44 $23.17 $24.16
Registered Child Care Homes
Full-time $25.40 $21.35 $23.07 $24.77 $26.52 $28.44 $29.54
Part-time $19.53 $15.93 $17.42 $18.90 $20.43 $22.12 $23.09
LWDA 16 Brazos Valley
Me
an
30
th p
erce
nti
le
40
th p
erce
nti
le
Me
dia
n
60
th p
erce
nti
le
70
th p
erce
nti
le
75
th p
erce
nti
le
Licensed Child Care Centers
Full-time $24.97 $21.12 $22.77 $24.39 $26.06 $27.89 $28.94
Part-time $18.29 $14.94 $16.33 $17.71 $19.13 $20.71 $21.61
Licensed Child Care Homes
Full-time $21.21 $17.63 $19.14 $20.62 $22.17 $23.86 $24.82
Part-time $16.74 $13.52 $14.85 $16.16 $17.53 $19.03 $19.90
Registered Child Care Homes
Full-time $21.01 $17.44 $18.95 $20.42 $21.96 $23.64 $24.60
Part-time $15.90 $12.75 $14.04 $15.32 $16.65 $18.12 $18.96

77
LWDA 17 Deep East Texas
Mea
n
30
th p
erce
nti
le
40
th p
erce
nti
le
Med
ian
60
th p
erce
nti
le
70
th p
erce
nti
le
75
th p
erce
nti
le
Licensed Child Care Centers
Full-time $19.52 $16.95 $18.08 $19.18 $20.31 $21.54 $22.24
Part-time $14.94 $12.66 $13.64 $14.60 $15.59 $16.67 $17.29
Licensed Child Care Homes
Full-time $16.95 $14.54 $15.59 $16.61 $17.66 $18.82 $19.47
Part-time $13.86 $11.66 $12.60 $13.52 $14.47 $15.52 $16.11
Registered Child Care Homes
Full-time $16.81 $14.42 $15.46 $16.47 $17.52 $18.67 $19.32
Part-time $13.27 $11.12 $12.03 $12.93 $13.86 $14.89 $15.47
LWDA 18 South East Texas
Me
an
30
th p
erc
en
tile
40
th p
erce
nti
le
Me
dia
n
60
th p
erce
nti
le
70
th p
erce
nti
le
75
th p
erce
nti
le
Licensed Child Care Centers
Full-time $21.25 $18.45 $19.68 $20.88 $22.11 $23.46 $24.22
Part-time $16.25 $13.77 $14.84 $15.88 $16.96 $18.14 $18.81
Licensed Child Care Homes
Full-time $18.45 $15.82 $16.96 $18.08 $19.23 $20.48 $21.20
Part-time $15.08 $12.68 $13.70 $14.70 $15.74 $16.88 $17.53
Registered Child Care Homes
Full-time $18.30 $15.68 $16.82 $17.93 $19.07 $20.32 $21.04
Part-time $14.43 $12.08 $13.08 $14.06 $15.08 $16.19 $16.83

78
LWDA 19 Golden Crescent
Mea
n
30
th p
erce
nti
le
40
th p
erce
nti
le
Med
ian
60
th p
erce
nti
le
70
th p
erce
nti
le
75
th p
erce
nti
le
Licensed Child Care Centers
Full-time $20.75 $18.47 $19.50 $20.49 $21.51 $22.62 $23.24
Part-time $16.57 $14.52 $15.43 $16.31 $17.22 $18.21 $18.78
Licensed Child Care Homes
Full-time $18.42 $16.26 $17.23 $18.16 $19.12 $20.17 $20.76
Part-time $15.57 $13.58 $14.46 $15.31 $16.20 $17.16 $17.71
Registered Child Care Homes
Full-time $18.30 $16.14 $17.10 $18.04 $18.99 $20.03 $20.62
Part-time $15.03 $13.06 $13.92 $14.77 $15.63 $16.58 $17.12
LWDA 20 Alamo
Me
an
30
th p
erce
nti
le
40
th p
erce
nti
le
Me
dia
n
60
th p
erce
nti
le
70
th p
erce
nti
le
75
th p
erce
nti
le
Licensed Child Care Centers
Full-time $28.06 $24.47 $26.06 $27.60 $29.19 $30.92 $31.90
Part-time $21.62 $18.43 $19.81 $21.16 $22.55 $24.07 $24.94
Licensed Child Care Homes
Full-time $24.46 $21.08 $22.56 $23.99 $25.47 $27.09 $28.01
Part-time $20.11 $17.01 $18.34 $19.64 $20.98 $22.45 $23.29
Registered Child Care Homes
Full-time $24.27 $20.90 $22.37 $23.80 $25.28 $26.89 $27.80
Part-time $19.28 $16.24 $17.54 $18.81 $20.12 $21.56 $22.39

79
LWDA 21 South Texas
Mea
n
30
th p
erce
nti
le
40
th p
erce
nti
le
Med
ian
60
th p
erce
nti
le
70
th p
erce
nti
le
75
th p
erce
nti
le
Licensed Child Care Centers
Full-time $21.36 $18.27 $19.61 $20.92 $22.27 $23.75 $24.59
Part-time $15.93 $13.22 $14.36 $15.48 $16.65 $17.93 $18.66
Licensed Child Care Homes
Full-time $18.31 $15.42 $16.65 $17.86 $19.11 $20.49 $21.27
Part-time $14.66 $12.05 $13.14 $14.22 $15.34 $16.57 $17.27
Registered Child Care Homes
Full-time $18.15 $15.27 $16.50 $17.70 $18.95 $20.31 $21.09
Part-time $13.97 $11.42 $12.48 $13.53 $14.62 $15.82 $16.51
LWDA 22 Coastal Bend
Me
an
30
th p
erce
nti
le
40
th p
erce
nti
le
Me
dia
n
60
th p
erce
nti
le
70
th p
erce
nti
le
75
th p
erce
nti
le
Licensed Child Care Centers
Full-time $23.26 $18.99 $20.77 $22.52 $24.34 $26.34 $27.49
Part-time $16.11 $12.48 $13.93 $15.37 $16.88 $18.55 $19.52
Licensed Child Care Homes
Full-time $19.21 $15.29 $16.88 $18.46 $20.11 $21.94 $22.99
Part-time $14.49 $11.03 $12.39 $13.75 $15.18 $16.77 $17.69
Registered Child Care Homes
Full-time $18.99 $15.09 $16.68 $18.25 $19.89 $21.71 $22.75
Part-time $13.62 $10.25 $11.56 $12.88 $14.26 $15.80 $16.70

80
LWDA 23 Lower Rio Grande Valley
Mea
n
30
th p
erce
nti
le
40
th p
erce
nti
le
Med
ian
60
th p
erce
nti
le
70
th p
erce
nti
le
75
th p
erce
nti
le
Licensed Child Care Centers
Full-time $18.59 $15.21 $16.62 $18.00 $19.45 $21.03 $21.94
Part-time $12.92 $10.04 $11.19 $12.33 $13.53 $14.86 $15.63
Licensed Child Care Homes
Full-time $15.37 $12.27 $13.53 $14.79 $16.10 $17.55 $18.38
Part-time $11.63 $8.88 $9.96 $11.04 $12.18 $13.44 $14.17
Registered Child Care Homes
Full-time $15.20 $12.11 $13.37 $14.62 $15.92 $17.36 $18.19
Part-time $10.94 $8.26 $9.31 $10.35 $11.45 $12.68 $13.39
LWDA 24 Cameron County
Me
an
30
th p
erce
nti
le
40
th p
erce
nti
le
Me
dia
n
60
th p
erce
nti
le
70
th p
erce
nti
le
75
th p
erce
nti
le
Licensed Child Care Centers
Full-time $19.60 $16.37 $17.74 $19.09 $20.48 $22.01 $22.88
Part-time $14.07 $11.28 $12.42 $13.55 $14.73 $16.03 $16.78
Licensed Child Care Homes
Full-time $16.48 $13.49 $14.73 $15.96 $17.24 $18.64 $19.45
Part-time $12.79 $10.12 $11.20 $12.28 $13.40 $14.64 $15.36
Registered Child Care Homes
Full-time $16.31 $13.33 $14.57 $15.79 $17.06 $18.46 $19.26
Part-time $12.11 $9.50 $10.55 $11.59 $12.68 $13.89 $14.59

81
LWDA 25 Texoma
Mea
n
30
th p
erce
nti
le
40
th p
erce
nti
le
Med
ian
60
th p
erce
nti
le
70
th p
erce
nti
le
75
th p
erce
nti
le
Licensed Child Care Centers
Full-time $22.51 $19.67 $20.92 $22.15 $23.41 $24.78 $25.56
Part-time $17.40 $14.87 $15.97 $17.04 $18.14 $19.35 $20.04
Licensed Child Care Homes
Full-time $19.65 $16.98 $18.15 $19.29 $20.46 $21.75 $22.48
Part-time $16.20 $13.75 $14.80 $15.83 $16.90 $18.07 $18.73
Registered Child Care Homes
Full-time $19.50 $16.83 $18.00 $19.14 $20.31 $21.58 $22.31
Part-time $15.54 $13.13 $14.16 $15.17 $16.22 $17.36 $18.01
LWDA 26 Central Texas
Me
an
30
th p
erce
nti
le
40
th p
erce
nti
le
Me
dia
n
60
th p
erce
nti
le
70
th p
erce
nti
le
75
th p
erce
nti
le
Licensed Child Care Centers
Full-time $20.90 $18.60 $19.63 $20.63 $21.66 $22.78 $23.41
Part-time $16.68 $14.60 $15.52 $16.42 $17.34 $18.34 $18.90
Licensed Child Care Homes
Full-time $18.55 $16.37 $17.34 $18.28 $19.25 $20.30 $20.90
Part-time $15.67 $13.66 $14.54 $15.41 $16.30 $17.27 $17.82
Registered Child Care Homes
Full-time $18.42 $16.25 $17.22 $18.16 $19.12 $20.17 $20.77
Part-time $15.12 $13.14 $14.01 $14.86 $15.73 $16.69 $17.23

82
LWDA 27 Middle Rio Grande
Mea
n
30
th p
erce
nti
le
40
th p
erce
nti
le
Med
ian
60
th p
erce
nti
le
70
th p
erce
nti
le
75
th p
erce
nti
le
Licensed Child Care Centers
Full-time $19.97 $17.18 $18.40 $19.58 $20.80 $22.14 $22.90
Part-time $15.05 $12.59 $13.63 $14.66 $15.72 $16.88 $17.54
Licensed Child Care Homes
Full-time $17.21 $14.60 $15.72 $16.82 $17.95 $19.19 $19.90
Part-time $13.89 $11.53 $12.52 $13.50 $14.52 $15.64 $16.28
Registered Child Care Homes
Full-time $17.06 $14.46 $15.58 $16.67 $17.80 $19.04 $19.74
Part-time $13.27 $10.95 $11.92 $12.88 $13.87 $14.97 $15.59
LWDA 28 Gulf Coast
Me
an
30
th p
erce
nti
le
40
th p
erce
nti
le
Me
dia
n
60
th p
erce
nti
le
70
th p
erce
nti
le
75
th p
erce
nti
le
Licensed Child Care Centers
Full-time $27.55 $23.50 $25.25 $26.96 $28.72 $30.65 $31.75
Part-time $20.47 $16.93 $18.42 $19.88 $21.40 $23.07 $24.02
Licensed Child Care Homes
Full-time $23.57 $19.80 $21.40 $22.98 $24.61 $26.40 $27.42
Part-time $18.82 $15.41 $16.83 $18.23 $19.69 $21.29 $22.21
Registered Child Care Homes
Full-time $23.35 $19.60 $21.20 $22.77 $24.39 $26.17 $27.19
Part-time $17.92 $14.59 $15.97 $17.34 $18.76 $20.32 $21.22

3. CHILD CARE DAILY MARKET RATES AND LWDA ESTABLISHED RATES:
PERCENTILE ANALYSIS


85
3.1 PERCENTILE ANALYSIS
Maximum reimbursement rates in effect for Local Workforce Development Areas (LWDAs) in May
2016 for the various categories of child care were compared to the distributions of daily market rates
gathered in this 2016 survey to determine at what percentile of the market such maximum rates would
provide access. Similar comparisons were made for maximum enhanced rates, or the highest rate a local
board will reimburse for care in facilities that, for example, receive more stars on the Texas Rising Star
scale, or whatever other criteria are used locally to assign enhanced rates. Exact percentiles at which
access is provided, whether for regular reimbursement or maximum enhanced rates, are listed for all
categories of care in the tables below.4
Several clarifications are in order. First, it should be noted that these percentiles at which access
to care is potentially available should not be confused with percentiles at which care is reimbursed.5
Second, it is possible that confusion could arise regarding the interpretation of several instances in these
tables in which access to care is listed as the zero percentile. In these instances, the maximum
reimbursement rate was found to be the same as or below the lowest rate gathered in the survey for that
type of care.
General trends in the level of access potentially provided are presented below. Overall, across
care types, facility types, age groups, and local boards, maximum reimbursement rates were found to
provide access to the 34th percentile of market rates, while maximum enhanced rates provide access to
the 50th percentile.6 These market access numbers indicate slightly reduced market access at regular
maximum rates, and slightly greater market access at maximum enhanced rates, as compared to the same
figures documented in the last annual survey.
As shown in the following table, among facility types access is better for licensed homes, at the
36th percentile of the market for maximum regular rate, and the 66th percentile for maximum enhanced
rates. For centers and registered homes, access is provided at the 31st to 35th percentile for regular
maximum rates, and the 43rd to 49th percentile for maximum enhanced rates.
4 Maximum reimbursement rates in effect in May 2016 for Local Workforce Development Areas (LWDAs)
5 To estimate the percentile at which care is reimbursed, corrections would need to be made for reimbursement below the maximum, as well as differential weighting of more common and rarer forms of care.
6 Note that in statewide and other comparisons that estimate trends across rate categories, averages are taken with all categories weighted equally, rather than according to how frequently such care is utilized.
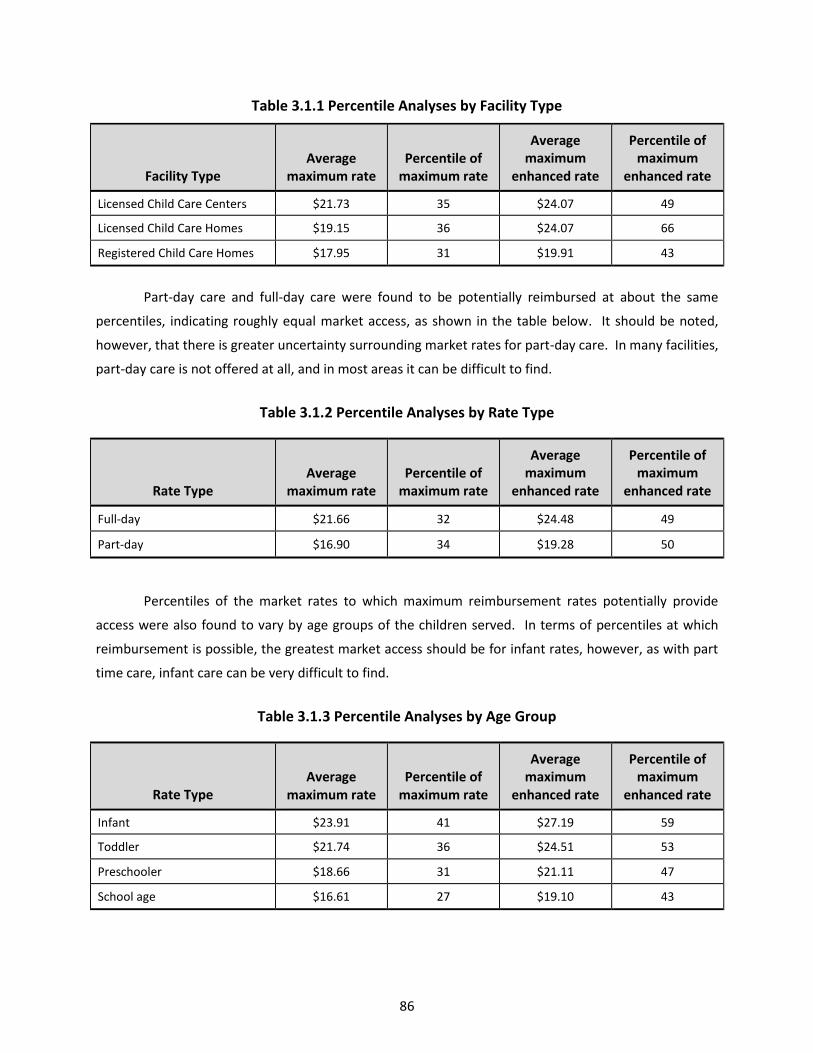
86
Table 3.1.1 Percentile Analyses by Facility Type
Facility Type Average
maximum rate Percentile of
maximum rate
Average maximum
enhanced rate
Percentile of maximum
enhanced rate
Licensed Child Care Centers $21.73 35 $24.07 49
Licensed Child Care Homes $19.15 36 $24.07 66
Registered Child Care Homes $17.95 31 $19.91 43
Part-day care and full-day care were found to be potentially reimbursed at about the same
percentiles, indicating roughly equal market access, as shown in the table below. It should be noted,
however, that there is greater uncertainty surrounding market rates for part-day care. In many facilities,
part-day care is not offered at all, and in most areas it can be difficult to find.
Table 3.1.2 Percentile Analyses by Rate Type
Rate Type Average
maximum rate Percentile of
maximum rate
Average maximum
enhanced rate
Percentile of maximum
enhanced rate
Full-day $21.66 32 $24.48 49
Part-day $16.90 34 $19.28 50
Percentiles of the market rates to which maximum reimbursement rates potentially provide
access were also found to vary by age groups of the children served. In terms of percentiles at which
reimbursement is possible, the greatest market access should be for infant rates, however, as with part
time care, infant care can be very difficult to find.
Table 3.1.3 Percentile Analyses by Age Group
Rate Type Average
maximum rate Percentile of
maximum rate
Average maximum
enhanced rate
Percentile of maximum
enhanced rate
Infant $23.91 41 $27.19 59
Toddler $21.74 36 $24.51 53
Preschooler $18.66 31 $21.11 47
School age $16.61 27 $19.10 43

87
Finally, reimbursement percentiles varied by LWDA. The table below lists the percentiles of
market rates to which maximum reimbursement rates potentially provide access by LWDA. Following
that, detailed tables list maximum reimbursement rates and market rate access by facility type, age of
child, and LWDA, for both regular rates and maximum enhanced rates.

88
Table 3.1.4 Percentile Analyses by LWDA
LWDA Average
maximum rate Percentile of
maximum rate
Average maximum
enhanced rate
Percentile of maximum
enhanced rate
1 Panhandle $16.95 24 $19.16 43
2 South Plains $15.06 22 $17.36 42
3 North Texas $15.54 42 $17.94 62
4 North Central Texas $23.69 28 $26.37 43
5 Tarrant County $22.35 27 $25.07 42
6 Dallas $19.54 32 $22.74 51
7 North East Texas $15.83 43 $18.70 68
8 East Texas $18.58 58 $20.65 74
9 West Central Texas $14.02 23 $15.65 36
10 Upper Rio Grande $15.11 31 $17.12 47
11 Permian Basin $15.42 14 $17.37 29
12 Concho Valley $17.58 47 $20.40 70
13 Heart of Texas $15.19 31 $18.83 59
14 Capital Area $23.27 28 $26.41 45
15 Rural Capital $22.49 34 $26.92 59
16 Brazos Valley $17.30 27 $19.52 41
17 Deep East Texas $15.24 37 $17.05 52
18 South East Texas $15.39 27 $17.84 46
19 Golden Crescent $15.37 22 $16.95 36
20 Alamo $21.97 35 $24.08 47
21 South Texas $15.12 29 $17.33 44
22 Coastal Bend $18.55 49 $20.96 63
23 Lower Rio Grande Valley $14.43 46 $17.60 68
24 Cameron County $13.25 29 $15.22 43
25 Texoma $21.37 64 $23.73 79
26 Central Texas $15.83 24 $17.57 41
27 Middle Rio Grande $13.25 20 $16.24 43
28 Gulf Coast $21.68 40 $24.50 55

89
Table 3.1.5 Board Maximum Rates
Licensed Centers: Board Maximum Rate by Age Group
Board
Infant Toddler Preschooler School age
Full- time
Part- time
Full- time
Part- time
Full- time
Part- time
Full- time
Part- time
1 Panhandle $22.00 $19.15 $20.50 $17.85 $18.95 $14.00 $17.55 $12.70
2 South Plains $21.70 $14.95 $19.72 $14.95 $19.28 $13.52 $17.70 $9.00
3 North Texas $20.49 $18.83 $19.11 $15.17 $17.38 $14.03 $17.02 $12.43
4 North Central Texas $30.00 $27.00 $27.50 $26.00 $25.50 $20.00 $24.50 $18.00
5 Tarrant County $29.50 $22.00 $28.50 $18.00 $25.00 $16.50 $23.00 $16.50
6 Dallas $26.15 $22.07 $24.00 $20.53 $22.00 $15.96 $19.57 $14.98
7 North East Texas $21.01 $18.00 $19.64 $16.50 $18.58 $13.40 $16.37 $12.20
8 East Texas $23.73 $19.70 $21.56 $18.69 $20.44 $15.11 $19.79 $14.45
9 West Central Texas $19.21 $12.71 $17.56 $11.56 $16.17 $10.38 $15.40 $8.26
10 Upper Rio Grande $19.66 $16.44 $18.23 $15.53 $15.80 $13.63 $14.80 $11.11
11 Permian Basin $19.25 $15.77 $18.60 $13.50 $18.25 $12.40 $16.70 $13.23
12 Concho Valley $24.70 $24.70 $19.95 $13.30 $18.14 $13.60 $18.16 $10.63
13 Heart of Texas $21.27 $16.77 $18.24 $16.03 $15.45 $13.58 $13.87 $13.40
14 Capital Area $35.67 $26.49 $28.05 $22.00 $26.14 $18.35 $24.15 $16.00
15 Rural Capital $28.97 $25.25 $26.72 $23.66 $24.96 $18.98 $23.72 $17.36
16 Brazos Valley $24.57 $16.87 $21.71 $15.35 $20.23 $12.40 $19.57 $14.39
17 Deep East Texas $20.11 $20.11 $18.59 $18.06 $17.11 $16.33 $16.66 $14.19
18 South East Texas $19.57 $20.30 $17.81 $18.25 $17.36 $16.61 $16.77 $11.53
19 Golden Crescent $19.42 $17.06 $18.55 $14.96 $17.62 $12.67 $16.81 $10.65
20 Alamo $34.25 $27.60 $24.03 $20.10 $22.93 $16.50 $26.16 $15.66
21 South Texas $17.85 $15.89 $17.85 $15.89 $20.92 $15.89 $15.86 $13.94
22 Coastal Bend $24.57 $19.08 $21.84 $18.03 $19.90 $15.29 $19.87 $15.33
23 Lower Rio Grande Valley $18.25 $16.09 $16.75 $14.49 $15.60 $13.93 $14.57 $11.67
24 Cameron County $19.03 $18.00 $14.19 $13.71 $14.60 $13.71 $12.66 $10.55
25 Texoma $26.72 $25.25 $24.61 $22.94 $22.60 $20.64 $21.80 $14.23
26 Central Texas $19.83 $18.08 $17.77 $16.40 $16.66 $13.48 $16.27 $12.48
27 Middle Rio Grande $19.43 $12.63 $17.63 $11.46 $17.63 $11.46 $15.88 $10.32
28 Gulf Coast $32.91 $25.06 $28.31 $23.40 $23.43 $16.22 $20.76 $13.71

90
Licensed Centers: Percentile of Board Maximum Rate by Age Group
Board
Infant Toddler Preschooler School age
Full- time
Part- time
Full- time
Part- time
Full- time
Part- time
Full- time
Part- time
1 Panhandle 28 32 27 30 23 28 19 22
2 South Plains 43 12 37 18 41 33 32 4
3 North Texas 44 59 45 36 38 59 41 50
4 North Central Texas 23 34 23 39 20 37 21 31
5 Tarrant County 28 17 34 8 24 22 20 27
6 Dallas 31 36 31 36 28 40 21 40
7 North East Texas 52 53 52 48 50 50 35 43
8 East Texas 61 57 56 58 55 58 55 58
9 West Central Texas 28 9 26 8 23 20 23 9
10 Upper Rio Grande 28 30 29 32 19 49 17 31
11 Permian Basin 13 10 16 5 19 13 13 24
12 Concho Valley 80 94 47 9 36 35 42 11
13 Heart Of Texas 38 32 28 35 16 47 12 52
14 Capital Area 57 35 28 20 26 27 21 19
15 Rural Capital 31 38 31 39 29 44 28 40
16 Brazos Valley 33 16 28 15 27 22 29 43
17 Deep East Texas 40 69 39 61 34 77 36 64
18 South East Texas 23 56 21 49 24 68 25 25
19 Golden Crescent 23 26 26 16 25 21 23 9
20 Alamo 72 61 23 22 23 26 50 26
21 South Texas 14 23 23 31 53 65 21 54
22 Coastal Bend 43 41 41 44 38 61 43 68
23 Lower Rio Grande Valley 34 47 35 45 35 73 34 62
24 Cameron County 32 53 13 29 21 63 14 40
25 Texoma 67 81 64 76 56 86 56 41
26 Central Texas 26 35 19 28 16 28 18 23
27 Middle Rio Grande 31 9 29 8 36 29 27 24
28 Gulf Coast 65 50 52 50 32 36 23 24

91
Licensed Homes: Board Maximum Rate by Age Group
Board
Infant Toddler Preschooler School age
Full- time
Part- time
Full- time
Part- time
Full- time
Part- time
Full- time
Part- time
1 Panhandle $18.60 $15.50 $17.50 $14.65 $16.70 $12.15 $15.05 $11.30
2 South Plains $16.30 $13.50 $15.40 $13.00 $15.40 $13.00 $15.40 $11.41
3 North Texas $15.73 $15.37 $15.17 $14.09 $14.49 $12.29 $13.65 $12.29
4 North Central Texas $27.00 $22.50 $25.50 $20.00 $24.25 $18.00 $21.25 $17.00
5 Tarrant County $27.00 $22.50 $25.50 $19.00 $23.00 $14.00 $20.00 $11.50
6 Dallas $23.00 $18.75 $21.00 $17.30 $19.85 $14.76 $17.00 $13.00
7 North East Texas $18.09 $13.25 $17.45 $12.25 $16.91 $8.00 $14.81 $7.05
8 East Texas $20.32 $17.82 $19.61 $16.42 $19.03 $15.66 $17.45 $15.29
9 West Central Texas $16.52 $9.06 $15.51 $10.32 $14.79 $10.03 $12.52 $7.30
10 Upper Rio Grande $17.03 $14.01 $16.36 $13.33 $14.75 $11.50 $12.50 $10.45
11 Permian Basin $16.70 $15.48 $16.65 $14.52 $16.25 $12.40 $14.33 $12.31
12 Concho Valley $24.70 $24.70 $18.37 $16.09 $17.52 $12.27 $15.73 $10.51
13 Heart of Texas $16.69 $16.69 $15.92 $15.92 $14.70 $10.00 $13.43 $9.00
14 Capital Area $29.36 $27.36 $22.20 $21.91 $21.90 $17.60 $18.00 $14.50
15 Rural Capital $24.66 $20.73 $23.37 $19.67 $22.94 $17.68 $20.55 $15.62
16 Brazos Valley $18.67 $14.63 $18.37 $14.04 $17.32 $13.46 $15.38 $11.11
17 Deep East Texas $18.06 $15.17 $15.74 $14.58 $15.74 $14.58 $14.58 $13.43
18 South East Texas $17.20 $17.20 $14.79 $13.24 $13.24 $10.68 $13.43 $8.77
19 Golden Crescent $17.43 $16.82 $17.32 $15.83 $17.32 $15.35 $15.22 $9.86
20 Alamo $30.00 $22.15 $24.21 $20.00 $23.88 $17.30 $22.76 $16.75
21 South Texas $15.12 $13.82 $15.12 $13.82 $15.12 $13.82 $12.84 $12.04
22 Coastal Bend $19.75 $19.95 $18.99 $18.25 $18.35 $16.05 $16.62 $19.95
23 Lower Rio Grande Valley $16.35 $15.39 $15.00 $13.79 $14.92 $13.93 $13.27 $12.21
24 Cameron County $16.00 $16.00 $13.71 $13.71 $12.66 $12.66 $11.60 $10.55
25 Texoma $25.82 $24.59 $23.41 $21.42 $21.56 $19.63 $20.45 $12.58
26 Central Texas $16.95 $14.56 $16.14 $13.11 $15.54 $12.05 $13.78 $12.25
27 Middle Rio Grande $12.89 $8.38 $12.89 $8.38 $11.37 $7.39 $11.37 $7.39
28 Gulf Coast $26.13 $20.67 $24.91 $19.48 $18.54 $16.22 $15.67 $11.03

92
Licensed Homes: Percentile of Board Maximum Rate by Age Group
Board
Infant Toddler Preschooler School age
Full- time
Part- time
Full- time
Part- time
Full- time
Part- time
Full- time
Part- time
1 Panhandle 26 38 22 9 23 19 23 20
2 South Plains 20 29 17 7 23 35 38 27
3 North Texas 30 68 30 26 32 50 40 61
4 North Central Texas 33 49 30 11 31 33 30 37
5 Tarrant County 40 56 37 11 31 15 29 10
6 Dallas 39 55 33 19 34 40 32 38
7 North East Texas 52 44 51 11 54 6 49 5
8 East Texas 60 78 60 36 62 71 65 77
9 West Central Texas 31 9 28 4 29 23 25 9
10 Upper Rio Grande 33 48 33 16 28 36 24 36
11 Permian Basin 13 36 17 8 19 17 17 25
12 Concho Valley 94 100 51 31 49 26 45 16
13 Heart of Texas 29 70 29 34 26 21 31 21
14 Capital Area 49 78 17 19 21 30 14 20
15 Rural Capital 33 52 32 18 37 43 39 40
16 Brazos Valley 24 35 27 10 27 37 29 29
17 Deep East Texas 49 63 33 27 40 69 45 68
18 South East Texas 28 69 16 10 11 19 23 12
19 Golden Crescent 28 63 32 23 40 59 33 10
20 Alamo 73 65 42 21 48 40 57 46
21 South Texas 17 42 20 16 27 55 23 49
22 Coastal Bend 43 82 44 45 48 73 54 94
23 Lower Rio Grande Valley 47 79 42 39 50 80 54 77
24 Cameron County 35 76 24 29 23 62 29 53
25 Texoma 83 96 74 64 68 86 74 36
26 Central Texas 23 36 21 6 22 20 19 32
27 Middle Rio Grande 9 6 12 1 8 6 17 10
28 Gulf Coast 54 63 53 25 22 44 19 17

93
Registered Homes: Board Maximum Rate
Board
Infant Toddler Preschooler School age
Full- time
Part- time
Full- time
Part- time
Full- time
Part- time
Full- time
Part- time
1 Panhandle $18.60 $15.50 $17.50 $14.65 $16.70 $12.15 $15.05 $11.30
2 South Plains $14.30 $11.50 $14.30 $11.50 $14.30 $8.50 $14.30 $8.25
3 North Texas $15.73 $14.73 $15.17 $13.66 $14.01 $12.01 $13.06 $12.01
4 North Central Texas $26.25 $19.50 $24.50 $21.50 $23.25 $17.50 $19.75 $15.25
5 Tarrant County $25.50 $17.00 $24.00 $15.00 $23.00 $13.00 $19.50 $12.00
6 Dallas $21.22 $18.46 $19.72 $17.22 $18.52 $13.36 $15.52 $11.47
7 North East Texas $17.14 $12.25 $16.33 $12.25 $15.50 $8.00 $13.15 $7.05
8 East Texas $20.11 $16.30 $19.18 $17.44 $18.23 $13.57 $15.45 $12.93
9 West Central Texas $16.09 $8.64 $14.95 $9.67 $14.02 $8.85 $12.21 $9.60
10 Upper Rio Grande $16.83 $13.22 $15.95 $14.29 $13.90 $10.24 $11.33 $10.12
11 Permian Basin $15.50 $15.44 $15.50 $13.23 $15.00 $11.03 $13.23 $9.27
12 Concho Valley $24.70 $24.70 $18.37 $16.09 $17.52 $12.27 $15.73 $10.51
13 Heart of Texas $16.68 $16.68 $15.92 $14.49 $13.95 $10.00 $12.00 $8.49
14 Capital Area $24.21 $23.95 $24.86 $22.09 $21.74 $20.64 $18.64 $13.55
15 Rural Capital $24.55 $19.79 $23.15 $19.85 $21.28 $18.24 $18.24 $14.22
16 Brazos Valley $18.67 $16.32 $18.55 $15.81 $17.32 $10.02 $15.38 $6.43
17 Deep East Texas $14.19 $14.19 $12.38 $12.38 $12.90 $9.02 $12.90 $7.72
18 South East Texas $15.15 $14.48 $14.78 $14.27 $14.47 $13.24 $13.68 $10.48
19 Golden Crescent $16.38 $14.72 $15.42 $14.72 $15.22 $13.67 $14.70 $8.03
20 Alamo $25.08 $17.97 $20.70 $19.22 $19.86 $14.79 $15.18 $13.36
21 South Texas $14.34 $13.03 $14.34 $13.03 $12.00 $8.35 $12.00 $7.17
22 Coastal Bend $19.52 $15.75 $18.52 $16.61 $17.48 $15.75 $15.75 $13.23
23 Lower Rio Grande Valley $15.38 $11.58 $14.40 $12.75 $13.50 $10.58 $10.52 $9.02
24 Cameron County $14.00 $11.00 $12.12 $10.55 $11.60 $10.55 $10.55 $8.44
25 Texoma $24.41 $23.44 $22.27 $20.29 $20.58 $18.58 $19.29 $11.51
26 Central Texas $17.15 $15.50 $16.50 $14.50 $16.50 $13.50 $15.98 $12.00
27 Middle Rio Grande $12.89 $8.38 $12.89 $8.38 $11.37 $7.39 $11.37 $7.39
28 Gulf Coast $25.76 $19.28 $24.16 $21.18 $17.51 $12.36 $14.50 $10.30

94
Registered Homes: Percentile of Board Maximum Rate
Board
Infant Toddler Preschooler School age
Full- time
Part- time
Full- time
Part- time
Full- time
Part- time
Full- time
Part- time
1 Panhandle 25 24 25 19 24 25 24 23
2 South Plains 8 6 12 6 15 5 28 6
3 North Texas 29 46 33 38 29 56 35 62
4 North Central Texas 28 18 28 29 27 38 23 29
5 Tarrant County 31 12 32 6 32 15 27 14
6 Dallas 28 38 29 32 27 38 24 30
7 North East Texas 42 20 43 21 41 10 33 7
8 East Texas 57 50 59 62 56 59 47 59
9 West Central Texas 27 3 27 6 24 19 23 32
10 Upper Rio Grande 31 26 33 37 22 32 16 37
11 Permian Basin 7 22 12 9 12 13 10 6
12 Concho Valley 93 99 54 47 50 34 46 19
13 Heart of Texas 28 55 32 38 22 29 20 20
14 Capital Area 21 44 32 34 21 59 18 17
15 Rural Capital 32 30 33 32 28 56 26 34
16 Brazos Valley 23 32 31 30 28 19 30 5
17 Deep East Texas 15 37 10 22 17 18 29 11
18 South East Texas 14 29 18 28 20 52 26 29
19 Golden Crescent 19 25 18 26 20 47 29 3
20 Alamo 41 20 23 29 23 28 10 23
21 South Texas 12 22 18 23 9 13 18 9
22 Coastal Bend 41 44 44 52 44 78 49 69
23 Lower Rio Grande Valley 39 35 41 47 40 63 31 54
24 Cameron County 21 21 16 19 17 51 22 35
25 Texoma 74 88 69 71 61 86 67 30
26 Central Texas 24 32 26 23 31 44 42 33
27 Middle Rio Grande 9 2 13 3 9 9 17 12
28 Gulf Coast 51 37 51 52 18 24 14 15

95
Table 3.1.6 Board Maximum Enhanced Rates
Licensed Centers: Board Maximum Enhanced Rate
Board
Infant Toddler Preschooler School age
Full- time
Part- time
Full- time
Part- time
Full- time
Part- time
Full- time
Part- time
1 Panhandle $24.20 $21.08 $22.55 $19.64 $20.85 $15.40 $19.32 $13.98
2 South Plains $24.51 $17.15 $21.51 $17.15 $21.03 $15.56 $19.36 $10.01
3 North Texas $22.78 $20.93 $21.25 $16.85 $19.32 $15.61 $18.94 $13.83
4 North Central Texas $32.70 $30.22 $29.98 $28.34 $28.06 $22.36 $26.71 $20.41
5 Tarrant County $32.18 $23.98 $31.14 $19.72 $27.50 $18.16 $25.42 $18.16
6 Dallas $30.06 $25.38 $26.16 $24.84 $23.98 $19.23 $22.82 $18.59
7 North East Texas $24.16 $20.70 $22.59 $18.98 $21.37 $15.41 $18.83 $14.03
8 East Texas $25.93 $21.54 $23.57 $20.44 $22.34 $16.52 $21.63 $15.80
9 West Central Texas $20.96 $13.87 $19.16 $12.62 $17.64 $11.33 $16.79 $9.02
10 Upper Rio Grande $21.84 $18.25 $20.25 $17.26 $17.55 $15.14 $16.44 $12.35
11 Permian Basin $21.57 $17.39 $20.29 $15.04 $19.92 $14.12 $19.27 $14.44
12 Concho Valley $28.40 $28.40 $22.95 $15.29 $20.86 $15.64 $20.89 $12.22
13 Heart of Texas $24.76 $20.17 $21.66 $19.41 $18.72 $17.06 $16.86 $16.73
14 Capital Area $38.90 $28.88 $30.60 $23.98 $28.51 $20.01 $28.01 $17.44
15 Rural Capital $33.89 $29.54 $31.26 $27.69 $29.20 $22.21 $27.75 $20.31
16 Brazos Valley $26.80 $18.40 $23.68 $16.74 $22.07 $13.52 $21.35 $15.69
17 Deep East Texas $21.95 $21.95 $20.30 $19.72 $18.68 $17.82 $18.19 $15.50
18 South East Texas $21.92 $22.74 $19.95 $20.44 $19.44 $18.60 $18.78 $12.91
19 Golden Crescent $21.18 $18.64 $20.24 $16.32 $19.23 $13.83 $18.34 $11.63
20 Alamo $37.35 $30.11 $26.24 $21.95 $25.04 $18.03 $28.57 $17.11
21 South Texas $19.82 $17.64 $19.82 $17.64 $23.22 $17.64 $17.30 $15.20
22 Coastal Bend $27.29 $21.20 $24.25 $20.03 $22.09 $16.98 $21.67 $16.72
23 Lower Rio Grande Valley $21.90 $18.55 $20.10 $16.63 $18.72 $16.79 $17.48 $14.08
24 Cameron County $21.52 $20.34 $16.05 $15.50 $16.51 $15.50 $14.32 $11.94
25 Texoma $29.40 $27.78 $27.08 $25.24 $24.88 $22.72 $23.98 $15.66
26 Central Texas $21.63 $19.73 $19.38 $17.88 $18.18 $14.70 $17.75 $13.61
27 Middle Rio Grande $22.34 $14.52 $20.27 $13.18 $20.27 $13.18 $18.26 $11.87
28 Gulf Coast $35.97 $27.38 $30.94 $25.57 $25.60 $17.89 $22.69 $14.99

96
Licensed Centers: Percentile of Board Maximum Enhanced Rate
Board
Infant Toddler Preschooler School age
Full- time
Part- time
Full- time
Part- time
Full- time
Part- time
Full- time
Part- time
1 Panhandle 44 48 43 45 38 41 31 33
2 South Plains 68 28 54 38 57 55 48 8
3 North Texas 62 75 62 52 55 73 58 64
4 North Central Texas 35 51 34 52 32 52 31 47
5 Tarrant County 41 26 48 14 36 32 31 38
6 Dallas 51 55 43 62 39 62 38 65
7 North East Texas 77 76 76 71 74 71 59 63
8 East Texas 77 71 71 72 70 71 70 71
9 West Central Texas 41 14 38 13 34 28 33 14
10 Upper Rio Grande 44 45 44 47 31 63 28 43
11 Permian Basin 28 19 28 11 33 26 33 36
12 Concho Valley 96 99 76 23 65 60 71 25
13 Heart of Texas 64 59 54 63 39 76 31 79
14 Capital Area 72 49 42 30 38 38 42 28
15 Rural Capital 56 62 55 62 52 65 51 60
16 Brazos Valley 46 24 40 22 38 30 40 53
17 Deep East Texas 56 81 54 74 48 86 50 76
18 South East Texas 41 75 37 67 41 82 41 39
19 Golden Crescent 39 42 42 28 40 33 37 16
20 Alamo 84 75 36 33 36 38 65 37
21 South Texas 25 35 36 45 69 77 31 65
22 Coastal Bend 58 53 54 57 50 71 54 75
23 Lower Rio Grande Valley 58 65 59 61 58 88 55 80
24 Cameron County 49 69 23 43 33 76 23 54
25 Texoma 82 91 79 87 73 94 72 55
26 Central Texas 42 52 32 43 29 42 30 36
27 Middle Rio Grande 54 19 50 17 58 47 48 40
28 Gulf Coast 78 63 66 63 45 48 33 33
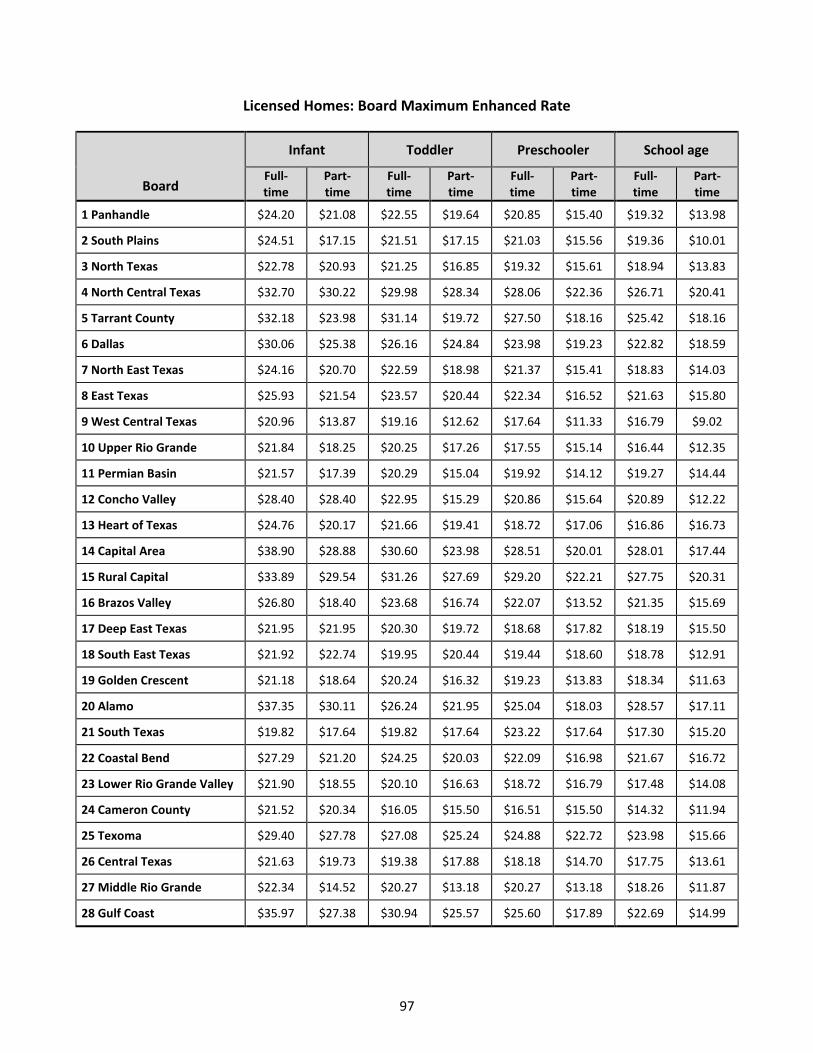
97
Licensed Homes: Board Maximum Enhanced Rate
Board
Infant Toddler Preschooler School age
Full- time
Part- time
Full- time
Part- time
Full- time
Part- time
Full- time
Part- time
1 Panhandle $24.20 $21.08 $22.55 $19.64 $20.85 $15.40 $19.32 $13.98
2 South Plains $24.51 $17.15 $21.51 $17.15 $21.03 $15.56 $19.36 $10.01
3 North Texas $22.78 $20.93 $21.25 $16.85 $19.32 $15.61 $18.94 $13.83
4 North Central Texas $32.70 $30.22 $29.98 $28.34 $28.06 $22.36 $26.71 $20.41
5 Tarrant County $32.18 $23.98 $31.14 $19.72 $27.50 $18.16 $25.42 $18.16
6 Dallas $30.06 $25.38 $26.16 $24.84 $23.98 $19.23 $22.82 $18.59
7 North East Texas $24.16 $20.70 $22.59 $18.98 $21.37 $15.41 $18.83 $14.03
8 East Texas $25.93 $21.54 $23.57 $20.44 $22.34 $16.52 $21.63 $15.80
9 West Central Texas $20.96 $13.87 $19.16 $12.62 $17.64 $11.33 $16.79 $9.02
10 Upper Rio Grande $21.84 $18.25 $20.25 $17.26 $17.55 $15.14 $16.44 $12.35
11 Permian Basin $21.57 $17.39 $20.29 $15.04 $19.92 $14.12 $19.27 $14.44
12 Concho Valley $28.40 $28.40 $22.95 $15.29 $20.86 $15.64 $20.89 $12.22
13 Heart of Texas $24.76 $20.17 $21.66 $19.41 $18.72 $17.06 $16.86 $16.73
14 Capital Area $38.90 $28.88 $30.60 $23.98 $28.51 $20.01 $28.01 $17.44
15 Rural Capital $33.89 $29.54 $31.26 $27.69 $29.20 $22.21 $27.75 $20.31
16 Brazos Valley $26.80 $18.40 $23.68 $16.74 $22.07 $13.52 $21.35 $15.69
17 Deep East Texas $21.95 $21.95 $20.30 $19.72 $18.68 $17.82 $18.19 $15.50
18 South East Texas $21.92 $22.74 $19.95 $20.44 $19.44 $18.60 $18.78 $12.91
19 Golden Crescent $21.18 $18.64 $20.24 $16.32 $19.23 $13.83 $18.34 $11.63
20 Alamo $37.35 $30.11 $26.24 $21.95 $25.04 $18.03 $28.57 $17.11
21 South Texas $19.82 $17.64 $19.82 $17.64 $23.22 $17.64 $17.30 $15.20
22 Coastal Bend $27.29 $21.20 $24.25 $20.03 $22.09 $16.98 $21.67 $16.72
23 Lower Rio Grande Valley $21.90 $18.55 $20.10 $16.63 $18.72 $16.79 $17.48 $14.08
24 Cameron County $21.52 $20.34 $16.05 $15.50 $16.51 $15.50 $14.32 $11.94
25 Texoma $29.40 $27.78 $27.08 $25.24 $24.88 $22.72 $23.98 $15.66
26 Central Texas $21.63 $19.73 $19.38 $17.88 $18.18 $14.70 $17.75 $13.61
27 Middle Rio Grande $22.34 $14.52 $20.27 $13.18 $20.27 $13.18 $18.26 $11.87
28 Gulf Coast $35.97 $27.38 $30.94 $25.57 $25.60 $17.89 $22.69 $14.99

98
Licensed Homes: Percentile of Board Maximum Enhanced Rate
Board
Infant Toddler Preschooler School age
Full- time
Part- time
Full- time
Part- time
Full- time
Part- time
Full- time
Part- time
1 Panhandle 71 84 64 45 58 49 61 46
2 South Plains 87 68 73 37 76 63 77 14
3 North Texas 84 96 80 51 74 80 84 75
4 North Central Texas 62 86 54 51 52 60 61 59
5 Tarrant County 68 65 68 14 57 39 61 51
6 Dallas 76 88 63 61 59 70 68 76
7 North East Texas 92 96 89 71 88 77 84 74
8 East Texas 92 94 86 72 85 78 91 81
9 West Central Texas 67 49 59 13 54 35 64 22
10 Upper Rio Grande 70 82 64 46 51 70 58 56
11 Permian Basin 54 56 48 10 52 33 63 48
12 Concho Valley 99 100 89 23 82 68 91 36
13 Heart of Texas 85 90 73 63 59 82 61 87
14 Capital Area 90 84 62 30 59 46 72 39
15 Rural Capital 80 91 74 62 71 72 79 71
16 Brazos Valley 72 62 60 22 58 38 70 66
17 Deep East Texas 80 97 74 74 68 90 78 84
18 South East Texas 67 95 57 67 61 87 71 51
19 Golden Crescent 66 80 62 28 60 41 67 25
20 Alamo 96 96 56 33 56 46 88 49
21 South Texas 51 74 56 45 84 83 61 76
22 Coastal Bend 81 87 73 56 70 78 81 84
23 Lower Rio Grande Valley 81 92 77 61 76 92 82 87
24 Cameron County 75 94 42 43 53 82 52 66
25 Texoma 95 99 91 87 87 96 92 67
26 Central Texas 68 86 52 42 48 50 60 48
27 Middle Rio Grande 79 56 70 17 77 55 77 52
28 Gulf Coast 93 91 83 62 65 56 64 45
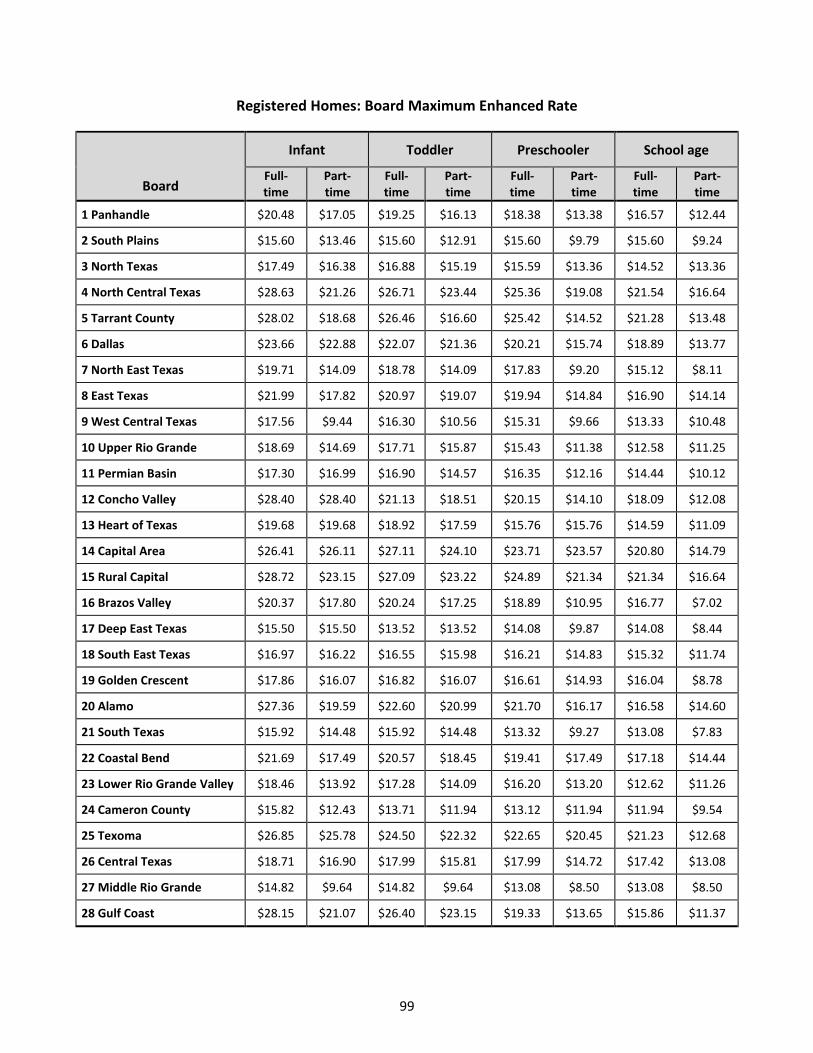
99
Registered Homes: Board Maximum Enhanced Rate
Board
Infant Toddler Preschooler School age
Full- time
Part- time
Full- time
Part- time
Full- time
Part- time
Full- time
Part- time
1 Panhandle $20.48 $17.05 $19.25 $16.13 $18.38 $13.38 $16.57 $12.44
2 South Plains $15.60 $13.46 $15.60 $12.91 $15.60 $9.79 $15.60 $9.24
3 North Texas $17.49 $16.38 $16.88 $15.19 $15.59 $13.36 $14.52 $13.36
4 North Central Texas $28.63 $21.26 $26.71 $23.44 $25.36 $19.08 $21.54 $16.64
5 Tarrant County $28.02 $18.68 $26.46 $16.60 $25.42 $14.52 $21.28 $13.48
6 Dallas $23.66 $22.88 $22.07 $21.36 $20.21 $15.74 $18.89 $13.77
7 North East Texas $19.71 $14.09 $18.78 $14.09 $17.83 $9.20 $15.12 $8.11
8 East Texas $21.99 $17.82 $20.97 $19.07 $19.94 $14.84 $16.90 $14.14
9 West Central Texas $17.56 $9.44 $16.30 $10.56 $15.31 $9.66 $13.33 $10.48
10 Upper Rio Grande $18.69 $14.69 $17.71 $15.87 $15.43 $11.38 $12.58 $11.25
11 Permian Basin $17.30 $16.99 $16.90 $14.57 $16.35 $12.16 $14.44 $10.12
12 Concho Valley $28.40 $28.40 $21.13 $18.51 $20.15 $14.10 $18.09 $12.08
13 Heart of Texas $19.68 $19.68 $18.92 $17.59 $15.76 $15.76 $14.59 $11.09
14 Capital Area $26.41 $26.11 $27.11 $24.10 $23.71 $23.57 $20.80 $14.79
15 Rural Capital $28.72 $23.15 $27.09 $23.22 $24.89 $21.34 $21.34 $16.64
16 Brazos Valley $20.37 $17.80 $20.24 $17.25 $18.89 $10.95 $16.77 $7.02
17 Deep East Texas $15.50 $15.50 $13.52 $13.52 $14.08 $9.87 $14.08 $8.44
18 South East Texas $16.97 $16.22 $16.55 $15.98 $16.21 $14.83 $15.32 $11.74
19 Golden Crescent $17.86 $16.07 $16.82 $16.07 $16.61 $14.93 $16.04 $8.78
20 Alamo $27.36 $19.59 $22.60 $20.99 $21.70 $16.17 $16.58 $14.60
21 South Texas $15.92 $14.48 $15.92 $14.48 $13.32 $9.27 $13.08 $7.83
22 Coastal Bend $21.69 $17.49 $20.57 $18.45 $19.41 $17.49 $17.18 $14.44
23 Lower Rio Grande Valley $18.46 $13.92 $17.28 $14.09 $16.20 $13.20 $12.62 $11.26
24 Cameron County $15.82 $12.43 $13.71 $11.94 $13.12 $11.94 $11.94 $9.54
25 Texoma $26.85 $25.78 $24.50 $22.32 $22.65 $20.45 $21.23 $12.68
26 Central Texas $18.71 $16.90 $17.99 $15.81 $17.99 $14.72 $17.42 $13.08
27 Middle Rio Grande $14.82 $9.64 $14.82 $9.64 $13.08 $8.50 $13.08 $8.50
28 Gulf Coast $28.15 $21.07 $26.40 $23.15 $19.33 $13.65 $15.86 $11.37

100
Registered Homes: Percentile of Board Maximum Enhanced Rate
Board
Infant Toddler Preschooler School age
Full- time
Part- time
Full- time
Part- time
Full- time
Part- time
Full- time
Part- time
1 Panhandle 40 37 39 30 37 37 37 34
2 South Plains 14 17 21 14 26 11 41 11
3 North Texas 44 62 49 52 43 69 49 75
4 North Central Texas 40 26 40 40 38 48 33 38
5 Tarrant County 45 19 46 11 46 24 37 22
6 Dallas 42 65 43 58 37 56 46 48
7 North East Texas 66 37 67 39 64 19 54 14
8 East Texas 72 64 73 76 71 71 61 71
9 West Central Texas 39 5 38 10 35 26 33 41
10 Upper Rio Grande 45 39 47 51 34 43 25 49
11 Permian Basin 17 36 21 17 21 22 18 10
12 Concho Valley 99 100 80 74 77 58 72 38
13 Heart of Texas 52 77 56 64 36 81 42 46
14 Capital Area 32 57 46 47 31 76 29 25
15 Rural Capital 55 51 56 53 49 75 45 52
16 Brazos Valley 33 42 42 40 38 26 40 7
17 Deep East Texas 25 51 17 32 26 26 41 17
18 South East Texas 26 45 31 44 33 68 41 43
19 Golden Crescent 31 39 30 40 34 62 44 6
20 Alamo 57 30 35 42 34 39 16 33
21 South Texas 21 33 29 35 16 20 26 13
22 Coastal Bend 53 55 57 63 56 86 59 77
23 Lower Rio Grande Valley 61 55 63 58 61 82 49 74
24 Cameron County 33 32 27 30 27 64 33 47
25 Texoma 87 95 82 84 76 93 80 42
26 Central Texas 39 47 41 37 47 59 58 46
27 Middle Rio Grande 19 6 27 6 18 16 32 20
28 Gulf Coast 65 49 65 64 27 33 21 22

4. SPECIAL ANALYSES

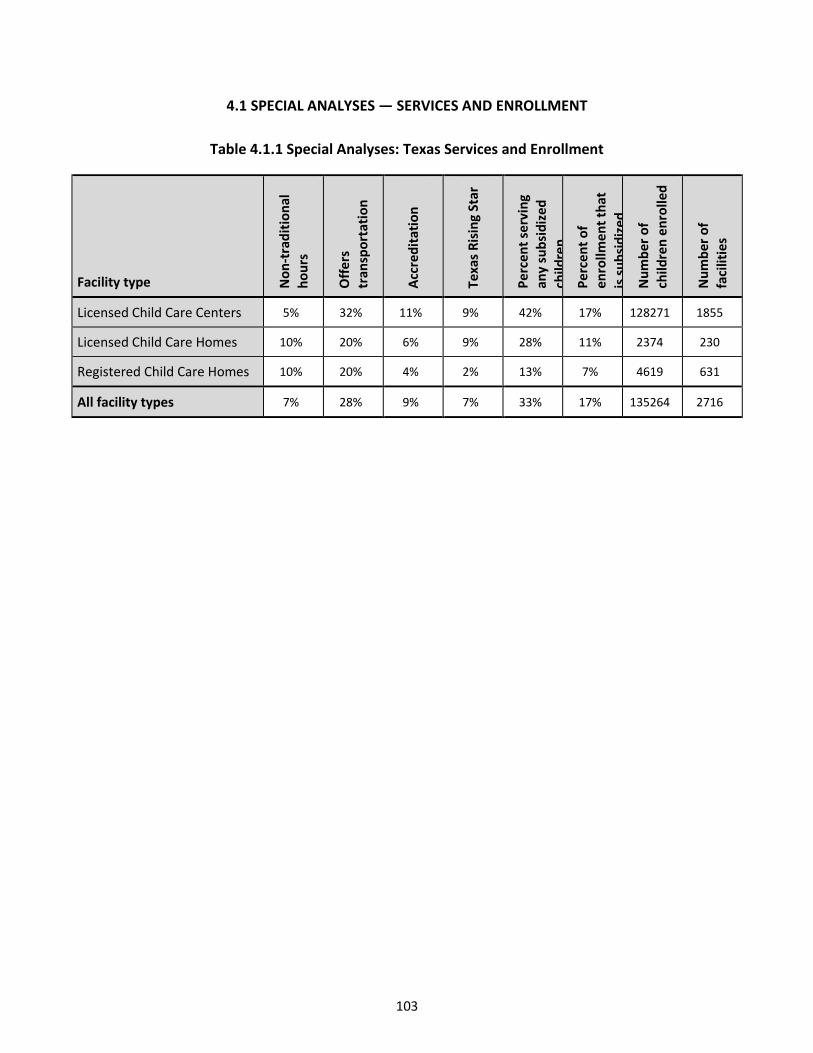
103
4.1 SPECIAL ANALYSES — SERVICES AND ENROLLMENT
Table 4.1.1 Special Analyses: Texas Services and Enrollment
Facility type No
n-t
rad
itio
nal
h
ou
rs
Off
ers
tran
spo
rtat
ion
Acc
red
itat
ion
Texa
s R
isin
g St
ar
Pe
rcen
t se
rvin
g an
y su
bsi
diz
ed
child
ren
Pe
rcen
t o
f en
rollm
en
t th
at
is s
ub
sid
ized
Nu
mb
er o
f
child
ren
en
rolle
d
Nu
mb
er o
f fa
cilit
ies
Licensed Child Care Centers 5% 32% 11% 9% 42% 17% 128271 1855
Licensed Child Care Homes 10% 20% 6% 9% 28% 11% 2374 230
Registered Child Care Homes 10% 20% 4% 2% 13% 7% 4619 631
All facility types 7% 28% 9% 7% 33% 17% 135264 2716
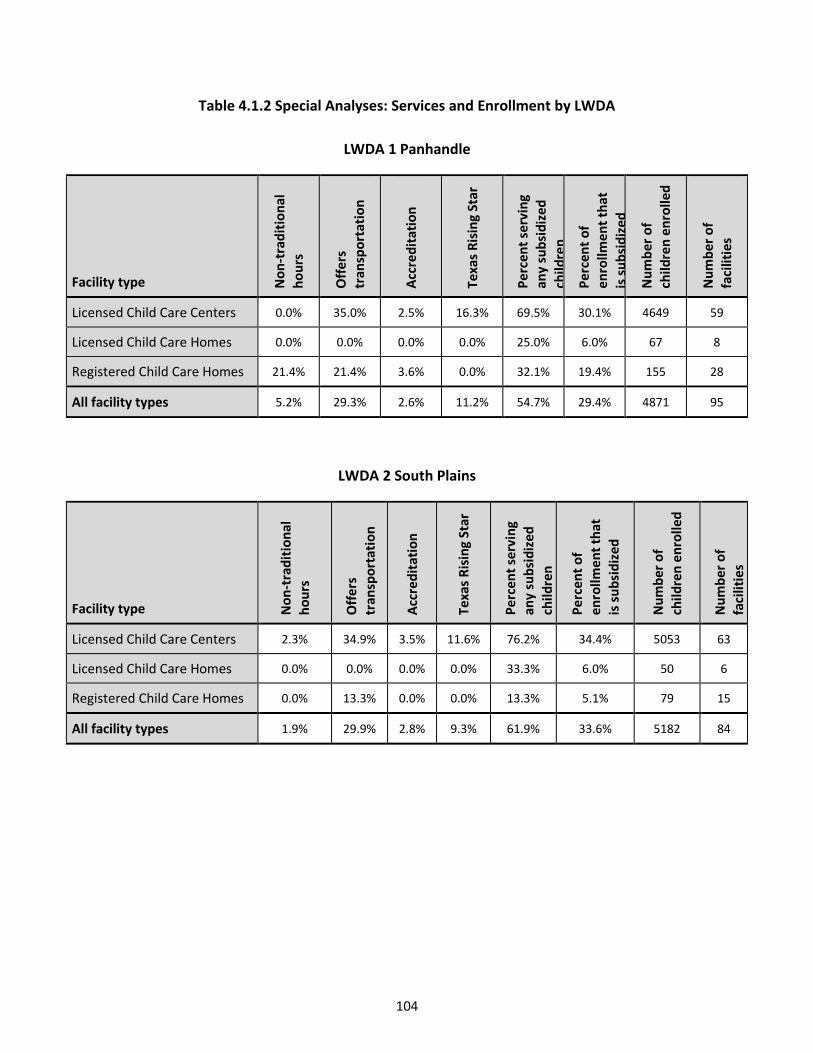
104
Table 4.1.2 Special Analyses: Services and Enrollment by LWDA
LWDA 1 Panhandle
Facility type No
n-t
rad
itio
nal
h
ou
rs
Off
ers
tran
spo
rtat
ion
Acc
red
itat
ion
Texa
s R
isin
g St
ar
Pe
rcen
t se
rvin
g an
y su
bsi
diz
ed
child
ren
Pe
rcen
t o
f en
rollm
en
t th
at
is s
ub
sid
ized
Nu
mb
er o
f ch
ildre
n e
nro
lled
Nu
mb
er o
f fa
cilit
ies
Licensed Child Care Centers 0.0% 35.0% 2.5% 16.3% 69.5% 30.1% 4649 59
Licensed Child Care Homes 0.0% 0.0% 0.0% 0.0% 25.0% 6.0% 67 8
Registered Child Care Homes 21.4% 21.4% 3.6% 0.0% 32.1% 19.4% 155 28
All facility types 5.2% 29.3% 2.6% 11.2% 54.7% 29.4% 4871 95
LWDA 2 South Plains
Facility type No
n-t
rad
itio
nal
h
ou
rs
Off
ers
tran
spo
rtat
ion
Acc
red
itat
ion
Texa
s R
isin
g St
ar
Pe
rce
nt
serv
ing
any
sub
sid
ize
d
child
ren
Pe
rce
nt
of
en
rollm
en
t th
at
is s
ub
sid
ize
d
Nu
mb
er o
f
child
ren
en
rolle
d
Nu
mb
er o
f fa
cilit
ies
Licensed Child Care Centers 2.3% 34.9% 3.5% 11.6% 76.2% 34.4% 5053 63
Licensed Child Care Homes 0.0% 0.0% 0.0% 0.0% 33.3% 6.0% 50 6
Registered Child Care Homes 0.0% 13.3% 0.0% 0.0% 13.3% 5.1% 79 15
All facility types 1.9% 29.9% 2.8% 9.3% 61.9% 33.6% 5182 84

105
LWDA 3 North Texas
Facility type No
n-t
rad
itio
nal
h
ou
rs
Off
ers
tran
spo
rtat
ion
Acc
red
itat
ion
Texa
s R
isin
g St
ar
Pe
rcen
t se
rvin
g an
y su
bsi
diz
ed
child
ren
Pe
rcen
t o
f en
rollm
en
t th
at
is s
ub
sid
ized
Nu
mb
er o
f
child
ren
en
rolle
d
Nu
mb
er o
f fa
cilit
ies
Licensed Child Care Centers 5.2% 32.5% 2.6% 16.9% 68.1% 22.2% 2977 47
Licensed Child Care Homes 30.0% 50.0% 0.0% 10.0% 40.0% 9.6% 73 10
Registered Child Care Homes 10.5% 15.8% 0.0% 0.0% 26.3% 8.6% 116 19
All facility types 8.5% 31.1% 1.9% 13.2% 53.9% 21.4% 3166 76
LWDA 4 North Central Texas
Facility type No
n-t
rad
itio
nal
h
ou
rs
Off
ers
tr
ansp
ort
atio
n
Acc
red
itat
ion
Texa
s R
isin
g St
ar
Pe
rce
nt
serv
ing
any
sub
sid
ize
d
child
ren
Pe
rce
nt
of
en
rollm
en
t th
at
is s
ub
sid
ize
d
Nu
mb
er o
f ch
ildre
n e
nro
lled
Nu
mb
er o
f fa
cilit
ies
Licensed Child Care Centers 1.9% 28.4% 25.2% 5.2% 36.2% 7.1% 9516 105
Licensed Child Care Homes 0.0% 0.0% 0.0% 0.0% 0.0% 0.0% 78 10
Registered Child Care Homes 3.1% 9.4% 6.3% 3.1% 6.3% 2.6% 156 32
All facility types 2.0% 23.9% 20.8% 4.6% 27.2% 6.9% 9750 147
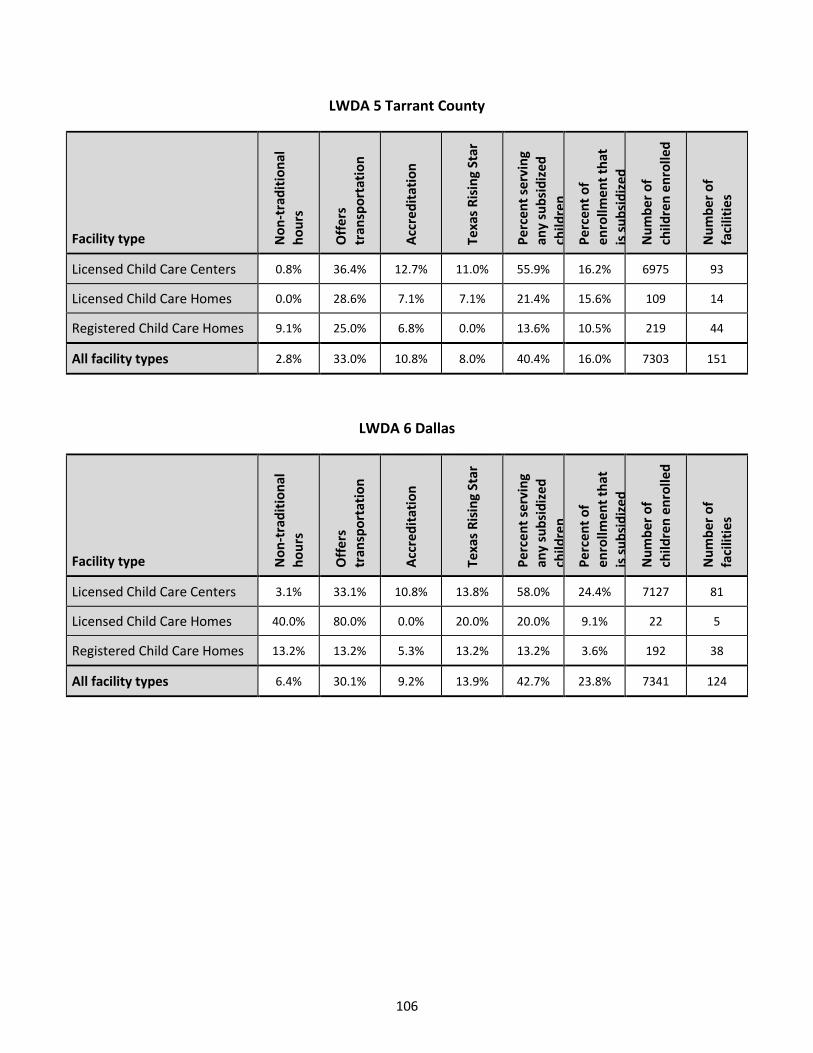
106
LWDA 5 Tarrant County
Facility type No
n-t
rad
itio
nal
h
ou
rs
Off
ers
tran
spo
rtat
ion
Acc
red
itat
ion
Texa
s R
isin
g St
ar
Pe
rcen
t se
rvin
g an
y su
bsi
diz
ed
child
ren
Pe
rcen
t o
f en
rollm
en
t th
at
is s
ub
sid
ized
Nu
mb
er o
f ch
ildre
n e
nro
lled
Nu
mb
er o
f fa
cilit
ies
Licensed Child Care Centers 0.8% 36.4% 12.7% 11.0% 55.9% 16.2% 6975 93
Licensed Child Care Homes 0.0% 28.6% 7.1% 7.1% 21.4% 15.6% 109 14
Registered Child Care Homes 9.1% 25.0% 6.8% 0.0% 13.6% 10.5% 219 44
All facility types 2.8% 33.0% 10.8% 8.0% 40.4% 16.0% 7303 151
LWDA 6 Dallas
Facility type No
n-t
rad
itio
nal
h
ou
rs
Off
ers
tr
ansp
ort
atio
n
Acc
red
itat
ion
Texa
s R
isin
g St
ar
Pe
rce
nt
serv
ing
any
sub
sid
ize
d
child
ren
Pe
rce
nt
of
en
rollm
en
t th
at
is s
ub
sid
ize
d
Nu
mb
er o
f ch
ildre
n e
nro
lled
Nu
mb
er o
f fa
cilit
ies
Licensed Child Care Centers 3.1% 33.1% 10.8% 13.8% 58.0% 24.4% 7127 81
Licensed Child Care Homes 40.0% 80.0% 0.0% 20.0% 20.0% 9.1% 22 5
Registered Child Care Homes 13.2% 13.2% 5.3% 13.2% 13.2% 3.6% 192 38
All facility types 6.4% 30.1% 9.2% 13.9% 42.7% 23.8% 7341 124

107
LWDA 7 North East Texas
Facility type No
n-t
rad
itio
nal
h
ou
rs
Off
ers
tran
spo
rtat
ion
Acc
red
itat
ion
Texa
s R
isin
g St
ar
Pe
rcen
t se
rvin
g an
y su
bsi
diz
ed
child
ren
Pe
rcen
t o
f en
rollm
en
t th
at
is s
ub
sid
ized
Nu
mb
er o
f ch
ildre
n e
nro
lled
Nu
mb
er o
f fa
cilit
ies
Licensed Child Care Centers 8.5% 35.2% 2.8% 26.8% 70.9% 24.6% 4021 55
Licensed Child Care Homes 0.0% 0.0% 0.0% 0.0% 33.3% 4.3% 46 6
Registered Child Care Homes 0.0% 0.0% 0.0% 0.0% 12.5% 4.3% 47 8
All facility types 7.1% 29.4% 2.4% 22.4% 60.9% 24.1% 4114 69
LWDA 8 East Texas
Facility type No
n-t
rad
itio
nal
h
ou
rs
Off
ers
tr
ansp
ort
atio
n
Acc
red
itat
ion
Texa
s R
isin
g St
ar
Pe
rce
nt
serv
ing
any
sub
sid
ize
d
child
ren
Pe
rce
nt
of
en
rollm
en
t th
at
is s
ub
sid
ize
d
Nu
mb
er o
f ch
ildre
n e
nro
lled
Nu
mb
er o
f fa
cilit
ies
Licensed Child Care Centers 3.1% 35.4% 6.3% 10.4% 69.7% 21.8% 5584 76
Licensed Child Care Homes 0.0% 0.0% 0.0% 14.3% 71.4% 15.2% 46 7
Registered Child Care Homes 7.1% 0.0% 7.1% 0.0% 28.6% 11.3% 80 14
All facility types 3.4% 29.1% 6.0% 9.4% 63.9% 21.6% 5710 97

108
LWDA 9 West Central Texas
Facility type No
n-t
rad
itio
nal
h
ou
rs
Off
ers
tran
spo
rtat
ion
Acc
red
itat
ion
Texa
s R
isin
g St
ar
Pe
rcen
t se
rvin
g an
y su
bsi
diz
ed
child
ren
Pe
rcen
t o
f en
rollm
en
t th
at
is s
ub
sid
ized
Nu
mb
er o
f ch
ildre
n e
nro
lled
Nu
mb
er o
f fa
cilit
ies
Licensed Child Care Centers 4.7% 25.6% 3.5% 10.5% 74.6% 26.9% 4270 59
Licensed Child Care Homes 0.0% 0.0% 0.0% 0.0% 33.3% 6.7% 45 6
Registered Child Care Homes 0.0% 19.0% 9.5% 0.0% 19.0% 4.9% 122 21
All facility types 3.5% 23.0% 4.4% 8.0% 58.1% 26.1% 4437 86
LWDA 10 Upper Rio Grande
Facility type No
n-t
rad
itio
nal
h
ou
rs
Off
ers
tr
ansp
ort
atio
n
Acc
red
itat
ion
Texa
s R
isin
g St
ar
Pe
rce
nt
serv
ing
any
sub
sid
ize
d
child
ren
Pe
rce
nt
of
en
rollm
en
t th
at
is s
ub
sid
ize
d
Nu
mb
er o
f ch
ildre
n e
nro
lled
Nu
mb
er o
f fa
cilit
ies
Licensed Child Care Centers 20.2% 40.4% 14.6% 21.3% 73.9% 34.5% 4468 69
Licensed Child Care Homes 16.7% 41.7% 0.0% 8.3% 41.7% 9.9% 91 12
Registered Child Care Homes 9.4% 34.4% 3.1% 6.3% 31.3% 15.4% 175 32
All facility types 17.3% 39.1% 10.5% 16.5% 58.4% 33.3% 4734 113

109
LWDA 11 Permian Basin
Facility type No
n-t
rad
itio
nal
h
ou
rs
Off
ers
tran
spo
rtat
ion
Acc
red
itat
ion
Texa
s R
isin
g St
ar
Pe
rcen
t se
rvin
g an
y su
bsi
diz
ed
child
ren
Pe
rcen
t o
f en
rollm
en
t th
at
is s
ub
sid
ized
Nu
mb
er o
f ch
ildre
n e
nro
lled
Nu
mb
er o
f fa
cilit
ies
Licensed Child Care Centers 1.1% 20.5% 2.3% 4.5% 68.1% 16.8% 5405 69
Licensed Child Care Homes 0.0% 10.0% 0.0% 10.0% 30.0% 8.2% 73 10
Registered Child Care Homes 0.0% 14.3% 0.0% 0.0% 0.0% 0.0% 31 7
All facility types 1.0% 19.0% 1.9% 4.8% 58.1% 16.6% 5509 86
LWDA 12 Concho Valley
Facility type No
n-t
rad
itio
nal
h
ou
rs
Off
ers
tr
ansp
ort
atio
n
Acc
red
itat
ion
Texa
s R
isin
g St
ar
Pe
rce
nt
serv
ing
any
sub
sid
ize
d
child
ren
Pe
rce
nt
of
en
rollm
en
t th
at
is s
ub
sid
ize
d
Nu
mb
er o
f ch
ildre
n e
nro
lled
Nu
mb
er o
f fa
cilit
ies
Licensed Child Care Centers 0.0% 15.4% 0.0% 5.8% 76.2% 18.5% 2656 42
Licensed Child Care Homes 25.0% 0.0% 25.0% 0.0% 50.0% 37.5% 16 4
Registered Child Care Homes 0.0% 0.0% 7.1% 0.0% 7.1% 1.4% 69 14
All facility types 1.4% 11.4% 2.9% 4.3% 58.3% 18.2% 2741 60

110
LWDA 13 Heart of Texas
Facility type No
n-t
rad
itio
nal
h
ou
rs
Off
ers
tran
spo
rtat
ion
Acc
red
itat
ion
Texa
s R
isin
g St
ar
Pe
rcen
t se
rvin
g an
y su
bsi
diz
ed
child
ren
Pe
rcen
t o
f en
rollm
en
t th
at
is s
ub
sid
ized
Nu
mb
er o
f ch
ildre
n e
nro
lled
Nu
mb
er o
f fa
cilit
ies
Licensed Child Care Centers 1.1% 28.4% 8.0% 15.9% 70.1% 21.5% 4967 67
Licensed Child Care Homes 0.0% 0.0% 0.0% 50.0% 66.7% 25.0% 44 6
Registered Child Care Homes 8.3% 0.0% 8.3% 0.0% 33.3% 16.9% 71 12
All facility types 1.9% 23.6% 7.5% 16.0% 64.7% 21.4% 5082 85
LWDA 14 Capital Area
Facility type No
n-t
rad
itio
nal
h
ou
rs
Off
ers
tr
ansp
ort
atio
n
Acc
red
itat
ion
Texa
s R
isin
g St
ar
Pe
rce
nt
serv
ing
any
sub
sid
ize
d
child
ren
Pe
rce
nt
of
en
rollm
en
t th
at
is s
ub
sid
ize
d
Nu
mb
er o
f ch
ildre
n e
nro
lled
Nu
mb
er o
f fa
cilit
ies
Licensed Child Care Centers 1.9% 13.6% 12.6% 11.7% 62.9% 10.4% 5300 70
Licensed Child Care Homes 0.0% 0.0% 18.2% 9.1% 18.2% 6.9% 72 11
Registered Child Care Homes 2.5% 12.5% 2.5% 5.0% 17.5% 5.6% 215 40
All facility types 1.9% 12.3% 10.4% 9.7% 43.8% 10.1% 5587 121

111
LWDA 15 Rural Capital
Facility type No
n-t
rad
itio
nal
h
ou
rs
Off
ers
tran
spo
rtat
ion
Acc
red
itat
ion
Texa
s R
isin
g St
ar
Pe
rcen
t se
rvin
g an
y su
bsi
diz
ed
child
ren
Pe
rcen
t o
f en
rollm
en
t th
at
is s
ub
sid
ized
Nu
mb
er o
f ch
ildre
n e
nro
lled
Nu
mb
er o
f fa
cilit
ies
Licensed Child Care Centers 0.9% 20.9% 12.7% 4.5% 64.1% 9.2% 6332 78
Licensed Child Care Homes 0.0% 12.5% 12.5% 0.0% 12.5% 6.3% 63 8
Registered Child Care Homes 6.3% 15.6% 6.3% 0.0% 21.9% 8.7% 172 32
All facility types 2.0% 19.3% 11.3% 3.3% 49.2% 9.2% 6567 118
LWDA 16 Brazos Valley
Facility type No
n-t
rad
itio
nal
h
ou
rs
Off
ers
tr
ansp
ort
atio
n
Acc
red
itat
ion
Texa
s R
isin
g St
ar
Pe
rce
nt
serv
ing
any
sub
sid
ize
d
child
ren
Pe
rce
nt
of
en
rollm
en
t th
at
is s
ub
sid
ize
d
Nu
mb
er o
f ch
ildre
n e
nro
lled
Nu
mb
er o
f fa
cilit
ies
Licensed Child Care Centers 1.2% 21.4% 26.2% 7.1% 73.4% 21.1% 4429 64
Licensed Child Care Homes 14.3% 14.3% 0.0% 0.0% 28.6% 7.7% 52 7
Registered Child Care Homes 11.1% 0.0% 0.0% 0.0% 33.3% 23.6% 89 18
All facility types 3.7% 17.4% 20.2% 5.5% 61.8% 21.0% 4570 89

112
LWDA 17 Deep East Texas
Facility type No
n-t
rad
itio
nal
h
ou
rs
Off
ers
tran
spo
rtat
ion
Acc
red
itat
ion
Texa
s R
isin
g St
ar
Pe
rcen
t se
rvin
g an
y su
bsi
diz
ed
child
ren
Pe
rcen
t o
f en
rollm
en
t th
at
is s
ub
sid
ized
Nu
mb
er o
f ch
ildre
n e
nro
lled
Nu
mb
er o
f fa
cilit
ies
Licensed Child Care Centers 6.3% 33.8% 3.8% 18.8% 62.1% 27.6% 4306 58
Licensed Child Care Homes 16.7% 0.0% 0.0% 16.7% 50.0% 8.7% 46 6
Registered Child Care Homes 0.0% 0.0% 14.3% 0.0% 28.6% 7.7% 39 7
All facility types 6.5% 29.0% 4.3% 17.2% 57.7% 27.2% 4391 71
LWDA 18 South East Texas
Facility type No
n-t
rad
itio
nal
h
ou
rs
Off
ers
tr
ansp
ort
atio
n
Acc
red
itat
ion
Texa
s R
isin
g St
ar
Pe
rce
nt
serv
ing
any
sub
sid
ize
d
child
ren
Pe
rce
nt
of
en
rollm
en
t th
at
is s
ub
sid
ize
d
Nu
mb
er o
f ch
ildre
n e
nro
lled
Nu
mb
er o
f fa
cilit
ies
Licensed Child Care Centers 8.1% 37.2% 5.8% 7.0% 73.8% 23.3% 5483 61
Licensed Child Care Homes 10.0% 0.0% 0.0% 0.0% 40.0% 16.4% 73 10
Registered Child Care Homes 7.7% 0.0% 0.0% 0.0% 7.7% 1.7% 59 13
All facility types 8.3% 29.4% 4.6% 5.5% 59.5% 22.9% 5615 84
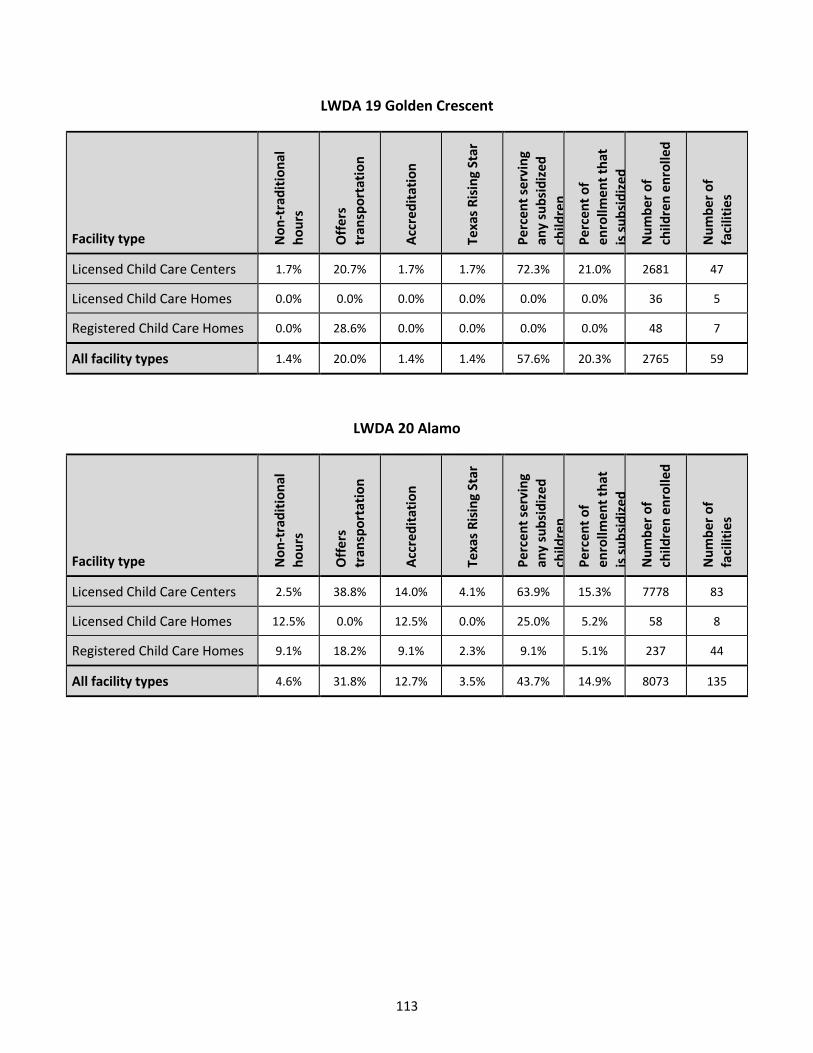
113
LWDA 19 Golden Crescent
Facility type No
n-t
rad
itio
nal
h
ou
rs
Off
ers
tran
spo
rtat
ion
Acc
red
itat
ion
Texa
s R
isin
g St
ar
Pe
rcen
t se
rvin
g an
y su
bsi
diz
ed
child
ren
Pe
rcen
t o
f en
rollm
en
t th
at
is s
ub
sid
ized
Nu
mb
er o
f ch
ildre
n e
nro
lled
Nu
mb
er o
f fa
cilit
ies
Licensed Child Care Centers 1.7% 20.7% 1.7% 1.7% 72.3% 21.0% 2681 47
Licensed Child Care Homes 0.0% 0.0% 0.0% 0.0% 0.0% 0.0% 36 5
Registered Child Care Homes 0.0% 28.6% 0.0% 0.0% 0.0% 0.0% 48 7
All facility types 1.4% 20.0% 1.4% 1.4% 57.6% 20.3% 2765 59
LWDA 20 Alamo
Facility type No
n-t
rad
itio
nal
h
ou
rs
Off
ers
tr
ansp
ort
atio
n
Acc
red
itat
ion
Texa
s R
isin
g St
ar
Pe
rce
nt
serv
ing
any
sub
sid
ize
d
child
ren
Pe
rce
nt
of
en
rollm
en
t th
at
is s
ub
sid
ize
d
Nu
mb
er o
f ch
ildre
n e
nro
lled
Nu
mb
er o
f fa
cilit
ies
Licensed Child Care Centers 2.5% 38.8% 14.0% 4.1% 63.9% 15.3% 7778 83
Licensed Child Care Homes 12.5% 0.0% 12.5% 0.0% 25.0% 5.2% 58 8
Registered Child Care Homes 9.1% 18.2% 9.1% 2.3% 9.1% 5.1% 237 44
All facility types 4.6% 31.8% 12.7% 3.5% 43.7% 14.9% 8073 135

114
LWDA 21 South Texas
Facility type No
n-t
rad
itio
nal
h
ou
rs
Off
ers
tran
spo
rtat
ion
Acc
red
itat
ion
Texa
s R
isin
g St
ar
Pe
rcen
t se
rvin
g an
y su
bsi
diz
ed
child
ren
Pe
rcen
t o
f en
rollm
en
t th
at
is s
ub
sid
ized
Nu
mb
er o
f ch
ildre
n e
nro
lled
Nu
mb
er o
f fa
cilit
ies
Licensed Child Care Centers 8.8% 23.8% 5.0% 13.8% 83.7% 50.8% 2779 49
Licensed Child Care Homes 0.0% 0.0% 0.0% 0.0% 50.0% 24.6% 61 8
Registered Child Care Homes 0.0% 0.0% 0.0% 11.1% 33.3% 16.3% 49 9
All facility types 7.2% 19.6% 4.1% 12.4% 72.7% 49.6% 2889 66
LWDA 22 Coastal Bend
Facility type No
n-t
rad
itio
nal
h
ou
rs
Off
ers
tr
ansp
ort
atio
n
Acc
red
itat
ion
Texa
s R
isin
g St
ar
Pe
rce
nt
serv
ing
any
sub
sid
ize
d
child
ren
Pe
rce
nt
of
en
rollm
en
t th
at
is s
ub
sid
ize
d
Nu
mb
er o
f ch
ildre
n e
nro
lled
Nu
mb
er o
f fa
cilit
ies
Licensed Child Care Centers 1.1% 8.8% 3.3% 9.9% 84.6% 25.1% 4070 65
Licensed Child Care Homes 0.0% 11.1% 11.1% 11.1% 66.7% 23.6% 72 9
Registered Child Care Homes 9.1% 18.2% 0.0% 0.0% 18.2% 14.0% 136 22
All facility types 2.5% 10.7% 3.3% 8.2% 67.7% 24.8% 4278 96

115
LWDA 23 Lower Rio Grande Valley
Facility type No
n-t
rad
itio
nal
h
ou
rs
Off
ers
tran
spo
rtat
ion
Acc
red
itat
ion
Texa
s R
isin
g St
ar
Pe
rcen
t se
rvin
g an
y su
bsi
diz
ed
child
ren
Pe
rcen
t o
f en
rollm
en
t th
at
is s
ub
sid
ized
Nu
mb
er o
f ch
ildre
n e
nro
lled
Nu
mb
er o
f fa
cilit
ies
Licensed Child Care Centers 6.2% 46.4% 3.1% 10.3% 95.1% 45.9% 2864 61
Licensed Child Care Homes 16.7% 58.3% 0.0% 25.0% 66.7% 46.4% 84 12
Registered Child Care Homes 17.2% 20.7% 6.9% 0.0% 41.4% 24.7% 170 29
All facility types 9.4% 42.0% 3.6% 9.4% 76.5% 44.8% 3118 102
LWDA 24 Cameron County
Facility type No
n-t
rad
itio
nal
h
ou
rs
Off
ers
tr
ansp
ort
atio
n
Acc
red
itat
ion
Texa
s R
isin
g St
ar
Pe
rce
nt
serv
ing
any
sub
sid
ize
d
child
ren
Pe
rce
nt
of
en
rollm
en
t th
at
is s
ub
sid
ize
d
Nu
mb
er o
f ch
ildre
n e
nro
lled
Nu
mb
er o
f fa
cilit
ies
Licensed Child Care Centers 6.9% 50.6% 8.0% 12.6% 82.1% 42.9% 2775 56
Licensed Child Care Homes 0.0% 12.5% 12.5% 12.5% 50.0% 37.3% 51 8
Registered Child Care Homes 0.0% 10.0% 10.0% 0.0% 20.0% 10.2% 59 10
All facility types 5.7% 43.8% 8.6% 11.4% 70.3% 42.1% 2885 74

116
LWDA 25 Texoma
Facility type No
n-t
rad
itio
nal
h
ou
rs
Off
ers
tran
spo
rtat
ion
Acc
red
itat
ion
Texa
s R
isin
g St
ar
Pe
rcen
t se
rvin
g an
y su
bsi
diz
ed
child
ren
Pe
rcen
t o
f en
rollm
en
t th
at
is s
ub
sid
ized
Nu
mb
er o
f
child
ren
en
rolle
d
Nu
mb
er o
f fa
cilit
ies
Licensed Child Care Centers 2.1% 39.6% 2.1% 12.5% 69.4% 24.9% 2518 36
Licensed Child Care Homes 0.0% 0.0% 0.0% 0.0% 66.7% 31.6% 38 6
Registered Child Care Homes 41.7% 8.3% 8.3% 0.0% 33.3% 7.0% 71 12
All facility types 9.1% 30.3% 3.0% 9.1% 61.1% 24.5% 2627 54
LWDA 26 Central Texas
Facility type No
n-t
rad
itio
nal
h
ou
rs
Off
ers
tran
spo
rtat
ion
Acc
red
itat
ion
Texa
s R
isin
g St
ar
Pe
rce
nt
serv
ing
any
sub
sid
ize
d
child
ren
Pe
rce
nt
of
en
rollm
en
t th
at
is s
ub
sid
ize
d
Nu
mb
er o
f
child
ren
en
rolle
d
Nu
mb
er o
f fa
cilit
ies
Licensed Child Care Centers 24.4% 26.7% 29.1% 7.0% 82.3% 21.0% 4173 62
Licensed Child Care Homes 50.0% 25.0% 0.0% 25.0% 100.0% 25.0% 32 4
Registered Child Care Homes 44.8% 13.8% 10.3% 0.0% 6.9% 2.6% 155 29
All facility types 30.3% 23.5% 23.5% 5.9% 60.0% 20.4% 4360 95

117
LWDA 27 Middle Rio Grande
Facility type No
n-t
rad
itio
nal
h
ou
rs
Off
ers
tran
spo
rtat
ion
Acc
red
itat
ion
Texa
s R
isin
g St
ar
Pe
rcen
t se
rvin
g an
y su
bsi
diz
ed
child
ren
Pe
rcen
t o
f en
rollm
en
t th
at
is s
ub
sid
ized
Nu
mb
er o
f
child
ren
en
rolle
d
Nu
mb
er o
f fa
cilit
ies
Licensed Child Care Centers 0.0% 21.3% 6.4% 21.3% 79.2% 32.7% 1381 24
Licensed Child Care Homes 0.0% 0.0% 0.0% 0.0% 0.0% 0.0% 10 3
Registered Child Care Homes 0.0% 0.0% 0.0% 0.0% 0.0% 0.0% 23 4
All facility types 0.0% 18.5% 5.6% 18.5% 61.3% 32.0% 1414 31
LWDA 28 Gulf Coast
Facility type No
n-t
rad
itio
nal
h
ou
rs
Off
ers
tran
spo
rtat
ion
Acc
red
itat
ion
Texa
s R
isin
g St
ar
Pe
rce
nt
serv
ing
any
sub
sid
ize
d
child
ren
Pe
rce
nt
of
en
rollm
en
t th
at
is s
ub
sid
ize
d
Nu
mb
er o
f
child
ren
en
rolle
d
Nu
mb
er o
f fa
cilit
ies
Licensed Child Care Centers 6.1% 35.2% 7.0% 6.1% 52.6% 13.1% 13301 156
Licensed Child Care Homes 9.5% 14.3% 14.3% 9.5% 14.3% 5.2% 134 21
Registered Child Care Homes 11.3% 28.2% 0.0% 0.0% 9.9% 6.5% 336 71
All facility types 7.5% 32.3% 5.9% 5.0% 37.1% 12.8% 13771 248


4.2 SPECIAL ANALYSES — ADMINISTRATIVE CATEGORIES


121
Table 4.2.1 Special Analyses: Texas Administrative Categories
Non-Profit For-Profit Community based Number of
Facilities Sectarian Non-
sectarian Sectarian
Non-sectarian
Non-profit
For-profit
Licensed Child Care Centers
9% 18% 1% 71% 2% 0% 1855
Licensed Child Care Homes
0% 2% 1% 97% 0% 1% 230
Registered Child Care Homes
0% 4% 0% 95% 0% 1% 631
All facility types 6% 13% 1% 80% 1% 0% 2716

122
Table 4.2.2 Special Analyses: Administrative Categories by LWDA
LWDA 1 Panhandle
Non-Profit For-Profit Community based Number of
Facilities
All facilities sampled Sectarian
Non-sectarian
Sectarian Non-
sectarian Non-profit
For-profit
Licensed Child Care Centers
16% 23% 1% 60% 3% 1% 59 N
Licensed Child Care Homes
0% 13% 0% 88% 0% 0% 8 N
Registered Child Care Homes
0% 4% 0% 96% 0% 0% 28 N
All facility types 11% 17% 1% 71% 2% 1% 95 .
LWDA 2 South Plains
Non-Profit For-Profit Community based Number of
Facilities
All facilities sampled Sectarian
Non-sectarian
Sectarian Non-
sectarian Non-profit
For-profit
Licensed Child Care Centers
7% 21% 2% 70% 12% 0% 63 N
Licensed Child Care Homes
0% 0% 17% 83% 0% 0% 6 N
Registered Child Care Homes
0% 7% 0% 93% 0% 0% 15 Y
All facility types 6% 18% 3% 74% 9% 0% 84 .

123
LWDA 3 North Texas
Non-Profit For-Profit Community based Number of
Facilities
All facilities sampled Sectarian
Non-sectarian
Sectarian Non-
sectarian Non-profit
For-profit
Licensed Child Care Centers
27% 8% 1% 64% 6% 0% 47 Y
Licensed Child Care Homes
0% 0% 0% 100% 0% 0% 10 N
Registered Child Care Homes
0% 0% 0% 100% 0% 0% 19 Y
All facility types 20% 6% 1% 74% 5% 0% 76 .
LWDA 4 North Central Texas
Non-Profit For-Profit Community based Number of
Facilities
All facilities sampled Sectarian
Non-sectarian
Sectarian Non-
sectarian Non-profit
For-profit
Licensed Child Care Centers
7% 12% 1% 80% 1% 0% 105 N
Licensed Child Care Homes
0% 0% 0% 100% 0% 0% 10 N
Registered Child Care Homes
0% 0% 3% 97% 0% 0% 32 N
All facility types 6% 10% 1% 84% 1% 0% 147 .

124
LWDA 5 Tarrant County
Non-Profit For-Profit Community based Number of
Facilities
All facilities sampled Sectarian
Non-sectarian
Sectarian Non-
sectarian Non-profit
For-profit
Licensed Child Care Centers
7% 29% 2% 63% 0% 0% 93 N
Licensed Child Care Homes
0% 0% 0% 100% 0% 0% 14 N
Registered Child Care Homes
0% 0% 0% 100% 0% 5% 44 N
All facility types 5% 19% 1% 75% 0% 1% 151 .
LWDA 6 Dallas
Non-Profit For-Profit Community based Number of
Facilities
All facilities sampled Sectarian
Non-sectarian
Sectarian Non-
sectarian Non-profit
For-profit
Licensed Child Care Centers
8% 15% 2% 75% 0% 0% 81 N
Licensed Child Care Homes
0% 0% 0% 100% 0% 0% 5 N
Registered Child Care Homes
0% 8% 0% 92% 0% 3% 38 N
All facility types 6% 13% 1% 79% 0% 1% 124 .

125
LWDA 7 North East Texas
Non-Profit For-Profit Community based Number of
Facilities
All facilities sampled Sectarian
Non-sectarian
Sectarian Non-
sectarian Non-profit
For-profit
Licensed Child Care Centers
15% 17% 4% 63% 1% 0% 55 Y
Licensed Child Care Homes
0% 0% 0% 100% 0% 0% 6 N
Registered Child Care Homes
0% 0% 0% 100% 0% 0% 8 Y
All facility types 13% 14% 4% 69% 1% 0% 69 .
LWDA 8 East Texas
Non-Profit For-Profit Community based Number of
Facilities
All facilities sampled Sectarian
Non-sectarian
Sectarian Non-
sectarian Non-profit
For-profit
Licensed Child Care Centers
19% 19% 1% 61% 0% 0% 76 N
Licensed Child Care Homes
0% 0% 0% 100% 0% 0% 7 N
Registered Child Care Homes
0% 7% 0% 93% 0% 0% 14 Y
All facility types 15% 16% 1% 68% 0% 0% 97 .

126
LWDA 9 West Central Texas
Non-Profit For-Profit Community based Number of
Facilities
All facilities sampled Sectarian
Non-sectarian
Sectarian Non-
sectarian Non-profit
For-profit
Licensed Child Care Centers
13% 30% 2% 55% 0% 0% 59 N
Licensed Child Care Homes
0% 17% 0% 83% 0% 0% 6 N
Registered Child Care Homes
0% 5% 0% 95% 0% 0% 21 N
All facility types 10% 25% 2% 64% 0% 0% 86 .
LWDA 10 Upper Rio Grande
Non-Profit For-Profit Community based Number of
Facilities
All facilities sampled Sectarian
Non-sectarian
Sectarian Non-
sectarian Non-profit
For-profit
Licensed Child Care Centers
8% 36% 0% 56% 8% 0% 69 N
Licensed Child Care Homes
0% 0% 0% 100% 0% 0% 12 N
Registered Child Care Homes
0% 0% 0% 100% 0% 0% 32 N
All facility types 5% 24% 0% 71% 5% 0% 113 .

127
LWDA 11 Permian Basin
Non-Profit For-Profit Community based Number of
Facilities
All facilities sampled Sectarian
Non-sectarian
Sectarian Non-
sectarian Non-profit
For-profit
Licensed Child Care Centers
16% 27% 0% 57% 10% 0% 69 N
Licensed Child Care Homes
0% 0% 0% 100% 0% 0% 10 N
Registered Child Care Homes
0% 14% 0% 86% 0% 0% 7 Y
All facility types 13% 24% 0% 63% 9% 0% 86 .
LWDA 12 Concho Valley
Non-Profit For-Profit Community based Number of
Facilities
All facilities sampled Sectarian
Non-sectarian
Sectarian Non-
sectarian Non-profit
For-profit
Licensed Child Care Centers
21% 37% 2% 40% 0% 0% 42 Y
Licensed Child Care Homes
0% 25% 0% 75% 0% 0% 4 Y
Registered Child Care Homes
0% 0% 0% 100% 0% 0% 14 Y
All facility types 16% 29% 1% 54% 0% 0% 60 .
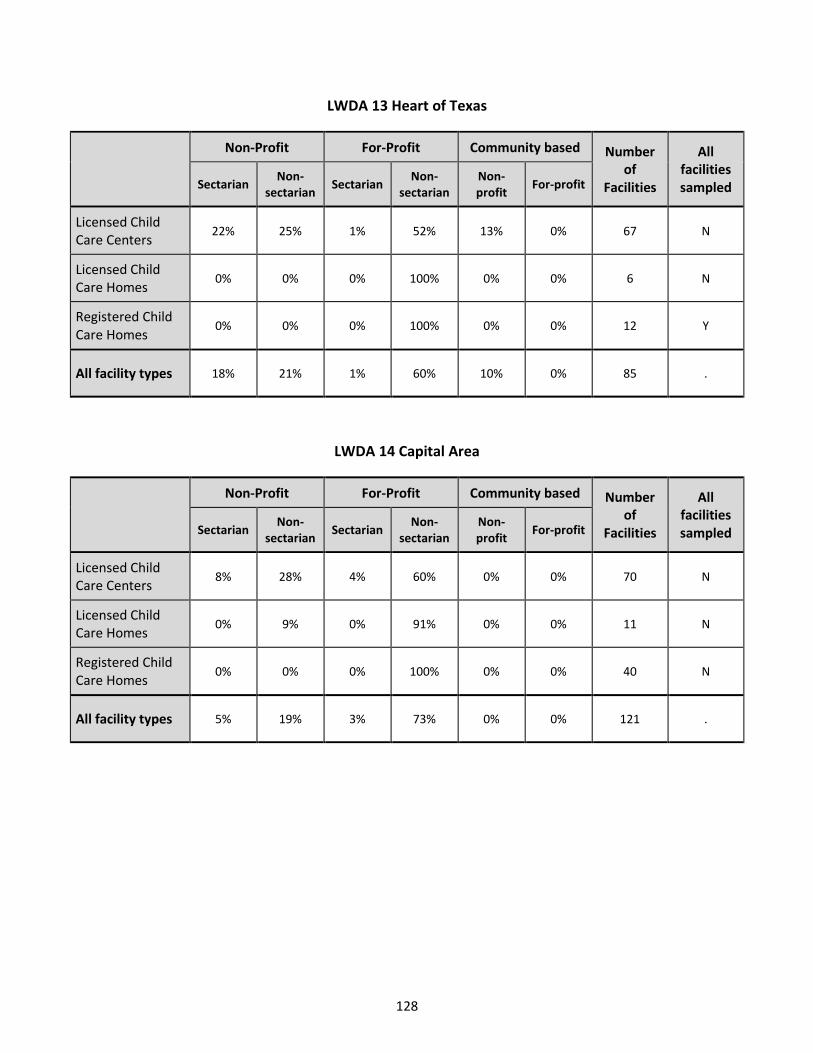
128
LWDA 13 Heart of Texas
Non-Profit For-Profit Community based Number of
Facilities
All facilities sampled Sectarian
Non-sectarian
Sectarian Non-
sectarian Non-profit
For-profit
Licensed Child Care Centers
22% 25% 1% 52% 13% 0% 67 N
Licensed Child Care Homes
0% 0% 0% 100% 0% 0% 6 N
Registered Child Care Homes
0% 0% 0% 100% 0% 0% 12 Y
All facility types 18% 21% 1% 60% 10% 0% 85 .
LWDA 14 Capital Area
Non-Profit For-Profit Community based Number of
Facilities
All facilities sampled Sectarian
Non-sectarian
Sectarian Non-
sectarian Non-profit
For-profit
Licensed Child Care Centers
8% 28% 4% 60% 0% 0% 70 N
Licensed Child Care Homes
0% 9% 0% 91% 0% 0% 11 N
Registered Child Care Homes
0% 0% 0% 100% 0% 0% 40 N
All facility types 5% 19% 3% 73% 0% 0% 121 .

129
LWDA 15 Rural Capital
Non-Profit For-Profit Community based Number of
Facilities
All facilities sampled Sectarian
Non-sectarian
Sectarian Non-
sectarian Non-profit
For-profit
Licensed Child Care Centers
8% 25% 1% 66% 16% 0% 78 N
Licensed Child Care Homes
0% 0% 0% 100% 0% 0% 8 N
Registered Child Care Homes
0% 0% 3% 97% 0% 3% 32 N
All facility types 6% 18% 1% 75% 12% 1% 118 .
LWDA 16 Brazos Valley
Non-Profit For-Profit Community based Number of
Facilities
All facilities sampled Sectarian
Non-sectarian
Sectarian Non-
sectarian Non-profit
For-profit
Licensed Child Care Centers
19% 7% 1% 73% 0% 1% 64 N
Licensed Child Care Homes
0% 0% 0% 100% 0% 0% 7 N
Registered Child Care Homes
0% 6% 0% 94% 0% 0% 18 Y
All facility types 15% 6% 1% 78% 0% 1% 89 .

130
LWDA 17 Deep East Texas
Non-Profit For-Profit Community based Number of
Facilities
All facilities sampled Sectarian
Non-sectarian
Sectarian Non-
sectarian Non-profit
For-profit
Licensed Child Care Centers
19% 11% 3% 68% 1% 0% 58 Y
Licensed Child Care Homes
0% 17% 0% 83% 0% 0% 6 N
Registered Child Care Homes
0% 0% 0% 100% 0% 0% 7 Y
All facility types 16% 11% 2% 71% 1% 0% 71 .
LWDA 18 South East Texas
Non-Profit For-Profit Community based Number of
Facilities
All facilities sampled Sectarian
Non-sectarian
Sectarian Non-
sectarian Non-profit
For-profit
Licensed Child Care Centers
9% 13% 2% 76% 8% 0% 61 N
Licensed Child Care Homes
0% 10% 0% 90% 0% 0% 10 N
Registered Child Care Homes
0% 0% 0% 100% 0% 0% 13 Y
All facility types 7% 11% 2% 80% 6% 0% 84 .

131
LWDA 19 Golden Crescent
Non-Profit For-Profit Community based Number of
Facilities
All facilities sampled Sectarian
Non-sectarian
Sectarian Non-
sectarian Non-profit
For-profit
Licensed Child Care Centers
14% 29% 0% 57% 0% 0% 47 Y
Licensed Child Care Homes
0% 0% 0% 100% 0% 0% 5 N
Registered Child Care Homes
0% 0% 0% 100% 0% 0% 7 Y
All facility types 11% 24% 0% 64% 0% 0% 59 .
LWDA 20 Alamo
Non-Profit For-Profit Community based Number of
Facilities
All facilities sampled Sectarian
Non-sectarian
Sectarian Non-
sectarian Non-profit
For-profit
Licensed Child Care Centers
16% 10% 0% 74% 1% 0% 83 N
Licensed Child Care Homes
0% 13% 0% 88% 0% 0% 8 N
Registered Child Care Homes
0% 7% 0% 93% 0% 2% 44 N
All facility types 11% 9% 0% 80% 1% 1% 135 .
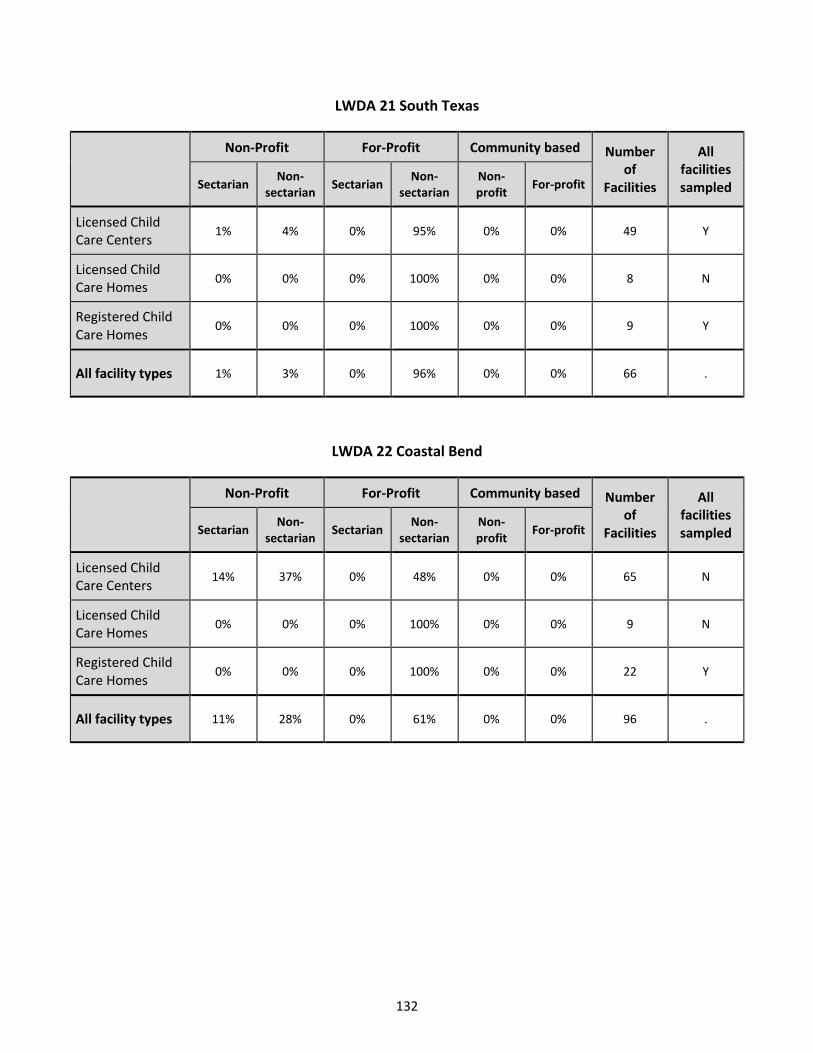
132
LWDA 21 South Texas
Non-Profit For-Profit Community based Number of
Facilities
All facilities sampled Sectarian
Non-sectarian
Sectarian Non-
sectarian Non-profit
For-profit
Licensed Child Care Centers
1% 4% 0% 95% 0% 0% 49 Y
Licensed Child Care Homes
0% 0% 0% 100% 0% 0% 8 N
Registered Child Care Homes
0% 0% 0% 100% 0% 0% 9 Y
All facility types 1% 3% 0% 96% 0% 0% 66 .
LWDA 22 Coastal Bend
Non-Profit For-Profit Community based Number of
Facilities
All facilities sampled Sectarian
Non-sectarian
Sectarian Non-
sectarian Non-profit
For-profit
Licensed Child Care Centers
14% 37% 0% 48% 0% 0% 65 N
Licensed Child Care Homes
0% 0% 0% 100% 0% 0% 9 N
Registered Child Care Homes
0% 0% 0% 100% 0% 0% 22 Y
All facility types 11% 28% 0% 61% 0% 0% 96 .

133
LWDA 23 Lower Rio Grande Valley
Non-Profit For-Profit Community based Number of
Facilities
All facilities sampled Sectarian
Non-sectarian
Sectarian Non-
sectarian Non-profit
For-profit
Licensed Child Care Centers
1% 12% 0% 87% 0% 0% 61 N
Licensed Child Care Homes
0% 0% 0% 100% 0% 0% 12 N
Registered Child Care Homes
0% 3% 3% 93% 3% 0% 29 N
All facility types 1% 9% 1% 89% 1% 0% 102 .
LWDA 24 Cameron County
Non-Profit For-Profit Community based Number of
Facilities
All facilities sampled Sectarian
Non-sectarian
Sectarian Non-
sectarian Non-profit
For-profit
Licensed Child Care Centers
5% 3% 0% 92% 0% 0% 56 N
Licensed Child Care Homes
0% 0% 0% 100% 0% 0% 8 N
Registered Child Care Homes
0% 10% 0% 90% 0% 0% 10 Y
All facility types 4% 4% 0% 92% 0% 0% 74 .

134
LWDA 25 Texoma
Non-Profit For-Profit Community based Number of
Facilities
All facilities sampled Sectarian
Non-sectarian
Sectarian Non-
sectarian Non-profit
For-profit
Licensed Child Care Centers
17% 15% 2% 67% 0% 0% 36 Y
Licensed Child Care Homes
0% 0% 0% 100% 0% 0% 6 N
Registered Child Care Homes
0% 0% 0% 100% 0% 0% 12 Y
All facility types 12% 11% 2% 76% 0% 0% 54 .
LWDA 26 Central Texas
Non-Profit For-Profit Community based Number of
Facilities
All facilities sampled Sectarian
Non-sectarian
Sectarian Non-
sectarian Non-profit
For-profit
Licensed Child Care Centers
7% 27% 1% 65% 0% 0% 62 N
Licensed Child Care Homes
0% 0% 0% 100% 0% 0% 4 N
Registered Child Care Homes
0% 7% 0% 93% 0% 0% 29 N
All facility types 5% 21% 1% 73% 0% 0% 95 .

135
LWDA 27 Middle Rio Grande
Non-Profit For-Profit Community based Number of
Facilities
All facilities sampled Sectarian
Non-sectarian
Sectarian Non-
sectarian Non-profit
For-profit
Licensed Child Care Centers
4% 6% 0% 89% 0% 0% 24 Y
Licensed Child Care Homes
0% 33% 0% 67% 0% 0% 3 Y
Registered Child Care Homes
0% 25% 0% 75% 0% 0% 4 Y
All facility types 4% 9% 0% 87% 0% 0% 31 .
LWDA 28 Gulf Coast
Non-Profit For-Profit Community based Number of
Facilities
All facilities sampled Sectarian
Non-sectarian
Sectarian Non-
sectarian Non-profit
For-profit
Licensed Child Care Centers
7% 17% 1% 75% 0% 0% 156 N
Licensed Child Care Homes
0% 0% 5% 95% 0% 5% 21 N
Registered Child Care Homes
0% 6% 0% 94% 0% 0% 71 N
All facility types 5% 13% 1% 80% 0% 1% 248 .

APPENDICES

A-1
APPENDIX A. DATA ANALYSIS
It is important to note that all of the daily market rate percentiles presented in this report are
based on large and statistically reliable sample sizes. Even in the scarcest categories of care, such as part-
day infant and toddler care in Licensed Homes, and part-day infant care in Registered Homes, the numbers
of rates gathered were sufficient for estimating highly stable rates, due to innovations in the estimation
methodology described below.
Levels of Analysis
Project researchers summarized the survey data and conducted analysis at several distinct levels.
The most basic analyses were done at the level of individual providers. These results document the
proportion of providers responding to the survey that offer various services (e.g., non-traditional hours,
transportation), or that fall into different administrative categories (e.g., sectarian, community-based, and
for-profit). The exception to this rule is the item in section four that measures the “percent of enrollment
that is subsidized,” which is analyzed at the level of the individual child. A similar item concerns the
percentage of facilities that serve any subsidized children. When this number is higher than the “percent
of enrollment” number, it indicates that the subsidized children in an area are widely dispersed among
facilities, and when it is lower, it indicates that the subsidized children are relatively concentrated among
a smaller number of facilities in the area.
The remaining analyses were conducted at either the rate observation level or at the level of the
child care slot, as described below. Each center or home-based facility can contribute more than one rate
observation to the analysis, and each rate observation can represent more than one slot. However, the
nature of this relationship depends on the type of facility.
Daily market rates for licensed centers were gathered for all categories of care offered, regardless
of whether any children were currently being served in such categories. The categories consisted of all
possible combinations of age group (gathered for actual age categories in which each center offered rates,
but aggregated to the four standard categories for reporting) by full-time status (part-day or full-day).
Thus, one center could contribute as many as eight independent rate observations, each representing any
number of children (including zero). These rate observations were then weighted by the number of child
care slots they represent (described below) when calculating market rate percentiles.
In contrast, market rates for home-based facilities, including registered homes and licensed
homes, were gathered at the level of the individual child currently being served. Each child’s age, detailed
weekly schedule, and rates charged were gathered for purposes of calculating daily market rates. In this
case, the individual children were treated as independent rate observations, and each facility could
contribute as many as nine observations (or fewer depending on the facility type and number of children
enrolled). Because of this, there was no need to differentially weight the rate observations when
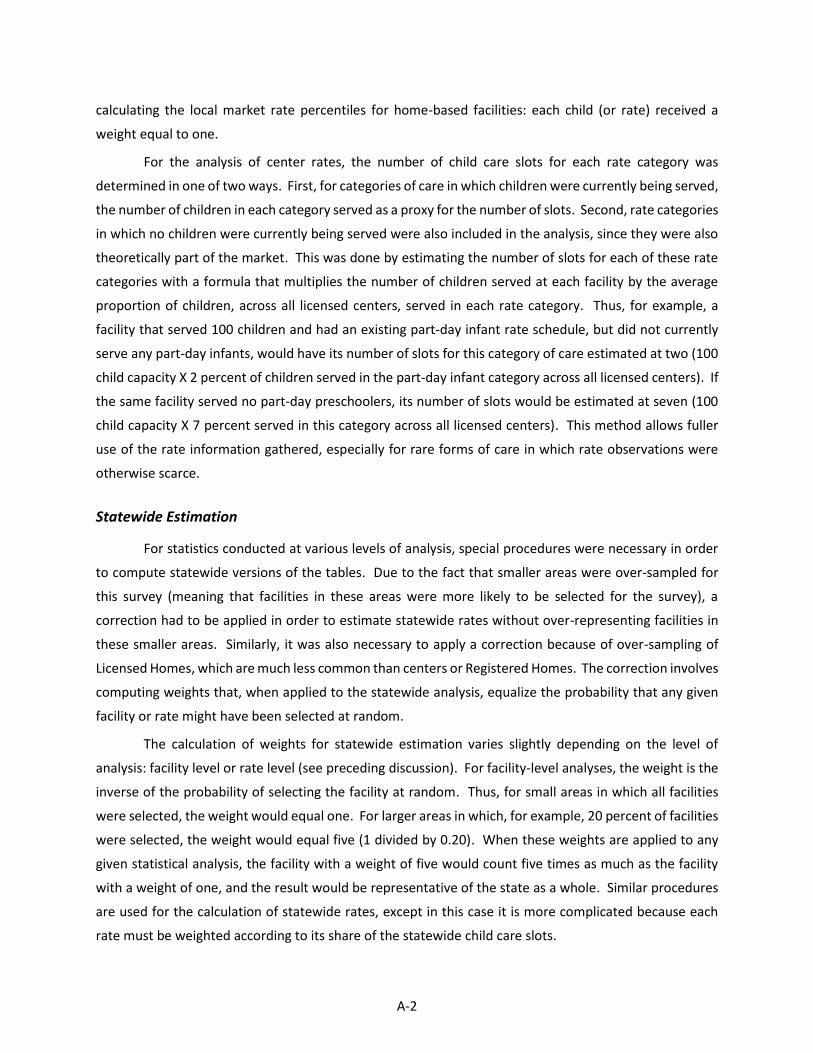
A-2
calculating the local market rate percentiles for home-based facilities: each child (or rate) received a
weight equal to one.
For the analysis of center rates, the number of child care slots for each rate category was
determined in one of two ways. First, for categories of care in which children were currently being served,
the number of children in each category served as a proxy for the number of slots. Second, rate categories
in which no children were currently being served were also included in the analysis, since they were also
theoretically part of the market. This was done by estimating the number of slots for each of these rate
categories with a formula that multiplies the number of children served at each facility by the average
proportion of children, across all licensed centers, served in each rate category. Thus, for example, a
facility that served 100 children and had an existing part-day infant rate schedule, but did not currently
serve any part-day infants, would have its number of slots for this category of care estimated at two (100
child capacity X 2 percent of children served in the part-day infant category across all licensed centers). If
the same facility served no part-day preschoolers, its number of slots would be estimated at seven (100
child capacity X 7 percent served in this category across all licensed centers). This method allows fuller
use of the rate information gathered, especially for rare forms of care in which rate observations were
otherwise scarce.
Statewide Estimation
For statistics conducted at various levels of analysis, special procedures were necessary in order
to compute statewide versions of the tables. Due to the fact that smaller areas were over-sampled for
this survey (meaning that facilities in these areas were more likely to be selected for the survey), a
correction had to be applied in order to estimate statewide rates without over-representing facilities in
these smaller areas. Similarly, it was also necessary to apply a correction because of over-sampling of
Licensed Homes, which are much less common than centers or Registered Homes. The correction involves
computing weights that, when applied to the statewide analysis, equalize the probability that any given
facility or rate might have been selected at random.
The calculation of weights for statewide estimation varies slightly depending on the level of
analysis: facility level or rate level (see preceding discussion). For facility-level analyses, the weight is the
inverse of the probability of selecting the facility at random. Thus, for small areas in which all facilities
were selected, the weight would equal one. For larger areas in which, for example, 20 percent of facilities
were selected, the weight would equal five (1 divided by 0.20). When these weights are applied to any
given statistical analysis, the facility with a weight of five would count five times as much as the facility
with a weight of one, and the result would be representative of the state as a whole. Similar procedures
are used for the calculation of statewide rates, except in this case it is more complicated because each
rate must be weighted according to its share of the statewide child care slots.

A-3
Small-Area Estimation
In many smaller LWDAs and for some exceptionally rare rate categories (particularly part-day care
in homes) the number of rate observations would have been too small to estimate stable rates using
traditional methods, even for the many areas in which the entire universe of facilities had been sampled.
For this reason, an estimation methodology first developed for the 2010 survey was used. Using this
approach, parameters are estimated that fully characterize the distribution of rates in each category of
care. These parameters are then applied, using an assumption of normality of the rate distributions, to
estimate each rate percentile of interest. The primary advantage of this solution is that a medium to large
sample size of rates is utilized to estimate each parameter, and thus the estimates based on this
methodology are more stable over time, and they fall into the expected patterns more frequently.
Prior to any estimation of parameters, the daily rates themselves are first transformed to make
them assume a more normal distribution. This transformation is done by taking the positive square root
of the daily rate. The effect of this is to minimize the effect of high-end outliers on estimates of the
parameters of distributions7. This transformation is reversed later, following all estimation, by squaring
the rates. The next step in the estimation of parameters involves estimating area effects, the average rate
for each LWDA, while statistically controlling for all other features of the rates involved in the estimation
(including facility type, age group, and rate type). The average rates for all 28 LWDAs are listed in Table
A-1. Note that North Central Texas (LWDA 4) has the highest rates, and Lower Rio Grande Valley (LWDA
23) has the lowest rates in the state.
7 High rates have greater influence on estimates of the distribution of daily rates due to the simple fact that rates cannot go below zero, but there is no effective upper limit. Square root transformation mutes this influence.

A-4
Levels of variation among rates in each area, as indicated by the standard deviation measure, are
also listed for LWDAs in the last column of Table A-1. Note that those areas with the highest average rates
also tended to have greater variation or spread among rates. Note also that the average level and spread
of rates in each LWDA was estimated with 160 or more rate observations. Thus these parameters are
estimated with a high level of precision.
The next step involves estimating the typical patterns among rates of varying facility type, age
group, and rate type, while holding constant the area effects measured above. This estimation was done
using one model for licensed centers that included independent predictor variables for each of the eight
combinations of age group and full-day vs. part-day rate. A second model was used to estimate these
parameters for all homes combined, but in addition to the eight variables, a ninth variable was included
that coded for whether it was a Licensed or Registered Home. Results of this estimation are shown in
Table A-2. In this case the typical rates are shown in standard deviation units. Thus the first row of Table
A-2 can be interpreted to mean that full-day infant rates tend to be roughly a full standard deviation
higher than the average rate.

A-5
Table A-1. Area Effects, Untransformed Rates
LWDA Observations Average8 St. dev.
1 Panhandle 515 20.50 4.39
2 South Plains 402 18.87 3.84
3 North Texas 410 17.02 4.54
4 North Central Texas 677 28.80 7.54
5 Tarrant County 735 27.28 7.13
6 Dallas 590 23.43 7.01
7 North East Texas 341 16.97 4.01
8 East Texas 489 18.20 4.29
9 West Central Texas 408 17.88 4.55
10 Upper Rio Grande 623 17.88 4.92
11 Permian Basin 367 20.26 3.95
12 Concho Valley 234 18.26 3.36
13 Heart of Texas 397 18.27 4.82
14 Capital Area 534 28.07 7.04
15 Rural Capital 541 26.29 7.05
16 Brazos Valley 411 21.80 5.89
17 Deep East Texas 400 17.18 4.39
18 South East Texas 433 18.68 4.62
19 Golden Crescent 278 18.72 3.83
20 Alamo 696 24.97 5.96
21 South Texas 419 18.35 4.97
22 Coastal Bend 471 19.86 5.73
23 Lower Rio Grande Valley 650 15.47 5.04
24 Cameron County 431 16.44 5.28
25 Texoma 296 20.10 4.63
26 Central Texas 436 18.79 3.90
27 Middle Rio Grande 164 17.30 4.78
28 Gulf Coast 1229 23.96 6.44
8 For ease of illustration, figures in this table represent the average and standard deviations of untransformed rates, though transformed rates were used in actual calculations.

A-6
Table A-2. Rate Type Effects
Facility Type Age Group Rate type Observations9 Deviation from Average Rate
Licensed Child Care Centers
Infant Full-day 1188 1.04
Part-day 246 0.30
Toddler Full-day 1392 0.72
Part-day 387 0.05
Preschool Full-day 1465 0.51
Part-day 1421 -0.83
School age Full-day 820 0.36
Part-day 1422 -1.00
Licensed Child Care Homes
Infant Full-day 303 0.35
Part-day 5 (3) -0.73
Toddler Full-day 800 0.21
Part-day 27 (8) 0.06
Preschool Full-day 343 0.00
Part-day 116 (60) -1.03
School age Full-day 13 -0.43
Part-day 237 (132) -1.31
Registered Child Care Homes
Infant Full-day 626 0.38
Part-day 14 (7) -0.32
Toddler Full-day 1440 0.12
Part-day 57 (20) -0.37
Preschool Full-day 515 -0.03
Part-day 181 -1.26
School age Full-day 33 -0.45
Part-day 526 -1.42
9 Figures in bold indicate totals including rates added from the prior year’s survey, as described in the text, while the figures in parentheses are the numbers from the prior year.

A-7
Note that in almost all cases the number of observations in Table A-2 is more than sufficient for
estimating the patterns among rates to a high degree of precision. The only exceptions to this are for
certain categories of part-day care in homes. As discussed in the analysis and trends section of the main
paper, persistently low shares of facilities offering part-day care are responsible for the low numbers of
rates in these categories. As a solution to this shortfall, the number of rates in six of these categories
was bolstered by including six rare categories of part-day home rates from the 2015 survey, adjusted
with an inflation factor to make them comparable to 2016 rates. These six categories are shown in
Table A-2 with the total number of observations in bold, and the number incorporated as estimates
from 2015 rates in parentheses. With these additions, this should be just enough to estimate stable
rates in most cases.
Finally, the 28 area effects from Table A-1 are recombined with the 24 rate type effects from
Table A-2 to estimate the parameters (mean and standard deviation) of the distributions of all 672
categories of care in the full report. Using these parameters together with known properties of normal
distributions, one can then estimate percentiles of the rate distributions for all categories of care. As
described above, these figures are then squared to undo the transformation described above. On the
whole, the resulting percentile estimates were found to be much more stable over time, in comparison
to estimates made for small areas using the methodology of market rate surveys prior to 2010.

B-1
APPENDIX B. QUESTIONNAIRES: LICENSED CHILD CARE CENTERS
1. Date:_________________________
2. Interviewer:______________________________
3. Hi, Can I please speak to the director of (CENTER NAME). Hi my name is ___________and I’m calling from the University of Texas at Austin on behalf of the Texas Workforce Commission. We are conducting the annual childcare market rate study. Do you have about 3-5 minutes to answer questions about your center?
Accept - Continue with survey
Refusal
Overdial
Not eligible
Wrong number - New number is available ____________________
Withdrew
4. Does your facility offer full-time child care at least 6 hours per day and five days a week?
5. If no, does your facility offer school care or part-day child care (<6 hours) five days a week?
6. Is your facility any of the following?
Only a drop-in care center (no regular rates; i.e., gym, hospital, mall)
A Head Start program
A free child care service
A facility not open to the public/only serves specific groups
A facility offering only summer camps
A kindergarten or school not offering regular child care or after-school care
None of the above- Continue Survey
7. What are your hours of operation (M-F)?
Weekday Open Close
Monday
Tuesday
Wednesday
Thursday
Friday
8. What are your hours of operation on Saturday and Sunday, if any?
Weekday Open Close
Saturday
Sunday

B-2
9. How many days out of the year do you close for national, state, or religious holidays?
10. Outside of weekends and holidays, how many days out of the year do you close for personal vacation, summer, or any other reasons?
11. Do you regularly offer drop-in care?
Yes
No
Don't know
12. Altogether, how many children are enrolled at your center?
Number of Children Enrolled:_____________________
Number of Age Groups:____________________
13. What are the age groups on which your rate structure is based?
Group Age Range in Months Number Enrolled by Age Group
Comments Min Max Full-Time Part-Day
1
2
3
4
5
6
7
8
14. Full Time Rates: Ask about each age group
a. What are your standard full time rates (6+hrs per day/5 days per week) for children in Age Group__?
b. Is that rate per hour, day, week, month, or year?
c. How many days of care per week does this rate cover?
d. Do you currently have a full time waitlist for this group?
15. Part-Day Rates: Ask about each age group
a. What are your standard part day rates (Less than 6 hrs per day/5 days per week) for children in Age Group__?
b. Is that rate per hour, day, week, month, or year?
c. How many days of care per week does this rate cover?
d. Do you currently have a part day waitlist for this group?

B-3
16. Additional Weekend Rates
a. What are your standard Additional weekend rates for children in Age Group ___?
b. Is that rate per hour, day, week, month, or year?
17. Rate Comments:
18. Fees: Do you charge a ____________________ (in addition to the regular rate)?
Yes No Unsure Amount
One time registration fee
Yearly or semester enrollment fee
Additional activity or supply fee
If enrollment fee is Yes: Is your enrollment fee per _____________?
Semester
Academic Year
Calendar Year
If activity fee is Yes: Is your activity fee per _____________?
Month
Semester
Academic Year
Calendar Year
19. Comments about additional rates
20. Does your center offer regular transportation? (Excludes field trips)
Yes
No
Don’t know
21. Is your child care center a for-profit or non-profit facility (501.C3 status)?
Non-Profit
For-Profit
Don't Know

B-4
22. Do you provide any discounts in the form of a sliding scale? (Note: If offer scholarships to some children, count as sliding scale)
Yes
No
Don’t know
23. Do you accept CCS children (children receiving subsidies)?
Do not accept CCS children
Accept CCS children, do NOT allocate a specific number of slots
Accept CCS children, allocate specific number of slots: ____________________
Don't Know
24. Is your child care facility __________?
Part of a local or regional chain
Part of a national chain
Independently owned
Other ____________________
None of the above
Don't know
25. Is your child care associated with any of the following?
Church or religious organization
Community-based organization
YMCA/ YWCA
Public school
Private or parochial school
Military institution
Other ____________________
No associations
Don't know

B-5
26. Does your facility receive any of the following services for free or at a reduced cost?
Building use
Utilities
Volunteer work
Furniture or equipment
Supplies
Other ____________________
None
Don't know
27. Does your facility receive any donations?
Federal Child Care Food Program
CCMS (other than subsidies)
United Way
Religious institutions
Local, state or federal government funding
Private or individual donations
YMCA / YWCA
School district
Foundations
Other ____________________
No donations
Don't know
28. In addition to your state operating license, does your center have any of the following national accreditation or certifications?:
NAEYC - National Association for the Education of Young Children
NAFCC - National Association for Family Child Care
NACC - National Association of Child Care Professionals
Montessori Accreditation
Other: ____________________
No accreditations
Don't Know

B-6
29. Is your service certified as a Texas Rising Star provider?
Yes, number of stars: ____________________
No
Don't know
30. Do you offer after-school care during the school year?
Yes
No
Don't know
31. Do you offer full or part day care for school-age children during the summer?
Yes
No
Don't know
32. Do you have access to the Internet?
Yes
No
Don't know
33. General comments:
Thank you for your time.

C-1
APPENDIX C. QUESTIONNAIRE: REGISTERED AND LICENSED CHILD CARE HOMES
1. Date:_________________________
2. Interviewer:______________________________
3. Hi, Can I please speak to the director of (CENTER NAME). Hi my name is ___________and I’m calling from the University of Texas at Austin on behalf of the Texas Workforce Commission. We are conducting the annual childcare market rate study. Do you have about 3-5 minutes to answer questions about your center?
Accept - Continue with survey
Refusal
Overdial
Not eligible
Wrong number - New number is available ____________________
Withdrew
4. Are you a registered or licensed home child care provider?
Registered Child Care Home (RCCH)
Licensed Child Care Home (LCCH)
Neither- Not Eligible
5. What are your hours of operation (M-F)?
Weekday Open Close
Monday
Tuesday
Wednesday
Thursday
Friday
6. What are your hours of operation on Saturday and Sunday, if any?
Weekday Open Close
Saturday
Sunday
7. Do you regularly offer drop-in care?
Yes
No
Don't know
8. How many days out of the year do you close for national, state, or religious holidays?

C-2
9. Outside of weekends and holidays, how many days out of the year do you close for personal vacation, summer, or any other reasons?
10. Altogether, how many children including your own are you currently caring for at your home?
Number of ALL Children:_____________________
11. How many of these children are either not paying or paying at discounted rates because they are friends or family?
Number of Discounted Children:____________________
12. Total Eligible Children:______________________
13. For Interviewer purpose only, I am only going to ask about the __ children not receiving friend or family discounting rates. I will ask about each child's age, how many hours a day, and how many days a week the child is in your care. If you have siblings, please list them together by family.
How old is the youngest child in the first family?" What time does this child arrive on ____? What time do they leave on_____? (Mon-Su)
Child Family ID Age Mon Tues Wed Thurs Fri Sat Sun
Family Child Months *A *L *A *L *A *L *A *L *A *L *A *L *A *L
1
2
3
4
5
6
7
8
9
*A=Arrive/*L=Leave
14. Child Rates:
a. Does child __ receive subsidized care through CCS? (Ask about all children)
b. Rate Amount:
NON-CCS: What is the rate or cost of childcare for this child? CCS/CoPay: Can you tell me the amount you receive from CCS?/ What is the parent Co-Pay? CSS Total Only: How much money do you receive in total for the care of this child?
c. Is that rate per hour, day, week, month, or year?
d. Does this child receive a multiple child discount?
e. How many children are covered under this rate?
15. Rate Comments:
C-3
16. Fees: Do you charge a ____________________ (in addition to the regular rate)?
Yes No Unsure Amount
One time registration fee
Yearly or semester enrollment fee
Additional activity or supply fee
If enrollment fee is Yes: Is your enrollment fee per _____________?
Semester
Academic Year
Calendar Year
If activity fee is Yes: Is your activity fee per _____________?
Month
Semester
Academic Year
Calendar Year
17. Comments about additional rates
18. Do you offer regular transportation as defined by using your own personal vehicle to transport children (Excludes field trips)
Yes
No
Don’t know
19. Do you have a waitlist for any age groups? If so, which ones?
Infants (0-17 months)
Toddlers (18-35 months)
Preschool (36-71 months)
School Age (72+ months)
No Waitlist
Don't know

C-4
20. Is your child care home a for-profit or non-profit child care home (501.C3 status)?
Non-Profit
For-Profit
Don't Know
21. Is your child care associated with any of the following?
Church or religious organization
Community-based organization
Other ____________________
No associations
Don't know
22. Does your facility receive any of the following services for free or at a reduced cost?
Building use
Utilities
Volunteer work
Furniture or equipment
Supplies
Other ____________________
None
Don't know
23. In addition to your state operating license, does your home have any of the following national accreditation or certifications?:
NAEYC - National Association for the Education of Young Children
NAFCC - National Association for Family Child Care
NACC - National Association of Child Care Professionals
Montessori Accreditation
Other: ____________________
No accreditations
Don't Know

C-5
24. Is your service certified as a Texas Rising Star provider?
Yes, number of stars: ____________________
No
Don't know
25. Do you offer after-school care during the school year?
Yes
No
Don't know
26. Do you offer full or part day care for school-age children during the summer?
Yes
No
Don't know
27. Do you have access to the Internet?
Yes
No
Don't know
28. General comments:
Thank you for your time.