2016 vermont health care expenditure analysis...the vermont health care expenditure analysis (vhcea)...
TRANSCRIPT

1
2016 Vermont Health Care
Expenditure Analysis
Resident and Provider Spending Perspectives
Lori Perry, CMA, Senior Healthcare Financial Systems Analyst
Published May 2018

Topics
Introduction 3
Relationship with the Total Cost of Care 4
Summary 5
2016 Vermont Resident Analysis 7
Spending & Growth 8
Vermont vs. National Health Expenditures (NHE) 19
Health Insurance Coverage Profile 25
2016 Vermont Provider Analysis 26
Revenues Received & Growth 27
Hospital Revenues 31
Migration of Hospital Inpatient Discharges 32
2016 Comparative Summary Resident and Provider Analysis 33
Appendix 34
2

IntroductionThe Vermont Health Care Expenditure Analysis (VHCEA) is currently required under 18 V.S.A. §
9375a.
Since Act 160 of 1991, the analysis has served as an annual report of health care spending
and revenues in Vermont to aid in the development of a forecast and ultimately, a Unified
Health Care Budget.
The report is a consistent analysis that:
establishes a base of health care spending and funding,
examines trends in spending and sources of funds,
compares Vermont data to national data reflected in the National Health Accounts
published by the Centers for Medicare & Medicaid Services (CMS), and
provides information from two different perspectives; 1) spending on behalf of Vermont
residents regardless of where they receive care and 2) revenues received by Vermont
providers for both residents and non-residents receiving care in Vermont.
Note: This symbol is used when a slide is prepared from Vermont resident analysis data.
Payers reported spend on provider services.
The Vermont provider analysis data will use this symbol.
Providers reported revenues from payers.
3
R
P

Relationship with the Total Cost of Care
The VHCEA measures expenditures at a broader and more comprehensive level than the All-
Payer Total Cost of Care (TCOC) defined in Vermont’s All-Payer Model agreement.
The All-Payer TCOC can be thought of as a subset of the VHCEA resident analysis in two ways:
The VHCEA estimates include all Vermont residents
- The All-Payer TCOC excludes certain populations, such as Vermont residents
without insurance or those covered by the Federal Employee Health Benefits Plan.
The VHCEA estimates total expenditures
- The All-Payer TCOC is limited to claims payments for the types of services covered
by traditional Medicare or non-claims payments related to direct medical care (e.g.
care management, capitation).
- The All-Payer TCOC does not include retail pharmacy.
4

Summary
5
Vermont residents health care spending:
Total spending for Vermont residents receiving health care services both in- and out-
of-state increased 4.2% in 2016. This was higher than the 3.1% increase in 2015 but
the same percentage as the average annual increase of 4.2% for the period 2007
through 2016.
Commercial insurance spending increased 6.8%, mainly due to Administration and
Net Cost of Insurance, home health care and dentists.
Medicaid spending increased 1.9%, mainly for spending in mental health and other
government activities; there were decreases in drugs and supplies due to higher
rebate percentages for specialty drugs.
Medicare spending increased 4.5% as a result of increases in hospital utilization and
drugs and supplies.
Vermont has seen a payer shift over time for health care services:
For the period 2008 through 2016, the percentage of total resident costs paid by
commercial insurers decreased from 39% to 33%, and out-of-pocket spending
decreased from 14% to 13%. In contrast, Medicaid grew from 24% to 28%, and
Medicare increased from 19% to 22%.
R
Summary (continued)
6
Vermont compared to United States:
Vermont expenditures are comparable to U.S. health consumption spending. For 2016,
U.S. health consumption spending increased 4.4%. This was lower than the 5.9%
increase in 2015.
The per person spending in Vermont was $9,539, an increase of 4.5% over 2015. This
is lower than the U.S. per person amount of $9,875.
Vermont providers health care revenues received:
Health care service revenues received by Vermont providers for in- and out-of-state
patients increased 3.2% in 2016. This was lower than the 5.5% increase in 2015 and
lower than the average annual increase of 4.3% for the period 2007 through 2016.
Growth reported in hospitals increased 4.5%, which includes revenues for hospital
employed physicians.
Revenues for home health increased 4.6%, dentists 4.8%, other professionals 4.3%,
vision & DME 4.2%, nursing homes 4.0%, and drugs and supplies 1.9%. These
increases were offset by a decline in physician revenues of 2.7% due to continued
improvement in our estimates and private practice physician offices moving towards
hospital employment.
P

7
2016 Vermont Resident Analysis
R
2016 Vermont Resident Analysis
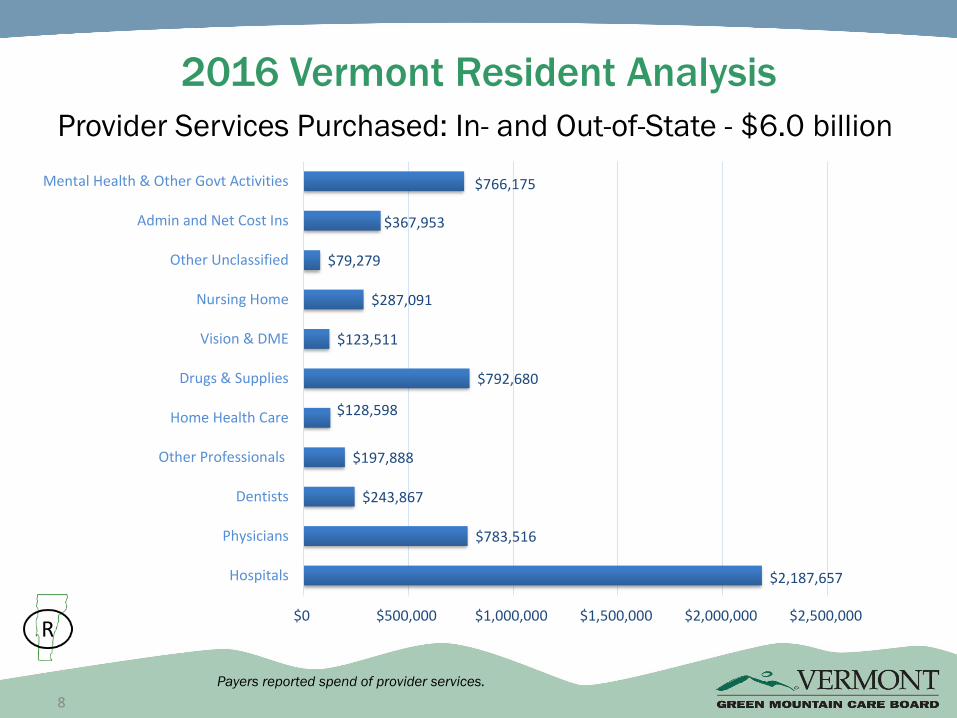
Provider Services Purchased: In- and Out-of-State - $6.0 billion
8
$2,187,657
$783,516
$243,867
$197,888
$128,598
$792,680
$123,511
$287,091
$79,279
$367,953
$766,175
$0 $500,000 $1,000,000 $1,500,000 $2,000,000 $2,500,000
Hospitals
Physicians
Dentists
Other Professionals
Home Health Care
Drugs & Supplies
Vision & DME
Nursing Home
Other Unclassified
Admin and Net Cost Ins
Mental Health & Other Govt Activities
R
Payers reported spend of provider services.

2016 Vermont Resident Analysis
9
$754,383
$1,971,192
$1,338,248
$1,660,950
$233,443
Out of Pocket
Commercial
Medicare
Medicaid
Other Government
$0 $500,000 $1,000,000 $1,500,000 $2,000,000 $2,500,000
28%
22%
33%
13%
R
Payer Spending for Services: In- and Out-of-State - $6.0 billion
4%
Payers reported spend of provider services.

2016 Vermont Resident AnalysisTotal Spending Increase from 2015
10
Total Spending increased $242.7
million, 4.2% from 2015.
The increase in Administration and
Net Cost of Insurance was mostly
driven by Commercial Insurance.
Hospital spending increased from
Medicare and Out-of-Pocket payers.
Physicians increased from Medicaid
and Medicare.
Mental Health and Other Government
Activities such as Mental Health
Clinics, Home & Community Based
Services were accounted for by
Medicaid.
R
$27
$19
$7
($13)
$6
$5
$1
$11
$2
$162
$16
Hospitals
Physicians
Dentists
Other Professionals
Home Health Care
Drugs & Supplies
Vision & DME
Nursing Home
Other Unclassified
Admin and Net Cost Ins
Mental Health & Other Govt Activities
($50) $0 $50 $100 $150 $200
Spending Increase, 4.2%
Millions
Payers reported spend of provider services.

2016 Vermont Resident Analysis
Commercial Insurance
Spending Increase from 2015
11
Commercial Insurance
increased $125.3 million
to $2.0 billion mainly
caused by Admin. and
Net Cost of Insurance,
home health care and
dentists; decreases were
reported in other
provider service
categories.
Enrollment decreased to
315,508 or 3.1% from
2015.
$0.6
-$1.3
$2.7
-$17.6
$4.5
-$6.3
-$1.5
-$1.0
-$6.9
$152.0
($50) $0 $50 $100 $150 $200
Hospitals
Physicians
Dentists
Other Professionals (Licensed)
Home Health Care
Drugs & Supplies
Vision & DME
Nursing Home
Other Unclassified
Admin and Net Cost of Ins.
Millions
Spending Increase, 6.8%
R
Payers reported spend of provider services.

2016 Vermont Resident AnalysisMedicaid
Spending Increase from 2015
12
Medicaid increased $30.2
million to $1.7 billion mainly
resulting from spending for
Mental Health Clinics, Home
& Community Based
Services, Alcohol & Drug
Abuse Treatment and other
programs.
The decrease in Drugs and
Supplies was due to the
higher rebate percentage for
specialty drugs.
Medicaid enrollment
decreased to 157,112 or
2.5% from 2015.
$3.9
$6.9
$1.5
$3.7
-$0.1
-$6.0
$0.6
$0.9
$7.2
$0.6
$11.0
($10) ($5) $0 $5 $10 $15
Hospitals
Physicians
Dentists
Other Professionals (Licensed)
Home Health Care
Drugs & Supplies
Vision & DME
Nursing Home
Other Unclassified
Admin and Net Cost of Ins.
Mental Health & Other Govt Activities
Millions
Spending Increased, 1.9%
R
Payers reported spend on provider services.
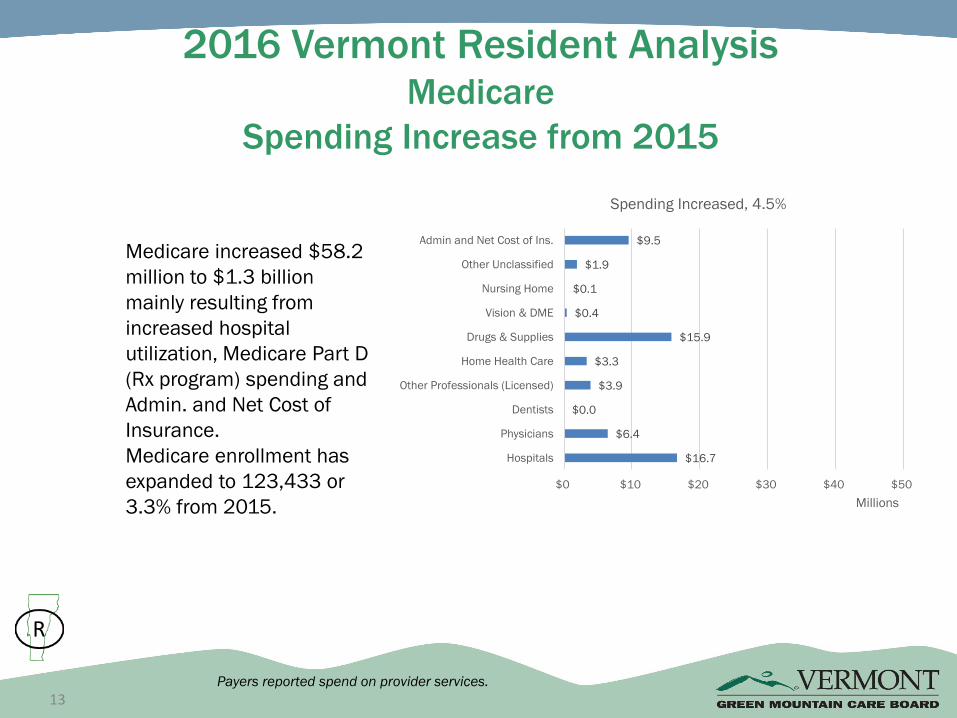
2016 Vermont Resident AnalysisMedicare
Spending Increase from 2015
13
Medicare increased $58.2
million to $1.3 billion
mainly resulting from
increased hospital
utilization, Medicare Part D
(Rx program) spending and
Admin. and Net Cost of
Insurance.
Medicare enrollment has
expanded to 123,433 or
3.3% from 2015.
$16.7
$6.4
$0.0
$3.9
$3.3
$15.9
$0.4
$0.1
$1.9
$9.5
$0 $10 $20 $30 $40 $50
Hospitals
Physicians
Dentists
Other Professionals (Licensed)
Home Health Care
Drugs & Supplies
Vision & DME
Nursing Home
Other Unclassified
Admin and Net Cost of Ins.
Millions
Spending Increased, 4.5%
R
Payers reported spend on provider services.

0% 10% 20% 30% 40% 50% 60% 70% 80% 90% 100%
Mental Health & Other Govt Activities
Home Health Care
Nursing Home
Other*
Drugs & Supplies
Hospitals
Physicians
Dentists
Gov't % Private %
2016 Vermont Resident Analysis
14
Government vs. Private Funding
*Other includes services rendered by other professionals, durable medical equip. suppliers, vision providers, and other
misc. providers.
Private Funding includes
Commercial Insurance as well
as Out-of-Pocket spending.
Government Funding equals
Medicare, Medicaid and Other
Government-Federal, State and
Local spending.
R
Payers reported spend on provider services.

Vermont Resident Analysis Payer Spending Comparison
15
2012 - $5.0 Billion
R
Payers reported spend on provider services.
14% 14% 13%
39% 36%33%
19% 21%22%
24% 25% 28%
4% 4% 4%
0%
10%
20%
30%
40%
50%
60%
70%
80%
90%
100%
2008 2012 2016
Out of Pocket Commercial Medicare Medicaid Other Government

Vermont Resident Analysis
Provider Service Spending Comparison
16
2012 - $5.0 Billion
*Other includes services rendered by other professionals, durable medical equipment suppliers, vision providers, and other
miscellaneous providers.
R
$0 $1,000 $2,000 $3,000 $4,000 $5,000 $6,000 $7,000
Hospitals
Physicians
Dentists
Other*
Home Health Care
Drugs & Supplies
Nursing Home
Admin and Net Cost Ins
Mental Hlth & Other Govt Act.
Total
FY2008 FY2012 FY2016Millions
Payers reported spend on provider services.

Vermont Resident Health Care Expenditures
Summary of Spending Growth
17
All dollar amounts are reported in millions
R
Payers 2011 2012 2013 2014 2015 2016
2015-2016
Annual
Change
2011-2016
Average
Annual
Change
Out of Pocket $716 $716 $722 $722 $735 $754 2.6% 1.1%
Commercial $1,850 $1,857 $1,892 $1,920 $1,846 $1,971 6.8% 1.3%
Medicare $992 $1,081 $1,120 $1,195 $1,280 $1,338 4.5% 6.2%
Medicaid $1,211 $1,304 $1,379 $1,490 $1,631 $1,661 1.9% 6.5%
Other Government $215 $181 $183 $216 $223 $233 4.5% 1.6%
Total Resident Expenditures $4,983 $5,138 $5,297 $5,543 $5,716 $5,958 4.2% 3.6%
Annual Percent Change 1.2% 3.1% 3.1% 4.7% 3.1% 4.2%
Providers 2011 2012 2013 2014 2015 2016
2015-2016
Annual
Change
2011-2016
Average
Annual
Change
Hospitals $1,900 $1,963 $2,005 $2,050 $2,161 $2,188 1.3% 2.9%
Physicians $662 $689 $711 $739 $765 $784 2.5% 3.4%
Dentists $213 $213 $222 $233 $237 $244 2.9% 2.8%
Other Professionals $176 $165 $168 $195 $210 $198 -5.9% 2.4%
Home Health Care $93 $96 $104 $111 $122 $129 5.1% 6.6%
Drugs & Supplies $607 $637 $638 $683 $788 $793 0.6% 5.5%
Vision & DME $107 $111 $119 $121 $123 $124 0.6% 3.0%
Nursing Home $280 $285 $285 $283 $276 $287 4.0% 0.5%
Other Unclassified $43 $44 $50 $67 $78 $79 2.1% 13.3%
Admin and Net Cost Ins $361 $354 $354 $356 $206 $368 78.8% 0.4%
Mental Health & Other Govt Activities $542 $581 $641 $705 $751 $766 2.1% 7.2%
Total Resident Expenditures $4,983 $5,138 $5,297 $5,543 $5,716 $5,958 4.2% 3.6%
Annual Percent Change 1.2% 3.1% 3.1% 4.7% 3.1% 4.2%
Payers reported spend on provider services.

2016 Vermont Resident Analysis
18
Spending increased from $4.1 billion in 2007 to $6.0 billion in 2016,
an average annual increase of 4.2%. The increase from 2015 to 2016 was also 4.2%.
R
3.2%
6.6%
7.3%
4.7%
1.2%
3.1% 3.1%
4.7%
3.1%
4.2%
0.0%
1.0%
2.0%
3.0%
4.0%
5.0%
6.0%
7.0%
8.0%
$0
$1
$2
$3
$4
$5
$6
$7
2007 2008 2009 2010 2011 2012 2013 2014 2015 2016
Bill
ion
s
Payers reported spend on provider services.

National Health Expenditures
19
The CMS has prepared the National Health Expenditure (NHE) accounts since
1960. The accounts report:
• Measures for annual expenditures of health care goods and services, public
health activities, government administrations, net cost of health insurance, and
health care investments.
• Data is presented by type of expenditure, by source of funding, and by type of
sponsor (private businesses, governments and households which include
contributions to health insurance premiums and out-of-pocket costs).
• The NHE also prepares quinquennial provider and resident “State Health
Expenditures”, the primary source of data is the Economic Census. In 2017, NHE
updated the State provider and resident data reports to include 2014.
2016 Vermont Resident Analysis
R
2016 Vermont Resident Analysis
20
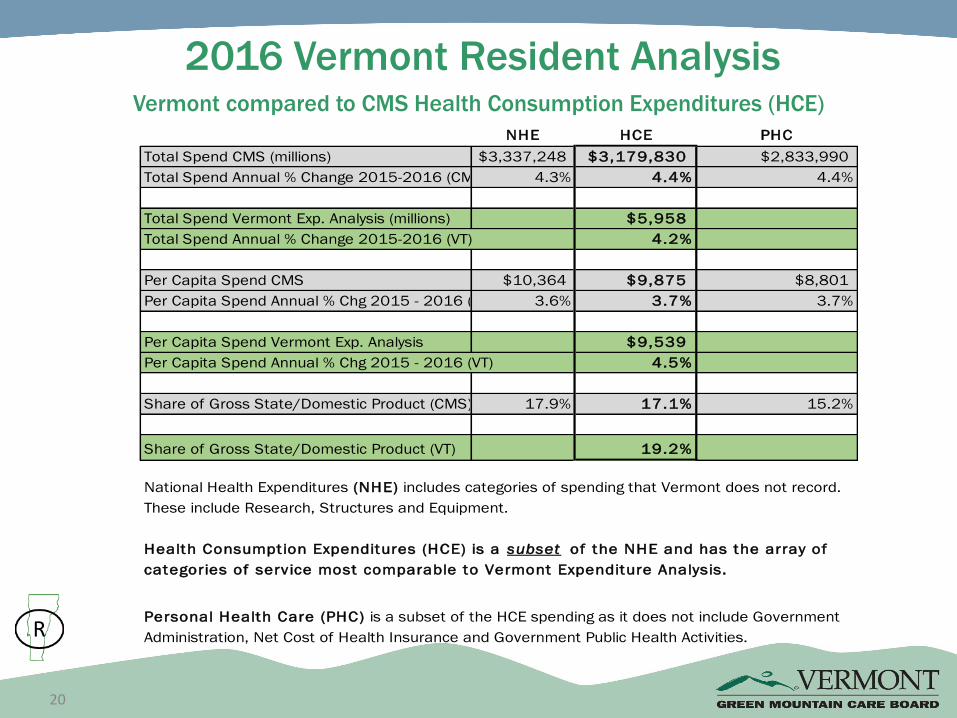
Vermont compared to CMS Health Consumption Expenditures (HCE)
R
NHE HCE PHC
Total Spend CMS (millions) $3,337,248 $3,179,830 $2,833,990
Total Spend Annual % Change 2015-2016 (CMS) 4.3% 4.4% 4.4%
Total Spend Vermont Exp. Analysis (millions) $5,958
Total Spend Annual % Change 2015-2016 (VT) 4.2%
Per Capita Spend CMS $10,364 $9,875 $8,801
Per Capita Spend Annual % Chg 2015 - 2016 (CMS) 3.6% 3.7% 3.7%
Per Capita Spend Vermont Exp. Analysis $9,539
Per Capita Spend Annual % Chg 2015 - 2016 (VT) 4.5%
Share of Gross State/Domestic Product (CMS) 17.9% 17.1% 15.2%
Share of Gross State/Domestic Product (VT) 19.2%
Health Consumption Expenditures (HCE) is a subset of the NHE and has the array of
categories of service most comparable to Vermont Expenditure Analysis.
National Health Expenditures (NHE) includes categories of spending that Vermont does not record.
These include Research, Structures and Equipment.
Personal Health Care (PHC) is a subset of the HCE spending as it does not include Government
Administration, Net Cost of Health Insurance and Government Public Health Activities.

2016 Vermont Resident Analysis
21
Vermont Compared to CMS Health Consumption Expenditures (HCE)
6.6%
7.3%
4.7%
1.2%
3.1% 3.1%
4.7%
3.1%
4.2%4.4%4.7%
4.2%
3.4%
4.1%
3.1%
5.5%5.9%
4.4%
0%
1%
2%
3%
4%
5%
6%
7%
8%
2008 2009 2010 2011 2012 2013 2014 2015 2016
Total Spending Growth
Health Consumption Expenditures
Vt U.S.
R

2016 Vermont Resident Analysis
22
6.5%
7.2%
4.6%
1.1%
3.2% 3.0%
4.7%
3.2%
4.5%
3.3%
4.0%
3.2%2.7%
3.4%
2.1%
4.9%5.3%
3.7%
0%
1%
2%
3%
4%
5%
6%
7%
8%
2008 2009 2010 2011 2012 2013 2014 2015 2016
Per Capita Growth (per person)
Health Consumption Expenditures
Vt U.S.
R
Vermont Compared to CMS Health Consumption Expenditures (HCE)

2016 Vermont Resident Analysis
23
Source: US data from CMS: Health Consumption Expenditures
2007 2008 2009 2010 2011 2012 2013 2014 2015 2016
Vt $6,590 $7,018 $7,525 $7,870 $7,955 $8,207 $8,452 $8,847 $9,130 $9,539
U.S. $7,166 $7,405 $7,701 $7,949 $8,167 $8,447 $8,626 $9,045 $9,522 $9,875
$4,000
$5,000
$6,000
$7,000
$8,000
$9,000
$10,000
$11,000
Per Capita
Health Consumption Expenditures
R
Vermont Compared to CMS Health Consumption Expenditures (HCE)
2016 Vermont Resident Analysis
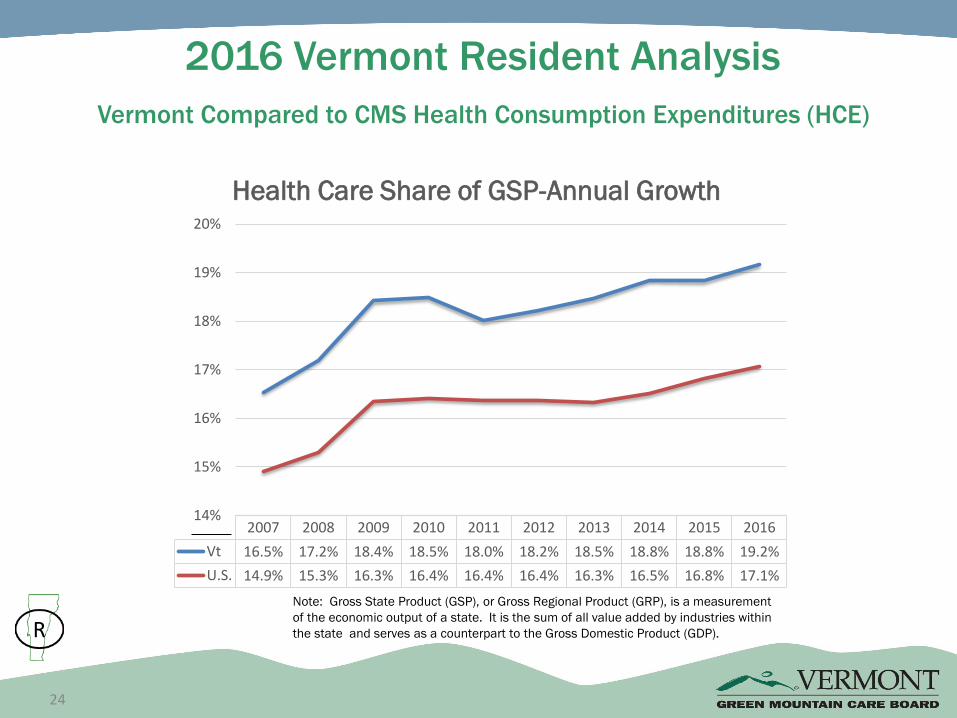
24
Note: Gross State Product (GSP), or Gross Regional Product (GRP), is a measurement
of the economic output of a state. It is the sum of all value added by industries within
the state and serves as a counterpart to the Gross Domestic Product (GDP).
2007 2008 2009 2010 2011 2012 2013 2014 2015 2016
Vt 16.5% 17.2% 18.4% 18.5% 18.0% 18.2% 18.5% 18.8% 18.8% 19.2%
U.S. 14.9% 15.3% 16.3% 16.4% 16.4% 16.4% 16.3% 16.5% 16.8% 17.1%
14%
15%
16%
17%
18%
19%
20%
Health Care Share of GSP-Annual Growth
R
Vermont Compared to CMS Health Consumption Expenditures (HCE)

25
The enrollees shift
across payer types
may cause a
“duplicated count”
adjustment to be
recognized.
The Vermont’s all-
payer claims
database
(VHCURES) has
aided in the
validation of the
enrollment counts.
Under Review
Category 2014 2015 2016 % change
Commercial Insured Market
Insured Plans
Non-group 32,041 29,547 32,721
Large Employer group 47,400 40,190 19,472
Small Employer group 37,231 36,656 42,938
Association 39,758 39,410 0
Insured Market Subtotal 156,430 145,803 95,131
Self- insured Employer Plans
Self-insured Employer Plans 137,327 126,568 168,838
Federal Employee Plan 14,535 14,666 14,685
Military 18,578 18,578 18,578
Self Insured Market Subtotal 170,440 159,812 202,101
Other
VT residents covered by insurers outside VT 25,143 20,077 18,276
Other 25,143 20,077 18,276
Commercial Insured Market 352,013 325,692 315,508 -3.1%
Government Coverage
Medicaid 146,273 161,097 157,112 -2.5%
Medicare 115,649 119,477 123,433 3.3%
Government Coverage 261,922 280,574 280,545 0.0%
Uninsured
Uninsured 26,071 26,071 28,541 9.5%
Total of Assigned Lives 640,006 632,337 624,594
Duplicated Count -13,444 -6,295
Total Vermont Population 626,562 626,042 624,594 -0.2%
Health Insurance Coverage Profile
Vermont Residents 2014-2016
R

26
Vermont Provider Analysis
P
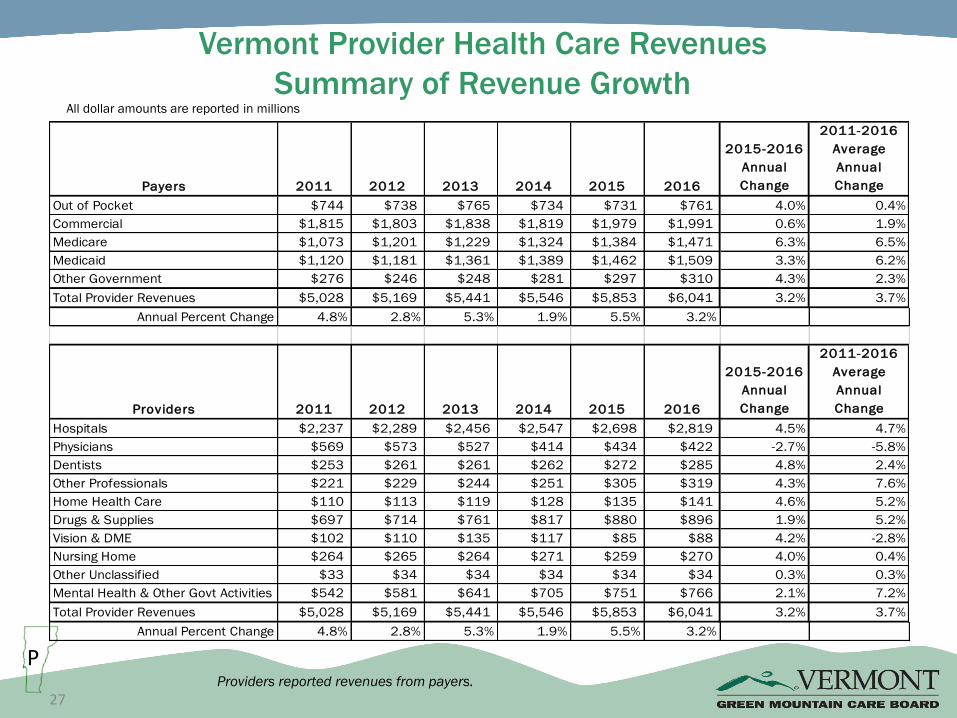
Vermont Provider Health Care Revenues
Summary of Revenue Growth
27
All dollar amounts are reported in millions
PProviders reported revenues from payers.
Payers 2011 2012 2013 2014 2015 2016
2015-2016
Annual
Change
2011-2016
Average
Annual
Change
Out of Pocket $744 $738 $765 $734 $731 $761 4.0% 0.4%
Commercial $1,815 $1,803 $1,838 $1,819 $1,979 $1,991 0.6% 1.9%
Medicare $1,073 $1,201 $1,229 $1,324 $1,384 $1,471 6.3% 6.5%
Medicaid $1,120 $1,181 $1,361 $1,389 $1,462 $1,509 3.3% 6.2%
Other Government $276 $246 $248 $281 $297 $310 4.3% 2.3%
Total Provider Revenues $5,028 $5,169 $5,441 $5,546 $5,853 $6,041 3.2% 3.7%
Annual Percent Change 4.8% 2.8% 5.3% 1.9% 5.5% 3.2%
Providers 2011 2012 2013 2014 2015 2016
2015-2016
Annual
Change
2011-2016
Average
Annual
Change
Hospitals $2,237 $2,289 $2,456 $2,547 $2,698 $2,819 4.5% 4.7%
Physicians $569 $573 $527 $414 $434 $422 -2.7% -5.8%
Dentists $253 $261 $261 $262 $272 $285 4.8% 2.4%
Other Professionals $221 $229 $244 $251 $305 $319 4.3% 7.6%
Home Health Care $110 $113 $119 $128 $135 $141 4.6% 5.2%
Drugs & Supplies $697 $714 $761 $817 $880 $896 1.9% 5.2%
Vision & DME $102 $110 $135 $117 $85 $88 4.2% -2.8%
Nursing Home $264 $265 $264 $271 $259 $270 4.0% 0.4%
Other Unclassified $33 $34 $34 $34 $34 $34 0.3% 0.3%
Mental Health & Other Govt Activities $542 $581 $641 $705 $751 $766 2.1% 7.2%
Total Provider Revenues $5,028 $5,169 $5,441 $5,546 $5,853 $6,041 3.2% 3.7%
Annual Percent Change 4.8% 2.8% 5.3% 1.9% 5.5% 3.2%

2016 Vermont Provider Analysis
28
Provider Revenues by Category - $6.0 Billion
Provider revenues
increased $189
million or 3.2% in
2016.
Medicare and Out
of Pocket payers
accounted for
most of the
increase in
hospital revenues. $2,819$422
$285
$352
$141
$896
$88
$270
$766
$0 $500 $1,000 $1,500 $2,000 $2,500 $3,000
Hospitals
Physicians
Dentists
Other Professionals
Home Health Care
Drugs & Supplies
Vision & DME
Nursing Home
Mental Health & Other Govt…
Millions
PProviders reported revenues from payers.

2016 Vermont Provider Analysis
29
Revenues increased from $4.1 billion in 2007 to $6.0 billion in 2016, an average
annual increase of 4.3% for the period.
P
6.7%7.0%
5.2%
2.9%
4.8%
2.8%
5.3%
1.9%
5.5%
3.2%
0.0%
1.0%
2.0%
3.0%
4.0%
5.0%
6.0%
7.0%
8.0%
$0
$1,000
$2,000
$3,000
$4,000
$5,000
$6,000
$7,000
2007 2008 2009 2010 2011 2012 2013 2014 2015 2016
Bill
ion
s
Providers reported revenues from payers.

Vermont Provider Analysis Payer Revenue Comparison
30
2012 - $5.0 Billion
PProviders reported revenues from payers.
14% 14% 13%
38% 35%33%
20% 23%24%
22% 23% 25%
6% 5% 5%
0%
10%
20%
30%
40%
50%
60%
70%
80%
90%
100%
2008 2012 2016
Out of Pocket Commercial Medicare Medicaid Other Government

31
2016 Vermont Provider Analysis
Hospital Revenues $2.8 billion
P
$0
$200
$400
$600
$800
$1,000
$1,200
$1,400
Out of Pocket Commercial Medicare Medicaid OtherGovernment
Mill
iion
s
Hospitals Physicians
Providers reported revenues from payers.
Of the total hospital revenues
approximately 17% or $442
million is reported as physician
revenue. The community
hospitals employed 1,036 FTE
MDs.
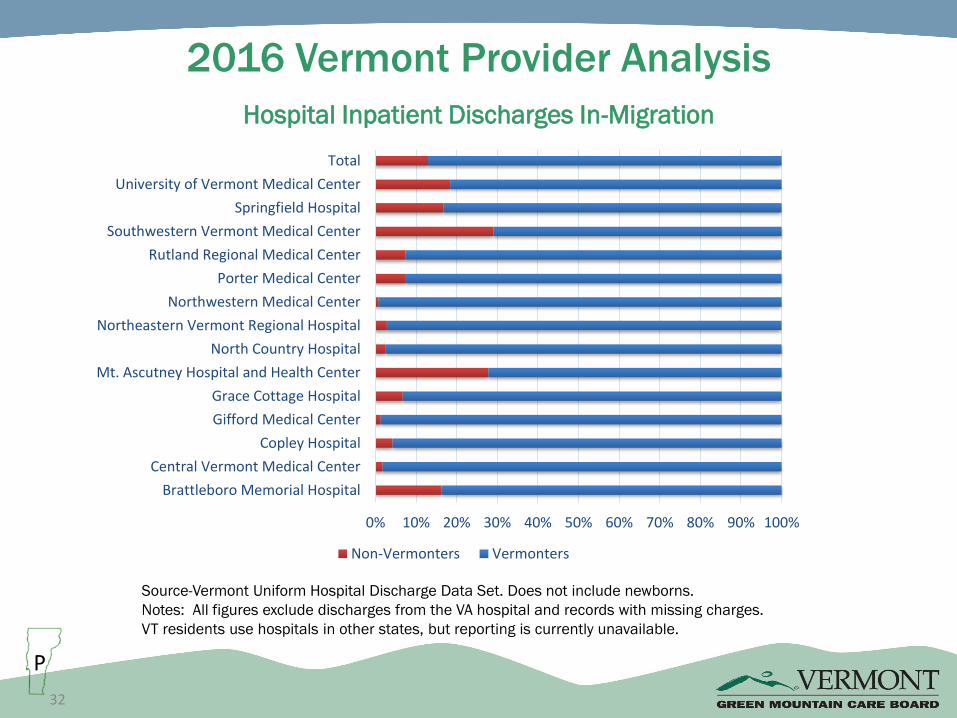
32
2016 Vermont Provider Analysis
Hospital Inpatient Discharges In-Migration
Source-Vermont Uniform Hospital Discharge Data Set. Does not include newborns.
Notes: All figures exclude discharges from the VA hospital and records with missing charges.
VT residents use hospitals in other states, but reporting is currently unavailable.
0% 10% 20% 30% 40% 50% 60% 70% 80% 90% 100%
Brattleboro Memorial Hospital
Central Vermont Medical Center
Copley Hospital
Gifford Medical Center
Grace Cottage Hospital
Mt. Ascutney Hospital and Health Center
North Country Hospital
Northeastern Vermont Regional Hospital
Northwestern Medical Center
Porter Medical Center
Rutland Regional Medical Center
Southwestern Vermont Medical Center
Springfield Hospital
University of Vermont Medical Center
Total
Non-Vermonters Vermonters
P
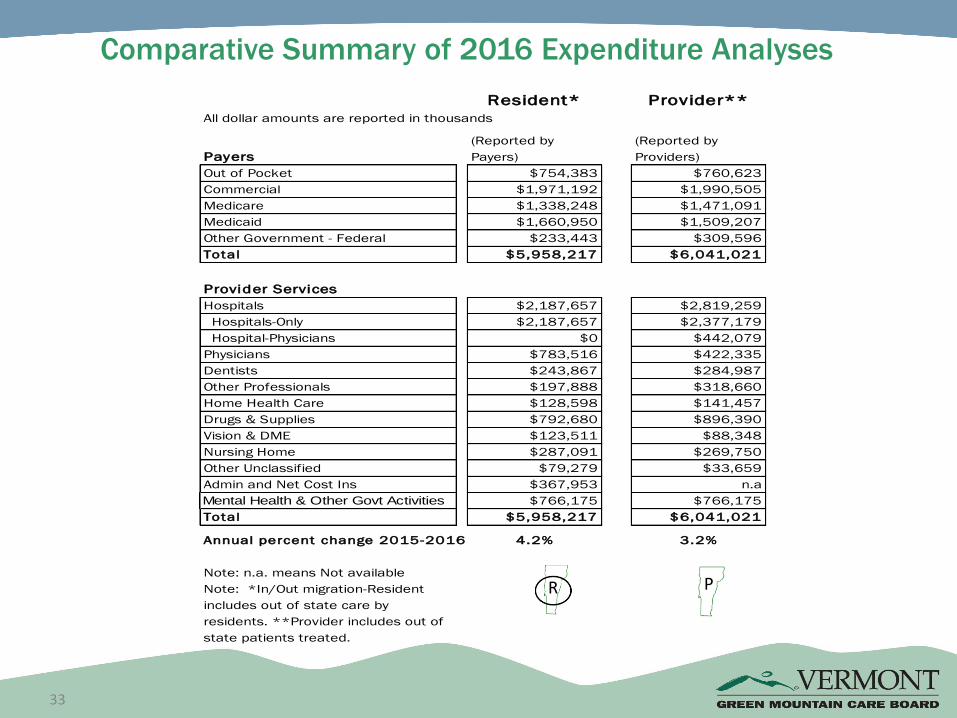
Comparative Summary of 2016 Expenditure Analyses
33
PR
Resident* Provider**
All dollar amounts are reported in thousands
Payers
(Reported by
Payers)
(Reported by
Providers)
Out of Pocket $754,383 $760,623
Commercial $1,971,192 $1,990,505
Medicare $1,338,248 $1,471,091
Medicaid $1,660,950 $1,509,207
Other Government - Federal $233,443 $309,596
Total $5,958,217 $6,041,021
Provider Services FY2016 FY2016
Hospitals $2,187,657 $2,819,259
Hospitals-Only $2,187,657 $2,377,179
Hospital-Physicians $0 $442,079
Physicians $783,516 $422,335
Dentists $243,867 $284,987
Other Professionals $197,888 $318,660
Home Health Care $128,598 $141,457
Drugs & Supplies $792,680 $896,390
Vision & DME $123,511 $88,348
Nursing Home $287,091 $269,750
Other Unclassified $79,279 $33,659
Admin and Net Cost Ins $367,953 n.a
Mental Health & Other Govt Activities $766,175 $766,175
Total $5,958,217 $6,041,021
Annual percent change 2015-2016 4.2% 3.2%
Note: n.a. means Not available
Note: *In/Out migration-Resident
includes out of state care by
residents. **Provider includes out of
state patients treated.

34
Appendix
Resident Analysis Detail 35
Provider Analysis Detail 37
Methodologies, technical notes and sources 38
Acknowledgements 45
Tableau Introduction 46

35
R
All dollar amounts are reported in thousands
PROVIDERS & FACILITIES
Percent of
Total Total
Out of
Pocket Commercial Medicare Medicaid
Other
Government -
Federal
Other
Government -
State & Local
Hospitals 36.7% $2,187,657 $187,877 $965,846 $589,166 $315,262 $129,292 $214
Community Hospital 34.2% $2,038,365 $186,798 $949,982 $586,284 $315,262 $30 $8
Inpatient 15.2% $907,766 $79,586 $321,551 $332,999 $173,630 ($0) $0
Inpatient-Physician 0.0% $0 $0 $0 $0 $0 $0 $0
Outpatient-Physician 0.0% $0 $0 $0 $0 $0 $0 $0
Outpatient & ER 19.0% $1,130,599 $107,212 $628,431 $253,285 $141,632 $31 $8
Veterans Hosp 2.3% $136,422 $0 $7,010 $0 $0 $129,262 $149
Psych Hosp - State 0.0% $1,735 $0 $1,678 $0 $0 $0 $56
Psych Hosp - Private 0.2% $11,136 $1,078 $7,175 $2,883 $0 $0 $0
Physicians 13.2% $783,516 $97,380 $330,908 $145,518 $187,202 $22,250 $257
Office of Physicians 9.4% $561,309 $67,605 $205,596 $117,073 $148,528 $22,250 $257
Ambulatory Clinics 3.5% $207,185 $29,226 $123,648 $25,574 $28,737 $0 $0
CMHCs 0.0% $302 $49 $252 $0 $0 $0 $0
Other Ambulatory Clinics 3.5% $206,884 $29,177 $123,396 $25,574 $28,737 $0 $0
Labs 0.3% $15,022 $550 $1,664 $2,872 $9,936 $0 $0
Dentists 4.1% $243,867 $137,456 $76,960 $0 $29,278 $0 $173
Other Professionals (Licensed) 3.3% $197,888 $32,823 $90,191 $33,695 $41,078 $102 $0
Chiropractic 0.3% $17,192 $4,495 $8,984 $2,366 $1,347 $0 $0
Physical Therapy 0.7% $39,010 $6,718 $14,651 $11,667 $5,975 $0 $0
Podiatrist 0.1% $4,286 $925 $1,728 $1,406 $227 $0 $0
Psychological 1.2% $73,189 $9,136 $29,647 $6,439 $27,865 $102 $0
Optometrists 0.1% $6,537 $1,031 $3,198 $0 $2,309 $0 $0
Other (Professional) 1.0% $57,673 $10,517 $31,984 $11,817 $3,356 $0 $0
Home Health Care 2.2% $128,598 $14,098 $5,797 $72,071 $31,761 $2,555 $2,317
Drugs & Supplies 13.3% $792,680 $130,628 $269,339 $305,367 $90,821 ($3,426) ($48)
Rx 13.2% $786,591 $130,478 $269,244 $304,703 $85,640 ($3,426) ($48)
Other Supplies 0.1% $6,090 $150 $95 $664 $5,181 $0 $0
Vision & DME 2.1% $123,511 $68,315 $19,259 $25,853 $10,084 $0 $0
Nursing Home 4.8% $287,091 $76,232 $8,684 $70,546 $122,545 $0 $9,084
Other Unclassified 1.3% $79,279 $9,575 $18,129 $23,753 $11,875 $0 $15,948
Mental Health & Other Govt Activities 12.9% $766,175 $0 $0 $0 $711,450 $22,003 $32,722
Admin and Net Cost of Health Insurance 6.2% $367,953 $0 $186,079 $72,279 $109,595 $0 $0
Administration 7.5% $446,918 $0 $265,044 $72,279 $109,595 $0 $0
Change in Surplus -1.3% ($78,965) $0 ($78,965) $0 $0 $0 $0
TOTAL VERMONT EXPENDITURES 100.0% $5,958,217 $754,383 $1,971,192 $1,338,248 $1,660,950 $172,777 $60,666
Percent of total expenditures 100.0% 12.7% 33.1% 22.5% 27.9% 2.9% 1.0%
Note: All physician spending including hospital physicians in the Resident Analysis are shown in the physician service category
Payer reported data
Allocations estimated from VT specific data
Amounts imputed from National Health Expenditures or other indirect sources
2016 EXPENDITURE ANALYSIS-RESIDENT

36
R
All dollar amounts are reported in thousands
PROVIDERS & FACILITIES
Percent of
Total Total Self-Insured BCBSVT TVHP MVP
Workers
Comp
Other
Private
Hospitals 49.0% $965,846 $541,438 $233,914 $14,674 $28,881 $12,612 $134,328
Community Hospital 48.2% $949,982 $530,397 $231,543 $14,574 $28,086 $12,612 $132,771
Inpatient 16.3% $321,551 $170,028 $81,682 $5,236 $9,450 $6,071 $49,084
Inpatient-Physician 0.0% $0 $0 $0 $0 $0 $0 $0
Outpatient-Physician 0.0% $0 $0 $0 $0 $0 $0 $0
Outpatient & ER 31.9% $628,431 $360,368 $149,861 $9,338 $18,636 $6,541 $83,687
Veterans Hosp 0.4% $7,010 $5,745 $797 $60 $0 $0 $409
Psych Hosp - State 0.1% $1,678 $1,541 $11 $1 $0 $0 $125
Psych Hosp - Private 0.4% $7,175 $3,755 $1,563 $39 $795 $0 $1,023
Physicians 16.8% $330,908 $161,588 $66,471 $3,964 $10,626 $50,136 $38,123
Office of Physicians 10.4% $205,596 $94,531 $31,751 $1,618 $10,626 $46,789 $20,281
Ambulatory Clinics 6.3% $123,648 $66,340 $34,632 $2,338 $0 $2,542 $17,796
CMHCs 0.0% $252 $249 $2 $0 $0 $0 $1
Other Ambulatory Clinics 6.3% $123,396 $66,091 $34,630 $2,338 $0 $2,542 $17,795
Labs 0.1% $1,664 $717 $88 $8 $0 $805 $46
Dentists 3.9% $76,960 $43,919 $271 $18 $51 $333 $32,368
Other Professionals (Licensed) 4.6% $90,191 $48,454 $22,078 $1,486 $983 $5,170 $12,019
Chiropractic 0.5% $8,984 $5,231 $1,773 $98 $38 $852 $992
Physical Therapy 0.7% $14,651 $9,084 $3,207 $247 $228 $0 $1,884
Podiatrist 0.1% $1,728 $1,109 $348 $34 $43 $0 $194
Psychological 1.5% $29,647 $17,142 $7,879 $342 $94 $0 $4,190
Optometrists 0.2% $3,198 $2,146 $621 $115 $0 $0 $317
Other (Professional) 1.6% $31,984 $13,743 $8,250 $651 $581 $4,318 $4,442
Home Health Care 0.3% $5,797 $3,323 $1,458 $53 $141 $0 $822
Drugs & Supplies 13.7% $269,339 $143,587 $68,295 $2,894 $9,154 $4,562 $40,847
Rx 13.7% $269,244 $143,579 $68,238 $2,880 $9,154 $4,562 $40,831
Other Supplies 0.0% $95 $8 $57 $14 $0 $0 $16
Vision & DME 1.0% $19,259 $12,448 $3,182 $301 $213 $1,013 $2,102
Nursing Home 0.4% $8,684 $6,328 $1,173 $288 $58 $0 $836
Other Unclassified 0.9% $18,129 $16,638 $10 $2 $1 $0 $1,477
Mental Health & Other Govt Activities 0.0% $0 $0 $0 $0 $0 $0 $0
Admin and Net Cost of Health Insurance 9.4% $186,079 $62,303 $22,589 $5,309 $4,901 $46,794 $44,183
Administration 13.4% $265,044 $109,738 $46,663 $5,349 $10,988 $46,794 $45,512
Change in Surplus -4.0% ($78,965) ($47,435) ($24,074) ($41) ($6,087) $0 ($1,329)
TOTAL VERMONT EXPENDITURES 100.0% $1,971,192 $1,040,027 $419,441 $28,989 $55,011 $120,620 $307,105
Percent of total expenditures 100.0% 52.8% 21.3% 1.5% 2.8% 6.1% 15.6%
Note: All physician spending including hospital physicians in the Resident Analysis are shown in the physician service category
Payer reported data
Allocations estimated from VT specific data
Amounts imputed from National Health Expenditures or other indirect sources
2016 EXPENDITURE ANALYSIS-RESIDENTCommercial Insurance Detail

37
P
All dollar amounts are reported in thousands
PROVIDERS & FACILITIES
Percent
of Total Total
Out of
Pocket Commercial Medicare Medicaid
Other
Government -
Federal
Other
Government -
State & Local
Hospitals 46.7% $2,819,259 $233,026 $1,234,129 $782,303 $360,966 $199,407 $9,428
Community Hospital 41.7% $2,519,281 $230,870 $1,198,709 $766,912 $322,790 $0 $0
Inpatient 11.2% $675,380 $52,370 $272,688 $265,076 $85,246 $0 $0
Inpatient-Physician 2.4% $142,700 $13,077 $66,989 $37,967 $24,667 $0 $0
Outpatient-Physician 5.0% $299,380 $27,436 $140,541 $79,653 $51,750 $0 $0
Outpatient & ER 23.2% $1,401,821 $137,987 $718,492 $384,216 $161,126 $0 $0
Veterans Hosp 3.6% $215,453 $4,202 $12,237 $0 $0 $198,865 $149
Psych Hosp - State 0.3% $20,297 $15 $0 $456 $19,770 $0 $56
Psych Hosp - Private 1.1% $64,228 ($2,061) $23,183 $14,936 $18,406 $543 $9,222
Physicians 7.0% $422,335 $52,515 $172,743 $112,367 $73,004 $11,571 $134
Office of Physicians 6.7% $402,711 $50,422 $165,421 $107,955 $67,271 $11,509 $133
Ambulatory Clinics 0.2% $14,206 $1,812 $5,857 $3,810 $2,727 $0 $0
CMHCs 0.0% $270 $31 $103 $0 $136 $0 $0
Other Ambulatory Clinics 0.2% $13,936 $1,781 $5,755 $3,810 $2,591 $0 $0
Labs 0.1% $5,418 $281 $1,465 $602 $3,006 $62 $1
Dentists 4.7% $284,987 $160,634 $89,937 $0 $34,215 $0 $202
Other Professionals (Licensed) 5.3% $318,660 $56,339 $155,867 $54,100 $52,282 $72 $0
Chiropractic 0.5% $31,772 $8,308 $16,602 $4,373 $2,490 $0 $0
Physical Therapy 0.8% $48,697 $8,387 $18,289 $14,564 $7,458 $0 $0
Podiatrist 0.1% $5,099 $1,100 $2,056 $1,673 $270 $0 $0
Psychological 0.9% $51,624 $6,444 $20,912 $4,542 $19,654 $72 $0
Optometrists 0.7% $40,178 $6,335 $19,654 $0 $14,189 $0 $0
Other (Professional) 2.3% $141,290 $25,765 $78,355 $28,949 $8,221 $0 $0
Home Health Care 2.3% $141,457 $3,907 $13,139 $78,386 $41,153 $2,555 $2,317
Drugs & Supplies 14.8% $896,390 $147,719 $304,577 $345,320 $102,703 ($3,874) ($55)
Rx 13.1% $788,640 $129,962 $267,966 $303,811 $90,358 ($3,409) ($48)
Other Supplies 1.8% $107,750 $17,757 $36,612 $41,509 $12,345 ($466) ($7)
Vision & DME 1.5% $88,348 $48,866 $13,776 $18,493 $7,213 $0 $0
Nursing Home 4.5% $269,750 $43,062 $3,680 $80,122 $125,721 $7,890 $9,274
Other Unclassified 0.6% $33,659 $14,555 $2,656 $0 $500 $0 $15,948
Mental Health & Other Govt Activities 12.7% $766,175 $0 $0 $0 $711,450 $22,003 $32,722
Admin and Net Cost of Health Insurance 0.0% $0 $0 $0 $0 $0 $0 $0
Administration N/A $0 $0 $0 $0 $0 $0 $0
Change in Surplus N/A $0 $0 $0 $0 $0 $0 $0
TOTAL VERMONT REVENUES 100.0% $6,041,021 $760,623 $1,990,505 $1,471,091 $1,509,207 $239,625 $69,970
Percent of total expenditures 100.0% 12.6% 32.9% 24.4% 25.0% 4.0% 1.2%
Note: All physician revenues including hospital physicians in the Resident Analysis are shown in the physician service category
Provider reported data
Allocations estimated from VT specific data
Amounts imputed from National Health Expenditures or other indirect sources
N/A Not Applicable
2016 EXPENDITURE ANALYSIS-PROVIDER

National Health Expenditures (NHE)
is recorded at three different levels
38
Methodologies, Technical Notes and Sources
Personal Health Care (PHC)
-Hospital
-Professional Services
-Physician and clinics
-Other professionals
-Dental
-Other health, residential, and person care
-Home Health
-Nursing care facilities and continuing care retirement communities
-Retail outlet sales of medical products
-Prescription drugs
-Other medical products
-Durable medical equipment
-Non-durable medical equipment
Health Consumption Expenditures (HCE)
Personal Health Care plus:
-Administration and the net cost of private insurance
-Public health activity
National Health Expenditures (NHE)
Health Consumption Expenditures plus:
-Investment
-Research
-Structures
-Equipment
Source: National Health Statistics Group, Office of the Actuary, Centers for Medicare & Medicaid Services
Vermont expenditures do not include investments in research, structures and equipment as defined in the NHE

National Health Expenditures
Health Consumption Expenditures (HCE)
• represents spending for all medical care rendered during the year,
• includes the total amount spent to treat individuals with specific medical conditions,
• includes spending by governments to organize and deliver health services, and prevention and control health problems,
• and the administrative cost of running various government health care programs, and the difference between premiums earned by insurers and the claims or losses incurred for which insurers become liable.
National Health Expenditures (NHE)
• includes Health Consumption Expenditures and medical sector purchases of structures, equipment and for noncommercial medical research.
Please see the link below:
https://www.cms.gov/Research-Statistics-Data-and-Systems/Statistics-Trends-and-Reports/NationalHealthExpendData/index.html
39
Methodologies, Technical Notes and Sources

Methodologies, Technical Notes and Sources
NHE, Health Consumption Expenditures website at https://www.cms.gov/Research-Statistics-Data-and-Systems/Statistics-Trends-and-Reports/NationalHealthExpendData/NationalHealthAccountsHistorical.html
US Comparisons: National Health Expenditure Data (NHE), the Centers for Medicare and Medicaid Services’ website at https://www.cms.gov/Research-Statistics-Data-and-Systems/Statistics-Trends-and-Reports/NationalHealthExpendData/NationalHealthAccountsHistorical.html
US Dept. of Labor, Bureau of Labor Statisticshttp://stats.bls.gov/oes/current/oes_nat.htm
VT Dept. of Labor http://www.vtlmi.info/occupation.cfm
40

Methodologies, Technical Notes and Sources
GSP refers to the US Bureau of Economic Analysis-Gross State Product (GSP), or Gross Regional Product (GRP), and is a measurement of the economic output of a state. The sum of all value added by industries within the state and serves as a counterpart to the Gross Domestic Product (GDP). http://www.bea.gov/iTable/iTable.cfm?reqid=70&step=1&isuri=1&acrdn=1#reqid=70&step=7&isuri=1&7001=1200&7002=1&7003=200&7090=70&7005=-1&7006=50000&7093=levels&7004=naics
VT Household Health Insurance Survey http://hcr.vermont.gov/survey aids in enrollment calculations and out-of-pocket calculations
Vermont Healthcare Claims Uniform Reporting and Evaluation System (VHCURES) payer data is used to supplement source data and is also used to test for reasonableness and trends to what the payers aggregately reported. http://gmcboard.vermont.gov/hit/vhcures
41
Methodologies, Technical Notes and Sources
Commercial payers “Spend” is defined as earned premiums.
Medicare data are from The Dartmouth Institute for Health Policy & Clinical Practice (TDI). Because 2016 Medicare claims are not yet available, this report includes Medicare estimates based upon recent three-year annual average growth trends.
2015 Expenditure Analysis was updated to include actual 2015 Medicare data and Out-of-Pocket adjusted accordingly.
The Out-of-Pocket (OOP) methodology is primarily Vermont data with allocations using Medicare claims expenditures from TDI reports and VHCURES. VT Household Health Insurance Survey and 2012 U.S. census data (latest available) and the NHE are still used to help estimate out-of-pocket costs for unique provider populations and services.
42

Methodologies, Technical Notes and Sources
Enrollment data used to provide a summary of Vermonters’ health care coverage is collected from a variety of payer sources that include the Annual Statement Supplemental Report (ASSR), Vermont Health Care Uniform Reporting and Evaluation System (VHCURES), the Dartmouth Institute for Health Policy & Clinical Practice (TDI), Vermont Household Health Insurance Survey (VHHIS), the Department of Vermont Health Access (DVHA), the Vermont Department of Health (VDH).
Timing differences: this report includes data from both calendar years and from federal fiscal years (October 1, YYYY through September 30, YYYY) because organizations represented in this report base their data on different fiscal years. The data issue has been consistently recognized since the early 1990s when the report was first developed and since some data is an estimate, we have not attempted to adjust for these timing differences.
Medicaid Mental Health & Other Government Activities are reported equally on both Resident and Provider Analyses because when the Expenditure Analysis was first developed there was no method or ability to isolate resident versus provider expenditures for these services. These accounts are under review for better reporting.
43
Methodologies, Technical Notes and Sources
Physician data reported in the Provider analysis has been changing methodologies to rely
on Vermont specific data from VHCURES and less on the census and the NHE. While that
data is less than 100% of Vermont’s claims data and more reliable it will continue to be
tested and adjusted for the in-migration of patients. The methodology and question of
how to define “physician” data will continue to be explored and improved.
For a complete list of the sources and methods used in the Vermont Health Care
Expenditure Analysis, please refer to the Expenditure Analysis Manual, which is available
upon request.
44

Acknowledgements
The Green Mountain Care Board wants to thank the many individuals in government, commercial insurance, and the health care provider community for their valuable time and assistance that enabled us to produce this report. The Board also thanks its staff, the staff of the Agency of Human Services, and all others who provided their data and feedback.
If you have questions about this report, please contact Lori Perry, Pat Jones, Kelly Theroux, Thomas Crompton, or Janeen Morrison at (802) 828-2177.
45

Tableau Workbench Environment
46

Static View of Interactive Dashboard
47