2017-08-08 - summer 2017 economic profile - cerritos · the cerritos economic profile is a report...
TRANSCRIPT

A City With Vision
Quarterly Market Trend Analysis for Economic Development in Cerritos
City of Cerritos
Economic Profile Summer 2017

Table of Contents
Section Page
Introduction i Economic Development Commission ii Executive Summary iii Major Economic Indicators—Nationwide iv Major Economic Indicators—Los Angeles County v Major Revenues Sales Tax 2 Sales Tax—First Quarter Analysis 3 Sales Tax—Cerritos Auto Square 4 Sales Tax—Los Cerritos Center 5 Sales Tax—Cerritos Industrial Park 6 Sales Tax—Plaza 183 7 Other Sectors 8 Top Five Retail Trade—NAICS Code 9 Auto Sales 10 Auto Sales—Annual Totals 11 Auto Sales—Weekly Averages 12 Business License 13 Transient Occupancy Tax (TOT) 14 Assessed Valuation 15 Unemployment Current Rate 17 Surrounding Cities, Comparable Cities and Counties 18 Annual Unemployment Rate 19 Labor Force 20 Employment in Cerritos 21 Unemployment in Cerritos 22 Commercial Real Estate Certificate of Occupancy 24 Tenant Improvement 25 Total Vacancy in Cerritos 26 Office Vacancy Rates 27 Retail Vacancy Rates 28 Industrial Vacancy Rates 29 Vacancy Breakdown by Use 30 Housing Single-Family Residential 32 Single-Family Residential—One Year Trend Line 33 Single-Family Residential—Regional Comparison 34 Multi-Family Residential—Condominiums 35 Data Sources 36

IntroductionIntroductionIntroduction
The Cerritos Economic Profile is a report that is prepared on a quarterly basis to conduct market trend analysis and to develop strategies for the City’s Business Retention and Expansion (BRE) Program. The BRE program was created in order to identify business climate issues and individual actions that would improve the operating conditions of existing businesses. It also provides the mechanism to identify “at risk” businesses and respond to their specific needs. The development of the BRE was identified in the City of Cerritos Economic Development Strategic Plan (EDSP), which was adopted by the Cerritos City Council in 2007. As identified in the EDSP, Goal BAR-1 recommends that the City identify the “best customers” among existing Cerritos businesses and initiate an outreach program. In addition, Goal BAR-7 recommends that staff dedicate resources to track market trends. With this in mind, this Economic Profile is a product of the EDSP and complements the BRE by tracking market trends for the preparation of economic development strategies. The Economic Profile will assist City staff in responding proactively to the ever changing business climate. In addition, this report supports the City’s commitment to creating a business-friendly environment in which quality jobs may grow and prosper. The report will also assist the City in expanding on its tremendous success with its economic base by identifying growth industries as well as declining industries in need of reinvigoration. The Economic Profile is comprised of several sections, which includes Major Revenues, Employment, Housing, and Commercial Real Estate. The statistical data is compiled from a wide variety of sources, such as the California Employment Development Department, Cerritos’ Finance Division, and several real estate publications. The quarterly report provides a wealth of information and will be used by City staff to monitor the economic profile of the City in order to develop precise strategies to improve the business climate in Cerritos. The Economic Profile is the first of its kind in the local Gateway Cities region and it illustrates the commitment of Cerritos to its tradition of being “A City with Vision.” The publication of the Economic Profile is a business attraction and retention effort by the Cerritos’ City Council and it illustrates the City’s commitment to economic development in order to continue to provide high-quality services to the public. With this in mind, the City is proud to present this quarterly report for the residents of Cerritos, businesses, developers, and other outside business professionals in order to attract new businesses and to grow the local economy.
Page i
Jim Edwards Councilmember
Naresh Solanki Councilmember
Frank A. Yokoyama Councilmember
Grace Hu Mayor
Mark E. Pulido Mayor Pro Tem

Economic Development CommissionEconomic Development CommissionEconomic Development Commission
The Economic Development Commission acts in an advisory capacity to the City Council on the needs of existing businesses and the availability of economic development opportunities and resources. The Commission is responsible for providing input on business retention, business expansion, business marketing issues and technology related issues. Additionally, the Commission reviews the Economic Profile on a quarterly basis and provides guidance on a variety of issues including revenues, housing, employment, and commercial real estate. The Commissioners, which are appointed by the City Council, have a diverse business background and provide a unique perspective on economic development issues facing the City. Regular meetings of the Economic Development Commission are held at 7:00 p.m. on the second Tuesday of the month, in February, May, August and November at the City Hall Council Chambers. The Commission members include:
Riaz Surti Commissioner
Robert Buell Commissioner
Brian Hews Commissioner
Richard Alegria Chair
Carmelita Lampino Vice Chair
Page ii
2010 Winner Most Business-Friendly City Award
Executive SummaryExecutive SummaryExecutive Summary
Page iii
Cerritos Economic Profile for Summer 2017 For Summer of 2017, the City of Cerritos is showing continued economic growth for all sectors, which include sales tax, housing, commercial real estate, and employment. Overall sales tax increased from the previous year, the Cerritos Auto Square generated higher sales tax revenue from last year, the Transient Occupancy Tax increased from the previous year, and the unemployment rate continued to decrease (3% in May 2017). Additionally, the office vacancy rate (3%), industrial vacancy rate (2%), and retail vacancy rate (1%) experienced low vacancy rates for the second quarter, and housing prices (single-family and multi-family) continued to increase from the previous year and are higher than a majority of comparable cities. Below is a brief summary of each of the economic indicators for the City of Cerritos, which are explained in further detail throughout this Economic Profile. Major Revenues Sales tax revenue for the 2017-Q1 totaled $6,428,511 which is a 1.7% increase from the first quarter in 2016, amounting to an approximate increase of $107,123. Additionally, in a first quarter analysis of the past three years, sales tax revenue increased significantly from $5.4 million in 2014-Q1 to $6.4 million in 2017-Q1. The Cerritos Auto Square generated the greatest amount of sales tax for the City in 2017-Q1, totaling $3.6 million, which was an 10.3% increase from last year, amounting to an increase of $344,533. The Los Cerritos Center generated the second highest sales tax at $977,714, which was consistent with previous years. The third highest sales tax generator was the Cerritos Industrial Park at $519,861which equated to a 5.3% increase from the previous year. In the second quarter of 2017, the Cerritos Auto Square sold a total of 15,149 cars, which was a decrease of 421 cars from last year for the same quarter. Second quarter new business licenses and renewals decreased from a year ago; however, still generated $279,943 in General Fund monies. For 2017-Q2, the City received $321,832 in Transient Occupancy Tax revenue. Unemployment/Employment The unemployment rate among Cerritos residents is approximately 3% (May 2017 estimate), which is one of the lowest among surrounding cities and one of the lowest in comparison to cities with similar size and/or demographics in the region. Additionally, the Cerritos labor force for May 2017 was 24,915 and was constituted by 24,175 employed and 740 unemployed residents. Commercial Real Estate Cerritos currently has 478,255 square feet of vacant space, which is approximately 2% of the total available real estate space in Cerritos (21,196,480 sq. ft.). Of the total 2% vacant space in Cerritos, 73% is industrial space (373,164 sq. ft.), 16% is office space (40,087 sq. ft.), and 11% is retail space (65,004 sq. ft.). Industrial vacant space in Cerritos includes a greater proportion of warehousing and distribution businesses, which require large facilities. Due to the large amount of space required for industrial warehousing, a single vacancy may have a significant impact on available industrial space. Housing For 2017-Q2, the single-family median home sale price in Cerritos was approximately $713,767. In a regional comparison of the second quarter, homes in Cerritos have maintained their values and were higher than most cities of comparable size and demographics. Condominiums has an average median sales price of $524,800 which was higher than the previous year.

Major Economic IndicatorsMajor Economic IndicatorsMajor Economic Indicators———NationwideNationwideNationwide
The Bureau of Labor Statistics (BLS) is a unit of the United States Department of Labor and serves as the principal fact-finding agency for the United States Government in the broad field of labor and statistics. The BLS is a governmental statistical agency that collects, processes, analyzes, and disseminates essential statistical data to the American public, the United States Congress, other Federal agencies, State and local governments, business, and labor representatives. On a monthly basis, the BLS produces a brief economic “snapshot” of the United States economy on their website, which includes economic indicators from a variety of sectors. These economic indicators help business professionals to gauge the economy and assists in creating policies and strategies to stimulate economic growth. Below is the most recent economic “snapshot” from the BLS. Although this Economic Profile serves as a “snapshot” for the City of Cerritos’ local economy, economic indicators, as provided below, provide an overview and comparison between the City and the United States.
Brief Overview of the United States Economy
Consumer Price Index (CPI): 0.0% in June 2017
As a widely used measure of inflation, the Consumer Price Index measures price movements of major groups of goods and services. The CPI presents price changes on food, energy, housing, apparel, transportation, medical care,
recreation, and education.
Unemployment Rate: 4.4% in June 2017
Current unemployment rate for the United States.
Payroll Employment: +220,000(p) in June 2017
The number of new persons added to the payroll at the Federal level.
Average Hourly Earnings: +$0.04(p) in June 2017
Increase in average hourly earnings.
Producer Price Index - Final Demand: +0.1%(p) in June 2017
A measurement of the average changes in prices received by domestic producers for their output.
Employment Cost Index (ECI): +0.8% in First Quarter of 2017
A quarterly report from the U.S. Department of Labor that measures the growth of employee compensation (wages and benefits). The index is based on a survey of employer payrolls in the final month of each quarter. The ECI tracks move-
ment in the cost of labor, including wages, fringe benefits and bonuses for employees at all levels of a company.
U.S. Import Price Index: -0.2% in June 2017
A measurement of the average changes in prices of goods and services that are imported to the United States.
U.S. Export Price Index: -0.2% in June 2017
A measurement of the average changes in prices of goods and services that are exported from the United States.
Page iv

Major Economic IndicatorsMajor Economic IndicatorsMajor Economic Indicators———Los Angeles CountyLos Angeles CountyLos Angeles County
With a population of over 10 million, Los Angeles County has more residents than 42 states. The county covers 4,084 square miles and is comprised of 88 cities, including the City of Cerritos. In addition to its signature industries (entertainment, international trade, and tourism), Los Angeles County is also an important center of manufacturing and innovation. The Los Angeles Economic Development Corporation (LAEDC) develops an annual economic forecast and industry outlook for the Southern California region. Below are the Los Angeles County economic indicators and forecasts from the 2017-2018 Economic Forecast and Industry Outlook report, which was created by the LAEDC’s Institute for Applied Economics in February 2017.
Page v
2015 2016 2017 Forecast 2018 Forecast
Real GDP 615,888,000 629,347,000 645,387,000 662,099,000
Annual percentage change in GDP 3.6 2.2 2.5 2.6
Total personal income (millions) 544,325,000 557,382,000 587,755,000 610,022,000
Per capital personal income (millions) 53,521,000 54,577,000 57,168,000 59,041,000
Per capital personal income 48,836,000 48,788,000 50,647,000 51,609,000
Gross Domestic Product (GDP)
2015 2016 2017 Forecast 2018 Forecast
Population (millions) 10,170,000 10,240,000 10,300,000 10,370,000
Population growth rates
0.6 0.7 0.6 0.6
Population
2015 2016 2017 Forecast 2018 Forecast
Unemployment rate (percentage) 6.7 5.1 5.0 4.9
Average annual nonfarm
employment 4,274,200 4,362,200 4,426,600 4,495,200
Annual percentage change in
employment 2.0 2.1 1.5 1.5
Labor Market

Major Economic IndicatorsMajor Economic IndicatorsMajor Economic Indicators———Los Angeles CountyLos Angeles CountyLos Angeles County
Page vi
2015 2016 2017 Forecast 2018 Forecast
Residential permits (LA County) 22,652 20,213 23,439 25,037
Median home income 490,083 519,300 557,944 593,036
Housing
2015 2016 2017 Forecast 2018 Forecast
Total Nonfarm 85,200 88,000 64,400 68,600
Natural Resources -400 -400 0 100
Construction 6,500 1,200 2,900 4,600
Manufacturing -3,300 -6,000 -1400 0
Wholesale Trade 4,500 -1,100 1,600 3,600
Retail Trade 7,500 9,000 4,700 6,900
Transport/Warehousing 7,000 3,400 2,300 1,400
Information 4,700 6,400 1,500 1,700
Finance & Insurance -200 1,800 2,200 1,900
Real Estate/Rental & Leasing 3,200 3,400 1,200 700
Prof/Scientific/Tech Services -700 6,100 4,200 4,000
Management of Com-panies 0 1,600 500 200
Administrative & Sup-port 1,800 4,600 10,200 12,600
Educational Services 1,400 6,600 600 1,300
Health Care/Social Assistance 20,100 24,100 16,200 15,200
Leisure & Hospitality 21,500 17,400 9,100 9,800
Other Services 1,200 2,000 170 1,700
Government 10,200 8,100 6,900 2,900
Jobs (change over previous

Major Revenues

Page 2
Major Revenues
Sales Tax For 2017-Q1, businesses in the City generated $6.4 million in sales tax revenue, which is a 1.7% increase ($107,123 increase) from 2016-Q1. Over the past four quarters (2016-Q2 to 2017-Q1), sales tax for the City has averaged $6.9 million with no decrease in revenue in quarter-per-quarter comparison from the previous year. There was a decrease from 2016-Q4 to 2017-Q1; however, fourth quarter sales tax is typically higher than all other quarters due to holiday shopping spending. Subsequently, sales tax in the first quarter tends to decrease with the end of the holiday shopping season. Please note that sales tax reporting is one quarter behind and the data presented herein is the most current data available.
Sales Tax Revenue – Calendar Year
From 2013 to 2014, annual sales tax revenue increased from $22,994,391 to $23,238,546, resulting in a 1.1% increase ($244,155). Sales tax revenue increased again from $23,238,546 in 2014 to $25,704,791 in 2015 (10.6% increase or $2,466,245). In 2016, sales tax again exceeded the previous year, increasing from $25,704,791 in 2015 to $27,726,062 in 2016 (7.9% increase or $2,021,271). The City has experienced an increase in sales tax revenue over the past three years. This may be attributed to the growing local economy, a declining unemployment rate, a low vacancy rate at the Industrial Park and regional commercial centers, new commercial development in the City, and an increase in auto sales at the Cerritos Auto Square.
Sales Tax Revenue from the Past Four Calendar Years
2013 2014 2015 2016 $22,994,391 $23,238,546 � $25,704,791 � $27,726,062 �

Page 3
Major Revenues Sales Tax – First Quarter Analysis Based on a trend analysis, quarterly sales tax was at $5.4 million in 2014-Q1, increased slightly in 2015-Q1 to $5.8 million, increased again in 2016-Q1 to $6.3 million and increased once again to its current level of $6.4 million in 2017-Q1, which was the highest reporting period over four years. The trend line indicates an increase in sales tax revenue in a first quarter-per-quarter analysis. The continued growth in sales tax revenue can be attributed to an increase in consumer confidence, which resulted in increased shopping activity at the Cerritos Auto Square, the Los Cerritos Center, Plaza 183, and other shopping centers throughout the City. For 2017-Q1, the United States Department of Commerce reported that the United States economy grew by 1.4% (gross domestic product) and Cerritos sales tax growth exceeded this amount in a one year comparison (1.7% in sales tax growth).
First Quarter Trend Analysis
First Quarter Analysis
2014-Q1 2015-Q1 2016-Q1 2017-Q1 $5,411,900 $5,874,522 $6,321,388 $6,428,511
2017-Q1 United States Gross Domestic Product (GDP): 1.4% increase from the previous year 2017-Q1 Cerritos Sales Tax: 1.7% increase from the previous year

Page 4
Major Revenues
Sales Tax – Cerritos Auto Square The Cerritos Auto Square generated the greatest amount of sales tax of any business sector in the City during 2017-Q1 (approximately $3.6 million). In a quarter-to-quarter comparison, 2017-Q1 ($3.6 million) increased from 2016-Q1 ($3.3 million) or an increase of $344,534 which equates to 10.3%. Additionally, 2016-Q1 was higher than 2015-Q1 ($3 million) and 2014-Q1 ($2.5 million). This trend analysis indicates an increase in auto sales and a robust local economy. According to CNBC, during the first quarter, luxury brand manufacturers such as Infiniti and Lexus have reported increases in sales. Infiniti reported an 18% increase in sales and the Lexus NX compact SUV reported a 24% increase in sales, which generate higher sales tax in comparison to non-luxury brand vehicles. Additionally, sales tax from the Cerritos Auto Square includes sales of auto parts and accessories, which are sold by the dealers.
Cerritos Auto Square Average: $3,180,384
2014-Q1 to 2017-Q1
2014-Q1 2015-Q1 2016-Q1 2017-Q1 $2,544,228 $3,000,105 $3,339,673 $3,684,207

Page 5
Major Revenues
Sales Tax – Los Cerritos Center
In 2017-Q1, the Los Cerritos Center (Center) generated the second highest amount of sales tax revenue for the City’s General Fund at $977,714. Based on the trend analysis, sales tax revenue remained constant for the first quarter at approximately $980,528 over a four year period. According to the United States Census Bureau (Census), retail sales increased nationwide by 5.1% for 2017-Q1. This nationwide trend in marginal retail sales tax revenue during 2017-Q1 may account for the constant sales tax figures at the Los Cerritos Center. Additionally, according to the Census, E-commerce sales increased by 14.7% in the first quarter, which may account for the constant sales tax at the Los Cerritos Center averaging $980,528 for the first quarter from 2014 to 2017. In total, the Los Center averaged $1,110,301 from 2014-Q1 to 2017-Q1 (including all quarters from 2014 to 2017).
Los Cerritos Center Average: $980,528
2014-Q1 to 2017-Q1
2014-Q1 2015-Q1 2016-Q1 2017-Q1 $971,198 $988,558 $984,641 $977,714

Page 6
Major Revenues Sales Tax – Cerritos Industrial Park The Cerritos Industrial Park is the third highest sales tax generator in Cerritos. The Cerritos Industrial Park generated $519,861 in 2017-Q1, which is a 5.3% increase from 2016-Q1 ($26,123 increase). Based on the trend analysis, sales tax revenue at the Cerritos Industrial Park has progressively increased each first quarter from 2014-Q1 to 2017-Q1. According to the United States Census Bureau (Census), sales of total manufacturing and trade industries increased nationwide by 0.2% for 2017-Q1. The Cerritos Industrial Park sales tax increase of 5.3% exceeded national averages of 0.2% in the manufacturing and trade industries, as reported by Census. Based on this data, the Cerritos Industrial Park exceeded national averages in terms of productivity and sales for the first quarter.
Cerritos Industrial Park Average: $506,941
2014-Q1 to 2017-Q1
2014-Q1 2015-Q1 2016-Q1 2017-Q1 $411,818 $416,436 $493,738 $519,861

Page 7
Major Revenues
Sales Tax – Plaza 183 Plaza 183, which is located east of the 605 Freeway, just north of the Los Cerritos Center, along 183rd Street, completed extensive façade improvements and landscape improvements in 2016. Additionally, a variety of new tenants opened for business at Plaza 183, which includes a variety of restaurants and retail stores. New retail stores that opened include Nordstrom Rack, Saks Fifth Avenue Off Fifth, T.J. Maxx, and Old Navy. For 2017-Q1, the City received a total of $93,102 in sales tax revenue from Plaza 183, which was a decrease from the previous quarter (a $62,785 decrease from 2016-Q4); however, fourth quarter sales tend to be higher with the holiday shopping season and sales tax tends to decrease in the first quarter with the end of holiday shopping season.
Plaza 183*
* With the completion of the new improvements, City staff began tracking Plaza 183 sales tax data in 2016-Q2. .
2016-Q2 2016-Q3 2016-Q4 2017-Q1 $142,113 $129,247 $155,887 $93,102

Page 8
Major Revenues Other Sectors As mentioned previously, the majority of Cerritos sales tax is generated by the Cerritos Auto Square, Los Cerritos Center, and the Cerritos Industrial Park. Additionally, there are five other sectors that also contribute towards generating sales tax for the City for 2017-Q1, as shown in the graph provided below. Of the five sectors, the Other Industrial (M)/Industrial Commercial (MC)/Industrial Commercial One (MC-1) sector generated the greatest amount of sales tax at $546,322. These sectors include businesses operating in these zones which are not part of the Cerritos Industrial Park. Business in the Industrial Commercial zone may include retail sales, machine shops, wholesaling and warehousing. These businesses are located in the industrial zone along Alondra Boulevard and Carmenita Road (north east section of the City) and businesses located along Valley View Boulevard (eastern section of the City bordering the City of Buena Park and the City of La Mirada).
Other Sectors
Other Industrial
Commercial Towne Center - Retail Communi ty
Commercial and Neighborhood Commercial
Other Regional
Commercial
Schools
$546,322 $317,611 $178,013 $123,015 $95,639

Page 9
Major Revenues Top Five Sectors By NAICS Code In Cerritos, the Retail Trade NAICS sector generated $4.6 million in sales tax revenue for 2017-Q1 or 73% of total revenues generated. However, there are other sectors identified by the North American Industry Classification System (NAICS) that generate sales tax for the City. Code 42 (Wholesale Trade) generated the highest sales tax at $407,754. Additionally, Code 72 (Accommodation and Food Services) generated $164,354, Code 53 (Real Estate Rental and Leasing) generated $86,994, Code 31-33 (Manufacturing) generated $59,607, and Code 49 (Transportation and Warehousing) generated $24,976 in sales tax revenue.
Top Five Sectors – NAICS Code
42 72 53 31-33 49 $402,754 $164,354 $86,994 $59,607 $24,976

Page 10
Major Revenues Auto Sales Cerritos is well known for the Cerritos Auto Square–the world's first and most successful auto mall. With 23 dealerships, the Cerritos Auto Square is located on Studebaker Road off the 605 Freeway at South Street. Developed in the early 1980’s, in partnership with the City of Cerritos and the former Cerritos Redevelopment Agency, the Cerritos Auto Square generates approximately half of the City’s sales tax revenue each year. For 2017-Q2, vehicle sales decreased by 2.7% from the previous year; however, 2017-Q2 was higher than 2015-Q2 and 2014-Q2. According to the Wall Street Journal, automotive manufacturers experienced a decline in sales in June 2017. General Motors sales declines 4.8%, Ford declined by 5%, Chrysler declined by 8%, Kia declined by 10.3%, Hyundai declined by 19.3%, and Mazda declined by 14.7%. Other automotive manufactures had marginal sales increases, such as Toyota who increased by 2.1%, Nissan increased by 2%, and Honda increased by 0.8%.
Second Quarter - Number of Vehicles Sold in Cerrito s Auto Square, Four Year Period
Cars Sold in 2017-Q2
April May June Q2 Total
2014-Q2 4,277 5,497 4,094 13,868 2015-Q2 4,337 5,080 4,259 13,676 2016-Q2 5,016 5,694 4,860 15,570 2017-Q2 4,789 5,539 4,821 15,149
2017-Q2 Total: 15,149 2016-Q2 Total: 15,570 Difference: (-421)

Page 11
Major Revenues
Auto Sales – Annual Totals The Cerritos Auto Square experienced another significant increase in vehicle sales in 2016 (61,938) over sales in 2015 (60,842). In fact, there was a 1.8% increase in auto sales from 2015 to 2016 with a total of 1,096 more cars sold. The 2016 calendar year marks a total of seven years in a row that total annual sales exceeded sales totals from the previous year (2010, 2011, 2012, 2013, 2014, 2015, and 2016). The Cerritos Auto Dealers Association has been compiling data since 1993 in order to conduct annual sales comparisons. From 1993 to 2016, a total of 1,137,858 cars have been sold, equating to an annual average of 47,411 cars. Sales have fluctuated over the years from a low of 27,208 cars sold in 2009 to a high in 2016 with 61,938 cars sold. All sales data is provided to the City from the Cerritos Auto Dealers Association. At the national level, auto sales also increased from the previous year. Nissan reported a 5.4% increase, Ford reported a 0.1% increase, General Motors reported a 2% increase, and Toyota reported a 4.4% increase.
2000 2001 2002 2003 2004 2005 52,925 54,164 53,288 54,191 52,857 52,290
2006 2007 2008 2009 2010
48,836 45,240 37,277 27,208 31,747
2011 2012 2013 2014 2015 2016 39,390 48,399 52,190 54,098 60,842 61,938
Trend Analysis – 2000 to 2016

Page 12
Major Revenues
Auto Sales – Weekly Averages Based on a trend analysis, weekly sales averages for May 2017 and June 2017 exceeded averages from the previous year. The weekly average total for 2017-Q2 was 3,787, which was higher than 2016-Q2, which was at 3,365. The increase in the weekly averages is due to five weeks in May 2016 and June 2016, which reduced the average number of vehicles sold per week.
Weekly Averages: 2014-Q2 to 2017-Q2
Weekly Averages: 2014-Q2 to 2017-Q2
April May June Q2 Total 2014-Q2 855 1,099 1,024 2,978 2015-Q2 887 1,270 852 3,009 2016-Q2 1,254 1,139 972 3,365 2017-Q2 1,197 1,385 1,205 3,787
2017-Q2 Total: 3,787 2016-Q2 Total: 3,365 Difference: 423

Page 13
Major Revenues
Business License The tracking of new and renewed business licenses is one method of forecasting business growth in the City. For 2017-Q2, a total of 1,036 new and renewal business licenses were processed by the City, which is a decrease of 14.3% from 2016-Q2 (a decrease of 173 new and renewal of business licenses processed). This decrease may be attributed to outside contractors that work in in the City for short periods of time. Outside business licenses decreased from 582 in 2016-Q2 to 463 in 2017-Q2, which is a decrease of 119 licenses. Only 54 inside business licenses were not renewed. With the issuance of 1,036 new and renewal business licenses issued in 2017-Q2, the City generated $279,943 in business license fees for the General Fund during this quarter.
2017-Q2 New and Renewal of Business Licenses – Loca ted in Cerritos and
Located Outside Cerritos
2017-Q2 New and Renewal of Business Licenses 2017-Q2 Total New and Renewal of Business Licenses: 1,036 2016-Q2 Total New and Renewal of Business Licenses: 1,209 Difference: (-173) 2017-Q2 Total Revenue: $279,943

Page 14
Major Revenues
Transient Occupancy Tax (TOT) Occupancy by individuals at any hotel located in the City is subject to a Transient Occupancy Tax in the amount of twelve percent (12%) of the room rate charged by the hotel operator. This tax is commonly referred as a TOT. In 2017-Q2, the City received a total of $321,832, which is an increase in TOT revenue collected by the City in 2016-Q2 ($290,451). March 2017 was the highest TOT generating month with $112,338 in TOT revenue and was a 7.1% increase from March 2016.
2017-Q2 Transient Occupancy Tax
2017-Q2 Total Revenue 2017-Q2 Total Revenue: $321,832 2016-Q2 Total Revenue: $290,451 Quarter Difference: $31,384 Percentage Difference: 10.8%
Page 15
Major Revenues
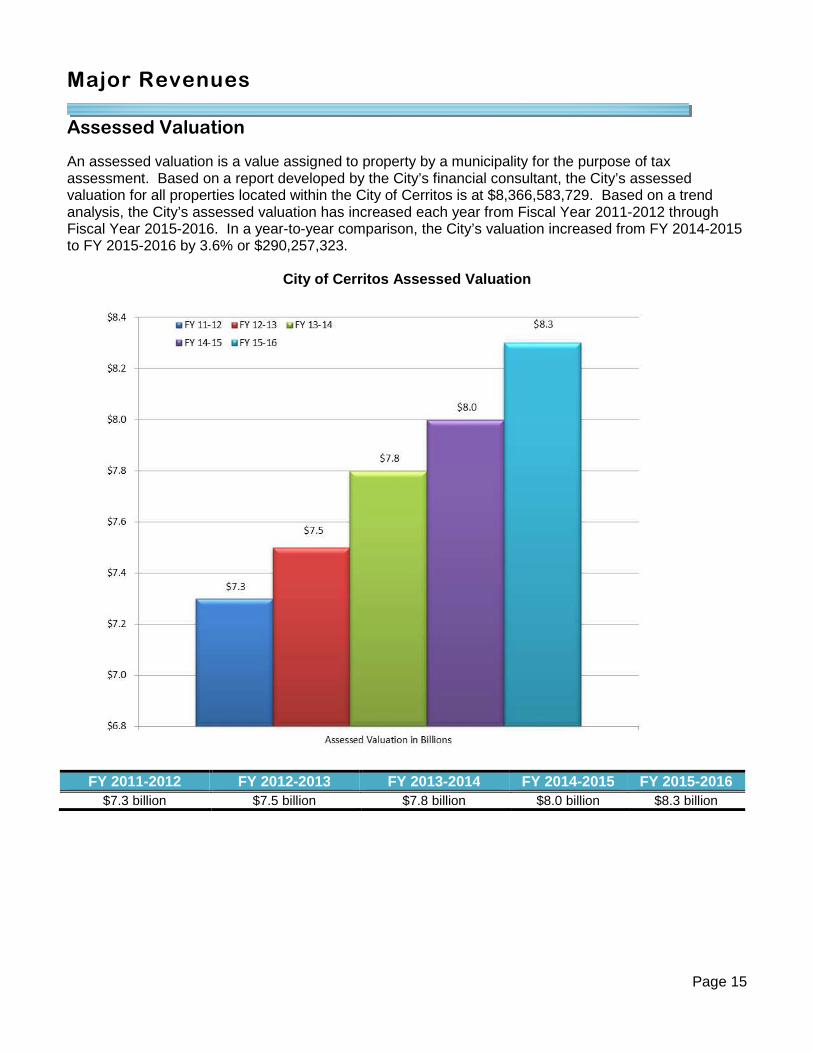
Assessed Valuation An assessed valuation is a value assigned to property by a municipality for the purpose of tax assessment. Based on a report developed by the City’s financial consultant, the City’s assessed valuation for all properties located within the City of Cerritos is at $8,366,583,729. Based on a trend analysis, the City’s assessed valuation has increased each year from Fiscal Year 2011-2012 through Fiscal Year 2015-2016. In a year-to-year comparison, the City’s valuation increased from FY 2014-2015 to FY 2015-2016 by 3.6% or $290,257,323.
City of Cerritos Assessed Valuation
FY 2011-2012 FY 2012-2013 FY 2013-2014 FY 2014-2015 FY 2015-2016 $7.3 billion $7.5 billion $7.8 billion $8.0 billion $8.3 billion

Unemployment

Page 17
Unemployment Current Rate According to the State of California Employment Development Department, the unemployment rate among Cerritos residents in May 2017 was approximately 3%, which was lower than the previous two years during the same month. The unemployment rate for May 2016 was 3.6% and May 2015 was 5.1%, which are both higher than May 2017 (3%). Additionally, each month during 2017-Q2 experienced a significant decrease in the unemployment rate over a three year period. This reduction in the unemployment rate is a positive sign for the local economy and an indicator of potential increased consumer confidence and businesses are hiring more persons. The industrial vacancy for 2017-Q2 was at a low of 2%, the retail vacancy rate was at 1%, and the office vacancy rate was at 3%, which illustrates why the current unemployment rate is at a low of 3%. The last time the unemployment rate reached a low comparable to 3% was in May 2007 (2.4%).
Quarterly Unemployment Rate
August 2016 November 2016 March 2 017 May 2017*
3.9% 3.5% 3.2% 3.0%
Unemployment Rate – Quarterly Comparison 2015 to 2017
*Please note that May 2017 numbers are preliminary, based on the State of California Employment Development Department.
Page 18
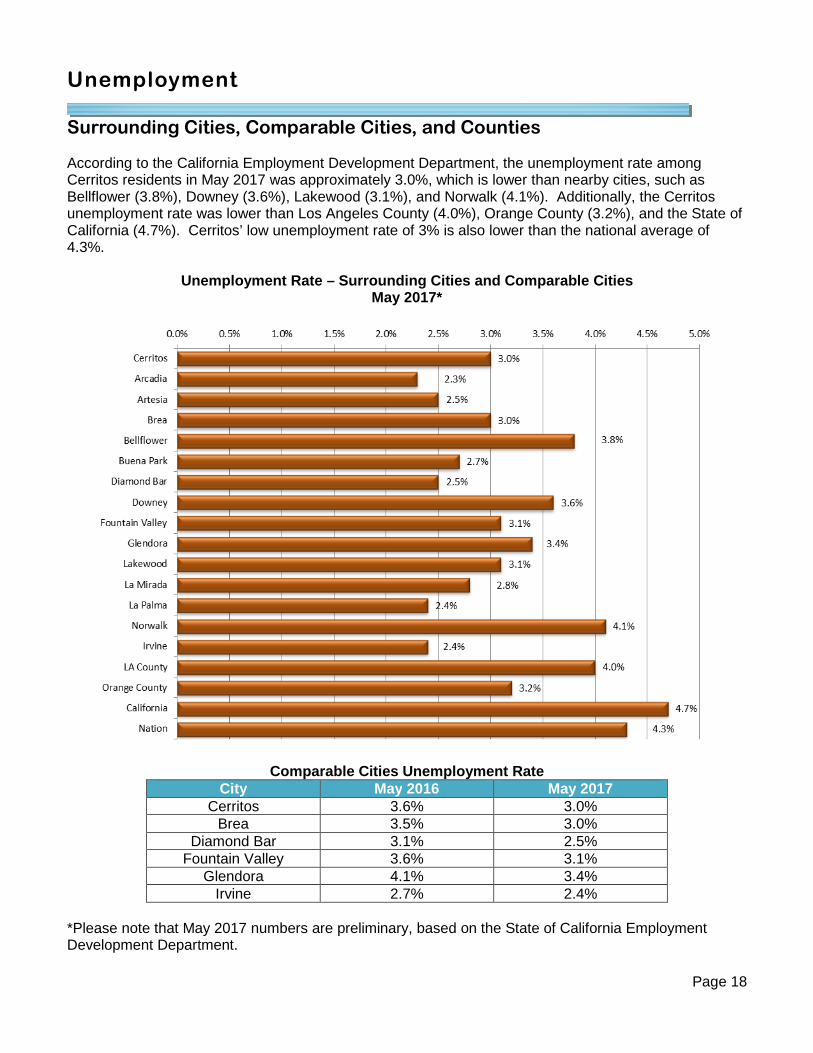
Unemployment Surrounding Cities, Comparable Cities, and Counties According to the California Employment Development Department, the unemployment rate among Cerritos residents in May 2017 was approximately 3.0%, which is lower than nearby cities, such as Bellflower (3.8%), Downey (3.6%), Lakewood (3.1%), and Norwalk (4.1%). Additionally, the Cerritos unemployment rate was lower than Los Angeles County (4.0%), Orange County (3.2%), and the State of California (4.7%). Cerritos’ low unemployment rate of 3% is also lower than the national average of 4.3%.
Unemployment Rate – Surrounding Cities and Comparab le Cities
May 2017*
Comparable Cities Unemployment Rate City May 2016 May 2017
Cerritos 3.6% 3.0% Brea 3.5% 3.0%
Diamond Bar 3.1% 2.5% Fountain Valley 3.6% 3.1%
Glendora 4.1% 3.4% Irvine 2.7% 2.4%
*Please note that May 2017 numbers are preliminary, based on the State of California Employment Development Department.

Page 19
Employment
Annual Unemployment Rate Currently, the average unemployment rate for 2017-Q2 is 3.1% (March 2017 to May 2017), which is lower than 2016-Q2, which was at 3.7%. This decrease may be attributed to the increased business activity at the City’s retail commercial centers and industrial areas, both having an overall low vacancy rate (1% for retail and 2% for industrial for 2017-Q2). The low vacancy rate indicates more persons are employed in Cerritos, which reduced the unemployment rate. Additionally, the overall vacancy rate for 2017-Q2, was at a low rate of 2%, which may also contribute to the low unemployment rate.
Average Annual Unemployment Rate
Average Annual Unemployment Rate
2011 2012 2013 2014 2015 2016 9.2% 8.2% 7.3% 6.1% 5.0% 3.9%

Page 20
Employment Labor Force According to the United States Bureau of Labor and Statistics, labor force refers to the sum of all employed and unemployed individuals in the economy. In Cerritos, there were 24,915 persons in the local workforce during May 2017, an increase of 435 persons from May 2016 (24,480). Additionally, April 2017 experienced a 450 person increase from April 2016 and March 2017 experienced a 421 person increase from March 2016. For 2017-Q2, the labor force averaged 24,926 persons, which is an increase from 2016-Q2, which averaged 24,490 persons. The increase of more persons in the labor force may be attributed to more persons employed in Cerritos with new developments completed and the low overall vacancy rate of 2%.
Labor Force – Cerritos
Annual Average Cerritos Labor Force
2012 2013 2014 2015 2016 23,845 24,187 24,502 24,441 24,551
Page 21
Employment
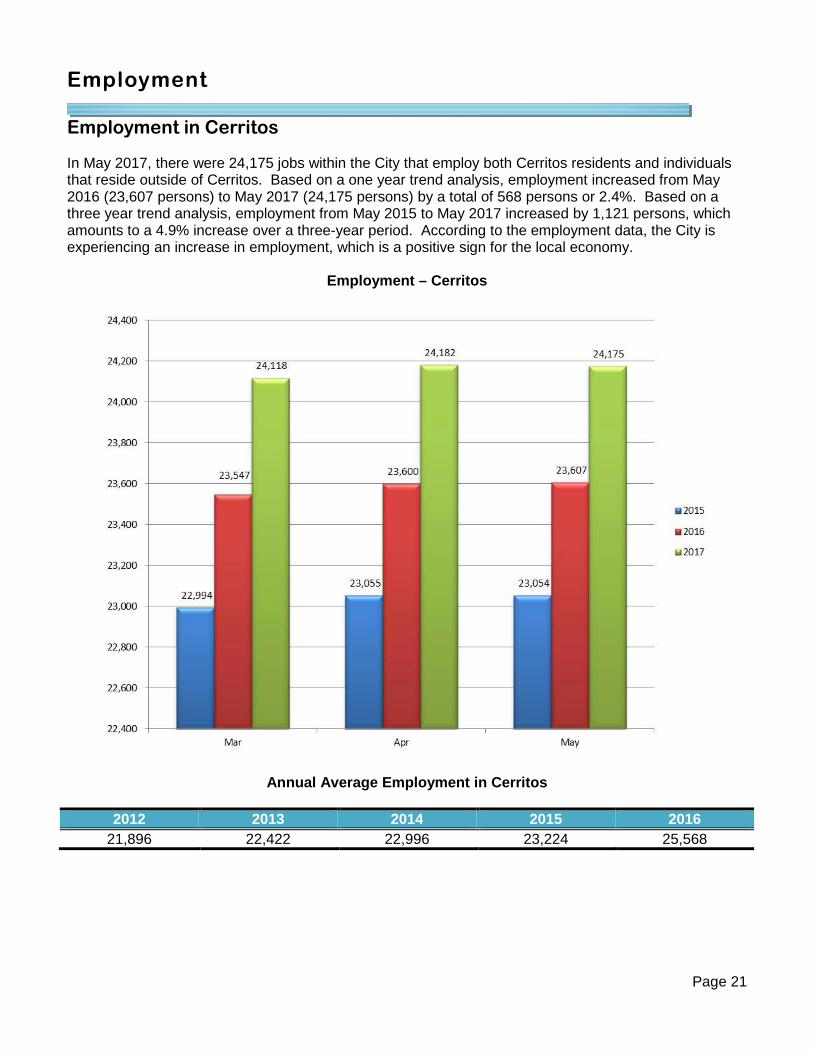
Employment in Cerritos In May 2017, there were 24,175 jobs within the City that employ both Cerritos residents and individuals that reside outside of Cerritos. Based on a one year trend analysis, employment increased from May 2016 (23,607 persons) to May 2017 (24,175 persons) by a total of 568 persons or 2.4%. Based on a three year trend analysis, employment from May 2015 to May 2017 increased by 1,121 persons, which amounts to a 4.9% increase over a three-year period. According to the employment data, the City is experiencing an increase in employment, which is a positive sign for the local economy.
Employment – Cerritos
Annual Average Employment in Cerritos
2012 2013 2014 2015 2016 21,896 22,422 22,996 23,224 25,568

Page 22
Unemployment
Unemployment in Cerritos According to the United States Bureau of Labor and Statistics, the number of individuals unemployed is calculated with the following formula: unemployment = labor force – employment. Based on the data from May 2017, there are currently 740 (3.0%) individuals unemployed in Cerritos, which is a decrease of 133 persons from May 2016 (873 unemployed) and a decrease of 492 persons from May 2015 (1,232 unemployed). This trend indicates a decrease in unemployed persons over a three-year period for the second quarter, which is a positive sign for the City. For 2017-Q2, unemployment averaged 767 persons, which is a decrease from 2016-Q2, which averaged 906 persons. From 2012 through 2016, the average annual number of persons unemployed in the City of Cerritos has continued to decrease, to its low in May 2017 (740 unemployed persons). This continued decrease in the number of unemployed persons in Cerritos is a positive indicator that the local economy is growing.
Unemployment – Cerritos
Annual Average Unemployed in Cerritos
2012 2013 2014 2015 2016 1,949 1,766 1,506 1,217 950

Commercial Real Estate
Page 24
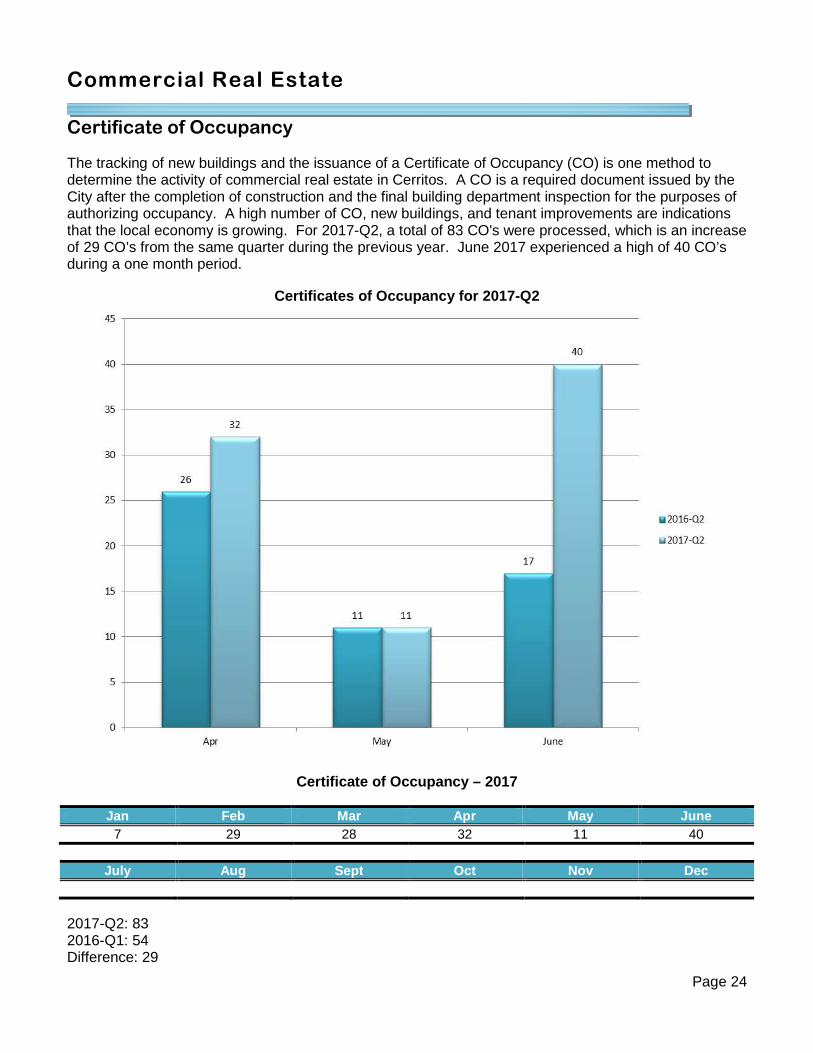
Commercial Real Estate Certificate of Occupancy The tracking of new buildings and the issuance of a Certificate of Occupancy (CO) is one method to determine the activity of commercial real estate in Cerritos. A CO is a required document issued by the City after the completion of construction and the final building department inspection for the purposes of authorizing occupancy. A high number of CO, new buildings, and tenant improvements are indications that the local economy is growing. For 2017-Q2, a total of 83 CO's were processed, which is an increase of 29 CO’s from the same quarter during the previous year. June 2017 experienced a high of 40 CO’s during a one month period.
Certificates of Occupancy for 2017-Q2
Certificate of Occupancy – 2017
Jan Feb Mar Apr May June 7 29 28 32 11 40
July Aug Sept Oct Nov Dec
2017-Q2: 83 2016-Q1: 54 Difference: 29

Page 25
Commercial Real Estate
Tenant Improvement A Tenant Improvement (TI) refers to changes made to the interior of a commercial or industrial property by its owner to accommodate the needs of a tenant. A TI is an indicator of a new business opening in the City or an existing business expanding or renovating to meet their needs. A total of 32 TI's were processed in 2017-Q2, which is an increase of 16 TI permits from 2016-Q2. June 2017 experienced a high of 16 TI permits, making June 2017 the highest month during 2017-Q2.
Tenant Improvements for 2017-Q2
Tenant Improvements – 2017
Jan Feb Mar Apr May June 6 13 16 2 14 16
July Aug Sept Oct Nov Dec
2017-Q2: 32 2016-Q2: 16 Difference: 16

Page 26
Commercial Real Estate
Total Vacancy in Cerritos The City of Cerritos currently has a low vacancy rate when compared to the overall total available space for industrial, office, and retail uses. Currently, there is approximately 373,164 square feet of vacant industrial space, which equates to 2% of the total available citywide industrial space (15,088,117 square feet). Additionally, the City has approximately 40,087 square feet of vacant office space (3% of the total office space in Cerritos) and approximately 65,004 square feet of available retail space (1% of the total retail space in Cerritos). This equates to a total of 478,255 square feet of available space in the City, which is equal to 2% of the total amount of square footage within the City (21,196,480).
Total Available and Vacant Space in Cerritos
Use Total Space
(Sq. Ft.) Total Vacant Space
(Sq. Ft.) Percent (%) of
Vacancy in Cerritos Industrial 15,088,117 373,164 2%
Office 1,422,575 40,087 3% Retail 4,685,788 65,004 1% Total 21,196,480 478,255 2%
In a quarter-by-quarter comparison, the City’s total available and vacant space in Cerritos has remained relatively low. In 2016-Q2, the total vacancy rate was at 4%, then decreased to 2% in 2016-Q3, decreased once again to 1% in 2016-Q4. In 2017-Q1, the vacancy rate increased slightly to 2% and remained the same in 2017-Q2. The current low vacancy rate of 2% and the reduction in the vacancy rate from 4% in 2016-Q2 to 2% in 2017-Q2, is a positive indicator for the local economy.
Total Cerritos Vacancy Rates
2016-Q2 2016-Q3 2016-Q4 2017-Q1 2017-Q2 4% 2% 1% 2% 2%

Page 27
Commercial Real Estate
Office Vacancy Rates
In 2017-Q2, the Cerritos office market vacancy rate was at 3%, which is a decrease from 2016-Q2, which was at 8%. The decrease in the office vacancy from 2016-Q2 to 2017-Q2 may be attributed to a decrease in the number of available office spaces for lease in the City. Based on available data, Loop.net reported 23 office spaces currently available in 2017-Q2 (40,087 square feet), compared to 53 spaces available in 2016-Q2 (117,650 square feet), which may account for the 5% decrease.
Cerritos Office Vacancy Rates

Page 28
Commercial Real Estate
Retail Vacancy Rates Cerritos currently has approximately 4,685,788 square feet of total retail space, which includes the Los Cerritos Center, Plaza 183, and the Cerritos Towne Center. Based on available data, Cerritos had a retail vacancy rate of 1% (65,004 square feet) during 2017-Q2, which is a decrease from 2016-Q2 (2%). Based on a trend analysis, the retail vacancy rate has remained at an average of 1.4% over the past five quarters. The retail vacancy rate has remained low due to the improvements at the Los Cerritos Center, the Cerritos Plaza Shopping Center, and at Plaza 183 located along 18rd Street, just north of the Los Cerritos Center. With the City’s shopping centers almost at full vacancy, the Cerritos retail vacancy rate should remain at 1% for the next several quarters. This low overall retail vacancy rate indicates that retail space is in great demand in Cerritos. In addition, Cerritos’ strategic location along the 91 and 605 Freeways contribute toward a greater demand for retail space. The Cerritos Towne Center and Los Cerritos Center are located along these freeways providing consumers with easy access to these centers for their retail shopping needs.
Cerritos Retail Vacancy Rates

Page 29
Commercial Real Estate
Industrial Vacancy Rates Cerritos currently has approximately 15,088,117 square feet of total industrial space, which includes the Cerritos Industrial Park. Based on available data, Cerritos had an industrial vacancy rate of 2% for 2017-Q2, which is a decrease from 2016-Q2 (4%). Based on a trend analysis, the industrial vacancy rate was at 4% during 2016-Q2, decreased in 2016-Q3 to 2%, then decreased in 2016-Q4 to 1%, and then remained the same in 2017-Q1 at 1%. In 2017-Q2, the vacancy rate increased slightly to 2%. Loop.net is reporting that in 2017-Q2, 11 buildings (373,164 square feet) were listed for lease or sale, and in 2016-Q2, 15 buildings (544,480 square feet) were listed for lease or sale, potentially leading to the decrease in the industrial vacancy rate.
Cerritos Industrial Vacancy Rates
(Note: Industrial vacant space in Cerritos includes a greater proportion of warehousing and distribution businesses, which require large facilities. Therefore, a single vacancy may contribute a large amount of square footage to the overall vacancy rate. Industrial vacancy rates are calculated using available data from Loop.net for properties that are available for lease. Further, there is a possibility of additional vacant industrial properties; however, these properties may not be available for lease or reported on Loop.net at the time of the preparation of this report.)
Page 30
Commercial Real Estate
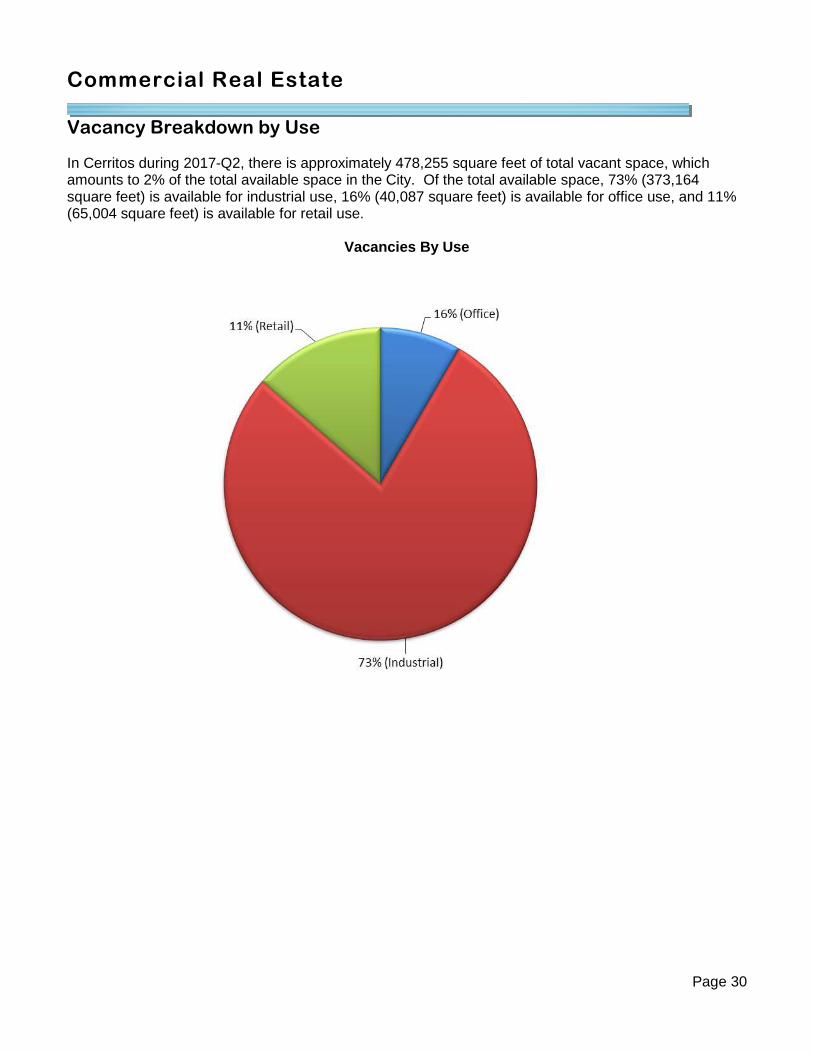
Vacancy Breakdown by Use In Cerritos during 2017-Q2, there is approximately 478,255 square feet of total vacant space, which amounts to 2% of the total available space in the City. Of the total available space, 73% (373,164 square feet) is available for industrial use, 16% (40,087 square feet) is available for office use, and 11% (65,004 square feet) is available for retail use.
Vacancies By Use

Housing

Page 32
Housing Single-Family Residential For 2017-Q2, the average median home sales price in Cerritos was $713,767. Housing prices in Cerritos increased significantly each month during 2017-Q2, when compared to 2016-Q2 sales prices. For example, housing prices increased in April 2017 by 4.2%, May increased by 3.8%, and June increased by 4.2% from a year ago. This three month increase in single-family home sales prices in Cerritos is a positive sign of the local economy.
Single-Family Residential Home Sales Price in Cerri tos - 2017-Q2
Second Quarter Average: $713,767
Single-Family Home Sale Prices – County Comparison for June 2017
Cerritos Los Angeles County Orange County $714,500 $588,000 $734,000
For June 2017, Cerritos had an average single-family sales price of $714,500, which was higher than Los Angeles County ($588,000); however, just slightly lower than Orange County ($734,000). This higher sales price in Cerritos indicates that housing is in great demand in the City.
Page 33
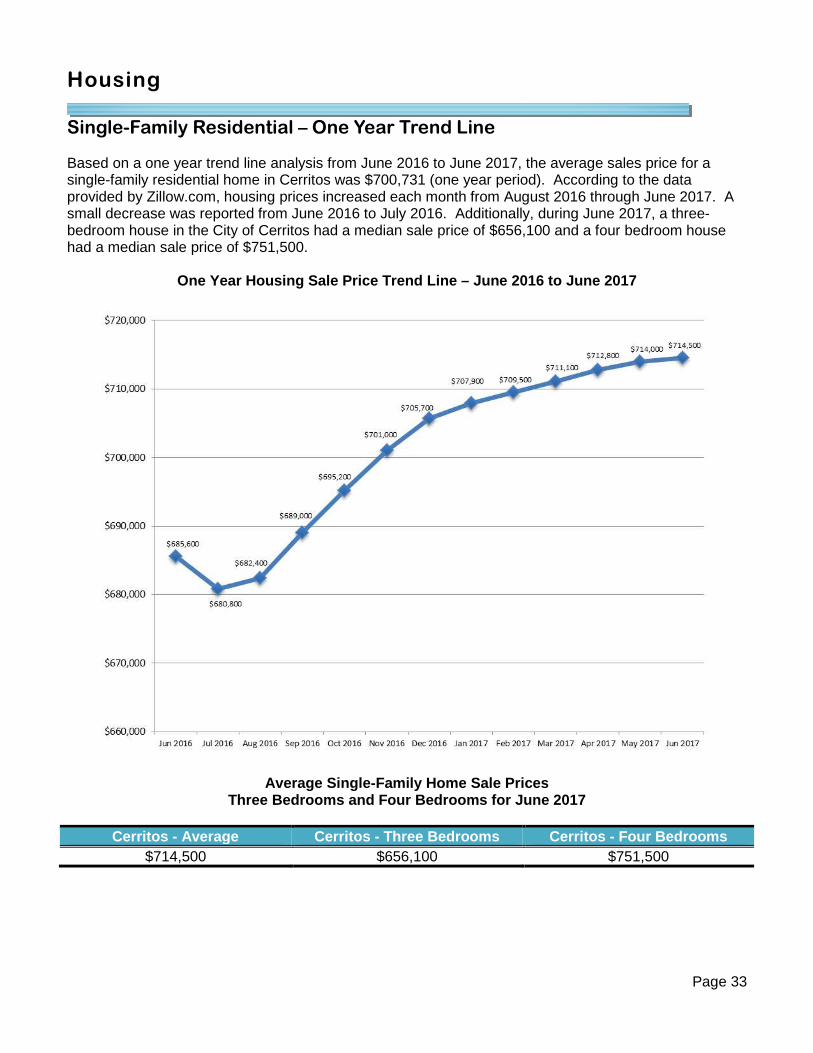
Housing Single-Family Residential – One Year Trend Line Based on a one year trend line analysis from June 2016 to June 2017, the average sales price for a single-family residential home in Cerritos was $700,731 (one year period). According to the data provided by Zillow.com, housing prices increased each month from August 2016 through June 2017. A small decrease was reported from June 2016 to July 2016. Additionally, during June 2017, a three-bedroom house in the City of Cerritos had a median sale price of $656,100 and a four bedroom house had a median sale price of $751,500.
One Year Housing Sale Price Trend Line – June 2016 to June 2017
Average Single-Family Home Sale Prices Three Bedrooms and Four Bedrooms for June 2017
Cerritos - Average Cerritos - Three Be drooms Cerritos - Four Bedrooms
$714,500 $656,100 $751,500

Page 34
Housing Single-Family Residential – Regional Comparison In a regional comparison, Cerritos' property values have maintained their value and are higher than all surrounding cities and regionally comparable cities. In a sample of June 2017 home sales prices throughout the region, Cerritos’ average home sales price was $714,500, which was higher than four other comparable cities, including Cypress ($660,000), Glendora ($589,000), Lakewood ($549,000), and Downey ($560,000).
Regional Comparison – June 2017

Page 35
Housing
Multi-Family Residential - Condominiums Condominiums have a niche in housing between renting and owning single-family homes. For 2017-Q2, the average median condominium home sales price in Cerritos was $524,800. Condominium sale prices in Cerritos increased in April 2017 by 8.2%, in May 2017 by 6.9%, and in June 2017 by 6.5% from the previous year. In a regional comparison for June 2017, Cerritos median condominium home sales price ($524,600) was higher than Los Angeles County ($496,000) and Orange County ($479,000).
Condominium Home Sales Price in Cerritos - 2017-Q2
Second Quarter Average: $524,800
Condominium Home Sale Prices – County Comparison fo r June 2017
Cerritos Los Angeles County Orange County $524,600 $496,000 $479,000

Page 36
Data Sources
Major Revenues
City of Cerritos, Finance Division City of Cerritos, GIS Division
Auto Sales
Cerritos Auto Dealers Association
Employment/Unemployment
California Employment Development Department
United States Bureau of Labor and Statistics
Real Estate
Loop.net
Housing
Zillow.com