2017 budget book-schedules-appropriation · indianapolis airport authority 2017 appropriation...
TRANSCRIPT
IINNDDIIAANNAAPPOOLLIISS AAIIRRPPOORRTT AAUUTTHHOORRIITTYY
22001177 AAPPPPRROOPPRRIIAATTIIOONN BBUUDDGGEETT
OORRDDIINNAANNCCEE NNOO.. 22--22001166
BBOOAARRDD AAPPPPRROOVVEEDD AAUUGGUUSSTT 1199,, 22001166
2017 Appropriation Budget Table of Contents
Board Approved August 19, 2016
1 Appropriation Summary
2 Airport System Fund Expenses 3 Capital Improvement Fund 4 Anticipated Rates
Supplemental Schedules:
5-6 Capital Improvement Program Summary
7 Airport System Fund Revenues
8 Capital Improvement Fund – Sources of Funds Projections 9 Analysis of Airport System Fund Revenue 10 Analysis of Airport System Fund Expenses
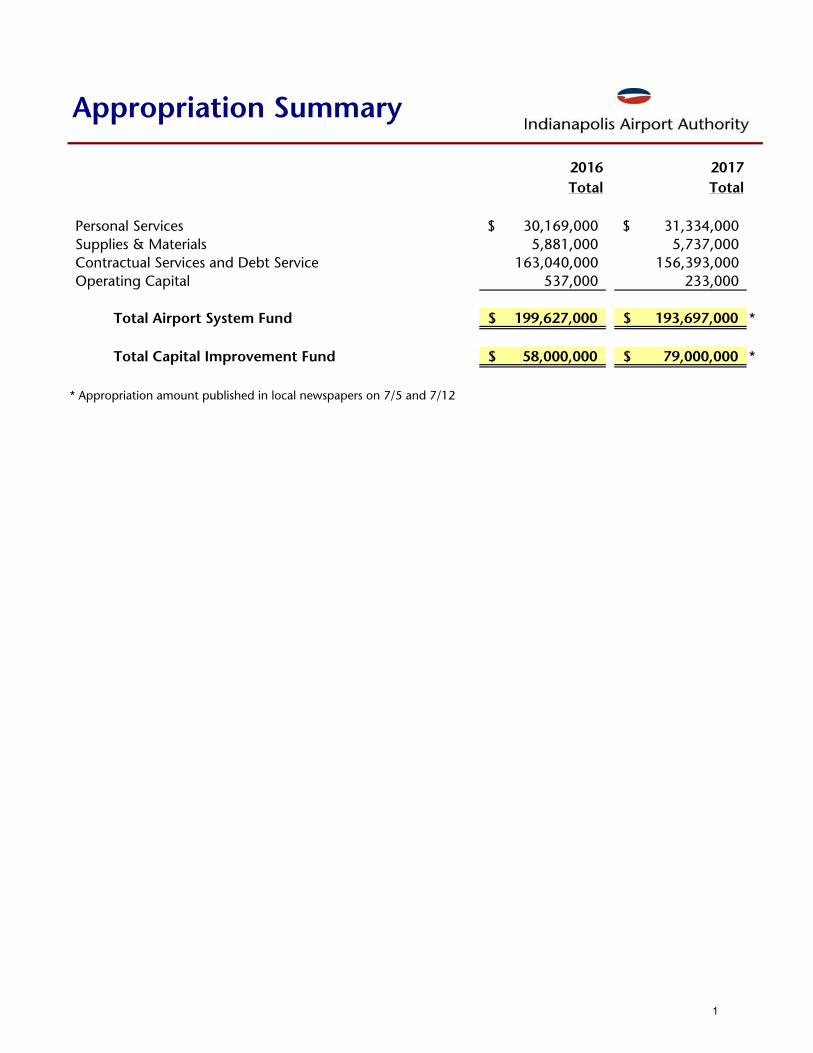
2016 2017Total Total
Personal Services 30,169,000$ 31,334,000$ Supplies & Materials 5,881,000 5,737,000 Contractual Services and Debt Service 163,040,000 156,393,000 Operating Capital 537,000 233,000
Total Airport System Fund 199,627,000$ 193,697,000$ *
Total Capital Improvement Fund 58,000,000$ 79,000,000$ *
Appropriation Summary
* Appropriation amount published in local newspapers on 7/5 and 7/12
1
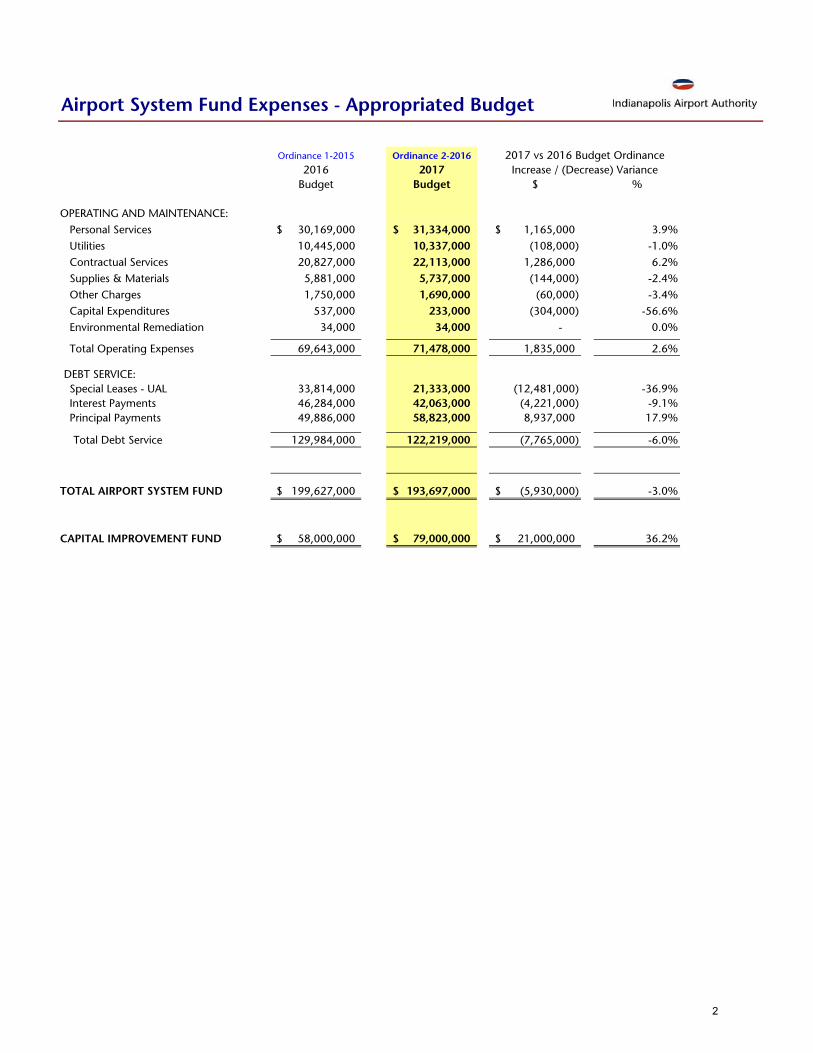
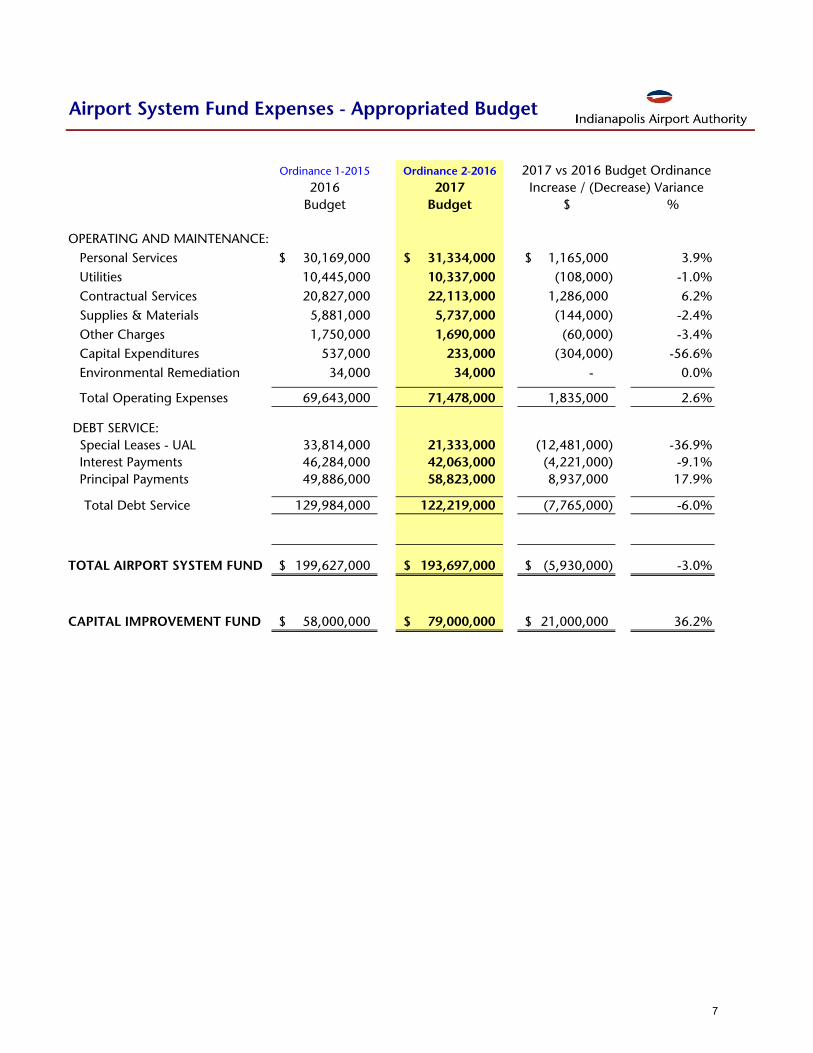
Airport System Fund Expenses - Appropriated Budget
Ordinance 1-2015 Ordinance 2-2016
2016 2017Budget Budget $ %
OPERATING AND MAINTENANCE: Personal Services 30,169,000$ 31,334,000$ 1,165,000$ 3.9% Utilities 10,445,000 10,337,000 (108,000) -1.0% Contractual Services 20,827,000 22,113,000 1,286,000 6.2% Supplies & Materials 5,881,000 5,737,000 (144,000) -2.4% Other Charges 1,750,000 1,690,000 (60,000) -3.4% Capital Expenditures 537,000 233,000 (304,000) -56.6% Environmental Remediation 34,000 34,000 - 0.0% Total Operating Expenses 69,643,000 71,478,000 1,835,000 2.6%
DEBT SERVICE: Special Leases - UAL 33,814,000 21,333,000 (12,481,000) -36.9% Interest Payments 46,284,000 42,063,000 (4,221,000) -9.1% Principal Payments 49,886,000 58,823,000 8,937,000 17.9%
Total Debt Service 129,984,000 122,219,000 (7,765,000) -6.0%
TOTAL AIRPORT SYSTEM FUND 199,627,000$ 193,697,000$ (5,930,000)$ -3.0%
CAPITAL IMPROVEMENT FUND 58,000,000$ 79,000,000$ 21,000,000$ 36.2%
2017 vs 2016 Budget OrdinanceIncrease / (Decrease) Variance
2
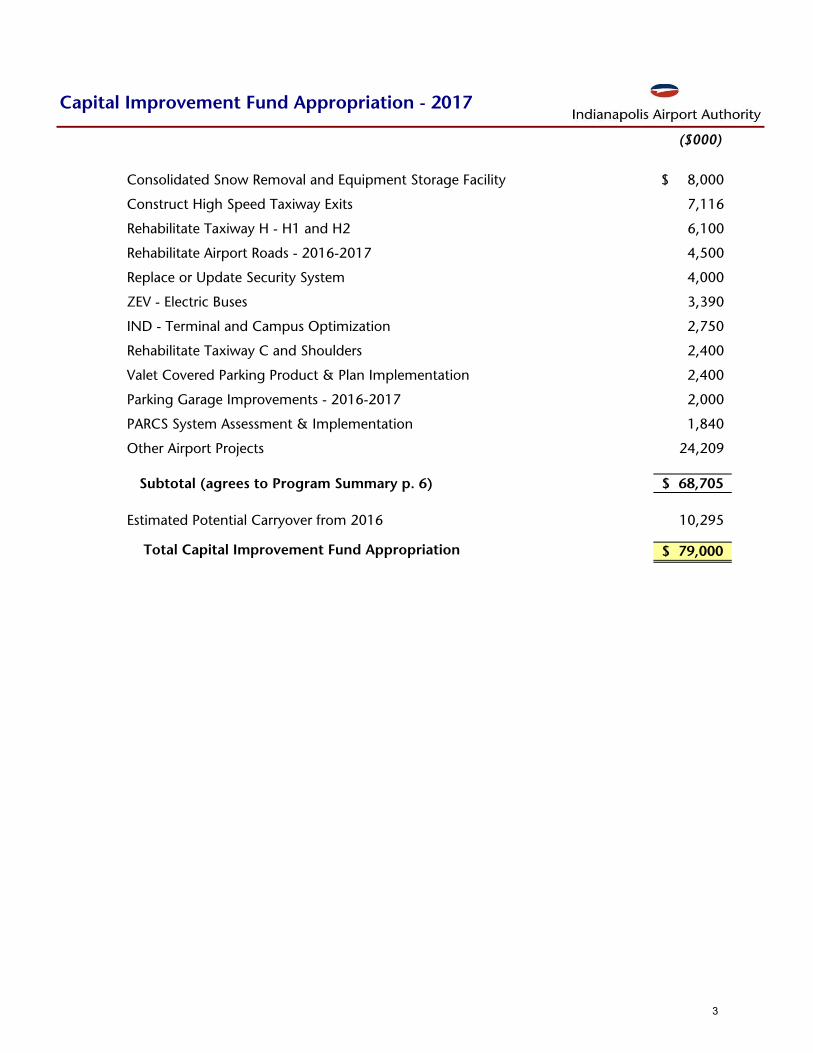
Capital Improvement Fund Appropriation - 2017
($000)
Consolidated Snow Removal and Equipment Storage Facility 8,000$
Construct High Speed Taxiway Exits 7,116
Rehabilitate Taxiway H - H1 and H2 6,100
Rehabilitate Airport Roads - 2016-2017 4,500
Replace or Update Security System 4,000
ZEV - Electric Buses 3,390
IND - Terminal and Campus Optimization 2,750
Rehabilitate Taxiway C and Shoulders 2,400
Valet Covered Parking Product & Plan Implementation 2,400
Parking Garage Improvements - 2016-2017 2,000
PARCS System Assessment & Implementation 1,840
Other Airport Projects 24,209
Subtotal (agrees to Program Summary p. 6) 68,705$
Estimated Potential Carryover from 2016 10,295
Total Capital Improvement Fund Appropriation 79,000$
3
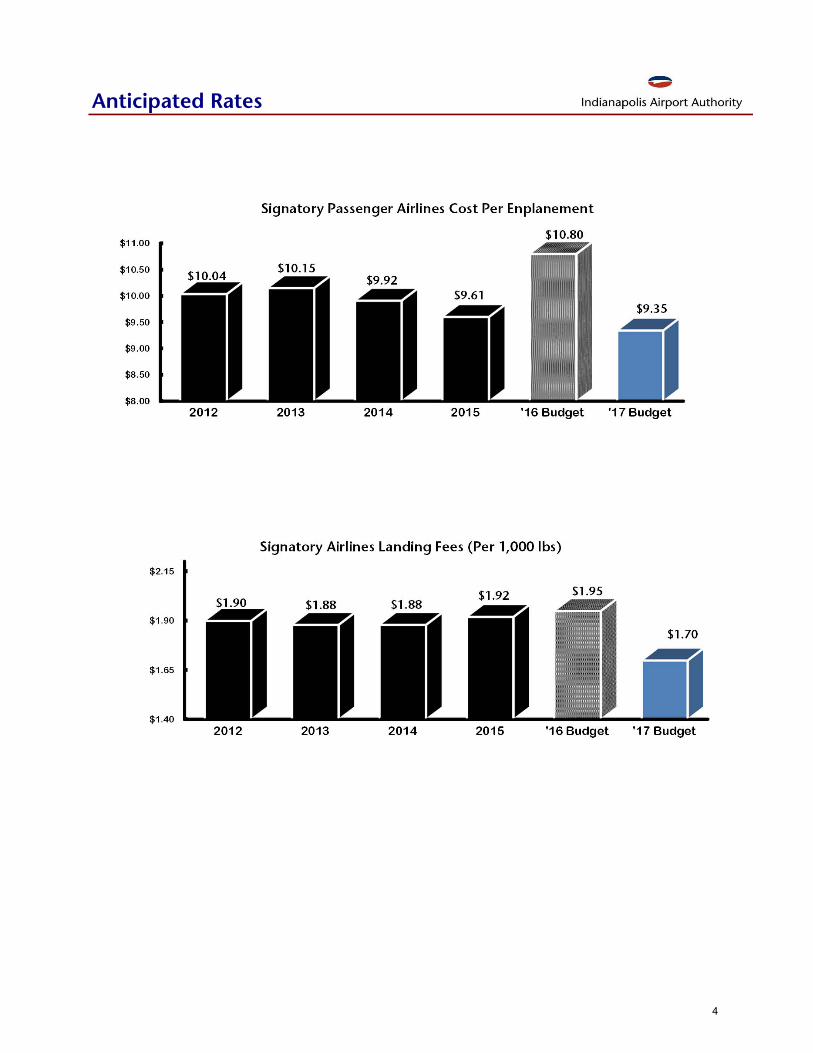
Anticipated Rates
$8.00
$8.50
$9.00
$9.50
$10.00
$10.50
$11.00
2012 2013 2014 2015 '16 Budget '17 Budget
$10.04 $10.15
$9.92 $9.61
$10.80
$9.35
Signatory Passenger Airlines Cost Per Enplanement
$1.40
$1.65
$1.90
$2.15
2012 2013 2014 2015 '16 Budget '17 Budget
$1.90 $1.88 $1.88 $1.92 $1.95
$1.70
Signatory Airlines Landing Fees (Per 1,000 lbs)
4
SSUUPPPPLLEEMMEENNTTAALL SSCCHHEEDDUULLEESS
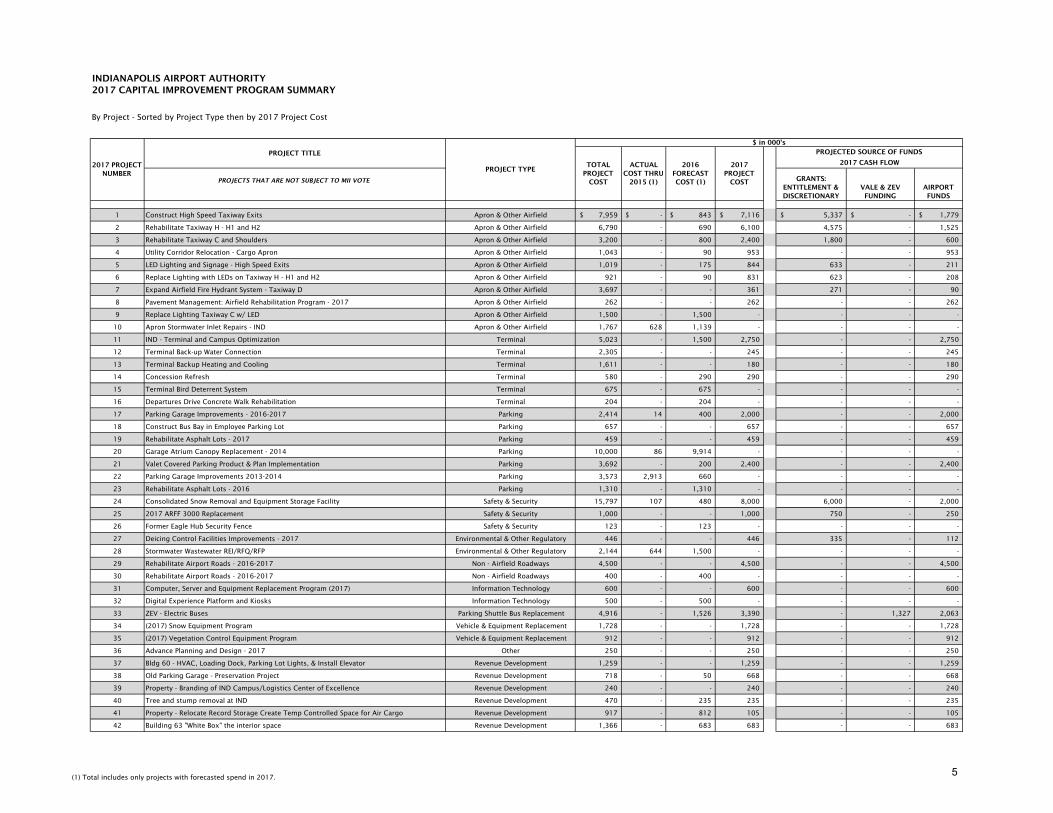
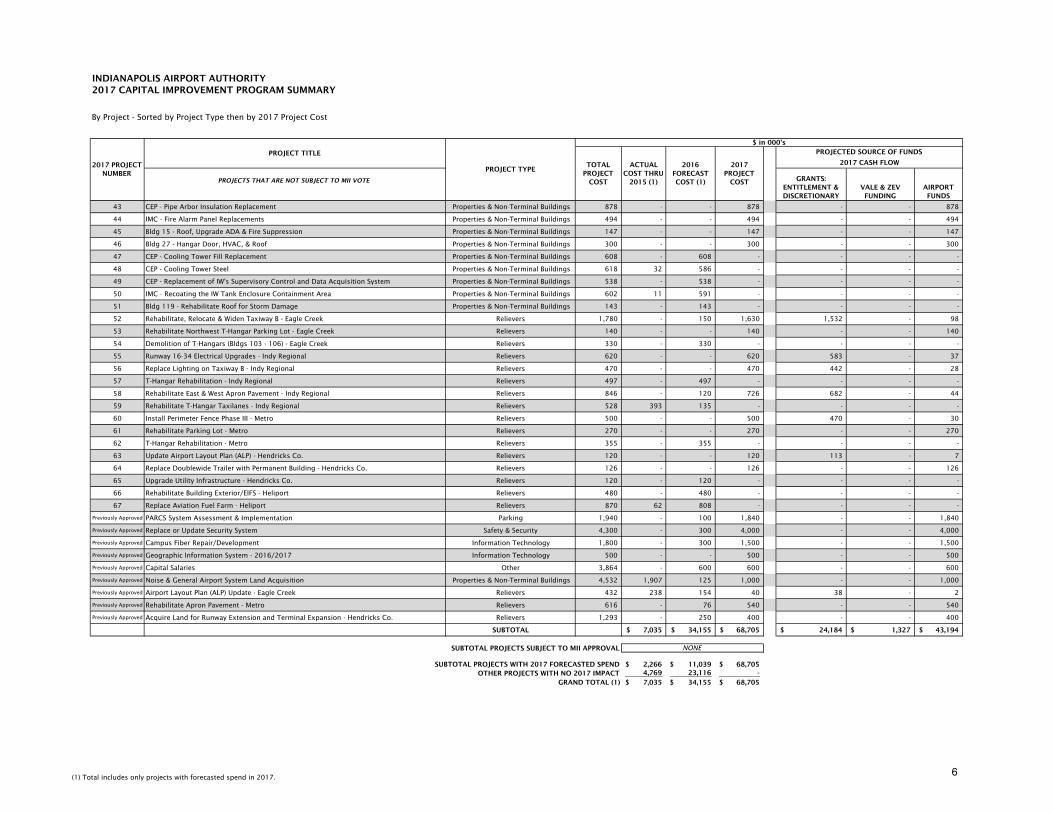
INDIANAPOLIS AIRPORT AUTHORITY2017 CAPITAL IMPROVEMENT PROGRAM SUMMARY
By Project - Sorted by Project Type then by 2017 Project Cost
PROJECTS THAT ARE NOT SUBJECT TO MII VOTE GRANTS: ENTITLEMENT & DISCRETIONARY
VALE & ZEV FUNDING
AIRPORT FUNDS
1 Construct High Speed Taxiway Exits Apron & Other Airfield 7,959$ -$ 843$ 7,116$ 5,337$ -$ 1,779$
2 Rehabilitate Taxiway H - H1 and H2 Apron & Other Airfield 6,790 - 690 6,100 4,575 - 1,525
3 Rehabilitate Taxiway C and Shoulders Apron & Other Airfield 3,200 - 800 2,400 1,800 - 600
4 Utility Corridor Relocation - Cargo Apron Apron & Other Airfield 1,043 - 90 953 - - 953
5 LED Lighting and Signage - High Speed Exits Apron & Other Airfield 1,019 - 175 844 633 - 211
6 Replace Lighting with LEDs on Taxiway H - H1 and H2 Apron & Other Airfield 921 - 90 831 623 - 208
7 Expand Airfield Fire Hydrant System - Taxiway D Apron & Other Airfield 3,697 - - 361 271 - 90
8 Pavement Management: Airfield Rehabilitation Program - 2017 Apron & Other Airfield 262 - - 262 - - 262
9 Replace Lighting Taxiway C w/ LED Apron & Other Airfield 1,500 - 1,500 - - - -
10 Apron Stormwater Inlet Repairs - IND Apron & Other Airfield 1,767 628 1,139 - - - -
11 IND - Terminal and Campus Optimization Terminal 5,023 - 1,500 2,750 - - 2,750
12 Terminal Back-up Water Connection Terminal 2,305 - - 245 - - 245
13 Terminal Backup Heating and Cooling Terminal 1,611 - - 180 - - 180
14 Concession Refresh Terminal 580 - 290 290 - - 290
15 Terminal Bird Deterrent System Terminal 675 - 675 - - - -
16 Departures Drive Concrete Walk Rehabilitation Terminal 204 - 204 - - - -
17 Parking Garage Improvements - 2016-2017 Parking 2,414 14 400 2,000 - - 2,000
18 Construct Bus Bay in Employee Parking Lot Parking 657 - - 657 - - 657
19 Rehabilitate Asphalt Lots - 2017 Parking 459 - - 459 - - 459
20 Garage Atrium Canopy Replacement - 2014 Parking 10,000 86 9,914 - - - -
21 Valet Covered Parking Product & Plan Implementation Parking 3,692 - 200 2,400 - - 2,400
22 Parking Garage Improvements 2013-2014 Parking 3,573 2,913 660 - - - -
23 Rehabilitate Asphalt Lots - 2016 Parking 1,310 - 1,310 - - - -
24 Consolidated Snow Removal and Equipment Storage Facility Safety & Security 15,797 107 480 8,000 6,000 - 2,000
25 2017 ARFF 3000 Replacement Safety & Security 1,000 - - 1,000 750 - 250
26 Former Eagle Hub Security Fence Safety & Security 123 - 123 - - - -
27 Deicing Control Facilities Improvements - 2017 Environmental & Other Regulatory 446 - - 446 335 - 112
28 Stormwater Wastewater REI/RFQ/RFP Environmental & Other Regulatory 2,144 644 1,500 - - - -
29 Rehabilitate Airport Roads - 2016-2017 Non - Airfield Roadways 4,500 - - 4,500 - - 4,500
30 Rehabilitate Airport Roads - 2016-2017 Non - Airfield Roadways 400 - 400 - - - -
31 Computer, Server and Equipment Replacement Program (2017) Information Technology 600 - - 600 - - 600
32 Digital Experience Platform and Kiosks Information Technology 500 - 500 - - - -
33 ZEV - Electric Buses Parking Shuttle Bus Replacement 4,916 - 1,526 3,390 - 1,327 2,063
34 (2017) Snow Equipment Program Vehicle & Equipment Replacement 1,728 - - 1,728 - - 1,728
35 (2017) Vegetation Control Equipment Program Vehicle & Equipment Replacement 912 - - 912 - - 912
36 Advance Planning and Design - 2017 Other 250 - - 250 - - 250
37 Bldg 60 - HVAC, Loading Dock, Parking Lot Lights, & Install Elevator Revenue Development 1,259 - - 1,259 - - 1,259
38 Old Parking Garage - Preservation Project Revenue Development 718 - 50 668 - - 668
39 Property - Branding of IND Campus/Logistics Center of Excellence Revenue Development 240 - - 240 - - 240
40 Tree and stump removal at IND Revenue Development 470 - 235 235 - - 235
41 Property - Relocate Record Storage Create Temp Controlled Space for Air Cargo Revenue Development 917 - 812 105 - - 105
42 Building 63 "White Box" the interior space Revenue Development 1,366 - 683 683 - - 683
2017 PROJECT NUMBER
PROJECT TYPE
$ in 000's
TOTAL PROJECT
COST
ACTUAL COST THRU
2015 (1)
2016 FORECAST COST (1)
2017 PROJECT
COST
PROJECTED SOURCE OF FUNDSPROJECT TITLE2017 CASH FLOW
(1) Total includes only projects with forecasted spend in 2017.5
INDIANAPOLIS AIRPORT AUTHORITY2017 CAPITAL IMPROVEMENT PROGRAM SUMMARY
By Project - Sorted by Project Type then by 2017 Project Cost
PROJECTS THAT ARE NOT SUBJECT TO MII VOTE GRANTS: ENTITLEMENT & DISCRETIONARY
VALE & ZEV FUNDING
AIRPORT FUNDS
2017 PROJECT NUMBER
PROJECT TYPE
$ in 000's
TOTAL PROJECT
COST
ACTUAL COST THRU
2015 (1)
2016 FORECAST COST (1)
2017 PROJECT
COST
PROJECTED SOURCE OF FUNDSPROJECT TITLE2017 CASH FLOW
43 CEP - Pipe Arbor Insulation Replacement Properties & Non-Terminal Buildings 878 - - 878 - - 878
44 IMC - Fire Alarm Panel Replacements Properties & Non-Terminal Buildings 494 - - 494 - - 494
45 Bldg 15 - Roof, Upgrade ADA & Fire Suppression Properties & Non-Terminal Buildings 147 - - 147 - - 147
46 Bldg 27 - Hangar Door, HVAC, & Roof Properties & Non-Terminal Buildings 300 - - 300 - - 300
47 CEP - Cooling Tower Fill Replacement Properties & Non-Terminal Buildings 608 - 608 - - - -
48 CEP - Cooling Tower Steel Properties & Non-Terminal Buildings 618 32 586 - - - -
49 CEP - Replacement of IW's Supervisory Control and Data Acquisition System Properties & Non-Terminal Buildings 538 - 538 - - - -
50 IMC - Recoating the IW Tank Enclosure Containment Area Properties & Non-Terminal Buildings 602 11 591 - - - -
51 Bldg 119 - Rehabilitate Roof for Storm Damage Properties & Non-Terminal Buildings 143 - 143 - - - -
52 Rehabilitate, Relocate & Widen Taxiway B - Eagle Creek Relievers 1,780 - 150 1,630 1,532 - 98
53 Rehabilitate Northwest T-Hangar Parking Lot - Eagle Creek Relievers 140 - - 140 - - 140
54 Demolition of T-Hangars (Bldgs 103 - 106) - Eagle Creek Relievers 330 - 330 - - - -
55 Runway 16-34 Electrical Upgrades - Indy Regional Relievers 620 - - 620 583 - 37
56 Replace Lighting on Taxiway B - Indy Regional Relievers 470 - - 470 442 - 28
57 T-Hangar Rehabilitation - Indy Regional Relievers 497 - 497 - - - -
58 Rehabilitate East & West Apron Pavement - Indy Regional Relievers 846 - 120 726 682 - 44
59 Rehabilitate T-Hangar Taxilanes - Indy Regional Relievers 528 393 135 - - - -
60 Install Perimeter Fence Phase III - Metro Relievers 500 - - 500 470 - 30
61 Rehabilitate Parking Lot - Metro Relievers 270 - - 270 - - 270
62 T-Hangar Rehabilitation - Metro Relievers 355 - 355 - - - -
63 Update Airport Layout Plan (ALP) - Hendricks Co. Relievers 120 - - 120 113 - 7
64 Replace Doublewide Trailer with Permanent Building - Hendricks Co. Relievers 126 - - 126 - - 126
65 Upgrade Utility Infrastructure - Hendricks Co. Relievers 120 - 120 - - - -
66 Rehabilitate Building Exterior/EIFS - Heliport Relievers 480 - 480 - - - -
67 Replace Aviation Fuel Farm - Heliport Relievers 870 62 808 - - - -
Previously Approved PARCS System Assessment & Implementation Parking 1,940 - 100 1,840 - - 1,840
Previously Approved Replace or Update Security System Safety & Security 4,300 - 300 4,000 - - 4,000
Previously Approved Campus Fiber Repair/Development Information Technology 1,800 - 300 1,500 - - 1,500
Previously Approved Geographic Information System - 2016/2017 Information Technology 500 - - 500 - - 500
Previously Approved Capital Salaries Other 3,864 - 600 600 - - 600
Previously Approved Noise & General Airport System Land Acquisition Properties & Non-Terminal Buildings 4,532 1,907 125 1,000 - - 1,000
Previously Approved Airport Layout Plan (ALP) Update - Eagle Creek Relievers 432 238 154 40 38 - 2
Previously Approved Rehabilitate Apron Pavement - Metro Relievers 616 - 76 540 - - 540
Previously Approved Acquire Land for Runway Extension and Terminal Expansion - Hendricks Co. Relievers 1,293 - 250 400 - - 400
SUBTOTAL 7,035$ 34,155$ 68,705$ 24,184$ 1,327$ 43,194$
SUBTOTAL PROJECTS SUBJECT TO MII APPROVAL
SUBTOTAL PROJECTS WITH 2017 FORECASTED SPEND 2,266$ 11,039$ 68,705$ OTHER PROJECTS WITH NO 2017 IMPACT 4,769 23,116 -
GRAND TOTAL (1) 7,035$ 34,155$ 68,705$
NONE
(1) Total includes only projects with forecasted spend in 2017.6
Airport System Fund Expenses - Appropriated Budget
Ordinance 1-2015 Ordinance 2-2016
2016 2017Budget Budget $ %
OPERATING AND MAINTENANCE: Personal Services 30,169,000$ 31,334,000$ 1,165,000$ 3.9% Utilities 10,445,000 10,337,000 (108,000) -1.0% Contractual Services 20,827,000 22,113,000 1,286,000 6.2% Supplies & Materials 5,881,000 5,737,000 (144,000) -2.4% Other Charges 1,750,000 1,690,000 (60,000) -3.4% Capital Expenditures 537,000 233,000 (304,000) -56.6% Environmental Remediation 34,000 34,000 - 0.0% Total Operating Expenses 69,643,000 71,478,000 1,835,000 2.6%
DEBT SERVICE: Special Leases - UAL 33,814,000 21,333,000 (12,481,000) -36.9% Interest Payments 46,284,000 42,063,000 (4,221,000) -9.1% Principal Payments 49,886,000 58,823,000 8,937,000 17.9%
Total Debt Service 129,984,000 122,219,000 (7,765,000) -6.0%
TOTAL AIRPORT SYSTEM FUND 199,627,000$ 193,697,000$ (5,930,000)$ -3.0%
CAPITAL IMPROVEMENT FUND 58,000,000$ 79,000,000$ 21,000,000$ 36.2%
2017 vs 2016 Budget OrdinanceIncrease / (Decrease) Variance
7
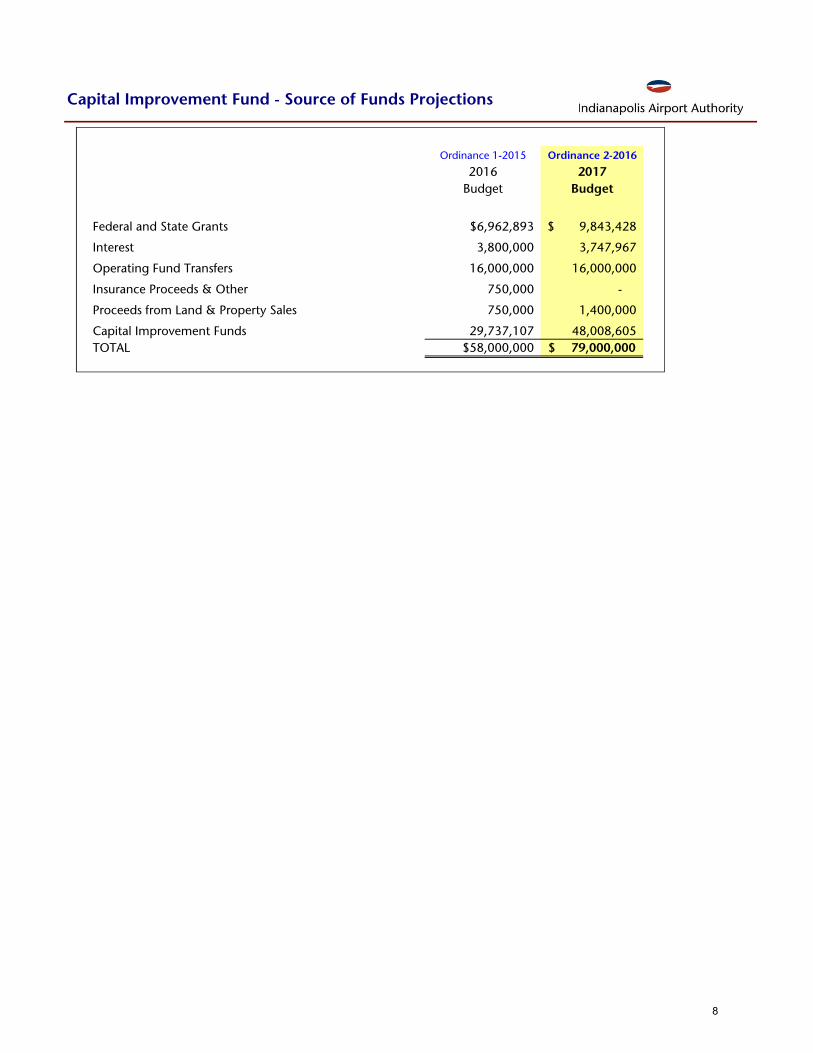
Capital Improvement Fund - Source of Funds Projections
Ordinance 1-2015 Ordinance 2-2016
2016 2017Budget Budget
Federal and State Grants $6,962,893 9,843,428$
Interest 3,800,000 3,747,967
Operating Fund Transfers 16,000,000 16,000,000
Insurance Proceeds & Other 750,000 -
Proceeds from Land & Property Sales 750,000 1,400,000
Capital Improvement Funds 29,737,107 48,008,605 TOTAL $58,000,000 79,000,000$
8
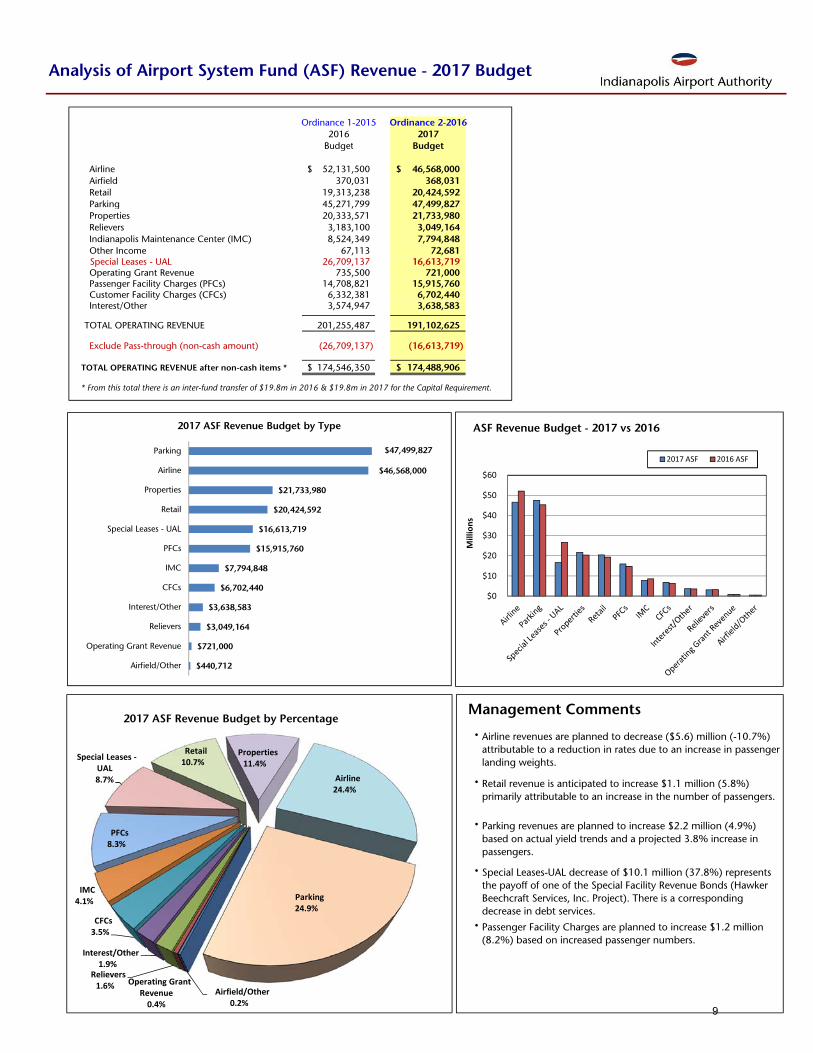
Analysis of Airport System Fund (ASF) Revenue - 2017 Budget
Ordinance 1-2015 Ordinance 2-20162016 2017
Budget Budget $ %
Airline 52,131,500$ 46,568,000$ (5,563,500)$ -10.7% Airfield 370,031 368,031 (2,000) -0.5% Retail 19,313,238 20,424,592 1,111,354 5.8% Parking 45,271,799 47,499,827 2,228,028 4.9% Properties 20,333,571 21,733,980 1,400,409 6.9% Relievers 3,183,100 3,049,164 (133,936) -4.2% Indianapolis Maintenance Center (IMC) 8,524,349 7,794,848 (729,501) -8.6% Other Income 67,113 72,681 5,568 8.3% Special Leases - UAL 26,709,137 16,613,719 (10,095,418) -37.8%
Operating Grant Revenue 735,500 721,000 (14,500) -2.0% Passenger Facility Charges (PFCs) 14,708,821 15,915,760 1,206,939 8.2% Customer Facility Charges (CFCs) 6,332,381 6,702,440 370,059 5.8% Interest/Other 3,574,947 3,638,583 63,636 1.8%
TOTAL OPERATING REVENUE 201,255,487 191,102,625 (10,152,862) -5.0%
Exclude Pass-through (non-cash amount) (26,709,137) (16,613,719)
TOTAL OPERATING REVENUE after non-cash items * 174,546,350$ 174,488,906$
* From this total there is an inter-fund transfer of $19.8m in 2016 & $19.8m in 2017 for the Capital Requirement.
Management Comments
•
•
•
•
• Passenger Facility Charges are planned to increase $1.2 million (8.2%) based on increased passenger numbers.
2016 vs 2015 Budget OrdinanceFav / (Unfav) Variance
Airline revenues are planned to decrease ($5.6) million (-10.7%) attributable to a reduction in rates due to an increase in passenger landing weights.
Parking revenues are planned to increase $2.2 million (4.9%) based on actual yield trends and a projected 3.8% increase in passengers.
Retail revenue is anticipated to increase $1.1 million (5.8%) primarily attributable to an increase in the number of passengers.
Special Leases-UAL decrease of $10.1 million (37.8%) represents the payoff of one of the Special Facility Revenue Bonds (Hawker Beechcraft Services, Inc. Project). There is a corresponding decrease in debt services.
$440,712
$721,000
$3,049,164
$3,638,583
$6,702,440
$7,794,848
$15,915,760
$16,613,719
$20,424,592
$21,733,980
$46,568,000
$47,499,827
Airfield/Other
Operating Grant Revenue
Relievers
Interest/Other
CFCs
IMC
PFCs
Special Leases - UAL
Retail
Properties
Airline
Parking
2017 ASF Revenue Budget by Type
$0
$10
$20
$30
$40
$50
$60Millions
ASF Revenue Budget - 2017 vs 2016
2017 ASF 2016 ASF
Airfield/Other0.2%
Operating Grant Revenue0.4%
Relievers1.6%
Interest/Other1.9%
CFCs3.5%
IMC4.1%
PFCs8.3%
Special Leases ‐UAL8.7%
Retail10.7%
Properties11.4%
Airline24.4%
Parking24.9%
2017 ASF Revenue Budget by Percentage
9
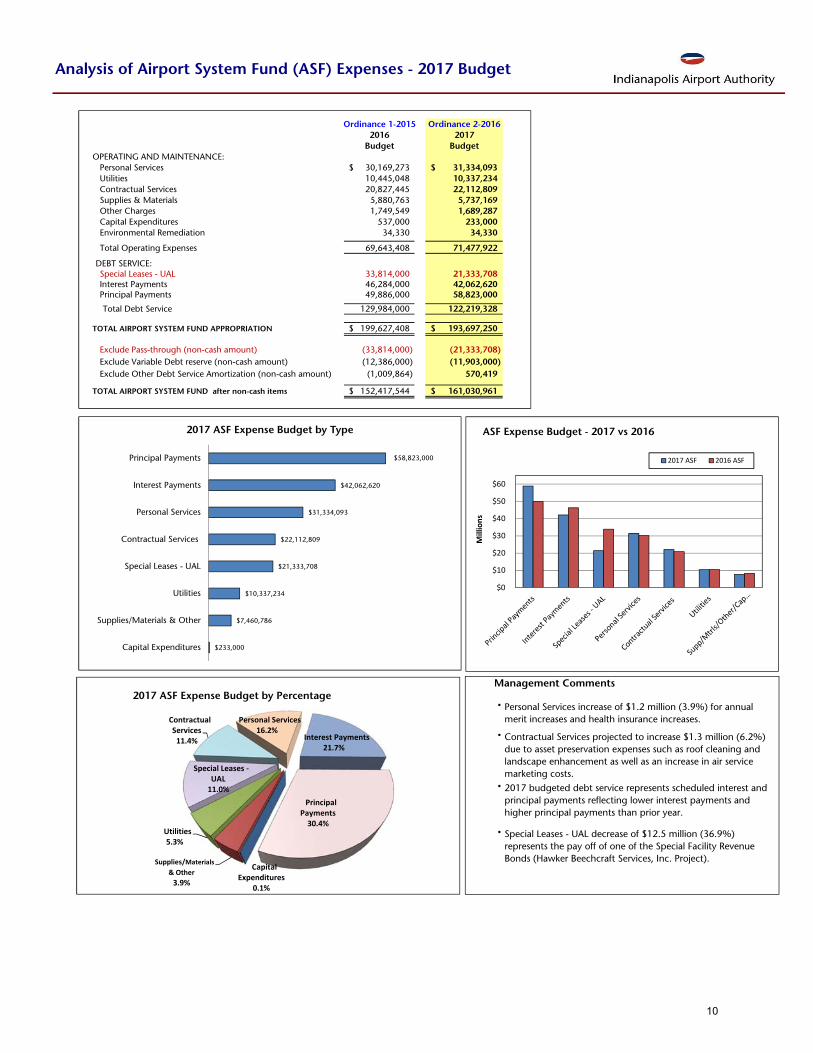
Analysis of Airport System Fund (ASF) Expenses - 2017 Budget
Ordinance 1-2015 Ordinance 2-20162016 2017
Budget Budget $ %OPERATING AND MAINTENANCE: Personal Services 30,169,273$ 31,334,093$ (1,164,820)$ -3.9% Utilities 10,445,048 10,337,234 107,814 1.0% Contractual Services 20,827,445 22,112,809 (1,285,364) -6.2% Supplies & Materials 5,880,763 5,737,169 143,594 2.4% Other Charges 1,749,549 1,689,287 60,262 3.4% Capital Expenditures 537,000 233,000 304,000 56.6% Environmental Remediation 34,330 34,330 - 0.0%
Total Operating Expenses 69,643,408 71,477,922 (1,834,514) -2.6%
DEBT SERVICE: Special Leases - UAL 33,814,000 21,333,708 12,480,292 36.9% Interest Payments 46,284,000 42,062,620 4,221,380 9.1% Principal Payments 49,886,000 58,823,000 (8,937,000) -17.9% Total Debt Service 129,984,000 122,219,328 7,764,672 6.0%
TOTAL AIRPORT SYSTEM FUND APPROPRIATION 199,627,408$ 193,697,250$ 5,930,158$ 3.0%
Exclude Pass-through (non-cash amount) (33,814,000) (21,333,708) Exclude Variable Debt reserve (non-cash amount) (12,386,000) (11,903,000) Exclude Other Debt Service Amortization (non-cash amount) (1,009,864) 570,419
TOTAL AIRPORT SYSTEM FUND after non-cash items 152,417,544$ 161,030,961$
Management Comments
•
•
•
•
2016 vs 2015 Budget OrdinanceFav / (Unfav) Variance
Personal Services increase of $1.2 million (3.9%) for annual merit increases and health insurance increases.
Contractual Services projected to increase $1.3 million (6.2%) due to asset preservation expenses such as roof cleaning and landscape enhancement as well as an increase in air service marketing costs.2017 budgeted debt service represents scheduled interest and principal payments reflecting lower interest payments and higher principal payments than prior year.
Special Leases - UAL decrease of $12.5 million (36.9%) represents the pay off of one of the Special Facility Revenue Bonds (Hawker Beechcraft Services, Inc. Project).
$233,000
$7,460,786
$10,337,234
$21,333,708
$22,112,809
$31,334,093
$42,062,620
$58,823,000
Capital Expenditures
Supplies/Materials & Other
Utilities
Special Leases - UAL
Contractual Services
Personal Services
Interest Payments
Principal Payments
2017 ASF Expense Budget by Type
$0
$10
$20
$30
$40
$50
$60Millions
ASF Expense Budget - 2017 vs 2016
2017 ASF 2016 ASF
Capital Expenditures
0.1%
Supplies/Materials
& Other
3.9%
Utilities5.3%
Special Leases ‐UAL11.0%
Contractual Services 11.4%
Personal Services16.2%
Interest Payments21.7%
Principal Payments30.4%
2017 ASF Expense Budget by Percentage
10