2017 results and strategic update
TRANSCRIPT

© LafargeHolcim Ltd 2015
2017 Results and Strategic UpdateJan Jenisch, CEOGéraldine Picaud, CFO
March 2, 2018
Confidential: Not to be distributed

Agenda
2
01 Highlights and Key Developments
02 Financial Results 2017
03 Strategy 2022 – “Building for Growth”
04 2018 Outlook and guidance

3
Highlights and Key DevelopmentsJan Jenisch, Chief Executive Officer
01

Highlights and Key Developments
4
› Good progress made in 2017 across all key metrics
› 4.7% sales growth and 6.1% increase in EBITDA (on like for like basis)
› Reassessment of fair value of asset portfolio with impairments of CHF 3.8 billion
› Merger is completed with a strong country and asset base
› New Strategy 2022 – “Building for Growth” under way, new organization in place
› Focus on opportunities in the attractive and growing building materials market
› Driving performance with simpler operating model and a reduction in SG&A cost
› Further progress in 2018 expected with sales growth of 3% to 5% and an over proportional increase in EBITDA of at least 5% on a like for like basis

5
Financial Results 2017Géraldine Picaud, Chief Financial Officer
02

2017 performance highlightsGood progress with growth in all key metrics
6
Net sales
+11.9%
1) Like for like2) Recurring EBITDA replaces the former Operating EBITDA Adjusted3) Including contribution from Huaxin share of net income on a full year basis of CHF 126 m, excluded from LFL growth4) EPS before impairment and divestments
+6.1% 1)+4.7% 1) CHF 1.7 bn
RecurringEBITDA 2) EPS 4) Free cash flow
CHF 26.1 bn CHF 6.0 bn 3) CHF 2.35 per share +1.5%

Net Sales bridge 2017Strong like for like growth of +4.7%
7
CHF m
1) Scope impact primarily reflects China, India, Vietnam, Morocco
26’904
25’220
–1’684 1’194 26’414 –285 26’129
Net Sales 12M2016
Scope -Disposals
Net Sales 12M2016 LFL
LFL Growth Net Sales 12M2017 LFL
FX Net Sales 12M2017
–6.5%–1.1%
–2.9%
+4.7% LFL
1)

Recurring EBITDA bridge 2017Over-proportional increase of +6.1% like for like, in line with guidance
8
CHF m
1) Recurring EBITDA 2016 has been restated due to reclassification of Group’s share of profit of JVs within recurring EBITDA (contribution of CHF 125m in 12M 2016) 2) Price over cost is defined as price contribution, cost increase and efficiency gains
5’9505’627
5’970 5’990–323 65
278 126 –106
RecurringEBITDA 12M
2016
Scope -Disposals &JV Impact
RecurringEBITDA 12M
2016 LFL
Volume Price overcost
RecurringEBITDA 12M
2017 LFL
Scope -Huaxin Shareof Net Income
FX RecurringEBITDA 12M
2017
+6.1%CHF 343 m LFL
+0.7%
1)2)

2017 Net sales and Recurring EBITDA per regionIncreased Recurring EBITDA in 4 out of 5 regions
9
3’374
1'085
2’9441'055
Net Sales (CHF m)Recurring EBITDA (CHF m)
% LFL growth
5'990
26’129
Group
5’664
1'483
7'167
1'3857'441
1'418
Latin America
Europe
Middle East Africa
Asia Pacific
–0.4%
+10.5%+3.7%
+2.0%
+6.7%
-6.9%
+5.4%
+3.5%
+11.0%+22.9%
+4.7%
+6.1%
North America
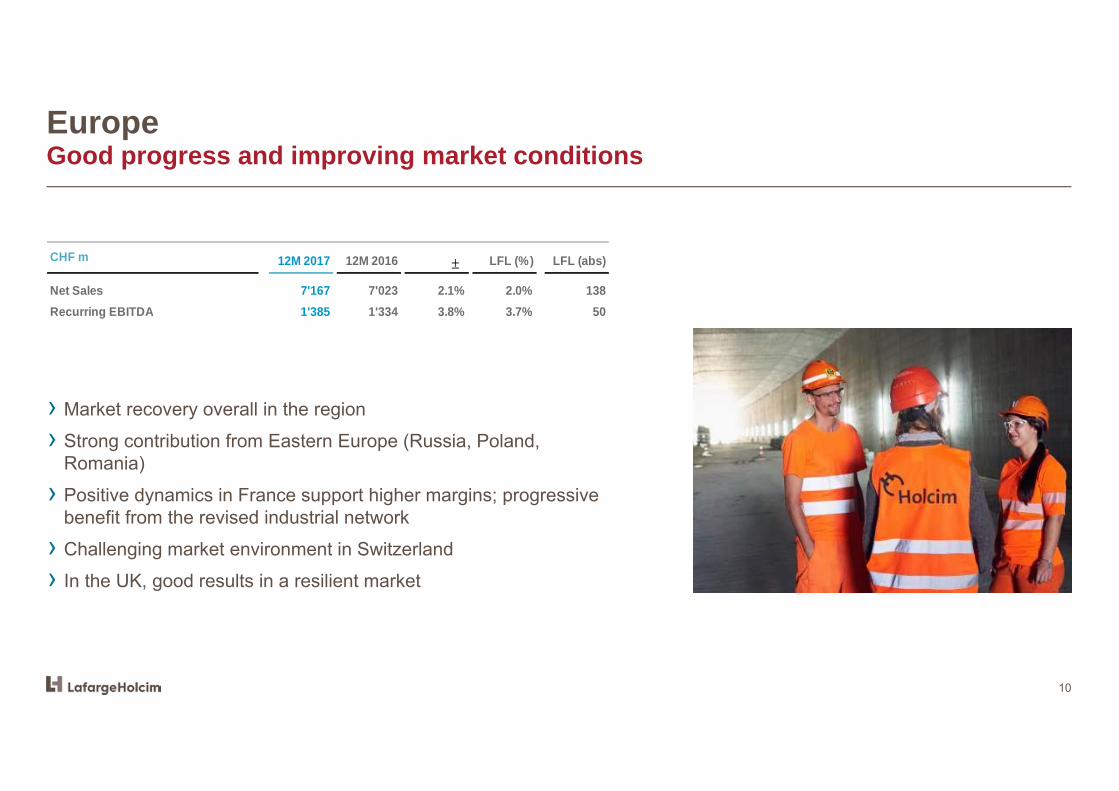
EuropeGood progress and improving market conditions
10
› Market recovery overall in the region
› Strong contribution from Eastern Europe (Russia, Poland, Romania)
› Positive dynamics in France support higher margins; progressive benefit from the revised industrial network
› Challenging market environment in Switzerland
› In the UK, good results in a resilient market
CHF m 12M 2017 12M 2016 LFL (%) LFL (abs)
Net Sales 7'167 7'023 2.1% 2.0% 138 Recurring EBITDA 1'385 1'334 3.8% 3.7% 50

Middle East AfricaGrowth in Net sales and Recurring EBITDA in 2017 on a like for like basis
11
1) Contribution from share of net income from JVs: CHF 70m in full year 2017 vs. CHF 51m in full year 2016
› Solid profits in Algeria in the year, despite weaker cement demand and increased competitive environment
› In Egypt, positive top line development despite challenging conditions
› In Nigeria, strong margin progression supported by pricing and cost initiatives in an improving economic environment
1)
CHF m 12M 2017 12M 2016 LFL (%) LFL (abs)
Net Sales 3'374 3'900 -13.5% 5.4% 195 Recurring EBITDA 1'085 1'247 -13.0% 3.5% 40

Asia PacificNet sales growth driven by India, margin pressure in South East Asia
12
1) Contribution from share of net income from JVs: CHF 202m in full year 2017 vs. CHF 64m in full year 2016
› In India, strong volume and Recurring EBITDA increase supported by commercial initiatives in a favorable environment in 2017
› In China, solid operational and commercial performance in both our consolidated operations and in Huaxin, supported by government initiatives on environmental protection
› In South East Asia, challenging year for volumes and margins
CHF m 12M 2017 12M 2016 LFL (%) LFL (abs)
Net Sales 7'441 8'226 -9.5% 6.7% 465 Recurring EBITDA 1'418 1'594 -11.1% -6.9% -96
Of which, contribution from Huaxin 126
1)

North AmericaStrong growth in Recurring EBITDA in a stable market environment
13
1)
› Continued strong contribution from the US despite decline in volumes
› Good contribution from Canada West supported by early signs of recovery in the oil sector
› Improved results in Canada East despite a challenging competitive environment
CHF m 12M 2017 12M 2016 LFL (%) LFL (abs)
Net Sales 5'664 5'584 1.4% -0.4% -20 Recurring EBITDA 1'483 1'335 11.1% 10.5% 140

Latin AmericaStrong performance in Net sales and margins
14
› Strong increase in Net Sales and Recurring EBITDA in Mexico, despite less favorable macroeconomic indicators
› Record performance in Argentina supported by solid commercial initiatives and operational execution
› In Brazil, turnaround initiatives supporting improvement in a challenging market environment
› Opening of the 1,000th Disensa retail store in the region
CHF m 12M 2017 12M 2016 LFL (%) LFL (abs)
Net Sales 2'944 2'773 6.1% 11.0% 294 Recurring EBITDA 1'055 885 19.3% 22.9% 201
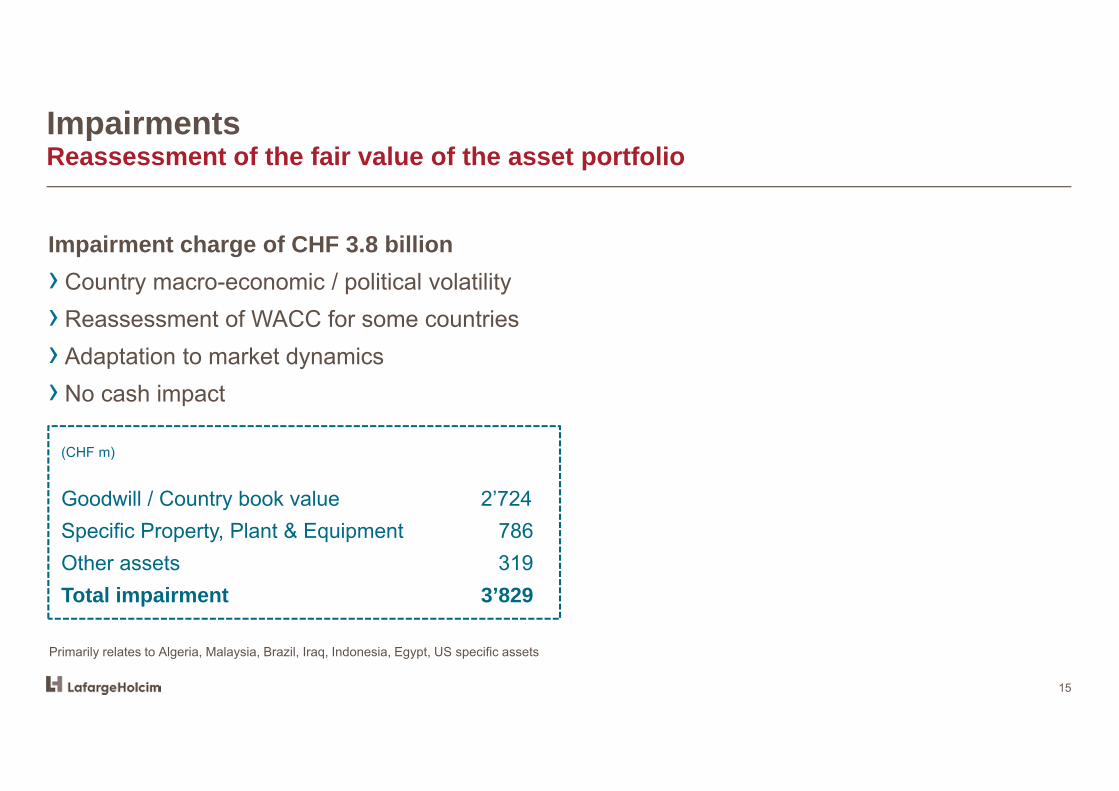
ImpairmentsReassessment of the fair value of the asset portfolio
15
(CHF m)
Goodwill / Country book value 2’724Specific Property, Plant & Equipment 786Other assets 319Total impairment 3’829
Primarily relates to Algeria, Malaysia, Brazil, Iraq, Indonesia, Egypt, US specific assets
Impairment charge of CHF 3.8 billion› Country macro-economic / political volatility › Reassessment of WACC for some countries› Adaptation to market dynamics› No cash impact

CHF m 2017Impairment & Divestments
2017 before impair. & divest.
2016 before impair. & divest. variation
Net Sales 26'129 26'129 26'904 -775 Recurring EBITDA 5'990 5'990 5'950 40
Depreciation & Amortization -2'300 -2'300 -2'343 43 Impairment -3'707 3'707 - - -
Restructuring and others 1) -461 -461 -582 121 Operating (loss) Profit -478 3'707 3'229 3'025 204
Profit/loss on disposals and other non-op. items 205 -260 -55 48 -103 Share of profit of associates 51 51 80 -29 Financial Income / expenses -958 -23 -981 -926 -55
Net Income Before Taxes -1'180 3'424 2'244 2'228 16 Income Taxes -536 -149 -685 -658 -27 ETR 30.5% 29.5%
Net Income -1'716 3'275 1'560 1'570 -10 Net income - Non controlling interests -41 184 143 297 -154 Net income - Group share -1'675 3'091 1'417 1'273 144
EPS (CHF) -2.78 2.35 2.10 0.25
Financial performance 2017EPS before impairment and divestments of CHF 2.35, up 11.9%
16
1) Others include litigation, implementation and other non-recurring costs

Free Cash FlowCHF 1’685 million of Free Cash flow generation
17
1’660 1684 1’685
40
-231 280
198 -263
FCF 12M 2016 Rec. EBITDA Change in Net WorkingCapital
Capex Net Financial expenses paid net Others FCF 12M 2017
CHF m
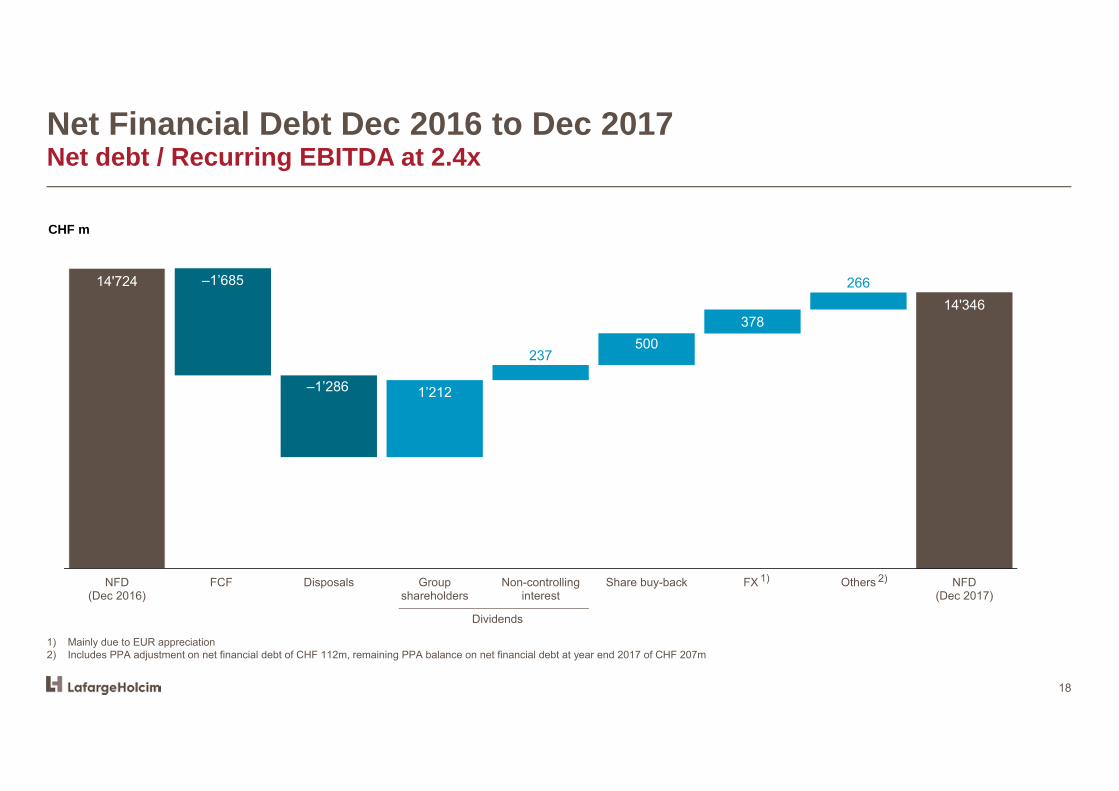
Net Financial Debt Dec 2016 to Dec 2017Net debt / Recurring EBITDA at 2.4x
18
CHF m
1) Mainly due to EUR appreciation2) Includes PPA adjustment on net financial debt of CHF 112m, remaining PPA balance on net financial debt at year end 2017 of CHF 207m
14'724
14'346
–1’685
–1’286 1’212
237500
378
266
NFD(Dec 2016)
FCF Disposals Groupshareholders
Non-controllinginterest
Share buy-back FX Others NFD(Dec 2017)
Dividends
1) 2)

Attractive dividend policyCHF 2 dividend per share proposed at next AGM
19
CHF m
1.5
2.0 2.0
2015 2016 2017
Dividend per share
1) Proposed at next AGM
1)
Comments:› 2017 full year dividend of CHF 2.0 per
share to be proposed at AGM on 8 May 2018
› Share buyback programme is discontinued with CHF ~581 million completed

20
Strategy 2022 – “Building For Growth”Jan Jenisch, Chief Executive Officer
03
Confidential: Not to be distributed

Building Materials market is highly attractiveFive megatrends driving growth of 2 - 3% per annum
21
Urbanization and megacities –Approx. 2.5 billion more people are expected to live in cities by 2050
Increased demand for sustainable construction solutions and increasing resource scarcity
Digitalization opens new avenues for growth & innovation
Global population growth and changing demographics –population expected to grow 22% by 2050 from 7.6 billion to 9.7 billion
Source: UN (World Population Prospects Population) 2017; UN (Urbanisation 2017); PWC
Increased demand for better living standards and more efficient infrastructure

LafargeHolcim’s business segments are set to grow sustainably Cement demand is forecasted to grow faster than GDP
22
Global cement demand (without China)
Growth dynamics for Aggregates and Ready-Mix Concrete are similar to cementSource: Internal LafargeHolcim Estimates; TAC Economics predicts a higher cement demand growth of 3-4%
2 - 3%Expected annual cement growth
until 2030
-
500
1'000
1'500
2'000
2'500
3'000
2000 2005 2010 2015 2020 2025 2030
Mt C
emen
t dem
and

Building Materials is a fragmented CHF 2’500 billion MarketMany opportunities for growth and acquisitions
Source: Internal LafargeHolcim estimates
Ready-Mix Concrete~CHF 200 billion►LH market share of ~3%
Aggregates~CHF 220 billion►LH market share of ~2%
Cement~CHF 200 billion ►LH market share of ~8%
Rest of WorldChina
Building Materials Market w/o ChinaCHF ~1’750 billion
Global Building Materials MarketCHF~2’500 billion
Other Building Materials~CHF 1’130 billion
23

LafargeHolcim is well positionedOur strengths provide an excellent platform for profitable growth
24
› Excellent global footprint and asset base
› Four attractive business segments to build on
› Committed, skilled employees › Strong global and local brands› Largest player with economies of
scale› Solutions & Products segment
with low capital intensity and attractive opportunities
› Proven resilient demand in a crisis
Ready Mix Concrete Volume 50.6 Mm3
Net Sales CHF 5’263m 18% of sales
3% Rec. EBITDA margin
AggregatesVolume 279 Mt
Net Sales CHF 3’916m14% of sales
19% Rec. EBITDA margin
Solutions & ProductsNet Sales CHF 2’104m
7% of sales13% Rec. EBITDA margin
2017 performance by business segment
CementNet Sales CHF 17’181m
Volume 229 Mt 60% of sales
28% Rec. EBITDA margin
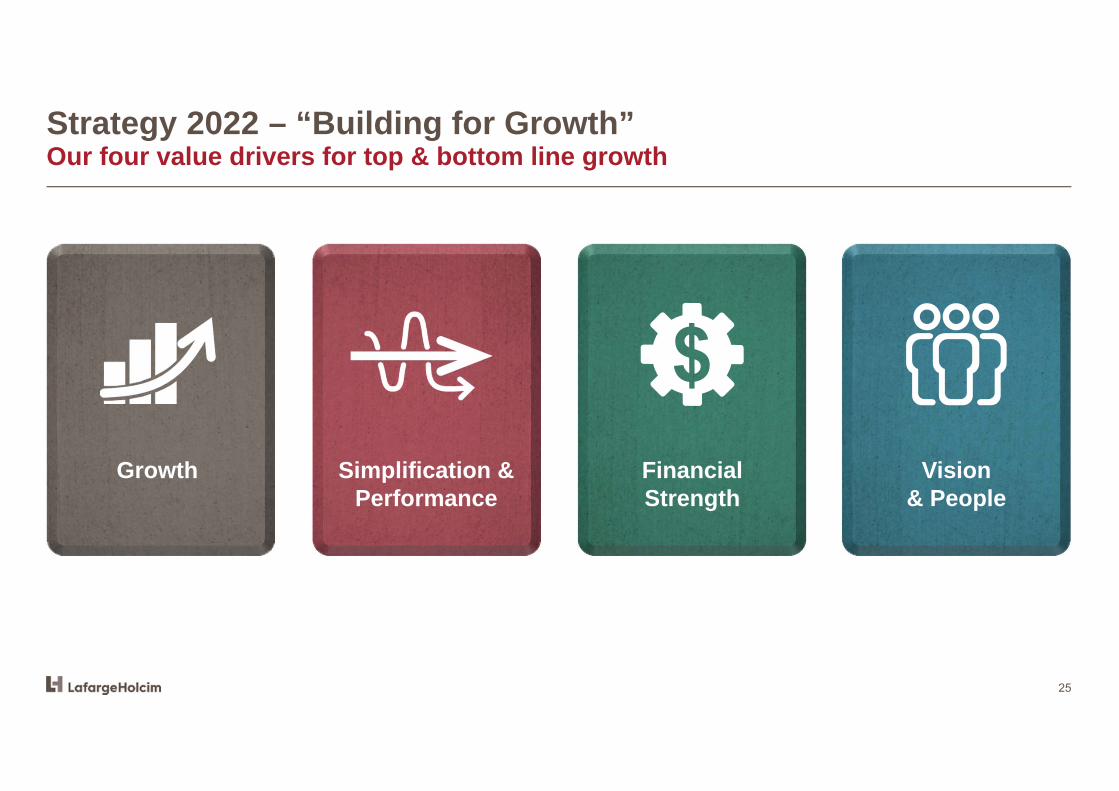
Strategy 2022 – “Building for Growth”Our four value drivers for top & bottom line growth
25
Growth Simplification &Performance
FinancialStrength
Vision & People

Strategy 2022 – “Building for Growth”Shifting gears to growth – top & bottom line
26
› Capture opportunities in the growing building material market
› Utilize best asset base to grow faster than the market
› More investments in “Growth Plus” markets
› Execute more aggressive market strategies for Aggregates and Ready-Mix Concrete
› Develop “Solutions & Products” into a fourth business segment
› Use bolt on acquisitions to leverage scale and margins

Develop “Solutions & Products” into a 4th business segmentMore focus and accountability on attractive market segments
27
› Current Solutions & Products segment includes precast, concrete products, asphalt, mortars, contracting & services
› Sales 2017 of CHF 2.1 billion, solid margins andlow capital intensity
› Many attractive market segments with high growth potential
› Synergies in logistics, sites and sales channel with other business segments
› Accelerate global expansion through agile local growth strategies and acquisitions

Simplification & PerformanceCost disciplined operating model and corporate light structure
28
Implement a simpler, country-focused operating model› Eliminate one layer of management - country focused organization with 35 markets (up from 20)
reporting directly to group management› Two corporate business functions have been merged, Group management reduced to 9
members› SG&A cost saving program of CHF 400 million completed as of Q1/2019› Corporate offices closing in Singapore and Miami
Create a performance culture › Simplified KPIs and incentives aligned to Group goals› Close the performance gap in Aggregates and Ready-Mix Concrete to best in class
Establish P&L responsibility and accountability for all four business segments
29
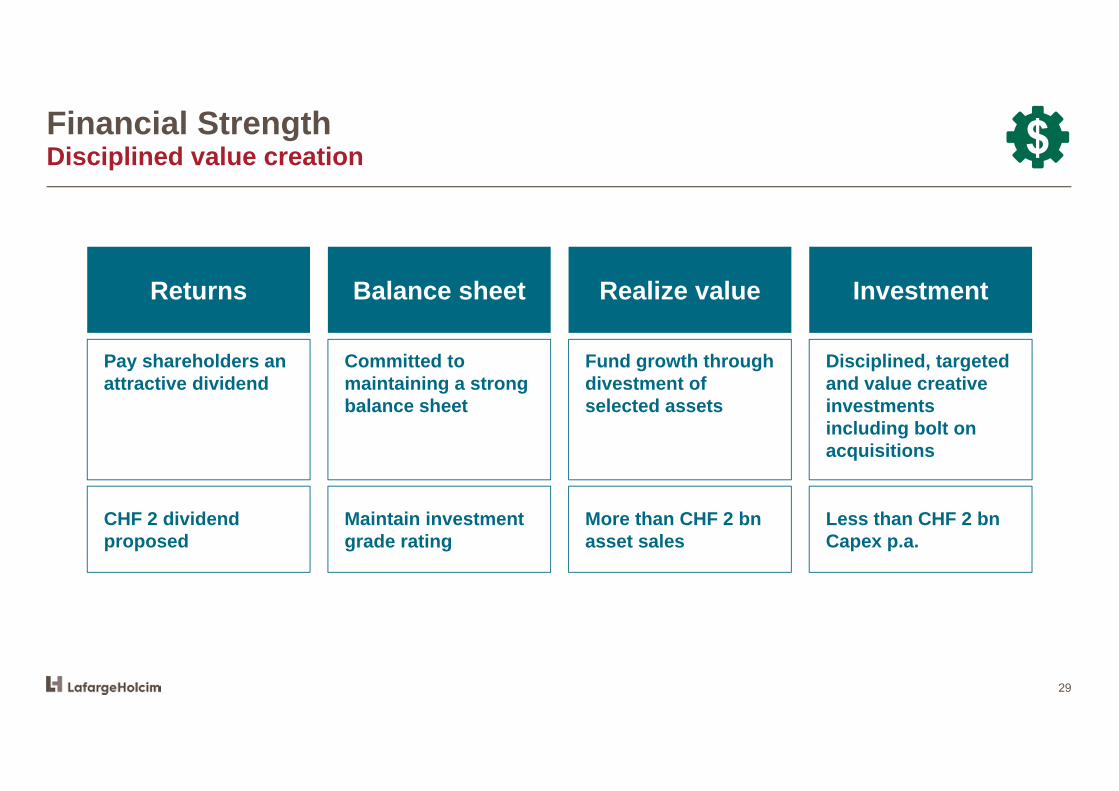
Financial Strength Disciplined value creation
Returns Balance sheet Realize value Investment
Pay shareholders an attractive dividend
Committed to maintaining a strong balance sheet
Fund growth through divestment of selected assets
Disciplined, targeted and value creative investments including bolt on acquisitions
CHF 2 dividend proposed
Maintain investment grade rating
More than CHF 2 bnasset sales
Less than CHF 2 bnCapex p.a.

30
Continued improvement in health & safety
Vision & PeopleBuilding a culture of trust, integrity and entrepreneurial leadership
Our vision is to be a global blue chip company in the attractive and growing building materials market.
Construction and improving living conditions are fundamental needs of a growing and urbanizing world population. We are passionate about finding solutions to the challenges of modern construction and we are working every day to be the trusted partner of our customers.
Our performance culture is underpinned by values of trust and integrity, a commitment to the Health & Safety of one another and a desire to be at the forefront of sustainable construction solutions and innovation.
We are proud of what we do and how we do it. We foster an entrepreneurial leadership style and are focused on the long term success of the company. Our growth strategy will deliver resilient returns and attractive value to our stakeholders.

31
Strategy 2022 – “Building for Growth”Strategy will deliver attractive returns
Net sales and Recurring EBITDA at constant exchange rates
> 40%
FCF to RecurringEBITDA
> 8%
Return on Invested Capital
Net salesgrowth
3 - 5%annually
at least 5%
RecurringEBITDA growth
annually

* Group Executive Committee
32
Strategy 2022 – “Building for Growth”New group management in place
CommunicationB. Eitel
ChinaI. Riley
Health & Safety
M. Anderson
TradingX. Blondot
LegalK. Carr
SustainabilityJ. Diebold
StrategyC. Haessig
DigitalP. Leutiger
Growth & Performance*
U. Bleisch
CEO*J. Jenisch
Asia*M. Kriegner
HR*C. Luscombe
CFO*G. Picaud
Europe*M. Cobuz
Latin America*
O. Osswald
MEA*S. Sebbar
North America*R. Thibault

Strategy 2022 – “Building for Growth”Execution of strategy under way, new organization in place
33
completed in December / January / February
New group management in place One layer of management eliminated with 35 markets (up from 20) reporting directly
to group management Empowerment of countries, full accountability and P&L responsibility for 4 business
segments on local level New incentive system for 2018 rolled down to the local business segment leader Countries to develop growth strategies for all segments including bolt on acquisitions Two corporate business functions have been merged into one, Group Management
reduced to 9 members Increased focus on Digital and Sustainability New plant in India, bolt-on acquisition in UK announced

Strategy 2022 – “Building for Growth”Disciplined execution and well defined milestones
34
2018 2019
› Complete review of asset portfolio and investment / divestment options
› Growth plans established in all key markets for Cement, Aggregates, Ready-Mix Concrete and Solutions & Products
› Execution of SG&A cost saving program
› Complete closure of Singapore and Miami offices
› New operating model fully established in Q1
› New run rates on costs and margins realized by Q2
› Divestments of at least CHF 2 billion signed

35
Outlook 2018 and guidanceJan Jenisch, Chief Executive Officer
04
2018 Outlook & Guidance
36
› Net Sales growth of 3 - 5% on a like for like basis
› Increase in Recurring EBITDA of at least 5% on a like for like basis
› Capex spend below CHF 2 billion
› Execute Strategy 2022 across all four business segments and countries

2018 Upcoming Events
37
› May 8, 2018: AGM and Q1 2018 earnings release
› July 27, 2018: Half year earnings release; new segmental reporting
› October 26, 2018: Q3 earnings release
› November 2018: Capital Markets Day

Disclaimer
38
These materials are being provided to you on a confidential basis, may not be distributed to the press or to any other persons, may not beredistributed or passed on, directly or indirectly, to any person, or published or reproduced, in whole or in part, by any medium or for any purpose.
This document does not constitute or form part of any offer or invitation to sell or issue, or any solicitation of any offer to purchase or subscribefor, any securities of LafargeHolcim or any subsidiary or affiliate of LafargeHolcim nor should it or any part of it form the basis of, or be relied on inconnection with, any purchase, sale or subscription for any securities of LafargeHolcim or any subsidiary or affiliate of LafargeHolcim or be reliedon in connection with any contract or commitment whatsoever.
The information contained herein has been obtained from sources believed by LafargeHolcim to be reliable. Whilst all reasonable care has beentaken to ensure that the facts stated herein are accurate and that the opinions and expectations contained herein are fair and reasonable, it hasnot been independently verified and no representation or warranty, expressed or implied, is made by LafargeHolcim or any subsidiary or affiliateof LafargeHolcim with respect to the fairness, completeness, correctness, reasonableness or accuracy of any information and opinions containedherein. In particular, certain of the financial information contained herein has been derived from sources such as accounts maintained bymanagement of LafargeHolcim in the ordinary course of business, which have not been independently verified or audited and may differ from theresults of operations presented in the historical audited financial statements of LafargeHolcim and its subsidiaries. Neither LafargeHolcim nor anyof its respective affiliates, advisers or representatives shall have any liability whatsoever (in negligence or otherwise) for any loss or damagehowsoever arising from any use of this presentation or its contents, or any action taken by you or any of your officers, employees, agents orassociates on the basis of the this presentation or its contents or otherwise arising in connection therewith.
The information contained in this presentation has not been subject to any independent audit or review and may contain forward-lookingstatements, estimates and projections. Statements herein, other than statements of historical fact, regarding future events or prospects, areforward-looking statements, including forward-looking statements regarding the group’s business and earnings performance, which are based onmanagement’s current plans, estimates, forecasts and expectations. These statements are subject to a number of assumptions and entail knownand unknown risks and uncertainties, as there are a variety of factors that may cause actual results and developments to differ materially fromany future results and developments expressed or implied by such forward-looking statements. Forward-looking statements contained in thispresentation regarding past trends or activities should not be taken as a representation that such trends or activities will continue in the future.Although LafargeHolcim believes that the estimates and projections reflected in the forward-looking statements are reasonable, they may provematerially incorrect, and actual results may materially differ. As a result, you should not rely on these forward-looking statements. LafargeHolcimundertakes no obligation to update or revise any forward-looking statements in the future or to adjust them in line with future events ordevelopments, except to the extent required by law.
