2017 - san bernardino community college district
TRANSCRIPT

2017 Comprehensive Master Plan
APPENDIX
SAN BERNARDINO VALLEY COLLEGESAN BERNARDINO COMMUNITY COLLEGE DISTRICT


Institutional LearningOutcomes
Institutional Learning Outcomes (ILOs) are the
knowledge, skills, abilities, and attitudes that students
are expected to develop as a result of their overall
experiences with any aspect of the College, including
courses, programs, and student services. ILOs are
designed to help guide individual departments and
disciplines in the development of student learning
outcomes for programs, courses, and services.
San Bernard ino Va l l ey Co l lege / 2017 Comprehens ive Mas te r P lan A.1
2017 Comprehens ive Mas te r P lan Append ix / SBCCD / HMC Arch i tec ts + ALMA St ra teg ies

CRITICAL THINKING SKILLS
Information Literacy
› Finding, interpreting, and evaluating information in
print, electronic, and non-electronic media sources
Logical Reasoning
› Constructing, supporting, analyzing, and evaluating
arguments
Problem Solving
› Using evidence-based reasoning to articulate a
problem and propose hypotheses or solutions
Creativity
› Using creative reasoning for problem solving and
personal and social expression
COMMUNICATION SKILLS
Literacy
› Reading
› Listening
› Observing
› Speaking
› Writing
Interpersonal Skills
› Working with individuals and groups, including
conflict resolution and giving/receiving constructive
feedback
QUANTITATIVE SKILLS
Mathematical Theory
› Understanding mathematical concepts and
structures
Applied Mathematics
› Applying mathematical skills and numerical data to
analyze and solve real world problems
Mathematical Visualization
› Using graphs, charts, and tables
INSTITUTIONAL LEARNING OUTCOMES
San Bernard ino Va l l ey Co l lege / 2017 Comprehens ive Mas te r P lanA.2
2017 Comprehens ive Mas te r P lan Append ix / SBCCD / HMC Arch i tec ts + ALMA St ra teg ies

DISCIPLINE SPECIFIC SKILLS
Discipline Theory
› Understanding and employing discipline
vocabulary, ideas, theories, standards and ethics
Discipline Technology
› Using tools, computers, instruments, and
equipment relevant to discipline
Discipline Performance
› Working in labs, workshops, clinics, performances,
and work experience relevant to discipline
PERSONAL, SOCIAL, PROFESSIONAL
RESPONSIBILITY
Self-Knowledge
› Understanding and evaluating personal strengths,
weaknesses, biases, and values
Goal-Setting
› Setting goals that are realistic and balance
educational, professional, and personal life
Cultural Awareness
› Understanding and respecting one’s own culture,
other cultures, and diversity
Ethics
› Understanding and practicing ethics, intellectual
honesty, fairness, and personal responsibility
San Bernard ino Va l l ey Co l lege / 2017 Comprehens ive Mas te r P lan A.3
2017 Comprehens ive Mas te r P lan Append ix / SBCCD / HMC Arch i tec ts + ALMA St ra teg ies

San Bernard ino Va l l ey Co l lege / 2017 Comprehens ive Mas te r P lanA.4
2017 Comprehens ive Mas te r P lan Append ix / SBCCD / HMC Arch i tec ts + ALMA St ra teg ies
Individual Data Sheets By Division
San Bernard ino Va l l ey Co l lege / 2017 Comprehens ive Mas te r P lan A.5
2017 Comprehens ive Mas te r P lan Append ix / SBCCD / HMC Arch i tec ts + ALMA St ra teg ies

Individual Data Sheets By Division
APPLIED TECHNOLOGY, TRANSPORTATION + CULINARY ARTS DIVISION (INSTRUCTION)AERONAUTICS – 2014-2015
Description: › The Airframe and Powerplant Technician program
prepares Students for employment in the aviation
industry as a certified Airframe and Powerplant
Mechanic. The curriculum encompasses 1900
hours of instruction, 750 hours in Airframe, 750
hours Powerplant, and 400 hours in the Airframe
and Powerplant General Curriculum. The program
is certified by the FAA under Federal Aviation
Regulation Part 147. The industry analyst from
Boeing predicts that 556,000 new mechanics and
498,000 pilots will be needed by 2032.
Assessment: › FTES decreased by 25% within a year due to the
sudden departure of the only full time Faculty and
chair responsible for administering, promoting, and
managing the program.
› WSCH per FTEF has decreased 19% in five years
but most noticeably in the last year for above
stated reason. Lack of program continuity of the
faculty not being full-time.
› Even with reduced FTES and WSCH, Student
success and retention are higher than the campus
average. Program is #4 on campus in number of
certificates issued.
› ZERO (0) full-time Faculty for 6 FTEF, F/T needed
to grow program and do required administrative
duties of faculty.
› Enrollment has dropped due to the lack of
continuity of the faculty not being full-time.
Department Goals: › Focus on close association with industry
representatives in a continuing effort to meet the
needs of a changing workforce.
› Update instructional technology and teaching aids
to meet these industry needs.
› Adapt and implement new regulatory and
environmental requirements.
› Hire full-time faculty so program can grow.
› Fill the vacant laboratory assistant position.
Challenges & Opportunities: › Increased regulatory demands and high FTEF
demonstrate:
› The importance of additional F/T faculty to
grow program and meet demands of the
industry.
› Difficult to recruit part-time faculty due to
HIGH employability in industry and low adjunct
faculty pay.
› Lab Assistant is needed to ensure continued
student safety and to prepare lab for improved
student learning and efficiency.
› Due to severe space constraints two lab
sections are taught in one lab at the same
time.
Action Plan: › Expose student to data that explains advantages
of degree programs over minimum CTE course
offerings.
› Demonstrate the need and importance of full-time
faculty based on institutional and industry driven
data. Hire lab assistant for safety and success.
› Pursue procurement of new technology
environmentally friendly alternative fuel powerplants
and hi technology composite structures.
San Bernard ino Va l l ey Co l lege / 2017 Comprehens ive Mas te r P lanA.6
2017 Comprehens ive Mas te r P lan Append ix / SBCCD / HMC Arch i tec ts + ALMA St ra teg ies

10-11 11-12 12-13 13-14 14-15
Duplicated Enrollment 477 417 431 304 242
FTEF 7.02 6.82 6.09 5.69 5.98
WSCH per FTEF 402 387 445 458 323
10-11 11-12 12-13 13-14 14-15
Sections 20 19 17 12 14
% of online enrollment 0% 0% 0% 0% 0%
Degrees awarded 2 2 0 3 3
Certificates awarded 40 36 39 42 4
Award Source: http://datamart.cccco.edu/Outcomes/Program_Awards.aspx
TOP Code: 0950XX
San Bernard ino Va l l ey Co l lege / 2017 Comprehens ive Mas te r P lan A.7
2017 Comprehens ive Mas te r P lan Append ix / SBCCD / HMC Arch i tec ts + ALMA St ra teg ies

AUTOMOTIVE COLLISION – 2014-2015
Description: › The Collision Repair, Refinishing & Street Rod
Program instructs students in collision repair,
frame straightening, refinishing, estimating, street
rod fabrication and vehicle restoration. Students
acquire job skills that range from minor repairs
and unibody frame replacement to spot jobs and
complete vehicle refinishing. The newest edition
to the program is the Auto Estimating in Fall 2014,
Street Rod, Fall 2015 and Interior Restoration, Fall
2016. The automotive department and instructors
are certified by ICAR which is a nationally
recognized organization.
Assessment: › The Collision, Refinishing and Street Rod Program
data shows increases in enrollment since 2009.
› The success rates are 83%, well above the school
average at 79%
› The retention rate is 93%, well above the school
average at 89%
› Certificates have doubled from 2010-11
› WSCH per FTEF average 407 because of duplicate
enrollment
› The FTEF data indicate need for additional full-time
faculty as well as lab assistants.
› The Collision and Refinishing Department is leading
the Technical Division in certificates with 146 and 5
AS degrees in a five year period.
Department Goals: › Skills learned in the collision, refinishing and street
rod programs overlap into other industries, with
72% of the San Bernardino population employed in
blue collar jobs.
› The collision, refinishing and street rod department
will continue to offer quality education in vehicle
restoration, interiors restoration and in green
technology. This includes clean air refinishing
techniques for collision and hybrid/alternative fuel
body repair classes. To do this we will need the
latest technology and equipment.
› We will be restructuring the exciting lab space
to better support our students to increase their
success.
› The addition of industry and education partners
(Chief Auto-motive, LKQ, Service King, NAPA,
Victor Valley & RCC, etc.) will help with our
technical information, equipment, demonstrations
and internships for continued student success.
Challenges & Opportunities: › The department has had their building renovated.
With the help of program review and grant monies,
the department purchased new and updated
equipment such as a frame rack, one aluminum
repair station and three welding stations. The
advisory board recommends that we restructure
our space to keep up with industry standards. A
challenge is where to put the cabinets, tooling,
welding machines and supplies. One solution is
to move the existing 40 foot container that was
purchased years ago for street rod and move
it to the auto compound. The department has
doubled in sections in the past ten years but space
has remained the same, so reutilizing space is
necessary.
Action Plan: › The collision, refinishing and street rod program
continues to grow with additional sections, two
new estimating classes and two new street rod
classes in Fall 2015 and Spring 2016, and interior
restoration, Fall 2016. With the additional courses
and sections, there must be annual funding. We
are requesting additional budget money under the
0949 Tops Code.
› The automotive department and instructors are
continuing the certification process with ICAR
(Inter Industry Conference on Automotive Collision
Repair) and ASE (Automotive Service Excellence),
which are nationally recognized organization.
Individual Data Sheets By Division
APPLIED TECHNOLOGY, TRANSPORTATION + CULINARY ARTS DIVISION (INSTRUCTION) (cont.)
San Bernard ino Va l l ey Co l lege / 2017 Comprehens ive Mas te r P lanA.8
2017 Comprehens ive Mas te r P lan Append ix / SBCCD / HMC Arch i tec ts + ALMA St ra teg ies

10-11 11-12 12-13 13-14 14-15
Duplicated Enrollment 584 555 575 580 617
FTEF 9.38 9.38 10.19 10.44 11.39
WSCH per FTEF 440 434 411 393 360
10-11 11-12 12-13 13-14 14-15
Sections 23* 23* 25* 25* 29*
% of online enrollment 0% 0% 0% 0% 0%
Degrees awarded 0 0 1 0 4
Certificates awarded 15 48 31 35 17
*Four of these courses overlap with Auto Technology (Auto 50, 52, 84, 56)
Data includes: SBVC, SOFF and SBBHS
Source: http://datamart.cccco.edu/Outcomes/Program_Awards.aspx
Code: 0949
San Bernard ino Va l l ey Co l lege / 2017 Comprehens ive Mas te r P lan A.9
2017 Comprehens ive Mas te r P lan Append ix / SBCCD / HMC Arch i tec ts + ALMA St ra teg ies
AUTOMOTIVE TECHNOLOGY – 2014-2015
Description: › The automotive technology program provides
the students with the needed skill in order to be
successful in today’s industry. The courses offered
apply towards a certificate and allow the students
to work day or evening in order to complete the
required courses. The FTES went up in 2013-14
due to the recruitment of the department and the
improvements made in the lab equipment.
Assessment: › The department is moving forward and providing
the students the skills to obtain a job in both
collision and automotive repair. The success rate
has risen to 76% and the retention at 90% which
means the plan the department has to increase
both areas is working.
Department Goals: › The department’s goals are to help each student
succeed and obtain their goal, of working in the
industry and completing the automotive certificates
and degrees. The department continues to recruit
underserved population and to provide a shop with
tools and equipment used today in local industry.
Challenges & Opportunities: › The challenge the department faces is our building
is old and outdated. We are in desperate need for a
new facility.
Action Plan: › To continue to recruit and promote our programs
to all group ages gender and nationalities. The
department will continue providing the students
with the skills and knowledge to be successful
in the industry. The department will continue to
encourage students to complete a certificate and
degrees.
Individual Data Sheets By Division
APPLIED TECHNOLOGY, TRANSPORTATION + CULINARY ARTS DIVISION (INSTRUCTION) (cont.)
San Bernard ino Va l l ey Co l lege / 2017 Comprehens ive Mas te r P lanA.10
2017 Comprehens ive Mas te r P lan Append ix / SBCCD / HMC Arch i tec ts + ALMA St ra teg ies

10-11 11-12 12-13 13-14 14-15
Duplicated Enrollment 618 567 599 531 558
FTEF 9.16 8.41 9.16 8.45 8.39
WSCH per FTEF 456 467 448 424 446
10-11 11-12 12-13 13-14 14-15
Sections 31* 28* 30* 22* 28*
% of online enrollment 0% 0% 0% 0% 0%
Degrees awarded 0 0 0 3 1
Certificates awarded 6 5 20 16 12
*Four of these courses overlap with Auto Collision (Auto 50, 52, 84, 56)
Source: http://datamart.cccco.edu/Outcomes/Program_Awards.aspx
Code: 0948
San Bernard ino Va l l ey Co l lege / 2017 Comprehens ive Mas te r P lan A.11
2017 Comprehens ive Mas te r P lan Append ix / SBCCD / HMC Arch i tec ts + ALMA St ra teg ies

CULINARY ARTS – 2014-2015
Description: › The Culinary Arts Department teaches students
to run their own restaurant upon completion.
There are several choices for the students upon
completion of the program, cooks, bakers, sous
chef, head chef, kitchen manager, dining room
manager, server, food stylist, photographer, and
food science. The students attend lecture courses
and lab courses in order to get a full understanding
of the restaurant hospitality industry. The program
currently is a 1.5 year program if the student takes
the courses when offered.
Assessment: › Although participation in the program has dropped
from 2012-13 the numbers are coming back up in
2014-15 and will continue to climb over the next
couple of years with the networking and marketing
planned.
› The FTEF has gone up from past years meaning
that the department should have two full time
instructors instead of four adjunct instructors. The
more adjunct instructors we have in the program
the less successful the students are and the
continuity of the program and students suffer.
› Student success and retention remains positive.
› Certificates and graduation rates are also going
up. Hiring a professional expert has helped work
with the students and suggests the fastest route to
graduation.
Department Goals: › Grow the program by advertising on billboards, bus
stops, at high schools, etc.
› Becoming more involved in Skills USA. Offering
$500.00 scholarships to incoming freshman that
participated in SkillsUSA whose goals are to obtain
a degree in Culinary Arts.
› Purchase a catering truck in order to served food
to the public and get SBVC Culinary known in the
area.
› Hire a full time classified staff to run the dining room
during lunch, make deposits, tutor the students
in the program, market the program, help the
instructor with ordering, inventory and safety of the
students. Reach out to industry.
› Hire a classified lab tech for front of house.
› Continue to have success and retention within the
program.
› Purchase a new steamer or combination oven.
Challenges & Opportunities: › Adjuncts that do not allow extra time to help the
program grow.
› One full time instructor to handle two programs that
need a lot of attention. Only so much time in a day.
› Food truck to service the community and market
the program. This would be a great experience for
the students. The down side it would require an
instructor to go out with them.
› Open the Sunroom for light breakfast, coffees, teas
and Danish, quiche, bagels etc. The staff is here
each morning by 7:00am. Students are required to
volunteer 100 hours during each semester.
› Finding a classified lab tech for the front of
the house. Most qualified don’t have the skill
or knowledge needed to work in a teaching
environment.
› Challenge: keeping all equipment working at
optimal levels. Steamer and ovens.
Action Plan: › Continue to grow the program using the
suggestions listed above.
› Hire one more full time faculty.
› Look to see what a food truck would cost and
have fund raisers to purchase and fix the truck for
service.
› Purchase proper permits for the truck.
› Open three days a week for breakfast service
to see how that goes and if successful create a
course to cover breakfast service.
Individual Data Sheets By Division
APPLIED TECHNOLOGY, TRANSPORTATION + CULINARY ARTS DIVISION (INSTRUCTION) (cont.)
San Bernard ino Va l l ey Co l lege / 2017 Comprehens ive Mas te r P lanA.12
2017 Comprehens ive Mas te r P lan Append ix / SBCCD / HMC Arch i tec ts + ALMA St ra teg ies

10-11 11-12 12-13 13-14 14-15
Duplicated Enrollment 307 326 375 362 344
FTEF 3.32 3.73 3.93 4.19 5.25
WSCH per FTEF 612 618 613 461 375
10-11 11-12 12-13 13-14 14-15
Sections 9 10 11 17 20
% of online enrollment 0% 0% 0% 0% 0%
Degrees awarded* 1 0 4 3 6
Certificates awarded* 2 8 17 14 20
Award Source: http://datamart.cccco.edu/Outcomes/Program_Awards.aspx
TOP Code: 13630/130710
› Open the position and hire a lab tech for front of
the house.
› Purchase a new combination oven or steamer to
teach students how to use equipment properly.
› Continue working with the students in order to
keep certificates and graduation rates rising.
San Bernard ino Va l l ey Co l lege / 2017 Comprehens ive Mas te r P lan A.13
2017 Comprehens ive Mas te r P lan Append ix / SBCCD / HMC Arch i tec ts + ALMA St ra teg ies
DIESEL – 2014-2015
Description: › SBVC is the only public college in the area that
offers a complete Diesel program in the Inland
Empire Desert Region. Logistics is one of the
five sectors that are targeted for work force
development. The trucking industry in the Inland
Empire is expanding with the growth of logistic
industry and warehouses.
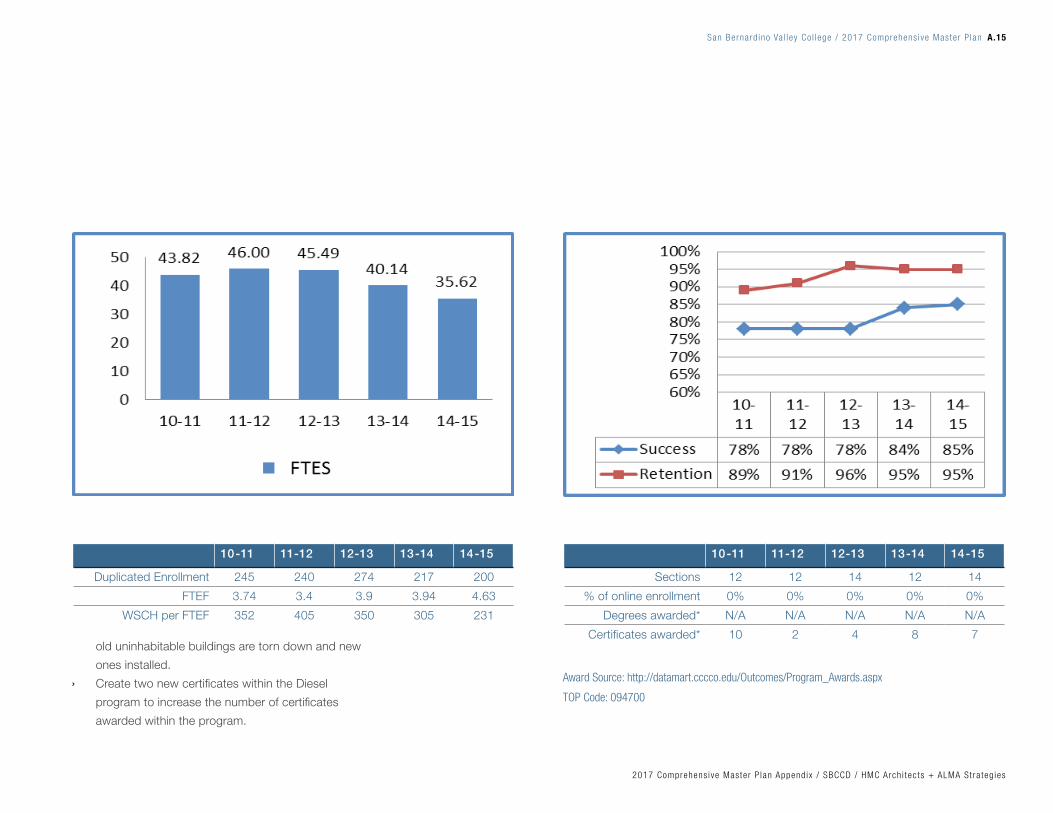
Assessment: › Year to year, the student enrollment has struggled
due to local industry jobs, which appeal to
our diesel students. A lack of advertising also
contributes to low enrollment
› FTEF have increased in 14-15 to 4.63 because of
increased sections from 12 in 13-14 to 14 in 14-15.
By increasing sections it allows working students
an opportunity to attend other classes that meet
their schedule needs.
› Because the classes have a low count of students,
when one or two students either drop the course
or don’t receive a passing grade, it affects the
success rate tremendously.
› The retention rate is steady at 95% in 14-15 as
compared to 13-14.
› One measure of program efficiency (WSCH/FTEF)
struggles due to classroom capacity limitations.
The department has requested the old uninhabited
buildings be removed from the property and new
classrooms be installed so the Diesel program can
grow its department by adding the CNG training
and manual transmission, differential and automatic
transmission classes.
› There were seven certificates awarded in 14-15
showing that students understand that graduating
means jobs.
Department Goals: › Increase the number of certificates awarded in
the Diesel program by adding a full-time faculty
instructor
› Update the facility to standards which include
lighting, tooling and outdoor lab coverage to
protect from the elements.
› Expand customized not-for-credit training for
incumbent workers.
› Encourage students to achieve an AS degree.
› Broaden the Industry Advisory Board membership
pool.
› This 14-15 year the department hopes to purchase
a Compressed Natural Gas (CNG) training module
and tools needed to complete the five-year master
plan.
› Work with the SBVC District to expand highly
demanded, not-for-credit training for incumbent
workers on, Compressed Natural Gas (CNG)
engine classes.
Challenges & Opportunities: › The current facility is inadequate for the program
needs; class cap of 18 makes it inefficient.
› The breakroom and the meeting room were
repurposed as classrooms without any
modifications.
› Newer teaching modules and tools are needed
to keep up with the new buses and trucks and
other vehicles, as the EPA tightens the emission
standards in California by 2020.
› The outside lad area, where students perform
lab exercises, is unprotected and open to the
elements. On hot days students cannot work on
the trucks in the lab area.
› Establishing a new AS Degree has been timely and
cumbersome.
Action Plan: › Renovate the current facility to meet the program
needs which would include better lighting and
acoustics in the classrooms as well as lab. Also
add two new buildings on the property after the
Individual Data Sheets By Division
APPLIED TECHNOLOGY, TRANSPORTATION + CULINARY ARTS DIVISION (INSTRUCTION) (cont.)
San Bernard ino Va l l ey Co l lege / 2017 Comprehens ive Mas te r P lanA.14
2017 Comprehens ive Mas te r P lan Append ix / SBCCD / HMC Arch i tec ts + ALMA St ra teg ies
10-11 11-12 12-13 13-14 14-15
Duplicated Enrollment 245 240 274 217 200
FTEF 3.74 3.4 3.9 3.94 4.63
WSCH per FTEF 352 405 350 305 231
10-11 11-12 12-13 13-14 14-15
Sections 12 12 14 12 14
% of online enrollment 0% 0% 0% 0% 0%
Degrees awarded* N/A N/A N/A N/A N/A
Certificates awarded* 10 2 4 8 7
Award Source: http://datamart.cccco.edu/Outcomes/Program_Awards.aspx
TOP Code: 094700
old uninhabitable buildings are torn down and new
ones installed.
› Create two new certificates within the Diesel
program to increase the number of certificates
awarded within the program.
San Bernard ino Va l l ey Co l lege / 2017 Comprehens ive Mas te r P lan A.15
2017 Comprehens ive Mas te r P lan Append ix / SBCCD / HMC Arch i tec ts + ALMA St ra teg ies

ELECTRICITY/ELECTRONICS – 2014-2015
Description: › The department provides an educational program
that prepares and enables students to obtain
entry-level positions as electricians or electronic
technicians in a variety of fields such as electronics
technology, computer technology, communications,
industrial electronics, as well as electricians
training. The core courses common to electrical
and electronic fundamentals are articulated
with four-year university for BS in Engineering
Technology.
Assessment: › Enrollment has shown impressive improvements
and has surpassed levels in previous five years.
› Retention rate has slightly dropped but that is due
to sharp increase in enrollment and is anticipated.
› Success rate remains strong and degrees awarded
and certificates awarded impressively increased.
› WSCH and FTEF continued to be low due to
concentration on student success and reducing
size of lab classes so students get quality hands on
training.
Department Goals: › Hire a second full-time faculty as the FTEF rate has
skyrocketed to an unprecedented 10.46, one of the
highest in the technology department.
› Hire more qualified faculty to teach updated
curriculum materials relating to the specific subject
matter.
› Continue to update curriculum by adding or
modifying industrial automation, communication,
and micro-controller classes. Creating new
Industrial automation certificate as well as green
technology certificate.
› Continue updating lab training equipment.
Challenges & Opportunities: › FTEF is at 10.46 which strongly justifies hiring new
full-time faculty since last full-time faculty never
replaced aftyer retirement.
› Hard to find qualifying part time faculty to teach
during daytime.
› Two distinict fields: Electricity power systems and
electronics should have one full-time faculty per
field.
› Classrooms and lab rooms are used to capacity.
More classrooms needed.
Individual Data Sheets By Division
APPLIED TECHNOLOGY, TRANSPORTATION + CULINARY ARTS DIVISION (INSTRUCTION) (cont.)
Action Plan: › Hire another full-time faculty for the electrical power
systems program.
› Purchase newer automation trainers and
equipment for more comprehensive lab training to
coincide with industry requirements.
› Continue to update curriculum by adding or
modifying industrial automation, communication,
and micro-controller classes.
› Seek more classroom space to try to offer more
sections to expand enrollment.
San Bernard ino Va l l ey Co l lege / 2017 Comprehens ive Mas te r P lanA.16
2017 Comprehens ive Mas te r P lan Append ix / SBCCD / HMC Arch i tec ts + ALMA St ra teg ies

10-11 11-12 12-13 13-14 14-15
Duplicated Enrollment 755 738 752 789 847
FTEF 7.57 6.96 7.10 8.20 10.46
WSCH per FTEF 402 427 423 395 338
10-11 11-12 12-13 13-14 14-15
Sections 32 29 30 34 42
% of online enrollment 0% 0% 0% 0% 0%
Degrees awarded* 11 13 4 10 13
Certificates awarded* 30 18 23 19 28
Award Source: http://datamart.cccco.edu/Outcomes/Program_Awards.aspx
TOP Code: 0934XX
San Bernard ino Va l l ey Co l lege / 2017 Comprehens ive Mas te r P lan A.17
2017 Comprehens ive Mas te r P lan Append ix / SBCCD / HMC Arch i tec ts + ALMA St ra teg ies

FOOD & NUTRITION – 2014-2015
Description: › This department is teaches food and nutrition,
modified diets and health care and special diets.
The students gain a certificate in dietary supervisor,
which can lead to a job working in a hospital,
retirement homes, spas, and school districts.
› This industry is growing; we just need to revamp
the program in order to students.
Assessment: › Although the interest in the program is high
enrollment is low.
› Enrollment in 2013-14 was at its highest. The
department chair thought about discontinuing the
program however the student body uses basic
nutrition course for general education requirements.
› Enrollment in 2014-15 is down from last year;
however, the program needs some major changes.
› This department has two adjunct instructors and
no full-time instructors. With only two adjunct
instructors, the WSCH per FTEF is not being met.
› Student success is down within the program
because of low enrollment the courses continue to
be canceled.
› Retention is high due to the department chair. The
department chair works to retain each student
within the program due to the overlap within the
department curriculum.
Department Goals: › To revamp the program and articulate with a local
university.
› Offer updated certificates.
› Hire more adjunct employees to offer more courses
within the discipline.
Challenges & Opportunities: › The challenge is that the department chair is
extremely busy with her own department and does
not really have time to give the food and nutrition
department.
› Finding qualified instructors to teach the courses.
› Articulating with a university.
› Creating updated certificates.
› Increase enrollment by advertising to local school
districts.
Action Plan: › To speak with the articulation officer to find out
what colleges run the courses.
› Scout for adjuncts.
› Work with adjunct faculty to improve courses and
draw more students into the program.
› Advertise the program.
Individual Data Sheets By Division
APPLIED TECHNOLOGY, TRANSPORTATION + CULINARY ARTS DIVISION (INSTRUCTION) (cont.)
San Bernard ino Va l l ey Co l lege / 2017 Comprehens ive Mas te r P lanA.18
2017 Comprehens ive Mas te r P lan Append ix / SBCCD / HMC Arch i tec ts + ALMA St ra teg ies

10-11 11-12 12-13 13-14 14-15
Duplicated Enrollment 411 278 354 443 353
FTEF 1.60 1.20 1.80 2.20 2.20
WSCH per FTEF 770 731 608 610 482
10-11 11-12 12-13 13-14 14-15
Sections 11 6 9 11 11
% of online enrollment 0% 0% 0% 0% 0%
Degrees awarded N/A N/A N/A N/A N/A
Certificates awarded 12 1 0 2 2
Award Source: http://datamart.cccco.edu/Outcomes/Program_Awards.aspx
TOP Code: 130620
San Bernard ino Va l l ey Co l lege / 2017 Comprehens ive Mas te r P lan A.19
2017 Comprehens ive Mas te r P lan Append ix / SBCCD / HMC Arch i tec ts + ALMA St ra teg ies

HEATING, VENTILATION, AIR CONDITIONING &
REFRIGERATION – 2014-2015
Description: › The program prepares students for entry level
employment in the residential and commercial
HVAC/R repair and installation. With climate
change and longer dry periods in the west, HVAC/R
technicians are in demand. Many have their own
business or work as independent contractor for
box stores. The department offers Environmental
Protection Agency (EPA) certification, required for
handling refrigerant gases used in the industry. The
course curriculum has essentially remained the
same in years.
Assessment: › FTEF has improved to its highest level in five years
despite program has no full time faculty.
› WSCH/FTEF continued a decline due to lab
intensive classes but is within the norm compared
with previous years.
› Student success rate remained essentially
unchanged but is higher than the campus average.
› Number of degrees and certificates awarded has
increased dramatically and reached 2010 levels.
› Single, inadequately equipped lab serves the
program and that continues to limit its growth.
Department Goals: › Priority One: Hire a full-time faculty to give program
needed time and expertise to grow, expand, and
update current standings since the program is
running solely on part-time faculty.
› Update the laboratory by purchasing advanced
trainers that better serves the curriculum to help
bring it up to current industry standards.
› Update course content to include smart
technologies and develop an industry recognized
certificate program to be integrated with our
existing program.
› Increase number of sections in daytime to
increase enrollment and attract a different student
population since currently all classes are in evening.
Challenges & Opportunities: › The full-time faculty retired in 2009; position
eliminated.
› No substantial budget ever allocated to program.
› Program running with skeletal part-time faculty
even though there is demand is high for program.
› Hard to find Faculty to teach morning sections.
Hiring full-time faculty will also resolve issue.
› One lab available for entire program that continues
to limit growth.
Action Plan: › Hire a full-time faculty and purchase updated
trainers by securing extra funding for the expensive
equipment.
› Offer more sections of core courses.
› Develop industry recognized certification.
› Create a pool of part-time faculty who may be
available to teach in the day time.
› Provide the adjunct faculty with training
opportunities to stay current with emerging
technologies.
Individual Data Sheets By Division
APPLIED TECHNOLOGY, TRANSPORTATION + CULINARY ARTS DIVISION (INSTRUCTION) (cont.)
San Bernard ino Va l l ey Co l lege / 2017 Comprehens ive Mas te r P lanA.20
2017 Comprehens ive Mas te r P lan Append ix / SBCCD / HMC Arch i tec ts + ALMA St ra teg ies

10-11 11-12 12-13 13-14 14-15
Duplicated Enrollment 258 218 229 271 276
FTEF 3.98 3.44 3.34 4.48 4.82
WSCH per FTEF 381 391 425 372 352
10-11 11-12 12-13 13-14 14-15
Sections 12 10 10 13 14
% of online enrollment 0% 0% 0% 0% 0%
Degrees awarded 2 1 0 2 3
Certificates awarded 14 6 8 8 12
Award Source: http://datamart.cccco.edu/Outcomes/Program_Awards.aspx
TOP Code: 094600
San Bernard ino Va l l ey Co l lege / 2017 Comprehens ive Mas te r P lan A.21
2017 Comprehens ive Mas te r P lan Append ix / SBCCD / HMC Arch i tec ts + ALMA St ra teg ies

INSPECTION TECHNOLOGY – 2014-2015
Description: › This is still a viable program for students interested
in the construction industry. Although the
curriculums have not been updated to reflect the
recent changes in building and construction codes,
the basic concepts are still being utilized and
enforced by the industry. The curriculum covers
testing of construction materials, non-structural
plan review, interpretation and use of building
codes, and related laws. It takes two years to
complete the certification program. Graduates
of the program work as building inspectors for
government agencies. The student enrollment still
has not recovered from the housing bubble in 2008
that adversely affected job prospects for graduates
of the program.
Assessment: › There is no full-time faculty to take ownership of the
program except the adjunct faculty who continues
to bring industry experiences in the classroom.
› Students in the program tend to stay until
completion due to the specialized nature of the
program.
› The housing market in the Inland Empire has not
fully recovered thus affecting enrollment.
› Less courses are offered in each semester.
› WSCH/FTEF has declined because of the decline in
the housing market and construction.
Department Goals: › Enhance existing curriculums to meet current
industry standards and employers’ needs.
› Offer additional sections in order to attract new
students to the program
› Offer short-term classes for incumbent workers to
update their skills as building codes change.
› Revise appropriate course contents to include the
California Building Codes rather than International
Building Codes.
› Seek external funding through grants to pay faculty
stipends in upgrading curriculums and purchase
reference manuals and materials needed in the
trade.
Challenges & Opportunities: › Request for program funding in order to enhance
and grow the program.
› Request for a full-time faculty position to take
ownership of the program as there is an anticipated
job demand to train the future workforce in this
field.
› Updating the skills of incumbent trainings is needed
due to changes in the standards and regulations.
Action Plan: › Get general funding for the program to pay a
part-time faculty to update courses, degree and
certificate.
› Update curriculum creating a definite entrance and
exit point and the current California Codes.
› Explore additional funding through grants in order
to update its curriculums and support program
needs such as purchase of reference manuals and
books.
› Develop non-credit courses to address retraining of
employees in this field.
Individual Data Sheets By Division
APPLIED TECHNOLOGY, TRANSPORTATION + CULINARY ARTS DIVISION (INSTRUCTION) (cont.)
San Bernard ino Va l l ey Co l lege / 2017 Comprehens ive Mas te r P lanA.22
2017 Comprehens ive Mas te r P lan Append ix / SBCCD / HMC Arch i tec ts + ALMA St ra teg ies

10-11 11-12 12-13 13-14 14-15
Duplicated Enrollment 179 130 186 106 82
FTEF 1.20 1.20 1.40 1.20 1.00
WSCH per FTEF 448 325 399 265 246
10-11 11-12 12-13 13-14 14-15
Sections 6 6 7 6 5
% of online enrollment 0% 0% 0% 0% 0%
Degrees awarded 3 1 1 3 2
Certificates awarded 4 1 5 3 2
Award Source: http://datamart.cccco.edu/Outcomes/Program_Awards.aspx
TOP Code: 095720
San Bernard ino Va l l ey Co l lege / 2017 Comprehens ive Mas te r P lan A.23
2017 Comprehens ive Mas te r P lan Append ix / SBCCD / HMC Arch i tec ts + ALMA St ra teg ies

MACHINIST TECHNOLOGY – 2015-2014
Description: › The program is designed to train first-time students
and to re-train those employed in the machine
trades industry. Curriculum includes: conventional
machining, computer numerical control (CNC),
computer aided drafting (CAD), computer aided
manufacturing (CAM), tool & die, metrology,
inspection, and print reading. The program offers
AS degree and certificates in machinist technology.
The program offers students the opportunity
to obtain National Industry Metal Skills (NIMS)
credentials accredited by the American National
Standards Institute (ANSI).
Assessment: › Removal of prerequisites and corequisites from
courses to take effect fall 2016 and fall 2017. An
increase in success and retention is expected when
course modifications take effect.
› FTEF remain the same as no new faculty has
been hired since the retirement of full time faculty,
reduction of adjunct faculty, and sections offered.
› WSCH per FTEF continues to decline due to low
enrollment. Removal of Prerequisites and Co-
requisites from courses to take effect fall 2016 and
fall 2017. An increase in enrollment is expected
when course modifications take effect.
› Success and retention has declined only two
percent and is still good, possibly affected only by
low enrollment.
Department Goals: › Hire full-time staff.
› As previously stated in 2013-2014 educational
master plan program goals.
› Development of curriculum with NIMS for existing,
new courses, and certificates are currently being
created and will be reviewed by local industry
advisory committee for implementation.
› Increase program awareness, with local high
schools, continuations, and options for youth.
Challenges & Opportunities: › There is no full-time faculty to resolve all current
machine trade’s needs.
› NIMS, curriculum, partnerships, and exposure to
the program.
› There are not enough CNC machine tools for
each student; program needs to acquire more
CNC machine tools, automated, and robotics
equipment.
Action Plan: › Hire full-time, qualified machinist instructor that
can transcend all facets of machine trades scope:
NIMS, conventional machining, computer numerical
control (CNC), computer aided drafting (CAD), and
computer aided manufacturing (CAM), tool & die,
metrology, inspection, and print reading.
› Develop curriculum work with industry, schools
and the community. Request funding to purchase
equipment.
Individual Data Sheets By Division
APPLIED TECHNOLOGY, TRANSPORTATION + CULINARY ARTS DIVISION (INSTRUCTION) (cont.)
San Bernard ino Va l l ey Co l lege / 2017 Comprehens ive Mas te r P lanA.24
2017 Comprehens ive Mas te r P lan Append ix / SBCCD / HMC Arch i tec ts + ALMA St ra teg ies

10-11 11-12 12-13 13-14 14-15
Duplicated Enrollment 260 206 220 190 141
FTEF 4.69 3.02 3.08 3.10 3.10
WSCH per FTEF 320 400 399 316 255
10-11 11-12 12-13 13-14 14-15
Sections 27 16 17 16 17
% of online enrollment 0% 0% 0% 0% 0%
Degrees awarded* 2 0 2 4 3
Certificates awarded* 8 10 21 3 10
Award Source: http://datamart.cccco.edu/Outcomes/Program_Awards.aspx
TOP Code: 095630
San Bernard ino Va l l ey Co l lege / 2017 Comprehens ive Mas te r P lan A.25
2017 Comprehens ive Mas te r P lan Append ix / SBCCD / HMC Arch i tec ts + ALMA St ra teg ies

WATER SUPPLY TECHNOLOGY – 2014-2015
Description: › The water supply technology program is designed
to serve students who are employed or interested
in employment in the field of water/ wastewater.
The program provides technical courses in water
distribution, water treatment, wastewater collection,
wastewater treatment, water use efficiency, as
well as backflow prevention and cross-connection
control. The courses prepare students to upgrade
their skills and/or prepare them for licensing
examinations and certifications from the California
State Water Resource Board, American Water
Works Association, California Water Environment
Association, and other agencies. The program
offers both vocational certificates as well as an
Associate Degree.
Assessment: › Student enrollment is at an all-time low in five
years.
› Overall student success/retention has improved in
five years.
› Number of certificates awarded has improved and
number of degrees awarded is 2nd highest in five
years.
› Efficiency has continued to fall in last two years to
an all-time low for a program with mainly lecture
courses. This is highly troubling.
› Many courses have low enrollment and the number
of sections offered is high compared to enrollment
numbers.
› The FTEF is high, a reflection on multiple sections
with low student enrollment.
Department Goals: › Obtain a stable, permanent budget from general
funds in order to fund tutors, workshops, lab
supplies, and field trips.
› Track students who complete the courses to
determine if they are receiving state certification
and jobs in the field.
› Increase partnership with industry to place all the
interested students in work experience programs.
› Schedule courses at time when convenient for
students to attend.
› Provide nurturing and adequate support service to
adjunct faculty and students to sustain/improve the
quality of the program.
› Use grant funds to improve enrollment numbers in
the program and increase class sizes.
Challenges & Opportunities: › The backflow lab with six stations is inadequate for
25 students.
› Lack of a stable permanent budget hampers long
term planning.
› Use grant to track students who go to work before
completing a SBVC degree or a certificate.
› Update curriculum with input from industry advisory
boards.
› Sudden move of the program to the technical
division in the middle of 2013-14 academic year
has led to uncertainty and uneven support services.
› Courses are taught in many different buildings on
the campus.
› All classroom assignments are not done when
schedule is prepared.
› Some classes with low enrollment are cancelled
after two weeks, leaving students to scramble for a
class to make full load.
Action Plan: › Add a minimum of two stations to backflow lab.
› For existing and future grants, align the goals of the
grant to improve enrollment in the program.
› Assign classroom to every course at the time
schedule is prepared and hold all the water
classes in one building and in a limited number
of classrooms, to allow students to form informal
community and network.
› Move the program to a division that can adequately
support it.
Individual Data Sheets By Division
APPLIED TECHNOLOGY, TRANSPORTATION + CULINARY ARTS DIVISION (INSTRUCTION) (cont.)
San Bernard ino Va l l ey Co l lege / 2017 Comprehens ive Mas te r P lanA.26
2017 Comprehens ive Mas te r P lan Append ix / SBCCD / HMC Arch i tec ts + ALMA St ra teg ies

10-11 11-12 12-13 13-14 14-15
Duplicated Enrollment 1,015 852 952 933 758
FTEF 7.04 5.76 6.39 8.09 6.98
WSCH per FTEF 370 441 449 340 282
10-11 11-12 12-13 13-14 14-15
Sections 47 37 39 45 45
% of online enrollment 2% 0% 3% 0% 0%
Degrees awarded 3 4 8 20 9
Certificates awarded 14 9 12 5 15
Award Source: http://datamart.cccco.edu/Outcomes/Program_Awards.aspx
TOP Code: 95800
› Schedule classes when it is convenient for students
and cancel the sections with very low enrollment on
the first day of class.
› Update certificate and degree to allow for quick
completion of program and success in obtaining
state certification.
San Bernard ino Va l l ey Co l lege / 2017 Comprehens ive Mas te r P lan A.27
2017 Comprehens ive Mas te r P lan Append ix / SBCCD / HMC Arch i tec ts + ALMA St ra teg ies

WELDING TECHNOLOGY – 2014-2015
Description: › The welding program is maintained to keep up with
the welding technology industry standards in the
areas of Oxy-fuel, Shielded Metal Arc, Gas Metal
Arc, Flux-cored Arc, Gas Tungsten. Students in
the program are being prepared to successfully
pass the American Welding Society (AWS) certified
welding inspectors or LA City certifed structural
welders. The department continues to provide
the needed training for our students to obtain the
skills and competencies needed in their welding
profession. Various academic certificates and an
associate degree are offered in welding technology.
Assessment: › Some of the curriculums were enhanced to meet
industry needs and standards.
› Due to the recent back welding building renovation
project that limited class/lab room spaces, class
sizes were affected resulting in further decline of
the WSCH/FTEF.
› There is only one full-time faculty for a 7.82 FTEF
and also serves as the faculty chair.
› Faculty with specialized skills comprise the adjunct
faculty pool.
Department Goals: › Continue to collaborate with industry and employer
partners.
› Continue to promote the program to the
community, feeder high schools and ROPs.
› Upgrade equipment and curriculums to meet
industry/ employer needs and requirements.
› Explore external funding through grants to
modernize equipment and tools.
› Fulfill faculty and staffing needs.
Challenges & Opportunities: › Space and facility issues still exist in the front
welding lab.
› Industry recognized certifications and credentials
need to be embedded in our existing curriculums.
› High costs of consumables thereby necessitated to
purchase simulators to minimize instructional costs.
› Major employers, such as the California Steel
Industries provides internship opportunities for our
students.
Action Plan: › Continue to request for additional full-time faculty
positions (minimum = 2).
› Improve the front welding lab to include upgraded
ventilation and updated equpment.
› Explore additional funding for the program through
grants.
› Offer work experience courses and/or partner
with regional employers to provide internship
opportunities for our students.
› Enhance existing curriculums to meet industry/
employer needs and standards.
Individual Data Sheets By Division
APPLIED TECHNOLOGY, TRANSPORTATION + CULINARY ARTS DIVISION (INSTRUCTION) (cont.)
San Bernard ino Va l l ey Co l lege / 2017 Comprehens ive Mas te r P lanA.28
2017 Comprehens ive Mas te r P lan Append ix / SBCCD / HMC Arch i tec ts + ALMA St ra teg ies

10-11 11-12 12-13 13-14 14-15
Duplicated Enrollment 506 374 429 463 338
FTEF 8.05 8.47 6.59 7.84 7.82
WSCH per FTEF 524 460 361 291 201
10-11 11-12 12-13 13-14 14-15
Sections 52 34 32 39 32
% of online enrollment 0% 0% 0% 0% 0%
Degrees awarded 0 0 1 1 0
Certificates awarded 6 3 4 1 6
Award Source: http://datamart.cccco.edu/Outcomes/Program_Awards.aspx
TOP Code: 095690
San Bernard ino Va l l ey Co l lege / 2017 Comprehens ive Mas te r P lan A.29
2017 Comprehens ive Mas te r P lan Append ix / SBCCD / HMC Arch i tec ts + ALMA St ra teg ies

Individual Data Sheets By Division
ARTS + HUMANITIES DIVISION (INSTRUCTION)
ART – 2014-2015
Description: › The art department provides quality art education
to a diverse community of learners. Courses in
Art are designed to serve lower division, transfer
and general education students at the two-year
college level, students interested in careers in
graphic design, web design, computer animation
and three-dimensional disciplines, and the personal
interests of our community members. Art courses
provide critical thinking skills and multicultural
experiences that can be usefully applied in other
areas of education and life.
Assessment: › Comparing the 2013-2014 and 2014-2015
academic years indicates:
› There was a decrease of 4.24 FTES.
› Duplicated enrollment increased by 54.
› FTEF increased by .18 and the WSCH per FTE
decreased by 12.
› The decline in FTES, duplicated enrollment and
FTEF may be linked to leveling x4 studio art classes
and ed plans that do not allow for studio art
classes.
› Success rate decreased by 3% and retention rate
decreased by 1%.
› The % of online enrollment increased by 1%;
degrees awarded decreased by 2; and certificates
awarded remained the same.
Department Goals: › To increase the number of sections offered.
› To increase online course offerings.
› To evaluate and implement changes to the SLOs
using the three-year course summaries.
› To Increase the number of degrees and certificates
awarded.
› To develop a transferable 3-D foundations course
and a 3-D printing course.
› To align courses with the TMC for studio and art
history courses.
› To host an art career day.
Challenges & Opportunities: › The challenges are lack of full time faculty,
especially an art historian. There are FTEFs for ten
full-time faculty, yet the department has three full
time faculty. Additional challenges maintaining and
increasing sections offered and students who are
underprepared and lack basic skills.
› The opportunitie are to develop new curriculum for
a 3-D foundatoin course, develop curriculum for a
3-D printing course, increase online offerings, and
align TMCs to increase educational partnerships
with the CSU system.
Action Plan: › Continue to develop a strategic plan for growth and
work with counselors on information about studio
courses.
› Continue regular department meetings to discuss
department goals and strategies.
› Identify an individual to write a 3-D foundations
course.
› Host art-related career day event.
› Continue regular advisory committee meetings.
› Continue to request an additional full-time faculty
member through program review.
› Continue SLO assessments and summaries and
revise SLOs as necessary.
San Bernard ino Va l l ey Co l lege / 2017 Comprehens ive Mas te r P lanA.30
2017 Comprehens ive Mas te r P lan Append ix / SBCCD / HMC Arch i tec ts + ALMA St ra teg ies

10-11 11-12 12-13 13-14 14-15
Duplicated Enrollment 2,754 2,224 2,152 2,209 2,263
FTEF 20.66 18.12 17.66 19.00 19.18
WSCH per FTEF 564 546 563 519 507
10-11 11-12 12-13 13-14 14-15
Sections 95 75 73 80 130
% of online enrollment 4% 0% 3% 3% 4%
Degrees awarded 10 13 9 16 14
Certificates awarded 3 9 9 7 7
Award Source: http://datamart.cccco.edu/Outcomes/Program_Awards.aspx
TOP Code: 100200/061410/103000
San Bernard ino Va l l ey Co l lege / 2017 Comprehens ive Mas te r P lan A.31
2017 Comprehens ive Mas te r P lan Append ix / SBCCD / HMC Arch i tec ts + ALMA St ra teg ies

COMMUNICATION STUDIES – 2014-2015
Description: › Communication studies has a FTE load equivalent
to 9 FTEF. However, the department functions
with four FTF, and seven adjunct faculty.
Communications studies serves as an important
role by preparing students for occupational
and personal success through developing their
communication skills. The department offers a
variety of 100-level communication courses that
meet general education requirements. Notably, this
program is the only area where the A1 requirement
for CSU transfer can be met. Courses are taught in
various learning environments and various times, in
order to create more access for students. Course
offerings include tradional face to face classes,
various late start schedules, 100% online, online-
hybrid, morning, mid-day, and eveining.
Assessment: › The department is beginning to experience growth.
Between the academic years of F13 and S15, the
department FTES experienced approximately 4%
growth.
› Department maintains FTEF load of nine, but
functions with four FTF and seven adjunct faculty.
› Department FTEF has continued to demonstrate
growth each year since 2012-2015.
› Department retention for the past five years
has experienced a fairly steady increase. More
specifically, the department has increased retention
rates 7% in the past five years between 2010 and
2015.
› Department success rates have increased 1%
in the past five years. However, the department
is experiencing a slight decline, which should be
discussed further among the department.
› The AA-T in Communication Studies was recently
state approved in 2013. In only two years, the
number of degrees awarded has more than
doubled from four to nine!
Department Goals: › The communication studies department will
continue to promote the recently state approved
AA-T in Communication Studies, and to continue to
monitor the number of degrees awarded.
› We look forward to continuing to host our annual
speech and debate tournament.
Challenges & Opportunities: › ACCESS and STUDENT SUCCESS will be
jeopardized if the communication studies
department continues to function with four FTF,
and seven adjunct faculty, but with an FTEF load
equivalent to nine FTEF.
› We are not capable of fully accommodating our
students at peak offering times.
› The department is concerned about being able
to maintain student success with only four FT
faculty while having load for nine, and is becoming
apparent in the slight decline demonstrated in
our success rates. This semester (Fall 2015), the
department experienced a challenge staffing all
of our sections. For the first time in the past 15
years, each FT faculty member in the department
agreed to teach an over/overload (one section
over the overload limit) to avoid cancelling classes.
One FT faculty member over extended themselves
taking on two sections over our limit. We are losing
adjunct faculty to FT jobs, and it is making it difficult
for us to staff our classes. This shortage is not
unique to SBVC. Many surrounding communication
studies departments have contacted us, looking for
adjunct faculty, including our sister school CHC.
Individual Data Sheets By Division
ARTS + HUMANITIES DIVISION (INSTRUCTION) (cont.)
San Bernard ino Va l l ey Co l lege / 2017 Comprehens ive Mas te r P lanA.32
2017 Comprehens ive Mas te r P lan Append ix / SBCCD / HMC Arch i tec ts + ALMA St ra teg ies

10-11 11-12 12-13 13-14 14-15
Duplicated Enrollment 2,932 2,725 2,613 2,636 2,760
FTEF 17.80 17.00 17.00 17.40 18.20
WSCH per FTEF 490 478 475 455 452
10-11 11-12 12-13 13-14 14-15
Sections 91 85 85 87 91
% of online enrollment 13% 12% 9% 12% 13%
Degrees awarded* N/A N/A N/A 4 9
Certificates awarded N/A N/A N/A N/A N/A
*A.A.-T Degrees were established in 2013.
San Bernard ino Va l l ey Co l lege / 2017 Comprehens ive Mas te r P lan A.33
2017 Comprehens ive Mas te r P lan Append ix / SBCCD / HMC Arch i tec ts + ALMA St ra teg ies

Individual Data Sheets By Division
ARTS + HUMANITIES DIVISION (INSTRUCTION) (cont.)
COMMUNICATION STUDIES – 2014-2015 (cont.)
Action Plan: › The communication studies department plans to
continue to assess student needs regarding course
offerings in order to continue serving our students
to the best of our ability. We are moving toward a
time of growth, and look forward to expanding our
program. However, the department will continue
to remain concerned about being able to maintain
student success with only four FT faculty while
having load for nine. Our department is committed
to continue advertising the AA-T in Communication
Studies, helping students succeed in their
educational and career goals.We will continue to
distribute brochures to help inform students of
our department offerings and the Communication
Studies AA-T degree.
San Bernard ino Va l l ey Co l lege / 2017 Comprehens ive Mas te r P lanA.34
2017 Comprehens ive Mas te r P lan Append ix / SBCCD / HMC Arch i tec ts + ALMA St ra teg ies
San Bernard ino Va l l ey Co l lege / 2017 Comprehens ive Mas te r P lan A.35
2017 Comprehens ive Mas te r P lan Append ix / SBCCD / HMC Arch i tec ts + ALMA St ra teg ies

DANCE – 2014-2015
Description: › Dance is one of the most rewarding of all human
endeavors and the dance faculty and students in
the department share a deep love for their art and
a common desire to achieve excellence in it. The
curriculum provides basic preparation for further
study in dance at the community or university
level. It is the goal of the dance department to help
students to develop their dance potential to the
highest possible level.
Assessment: › The dance program has experienced a modest
increase in FTES this year.
› Our duplicated enrollment increased by 10%
while our productivity dropped significantly from a
previous high of 551 as we continue to struggle to
find a “home” for our dance program.
› The low success rate stayed at 63 and along
with the lower productivity rate the search for a
permanent home is clearly reflected in the numbers!
› Since being dislocated from the Auditorium we
have been in a temporary home, in the gym, for a
number of years.
› A dance studio, or some form of permanence, is
obviously required to maximize both the dance and
theater programs.
Department Goals: › We still hope to add ballet to our offerings utilizing
and exceptional instructor already teaching for
us in other classes. We are still struggling to offer
additional sections in other areas of dance. Our
performances are very well attended and class
sizes (depending upon the faculty) are growing
because of the increased size of the facility
provided. We reiterate from last year’s statement,
“The floor of the gym is NOT adequate for any
dance requiring leaps of any kind!”
Challenges & Opportunities: › The largest challenge facing the department
is the resulting loss of dedicated space in the
auditorium’s renovation. The program, as stated in
years past, requires a permanent dance studio, of
appropriate space and with an appropriate, SAFE
floor!
› The department has experienced a significant
drop in success rates since the loss of their facility.
Students are NOT in an educationally appropriate
environment in their temporary home in the gym,
with classes offered only when the PE department
is not using it (early morning). The dance program
is most desirous of expanding offerings and
improving access to alternative days and times.
› The dance program collaborated with the theater
department this year with the very successful
production of “Into the Woods.”
Action Plan: › The dance program will continue to grow with the
expansion of sections and an appropriate facility
is identified. Additional disciplines are necessary
(ballet, tap, ballroom etc.)
› The dance program (with the full backing of the
performing arts department) is in negotiation with
the PE department to find a permanent “home” in
the yet to be completed new PE facility. While they
continue to meet with resistance, they continue to
“press on” with their struggle to find a “home!”
› The department will continue to collaborate with
theatre and music in support of its educational
philosophy, featuring dance as a performance art
form.
Individual Data Sheets By Division
ARTS + HUMANITIES DIVISION (INSTRUCTION) (cont.)
San Bernard ino Va l l ey Co l lege / 2017 Comprehens ive Mas te r P lanA.36
2017 Comprehens ive Mas te r P lan Append ix / SBCCD / HMC Arch i tec ts + ALMA St ra teg ies

10-11 11-12 12-13 13-14 14-15
Duplicated Enrollment 128 61 72 105 115
FTEF 1.16 1.00 1.16 1.14 1.63
WSCH per FTEF 707 378 367 551 395
10-11 11-12 12-13 13-14 14-15
Sections 10 5 8 8 19
% of online enrollment 0% 0% 0% 0% 0%
Degrees awarded N/A N/A N/A N/A N/A
Certificates awarded N/A N/A N/A N/A N/A
San Bernard ino Va l l ey Co l lege / 2017 Comprehens ive Mas te r P lan A.37
2017 Comprehens ive Mas te r P lan Append ix / SBCCD / HMC Arch i tec ts + ALMA St ra teg ies

ENGLISH – 2014-2015
Description: › The SBVC English Department offers a
comprehensive program of classes designed to
help students improve literacy levels and study
skills. Our courses are designed for transfer
students, students seeking an AA Degree or Career
Certificate, basic skills students, AA-T English
Degree majors, and ESL students. Our courses
are designed to foster practical and academic
writing, critical thinking, comprehension skills, and
communication skills.
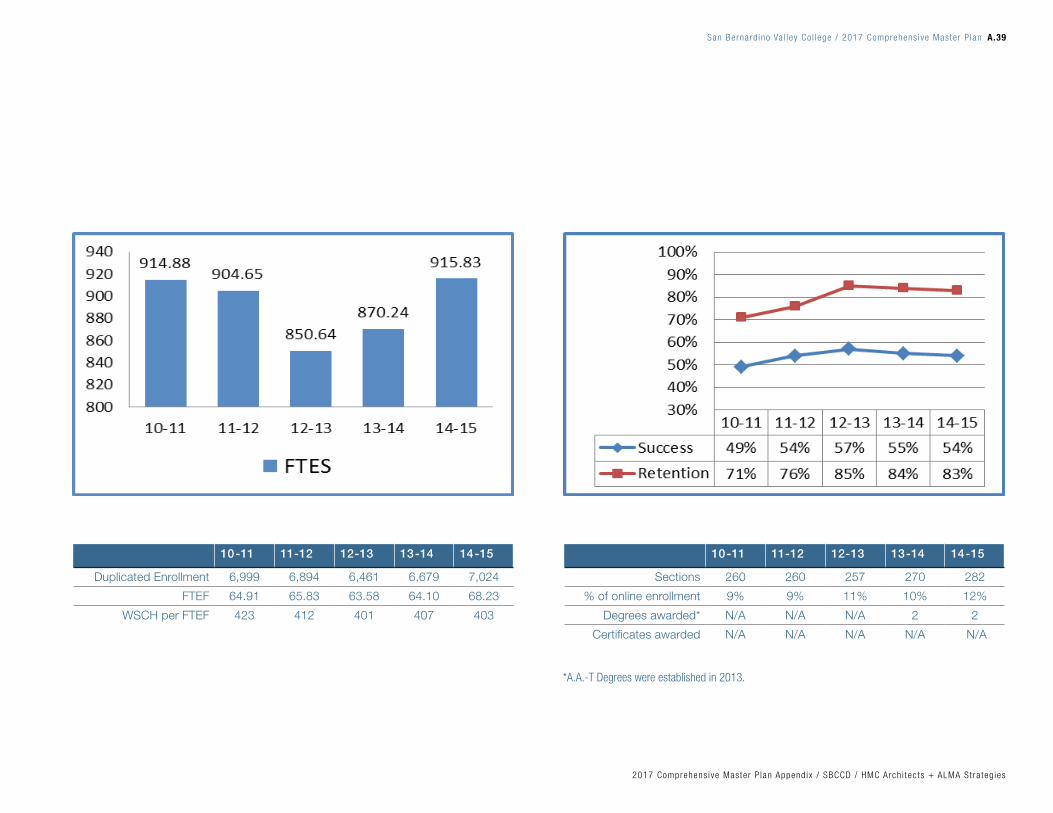
Assessment: › The increase in FTES corresponds student demand
and with the increase in the number of sections
over the past 3 semesters. A byproduct of increase
sections is that we are adding fewer students over
cap, so class sizes are slightly smaller which might
account for the statistically insignificant change in
WSCH. It is expected that the department WSCH
will always be lower than the college norm due to
contractually set class caps the WSCH formula
does not consider.
› Success and retention rates remain constant
despite significant changes and with increased
sections and FTES but not FT faculty, and a
culture of continual improvement to curriculum,
SLOs, and 015 rubric, classes and final exam. The
number of online sections is in line with department
pedagogical philosophy. Since the 2013 state
approval of our AA-T Degree, 4 students have been
awarded the degree, which we expect to increase
in the next two years.
Department Goals: › Hire three full-time, tenured faculty to maintain a
complete program and to accommodate higher
FTES and more sections.
› Maintain & promote AA-T English Degree.
› Continue to offer literature classes to support the
AA-T Degree, even if lower than cap.
› Mentor English Majors by assigning FT Faculty
advisors to help increase student success.
› Maintain on-going SLO assessment.
› Increase use of the writing center by students from
classes other than English.
› Create a Bb community for part-time English
faculty.
› Investigate the possibility of pre-assessment or
post-assessment workshops to help improve
accuracy of placement.
› Create English major alumni network to strengthen
resources for current English majors.
› Explore avenues with related departments to
further align curriculum and support students.
› Explore different patterns of course offerings
(linked, accelerated) to further improve access and
student success.
› Seek $70-$75k continual funding for the writing
center.
› Find and implement reliable assessment tests for
ESL and for non-credit.
› Establish student enrichment programs.
› Establish a college-wide minimum standard for
written work of college-level courses by creating a
faculty writing handbook.
› Maintain active involvement in the decision process
for the college’s Learning Management System,
Canvas or Blackboard.
› Investigate and participate in upcoming changes to
assessment tools.
› Investigation of, training in, and evaluation of the
systems and regulations of the Online Education
Initiative and how it might affect the AA-T English
Degree.
› Work with the counseling department to hire and
train two full-time counselors to maintain and grow
the Puente Program in accordance with all state
Puente Program requirements.
Individual Data Sheets By Division
ARTS + HUMANITIES DIVISION (INSTRUCTION) (cont.)
San Bernard ino Va l l ey Co l lege / 2017 Comprehens ive Mas te r P lanA.38
2017 Comprehens ive Mas te r P lan Append ix / SBCCD / HMC Arch i tec ts + ALMA St ra teg ies
10-11 11-12 12-13 13-14 14-15
Duplicated Enrollment 6,999 6,894 6,461 6,679 7,024
FTEF 64.91 65.83 63.58 64.10 68.23
WSCH per FTEF 423 412 401 407 403
*A.A.-T Degrees were established in 2013.
10-11 11-12 12-13 13-14 14-15
Sections 260 260 257 270 282
% of online enrollment 9% 9% 11% 10% 12%
Degrees awarded* N/A N/A N/A 2 2
Certificates awarded N/A N/A N/A N/A N/A
San Bernard ino Va l l ey Co l lege / 2017 Comprehens ive Mas te r P lan A.39
2017 Comprehens ive Mas te r P lan Append ix / SBCCD / HMC Arch i tec ts + ALMA St ra teg ies

ENGLISH – 2014-2015 (cont.)
› Continue to monitor, evaluate, and revise the 015
curriculum and exam.
› Expand the ESL program.
Challenges: › There are not enough classrooms to accommodate
growth.
› Efficiency of scheduling rooms and times, which
could be solved if the college used the software
purchased years ago for this purpose.
› Maintaining effective and efficient communication
on important discipline-specific information and
curriculum changes is a challenge with 41+ part-
time faculty members. This number will be higher
by SP16.
› The increasing number classes taught by part-
time faculty and the college goal of growth further
emphasize the need for full-time faculty.
› Upcoming retirement of full-time faculty.
› Continue to offer literature classes to meet
AA-T English Degree requirements and improve
completion time for students.
› Assessment test accuracy continues to be a
challenge. New state assessment system will need
to be studied as information is available.
› Many changes will be needed with the new LMS
systems, once chosen.
› Increase the number of 101 and 102 sections
offered.
Opportunities: › Fostering a relationship with Student Services
through SSSP is an opportunity to improve student
equity and success and to grow the Puente
Program in compliance with all state requirements.
› Due to AA-T degree, there is an opportunity to
create more coherent learning community of
English majors, increasing their success, lessening
their time to graduation, and increasing their
transfer opportunities.
Action Plan: › Hire at least three full-time, tenured faculty to
maintain current program and meet the college’s
goal of growth.
› Host workshops and open houses for English
majors.
› Create SLO sub-committees.
› Create Bb community for PT faculty.
› Identify English faculty to serve on committees that
will be studying and reviewing the Blackboard and
Individual Data Sheets By Division
ARTS + HUMANITIES DIVISION (INSTRUCTION) (cont.)
Canvas Learning Management Systems and the
Online Education Initiative as well as new LMS.
› Create mentor program for English Majors.
› Continue to provide regular college-wide,
multi-cultural movie, book, lecture, and other
presentations to provide students with enrichment
and enhance campus climate.
› Establish a subcommittee to research, draft, print,
and distribute a faculty writing handbook.
› Work with the counseling department to hire and
train two full-time counselors to maintain and grow
the Puente Program in accordance with all state
Puente Program requirements.
San Bernard ino Va l l ey Co l lege / 2017 Comprehens ive Mas te r P lanA.40
2017 Comprehens ive Mas te r P lan Append ix / SBCCD / HMC Arch i tec ts + ALMA St ra teg ies

San Bernard ino Va l l ey Co l lege / 2017 Comprehens ive Mas te r P lan A.41
2017 Comprehens ive Mas te r P lan Append ix / SBCCD / HMC Arch i tec ts + ALMA St ra teg ies
MODERN LANGUAGES – 2014-2015
Description: › The modern languages department offers a range
of beginning, intermediate, and advanced Spanish,
French, Arabic and ASL courses for non-native
and native speakers. The goal for non-native
speakers is to learn these languages for personal
or professional reasons, and/or to meet foreign
language degree requirements. The goal for native
speakers is to improve their reading, writing,
listening and speaking skills. All transfer level
courses are articulated with CSU/UC system
Assessment: › FTES increased gradually during 10-11; however,
11-12 and 12-13 FTES decreased significantly due
to budget constraints that forced the MLD to offer
fewer sections. 13-14 and 14-15 saw an increase
in FTES as the budget allowed for more sections.
› The WSCH decreased from 519 in 10-11 to 486
in 14-15 as we transitioned to the new full time
ASL instructor in 2014, and one of our FT Spanish
Instructors had a reassignment. In addition, we
added Honor courses with a cap of 35 that were
low enrolled, and we added less students over the
cap.
› Pass rates increased gradually but returned to
72% in 14-15 as financial aid changes forced
some students to complete 60% of their courses
even if they failed such courses. This explains why
retention levels increased from 82% in 10-11 to
88% in 14-15.
Department Goals: › Review and update transferability requirements for
Spanish 157 to articulate with UC/CSU.
› Continue to expand online and Honors courses
(SPA 103, SPA 101 (H)/SPA 102 (H), ASL 109/110).
› Improve student pass rates for all MLD courses.
› Expand partnerships with community
organizations/Student Services to improve MLD
visibility.
› Continue to support the Spanish and ASL clubs.
› Revise ASL SLOs to reflect course expectations.
Challenges & Opportunities: Review + update
› Take the opportunity during content review to revise
and adopt uniform textbooks for ASL 109/110.
› Find ways to reinstitute a study abroad program.
› Create a more comprehensive language program to
offer intermediate courses (SPA 104), to continue
offering beginning Arabic courses.
› Continue to expand online language offerings
without reducing the number of on-campus
classes.
Action Plan: Review + update
› Create Spanish 156 as a prerequisite for 157
in Curricunet and update/revise Spa 157 to be
accepted as a transfer course at the state level.
› Create ASL 109 (H) course.
› Refer students to Student Success center as well
as SI program.
› Continue to outreach and participate in community
events.
› MLD faculty continue to serve as advisors to SPA/
ASL clubs.
› ASL faculty will meet to discuss, review and revise
ASL SLOs.
Individual Data Sheets By Division
ARTS + HUMANITIES DIVISION (INSTRUCTION) (cont.)
San Bernard ino Va l l ey Co l lege / 2017 Comprehens ive Mas te r P lanA.42
2017 Comprehens ive Mas te r P lan Append ix / SBCCD / HMC Arch i tec ts + ALMA St ra teg ies

10-11 11-12 12-13 13-14 14-15
Duplicated Enrollment 1,993 1,755 1,677 1,879 2,012
FTEF 17.75 15.48 15.47 18.06 19.33
WSCH per FTEF 519 524 517 487 486
10-11 11-12 12-13 13-14 14-15
Sections 59 51 52 59 63
% of online enrollment 9% 16% 14% 9% 11%
Degrees awarded N/A N/A N/A N/A N/A
Certificates awarded N/A N/A N/A N/A N/A
San Bernard ino Va l l ey Co l lege / 2017 Comprehens ive Mas te r P lan A.43
2017 Comprehens ive Mas te r P lan Append ix / SBCCD / HMC Arch i tec ts + ALMA St ra teg ies

MUSIC – 2014-2015
Description: › The faculty and students in the music department
share a deep love for their art and a common
desire to achieve excellence. The curriculum
provides preparation for careers in music while
also preparing student for further study at
four-year institutions. The department offers a
balanced education within a multi-faceted musical
experience. It is the goal of the department to help
students develop their musical and intellectual
potential to each student’s highest possible level.
Assessment: › The figure (14-15) represents a significant drop of
nearly 30 FTES from the previous year of 2013-
2014.
› The loss of FTES can be quite clearly seen in our
“performance classes”. This very significant drop
in our performance classes is directly attributable
to the state’s emphasis on students “getting in and
getting out” as quickly as possible!
› While our academic classes meet certain
fundamental requirements, our performance
classes do not fulfill the same requirements.
Hence, students that are NOT music majors (or are
minoring in music) are being told that financial aid
is reluctant to pay for such classes and that only
classes on their Ed plan will be covered.
› Success and retention rates have remained the
same while our need for additional full-time faculty
has grown to 5.56.
Department Goals: › Continue to increase the number of music majors
and degrees awarded.
› Continue toward implementation of the new TMC
degree (AA-T Music)
› Significantly increase the number of students
enrolled in “performance classes.”
Challenges & Opportunities: › One of the challenges to our department is the
load and responsibility of leading nine adjunct
professors, sculpting a program, maintaining a
music major emphasis in a time of diminishing class
size (in our performance classes) while growing
the performance level of choral, opera and vocal
studies. It is overwhelming without (full–time) faculty
participation.
› A successful performance program requires a full-
time faculty member to manage school concerts,
contracts and a burgeoning schedule of community
performances.
› In order to have a fully developed music major
program another full-time faculty member, equally
dedicated to theory, appreciation, world-music and
history classes and curriculua is needed!
› This year an increasing number of “outreach”
performances, community performances college
performances and faculty concerts are proving
to generate a substantial increasing number of
interested students in our performance classes!
Action Plan: › Increase the number of music majors
› Increase communication with counseling regarding
career paths in music
› Present additional concerts in K-12 (Urbita School,
Richardson Prep, Middle College/High School,
Colton High etc.
› Further engage part time in the evaluation of SLO
data.
Individual Data Sheets By Division
ARTS + HUMANITIES DIVISION (INSTRUCTION) (cont.)
San Bernard ino Va l l ey Co l lege / 2017 Comprehens ive Mas te r P lanA.44
2017 Comprehens ive Mas te r P lan Append ix / SBCCD / HMC Arch i tec ts + ALMA St ra teg ies

10-11 11-12 12-13 13-14 14-15
Duplicated Enrollment 1,588 1,424 1,313 1,312 1,127
FTEF 9.14 9.23 8.76 9.58 11.12
WSCH per FTEF 611 585 517 523 373
10-11 11-12 12-13 13-14 14-15
Sections 57 53 50 55 75
% of online enrollment 0% 0% 0% 6% 8%
Degrees awarded 0 0 0 0 2
Certificates awarded N/A N/A N/A N/A N/A
San Bernard ino Va l l ey Co l lege / 2017 Comprehens ive Mas te r P lan A.45
2017 Comprehens ive Mas te r P lan Append ix / SBCCD / HMC Arch i tec ts + ALMA St ra teg ies

READING + STUDY SKILLS – 2014-2015
Description: › The reading and study skills department
offers courses designed to improve reading
comprehension, vocabulary development, and
study skills. The department prepares students
for success in college-level courses. Prior to
beginning the English composition remediation
sequence, some entering students are placed in
developmental reading classes, based on their
individual assessment scores. In addition to the
basic skills reading series, the department offers
two college-level reading courses: READ 100,
Academic Reading, a course designed for students
who want to improve academic reading; and READ
102, Critical Reading for Critical Thinking, which
meets the CSU “critical thinking” requirement, GE
Breadth A3.
Assessment: › Enrollment has increased from 1,043 in 10-11 to
1,326 in 14-15.
› FTEF has also increased from 12.70 in 10-11 to
18.40 in 14-15.
› WSCH/FTEF has decreased from 469 in 10-11 to
416 in 14-15
› Retention has increased from 82% in 10-11 to 90%
in 14-15
› Success rate has increased from 47% in 10-11 to
69% in 14-15
› Sections have increased from 39 in 10-11 to 56 in
14-15
› The department has load for nine (9) full-time
faculty, but functions with four (4) full-time faculty
› Online sections have increased from 8% in 10-11
to 16% in 14-15
Department Goals: › Increase the number of sections offered in both
developmental and college-level reading classes.
› Analyze the success and retention rates of
accelerated courses and accelerated-learning
cohorts to determine future alternative scheduling
options.
› Strengthen reading and study skills curriculum
and instruction to better prepare students for
the 1st class in the English composition remedial
sequence: ENGL 914.
› Improve student success and retention rates
across disciplinary-specific reading.
› Renew commitment to providing quality curriculum
and instruction across the full span of adult
literacy: pre-primer-level to college-level reading
comprehension, disciplinary-specific vocabulary,
and critical thinking skills.
Challenges & Opportunities: › With the anticipated implementation of statewide,
common assessment for CCC’s, the department
may need to add more courses across its remedial
sequence to meet the needs of students who
assess into 920, 950, and 015.
› Since 2010, the department continues to operate
its reading lab without a computerized, diagnostic,
prescriptive, adaptive reading intervention program.
› There is a need for a dept. common pretest,
posttest & final exam for all courses preceding
ENGL 914.
› There is limited reading lab space to schedule lab
classes.
› Receive reading lab technology support through
SSSP funding.
Action Plan: › Offer a variety of classes: morning, afternoon,
evening, weekend, online, hybrid, late-start, and
full-term.
› Implement new technology in the reading lab.
› Practice strategies to improve success and
retention rates.
› Launch 1, new reading course designed to
address the instructional needs of students who
require remediation in phonemic awareness and
syllabication, and to also serve as a prerequisite for
Individual Data Sheets By Division
ARTS + HUMANITIES DIVISION (INSTRUCTION) (cont.)
San Bernard ino Va l l ey Co l lege / 2017 Comprehens ive Mas te r P lanA.46
2017 Comprehens ive Mas te r P lan Append ix / SBCCD / HMC Arch i tec ts + ALMA St ra teg ies

10-11 11-12 12-13 13-14 14-15
Duplicated Enrollment 1,043 1,183 1,150 1,255 1,326
FTEF 12.70 15.08 15.62 17.53 18.40
WSCH per FTEF 469 452 407 390 416
10-11 11-12 12-13 13-14 14-15
Sections 39 46 48 53 56
% of online enrollment 8% 20% 17% 15% 16%
Degrees awarded N/A N/A N/A N/A N/A
Certificates awarded N/A N/A N/A N/A N/A
READ 920, Reading Skills I.
› Commit to offering a range of courses to improve
adult literacy, from pre-primer-level to college-level
reading abilities.
› Improve the department’s WSCH per FTEF ratio.
San Bernard ino Va l l ey Co l lege / 2017 Comprehens ive Mas te r P lan A.47
2017 Comprehens ive Mas te r P lan Append ix / SBCCD / HMC Arch i tec ts + ALMA St ra teg ies

RADIO, TELEVISION & FILM – 2014-2015
Description: › The RTVF department offers a comprehensive
instructional program in radio and television
broadcasting, digital film production, and digital
audio and video production. The department
provides a two-year curriculum for students
majoring in the field resulting in the Associate of
Arts Degree and/or transfer to a four-year institution
and provides elective courses for students
interested in related fields such as marketing,
journalism, theater arts, and multimedia. Students
may opt for 21-unit certificates in radio, television,
film, or RTVF. The instructional program includes
internships at local stations and businesses, on-air
experience using the facilities of the student radio
or TV station and public television station KVCR-TV,
which is licensed to the San Bernardino Community
College District.
Assessment: › While our FTES dropped in 14-15 from a high in
13-14, it remains above all previous years.
› Our WSCH per FTEF remains in the mid to high
300s. Our retention rates remain in the low 90
percent, and our success rate continues to rise
slowly from a low of 66% to a current 75%.
› In spring 2015 we awarded ten degrees and two
certificates. The IEMA (Media Academy) is offering
the fourth annual student film festival, provided
internships to students who have produced
numerous projects for KVCR-TV and departments
around campus and offers students the opportunity
to run student television and radio stations.
› With stacked classes and only one full time faculty
member, we serve a unique population of students
interested in a career in radio, television, and/or
film.
Department Goals: › Our first priority is to continue the rise in student
success and maintain or increase our retention
rates. Our second priority is to encourage student
completion of degrees and/or certificates.
› Our next goal is to get the adjunct faculty teaching
video editing as a certified Avid instructor and
review curriculum for RTVF 131 and 232 to match
the Avid curriculum for certification as an Avid User
(RTVF 131) and an Avid Professional (RTVF 232).
› Despite the decrease in enrollments, our number of
degrees is a record for the department—our goal
is to encourage more students to complete their
degrees or certificates and maintain this rate of
increase in degrees.
Challenges & Opportunities: › In spring 2014, the RTVF department received
a $25k grant to partner with Chaffey College’s
television/film program to increase the number of
programs produced by students for KVCR.
› In fall 2015, the RTVF Department received a $5k
grant to work with AQMD for students to produce
a promotional video for AQMD regarding the Inland
Empire air quality.
› SBVC administration provided funding for student
interns to produce videos for the counseling
department.
› The RTVF Department and the IEMA continue to
work with Rialto Police to develop a series on cold
case murders for KVCR-TV. Two projects have
already been completed.
Action Plan: › Design and purchase a set background with the
CTE grant.
› Get editing instructor Avid-certified.
› Rewrite curriculum for RTVF 131 and 232 to match
the Avid curriculum for certification as an Avid User
(RTVF 131) and an Avid Professional (RTVF 232).
› Continue to pursue grant opportunities for the
Individual Data Sheets By Division
ARTS + HUMANITIES DIVISION (INSTRUCTION) (cont.)
San Bernard ino Va l l ey Co l lege / 2017 Comprehens ive Mas te r P lanA.48
2017 Comprehens ive Mas te r P lan Append ix / SBCCD / HMC Arch i tec ts + ALMA St ra teg ies
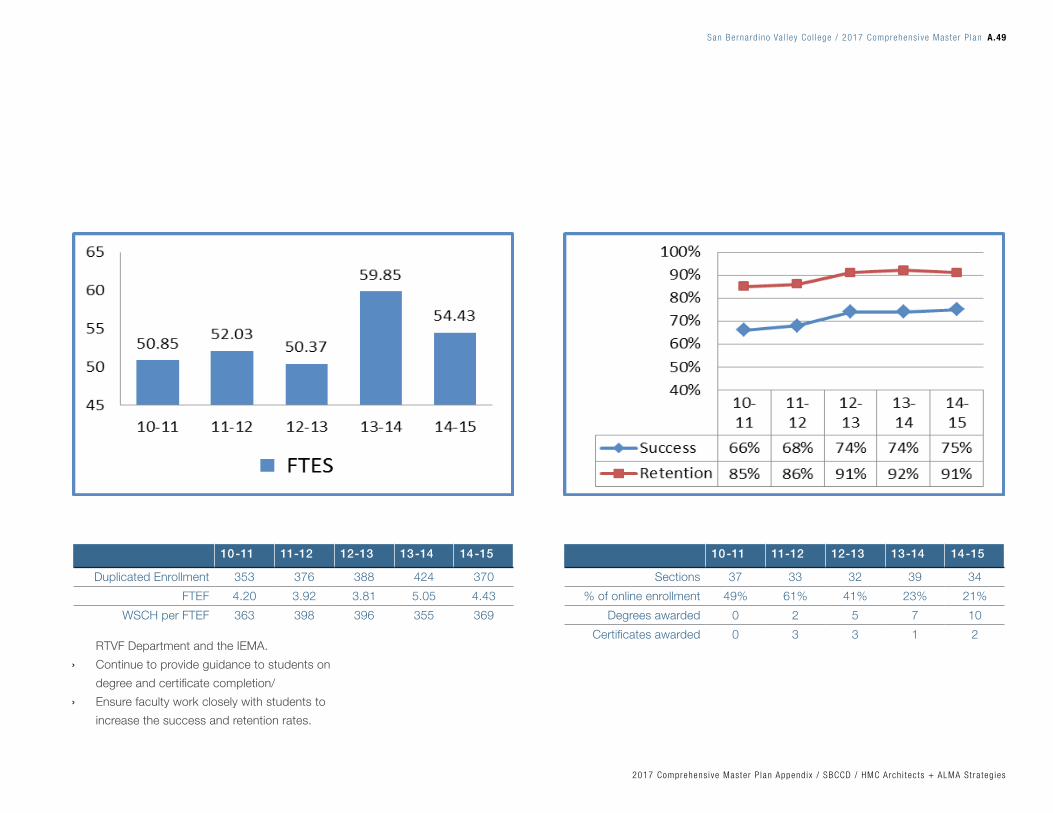
10-11 11-12 12-13 13-14 14-15
Duplicated Enrollment 353 376 388 424 370
FTEF 4.20 3.92 3.81 5.05 4.43
WSCH per FTEF 363 398 396 355 369
10-11 11-12 12-13 13-14 14-15
Sections 37 33 32 39 34
% of online enrollment 49% 61% 41% 23% 21%
Degrees awarded 0 2 5 7 10
Certificates awarded 0 3 3 1 2RTVF Department and the IEMA.
› Continue to provide guidance to students on
degree and certificate completion/
› Ensure faculty work closely with students to
increase the success and retention rates.
San Bernard ino Va l l ey Co l lege / 2017 Comprehens ive Mas te r P lan A.49
2017 Comprehens ive Mas te r P lan Append ix / SBCCD / HMC Arch i tec ts + ALMA St ra teg ies

SPANISH – 2014-2015
Description:
Assessment:
Department Goals:
Challenges & Opportunities:
Action Plan:
Individual Data Sheets By Division
ARTS + HUMANITIES DIVISION (INSTRUCTION) (cont.)
San Bernard ino Va l l ey Co l lege / 2017 Comprehens ive Mas te r P lanA.50
2017 Comprehens ive Mas te r P lan Append ix / SBCCD / HMC Arch i tec ts + ALMA St ra teg ies

10-11 11-12 12-13 13-14 14-15
Duplicated Enrollment 1,244 1,122 1,094 1,197 1,262
FTEF 11.69 10.89 10.70 11.92 12.92
WSCH per FTEF 527 527 521 499 486
10-11 11-12 12-13 13-14 14-15
Sections 37 34 35 37 40
% of online enrollment 14% 24% 20% 14% 18%
Degrees awarded N/A N/A N/A N/A N/A
Certificates awarded N/A N/A N/A N/A N/A
San Bernard ino Va l l ey Co l lege / 2017 Comprehens ive Mas te r P lan A.51
2017 Comprehens ive Mas te r P lan Append ix / SBCCD / HMC Arch i tec ts + ALMA St ra teg ies

THEATER ARTS – 2014-2015
Description: › Theatre arts is the study of human expression
which culminates in live performance. The play
is the medium used to tell a story performed by
actors. Theatre arts includes the study of the
literature and related disciplines and technologies
required for performances. The department
coordinates several student performances each
year.
Assessment: › The theatre arts department experienced a
decrease in enrollment during the 2014-2015
academic year. The decrease was due, in part, to
the decrease in sections offered. Also, students
report being steered away from performing arts
classes by the counseling department when
developing educational plans. The success and
retention rates also experienced a slight decrease.
Department Goals: › The department:
› strives to offer high quality theatre productions,
in terms of experience and outcome.
› will continue to offer a variety of productions
to the community including drama, comedy,
musical theatre, etc.
› will seek out opportunities to increase
exposure and recognition for the theatre arts
students, the department, and the college.
› will continue to explore marketing strategies to
increase audience size.
› will continue to re-establish itself in the
auditorium and rebuild the student and
audience base.
› continue to integrate online offerings into the
curriculum to serve a larger, more diverse
population.
Challenges & Opportunities: › The SBVC theatre arts department entered
productions of Romeo & Juliet and Into the Woods
in the Kennedy Center American College Theatre
Festival. Four SBVC students were nominated for
the Regional Festival in Utah. The nominees and
three acting partners competed in Utah in February
2015, with one of our students winning the Critic
Competition for the entire Region VIII.
› Three Into the Woods performers have been
nominated for the Regional Festival in Hawaii in
February 2016.
› The department has entered the fall 2015
production of Completely Hollywood into the
KCACTF.
› The theatre arts department worked with
other departments across campus for artistic
collaboration and space utilization.
› SBVC theatre created a partnership with Redlands
Theatre Festival. SBVC Theatre students performed
improv as part of the RTF 2015 summer season.
› SBVC acting students performed at local high
schools.
› SBVC theatre students attended several tapings of
Let’s Make a Deal as a KCACTF fundraising effort.
› The department defined its identity and mission
with the creation of a logo/motto.
› One theatre technician position was increased to
full time.
› The creation of the theatre arts transfer degree
requires a higher level commitment to the technical
theatre courses and lab experience.
› The renovation removed the office space for theatre
faculty and technical staff from the auditorium. This
creates difficulties for staff and students in terms of
communication, efficiency, and safety.
› The renovation removed the dance studio from the
auditorium which leaves the dance classes without
Individual Data Sheets By Division
ARTS + HUMANITIES DIVISION (INSTRUCTION) (cont.)
San Bernard ino Va l l ey Co l lege / 2017 Comprehens ive Mas te r P lanA.52
2017 Comprehens ive Mas te r P lan Append ix / SBCCD / HMC Arch i tec ts + ALMA St ra teg ies

10-11 11-12 12-13 13-14 14-15
Duplicated Enrollment 371 338 398 447 389
FTEF 3.64 2.38 3.44 4.35 4.43
WSCH per FTEF 469 564 552 472 401
10-11 11-12 12-13 13-14 14-15
Sections 15 13 14 18 17
% of online enrollment 0% 0% 0% 6% 6%
Degrees awarded N/A N/A N/A N/A N/A
Certificates awarded N/A N/A N/A N/A N/A
San Bernard ino Va l l ey Co l lege / 2017 Comprehens ive Mas te r P lan A.53
2017 Comprehens ive Mas te r P lan Append ix / SBCCD / HMC Arch i tec ts + ALMA St ra teg ies

Individual Data Sheets By Division
ARTS + HUMANITIES DIVISION (INSTRUCTION) (cont.)
THEATER ARTS – 2014-2015 (cont.)
a facility and makes collaboration more difficult.
› The technical theatre staff are assisting with events
across campus, spreading their time thinly.
Action Plan: › Return the faculty and theatre tech offices to the
auditorium.
› Create selected topics courses to allow the
department to offer courses on current topics in the
field.
› The department will work with the SBVC
Foundation and other campus groups to raise
funds to support KCACTF participants.
› Promote theatre in the inland empire by connecting
with students in the K-12 schools.
› Promote SBVC theatre students, the department,
and the college by entering SBVC productions into
the Kennedy Center American College Theatre
Festival and the Inland Theatre League competition.
› Establish and maintain connections with local
theatre groups.
› Promote the arts on campus by supporting the
SBVC performing arts club.
San Bernard ino Va l l ey Co l lege / 2017 Comprehens ive Mas te r P lanA.54
2017 Comprehens ive Mas te r P lan Append ix / SBCCD / HMC Arch i tec ts + ALMA St ra teg ies

San Bernard ino Va l l ey Co l lege / 2017 Comprehens ive Mas te r P lan A.55
2017 Comprehens ive Mas te r P lan Append ix / SBCCD / HMC Arch i tec ts + ALMA St ra teg ies

Individual Data Sheets By Division
MATHEMATICS, BUSINESS + COMPUTER TECHNOLOGY DIVISION (INSTRUCTION)ACCOUNTING – 2014-2015
Description: › We offer high quality accounting programs which
will prepare our students for successful careers in
business and government. We provide students
with a broad based understanding of the concepts
of the accounting field. The courses offered satisfy
transfer requirements and/or offer the specialized
training required by the industry for successful
employment.
Assessment: › We experienced a 12% increase in FTES as a result
of increased course offerings.
› We were able to add four additional courses this
year (total 34 sections).
› Our online enrollment increased by 24%.
› Our success and retention rates remain strong
at 58% and 82% respectively. In addition, we
awarded 3% more degrees.
› Certificates awarded decreased by 46%, most
likely due to the changes in education requirements
for the profession, which include required additional
units to become licensed.
› The additional online course offerings were a
leading factor in the increased FTES.
Department Goals: › Increase the accounting offerings to meet
community needs.
› Continue to evaluate the accounting programs
for possible re-configuration to meet the needs of
students
› Continue to increase the use of technology to
improve learning skills.
› Develop materials for accounting ethics.
› Strengthen the accounting program through
strategic allocation of funds, development of
community connections, and recruitment in the
local communities
Challenges & Opportunities: › The budget crisis in California has caused the
district to be more frugal with funds. We will
continue to reevaluating our course offerings
to increase efficiency and effectiveness in all
accounting courses.
› Our biggest challenge is staffing classes. We have
one full-time faculty member—a CPA. We have
continued to search for qualified adjunct instructors
who can teach during the day and evening. This
has proved close to impossible. Fortunately, we
were just awarded an accounting position and are
in the early stages of the recruiting process
Action Plan: › Continue to develop new course/program offerings
or improve existing courses as recommended by
the community advisory board.
› Continue to increase the course offerings
› Continue to assess the accounting SLO’s at both
the program and course level.
› Develop a plan to communicate current information
about careers in accounting to students.
San Bernard ino Va l l ey Co l lege / 2017 Comprehens ive Mas te r P lanA.56
2017 Comprehens ive Mas te r P lan Append ix / SBCCD / HMC Arch i tec ts + ALMA St ra teg ies

10-11 11-12 12-13 13-14 14-15
Duplicated Enrollment 1,166 1,008 935 1,025 1,142
FTEF 7.52 6.45 6.52 7.14 8.01
WSCH per FTEF 548 557 519 514 513
10-11 11-12 12-13 13-14 14-15
Sections 32 28 28 30 34
% of online enrollment 31% 43% 38% 50% 62%
Degrees awarded 6 12 23 29 30
Certificates awarded 7 8 11 28 15
Award Source: http://datamart.cccco.edu/Outcomes/Program_Awards.aspx
TOP Code: 050200
San Bernard ino Va l l ey Co l lege / 2017 Comprehens ive Mas te r P lan A.57
2017 Comprehens ive Mas te r P lan Append ix / SBCCD / HMC Arch i tec ts + ALMA St ra teg ies

BUSINESS ADMINISTRATION – 2014-2015
Description: › We inspire our students to pursue productive
careers in the business world. We provide them
with high-quality learning opportunities in business
and business related topics. The program serves
students pursuing transfer, certificate, and skill
upgrade objectives—both from a hard skills and
soft skills perspective. The program offers an AA
and AA-T degree in business administration. The
program also offers certificates of achievement in
business administration, retail management and
management/leadership.
Assessment: › As a result of unemployment (reported August
2014) being at 8.7%, many employees are
returning to school to better there odds of
employment.
› Local employers are requiring employees to further
education for personal/business growth.
› Through continual efforts to offer distributed
education (hybrid and/or online), community
involvement and counseling (on campus and local
universities), our efforts have continued to garner a
34% growth in degrees/certificates awarded.
› The success rate has dipped slightly—believed
to be a result of more online/hybrid offerings. It
appears that their is a slightly lower rate as a result
on reduced face-to-face contact.
Department Goals: › Continue to increase offerings to meet community
needs.
› Expanding partnerships regionally with employers
and 4-Year academic institutes.
› Explore the potential for re-invigorating the
Business offerings.
› Continue to develop new online and hybrid
courses.
› Continue the use of technology to improve
orientation to learning objectives and the
requirements for success in the overall program.
Challenges & Opportunities: › Though the state budget has loosened up, we have
not been able to add full-time faculty to assist in
this scheduled growth.
› We have evaluated efficiency and effectiveness in
every course within the discipline.
› Similar challenges at transfer institutions force
many students back to community colleges to
complete general education requirements—and
lower level business requirements—increasing
the need for more sections and the importance of
articulation agreements.
› With the increase in demand, modification of
existing certificates and added faculty, we should
see a greater concentrated growth in 2015-16
reportings.
Action Plan: › Create a NEW certificate in Entreprenuership.
› Continue to implement and adjust curriculum
offerings recommended by advisory committee.
› Adjust current certificates to assure quicker
completion for students.
› Expand hybrid and online offerings to assure
growth and proper connection with the community.
› Develop and implement SLO assessment at the
program level.
› Continue to reassess course level SLO’s.
Individual Data Sheets By Division
MATHEMATICS, BUSINESS + COMPUTER TECHNOLOGY DIVISION (INSTRUCTION) (cont.)
San Bernard ino Va l l ey Co l lege / 2017 Comprehens ive Mas te r P lanA.58
2017 Comprehens ive Mas te r P lan Append ix / SBCCD / HMC Arch i tec ts + ALMA St ra teg ies

10-11 11-12 12-13 13-14 14-15
Duplicated Enrollment 1,502 1,198 1,097 1,259 1,265
FTEF 7.00 5.80 5.80 7.20 7.20
WSCH per FTEF 643 620 584 527 525
10-11 11-12 12-13 13-14 14-15
Sections 35 29 29 38 36
% of online enrollment 17% 31% 31% 40% 36%
Degrees awarded 34 48 53 59 78
Certificates awarded 14 13 3 7 8
*A.S.-T Degrees were established in 2013.
TOP Code: 050500
San Bernard ino Va l l ey Co l lege / 2017 Comprehens ive Mas te r P lan A.59
2017 Comprehens ive Mas te r P lan Append ix / SBCCD / HMC Arch i tec ts + ALMA St ra teg ies

COMPUTER INFORMATION TECHNOLOGY – 2014-
2015
Description: › The CIT program serves students needs in three
ways:
› Acquisition of basic through advanced computer
technology skills
› Acquisition of computer skills applicable to current
work requirements
› Preparation for pursuing education in computer
technology at a four-year institution.
Assessment: › There is a 35% drop in FTES between 10-11 and
12-13. This drop is associated with budget cuts to
SBCCD by the State of California.
› The FTES since 12-13 shows a moderate 14%
recovery. The student success and retention is
negatively correlated with FTES. Success and
retention are highest when FTES is lowest (12-13)
and lowest when FTES is highest (10-11).
› There is a 30% increase in the number of degrees
and certificates awarded from 10-11 to 14-15.
Department Goals: › Maintain academic standards of courses
› Promote student academic achievement
› Offer courses that are relevant to local job market
› Maintain hardware and software currency
› Promote SBVC CS and CIT programs to local HS
students
› Enhance transferability and articulation of courses
Challenges: › State approval of degrees and certificates
› Streamlining student completion process
› Book cost and availability at SBVC bookstore.
Opportunities: › Career opportunities created by emerging
technologies
› C-ID AS-T degree
› CSUSB new Information Systems & Technology BS
degree
› Active student club.
Action Plan: › Monitor progress of certificate and degree
approvals
Individual Data Sheets By Division
MATHEMATICS, BUSINESS + COMPUTER TECHNOLOGY DIVISION (INSTRUCTION) (cont.)
› Create an AS degree aligned with new CSUSB
IS&T BS degree
› Expand use of academy models
› Develop outreach and articulation for HS programs
› Develop non-credit CIT program
› Develop non-credit computer lab course.
San Bernard ino Va l l ey Co l lege / 2017 Comprehens ive Mas te r P lanA.60
2017 Comprehens ive Mas te r P lan Append ix / SBCCD / HMC Arch i tec ts + ALMA St ra teg ies
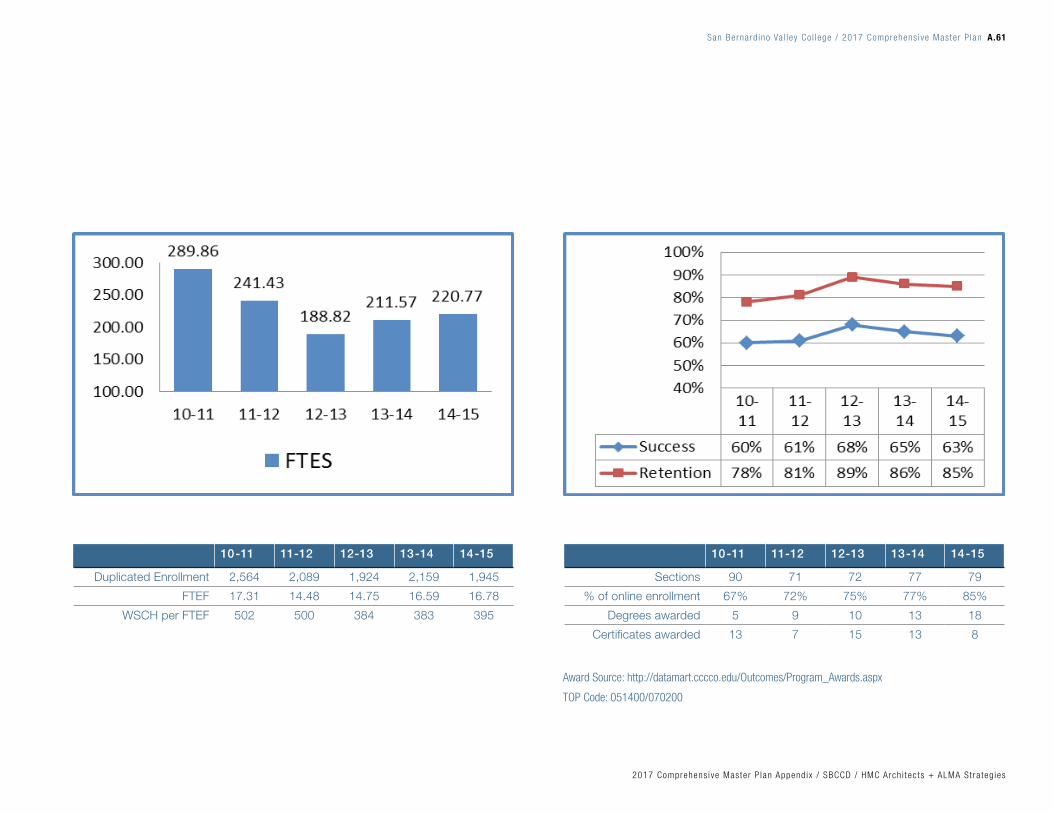
10-11 11-12 12-13 13-14 14-15
Duplicated Enrollment 2,564 2,089 1,924 2,159 1,945
FTEF 17.31 14.48 14.75 16.59 16.78
WSCH per FTEF 502 500 384 383 395
10-11 11-12 12-13 13-14 14-15
Sections 90 71 72 77 79
% of online enrollment 67% 72% 75% 77% 85%
Degrees awarded 5 9 10 13 18
Certificates awarded 13 7 15 13 8
Award Source: http://datamart.cccco.edu/Outcomes/Program_Awards.aspx
TOP Code: 051400/070200
San Bernard ino Va l l ey Co l lege / 2017 Comprehens ive Mas te r P lan A.61
2017 Comprehens ive Mas te r P lan Append ix / SBCCD / HMC Arch i tec ts + ALMA St ra teg ies

COMPUTER SCIENCE – 2014-2015
Description: › The computer science program provides
preparation for students planning to transfer to
a four-year institution, experience in computer
programming for students enrolled in science or
engineering disciplines and academic computer
science preparation for students interested in
pursuing employment after San Bernardino Valley
College
Assessment: › 2014-15 has a remarkable 140% increase in
computer science FTES.
› This is accompanied by a small increase in
retention (81% to 85%) and a small increase in
success (63% to 65%).
› The number of students who complete certificates
and degrees is quite low. The failure of department
efforts to obtain approval of an AS-T degree is
probably associated with this situation.
› The CS AS-T degree is not approved because it
requires too many units at SBVC to complete the
requirements.
Department Goals: › Increase the number of students who earn a CS
degree and certificate.
› Gain approval of the CS AS-T degree.
› Offer a certificate aligned with Microsoft
programming certification(s).
Challenges: › Cancellation of classes due to low enrollment.
› High unit courses required for CS AS-T degree.
› Proliferation of programming languages.
› No game development certificate.
Opportunities: › Virtual Lab
› Microsoft IT Academy
› Growth in FTES
Action Plan: › Advocate for offering low-enrolled classes that
complete degrees and certificates.
› Work through academic senate to address high
unit courses offered by other departments.
› Investigate Microsoft IT Academy membership.
› Investigate game development certificate.
Individual Data Sheets By Division
MATHEMATICS, BUSINESS + COMPUTER TECHNOLOGY DIVISION (INSTRUCTION) (cont.)
San Bernard ino Va l l ey Co l lege / 2017 Comprehens ive Mas te r P lanA.62
2017 Comprehens ive Mas te r P lan Append ix / SBCCD / HMC Arch i tec ts + ALMA St ra teg ies

10-11 11-12 12-13 13-14 14-15
Duplicated Enrollment 185 175 183 191 295
FTEF 2.44 2.10 2.38 2.68 3.98
WSCH per FTEF 417 457 263 241 391
10-11 11-12 12-13 13-14 14-15
Sections 9 8 9 9 13
% of online enrollment 89% 88% 89% 89% 92%
Degrees awarded 0 0 0 1 0
Certificates awarded 0 0 2 1 0
Award Source: http://datamart.cccco.edu/Outcomes/Program_Awards.aspx
TOP Code: 0707XX
San Bernard ino Va l l ey Co l lege / 2017 Comprehens ive Mas te r P lan A.63
2017 Comprehens ive Mas te r P lan Append ix / SBCCD / HMC Arch i tec ts + ALMA St ra teg ies

MATH – 2014-2015
Description: › The department offers courses in mathematics
from arithmetic through differential equations
and linear algebra. Students desiring basic
skills and advanced mathematical methods find
meaningful activities in the math program. Job
opportunities in pure mathematics exist and
even more in education, business, engineering,
nursing, manufacturing, computer technology,
and many other technical fields that rely on
mathematics. Students planning to transfer to four-
year institutions should consult with a counselor
regarding the process and requirements.
Assessment: › Data show the department continues to grow.
During a 5-year period, FTES has risen from 1178
to 1316 (11.71%).
› While there was decline in 12-13, the growth
continued in 13-14 and 14-15.
› Likewise, FTEF has increased from 66.87 to 77.31
(15.61%).
› Efficiency has fallen from 528 to 507 during the
three years 2010-13, increased in 2013-14 then
slightly fell in 2014-15 to 511.
› Success rates have been steady between holding
steady running at 54% to 57% in the last five years.
› Retention rose in 2012-13 and then have stayed
steady as well at 85%.
› Sections decreased from 2010-13 and have since
increasaed a total of 19.2% in the last two years.
Department Goals: › To continue growth, particularly in the number of
sections offered and FTES.
› To continue growth in success and retention rates.
› To improve access to the math courses students
need for a degree and /or to transfer.
Challenges & Opportunities: › Maintaining growth is difficult in scarcity. Finding
available classrooms and computer labs for our
classes can be difficult.
› The department offers many courses, making
content review arduous, especially with the
expectations of maintaining and assessing student
learning outcomes. Faculty is aware of course
content and makes improvements.
› With the resources available through the AB86
grant, the department has the opportunity to
increase access to classes for adult learners
unprepared to take college level math classes.
Action Plan: › Continue to provide preassessment opportunities
throughout the year including offering workshops
and testing on the feeder high school campuses.
› Continue to search for viable solutions for limited
space; continue to offer online and hybrid courses,
short term classes, and weekend classes.
› Write curriculum for noncredit basic skills level
courses with flexibility to increase the number of
students transitioning to college level courses.
› Write curriculum for a non-credit staffed lab math
course to support student success in the basic
skills classes.
› Continue to increase the number of upper division
classes needed for student to attain a degree in
Math and/or transfer to a four-year school.
Individual Data Sheets By Division
MATHEMATICS, BUSINESS + COMPUTER TECHNOLOGY DIVISION (INSTRUCTION) (cont.)
San Bernard ino Va l l ey Co l lege / 2017 Comprehens ive Mas te r P lanA.64
2017 Comprehens ive Mas te r P lan Append ix / SBCCD / HMC Arch i tec ts + ALMA St ra teg ies

10-11 11-12 12-13 13-14 14-15
Duplicated Enrollment 9,248 9,226 8,396 9,558 10,132
FTEF 66.87 67.27 64.26 71.22 77.31
WSCH per FTEF 528 536 507 516 511
10-11 11-12 12-13 13-14 14-15
Sections 278 261 250 280 299
% of online enrollment 5% 12% 15% 14% 17%
Degrees awarded 12 7 20 18
Certificates awarded N/A N/A N/A N/A
Award Source: http://datamart.cccco.edu/Outcomes/Program_Awards.aspx
TOP Code: 170100
San Bernard ino Va l l ey Co l lege / 2017 Comprehens ive Mas te r P lan A.65
2017 Comprehens ive Mas te r P lan Append ix / SBCCD / HMC Arch i tec ts + ALMA St ra teg ies

REAL ESTATE + ESCROW – 2014-2015
Description: › People study real estate (RE) at SBVC’s 50+
year-old program for a wide range of reasons.
Some attend SBVC to become RE agents, RE
brokers, informed customers, investors, or to
find employment in RE-related fields. Others
attend to receive a RE certificate from the SBVC
certificate program or an AA real estate degree
(which requires a total of 60 units, including general
education). There are also those who study RE
at SBVC in order to transfer to a CSU to earn an
advanced degree as a Business Major/RE Minor.
Assessment: › FTES is on a decline since 2012/13—largely due
the retirement of a full-time professor and the
change in the real estate agent qualifications (only
need principles, practices and one more course to
be able to sit for the licensing exam).
› Courses are now offered 100% online and are now
showing higher enrollment numbers per class that
in the past.
› REALST 100 classes are now having wait lists.
› FTEF has decreased from 2.20 in 2013-14 to 1.60
in 2014-15, largely to the 39% reduction in our
course offerings from 11 courses to eight courses.
› There has been a reduction in the number of
certificates and degrees that were awarded due to
the change in the licensing requirements.
› The success rates are the highest reported for the
last five years.
Department Goals: › Have a clear pathway for students to receive an AA
degree and/or certificate in a timely fashion.
› Make adjustments to certificates and/or degrees to
meet the changes in the REALST offerings.
› Have all RE courses approved for online education,
which provides greater access for students.
› Increase the number of RE courses that are
transferable to CSUs.
Challenges & Opportunities: › With the most recent upturn in the economy, we
are seeing an increase in the opportunities in the
RE industry. Many people are either coming back to
the RE industry and are in need of recertifications,
or are looking to capitalize financially, and are
looking to get their RE license. The change in
the RE license requirements has forced us to
reexamine our offerings, the manner in which we
offer them, and the content of our offerings. This
is difficult to accomplish as a result of having no
full-time instructor applied to the discipline—only
part-time adjuncts are employed at this point in
time. The full-time instructor retired in spring 2014.
Action Plan: › Continue to implement and adjust curriculum
offerings recommended by advisory committee and
industry needs.
› Adjust current certificates to assure quicker
completion for students.
› Expand hybrid and online offerings to assure
growth and proper connection with the community.
› Develop and implement SLO assessment at the
program level.
› Continue to reassess course level SLO’s.
Individual Data Sheets By Division
MATHEMATICS, BUSINESS + COMPUTER TECHNOLOGY DIVISION (INSTRUCTION) (cont.)
San Bernard ino Va l l ey Co l lege / 2017 Comprehens ive Mas te r P lanA.66
2017 Comprehens ive Mas te r P lan Append ix / SBCCD / HMC Arch i tec ts + ALMA St ra teg ies
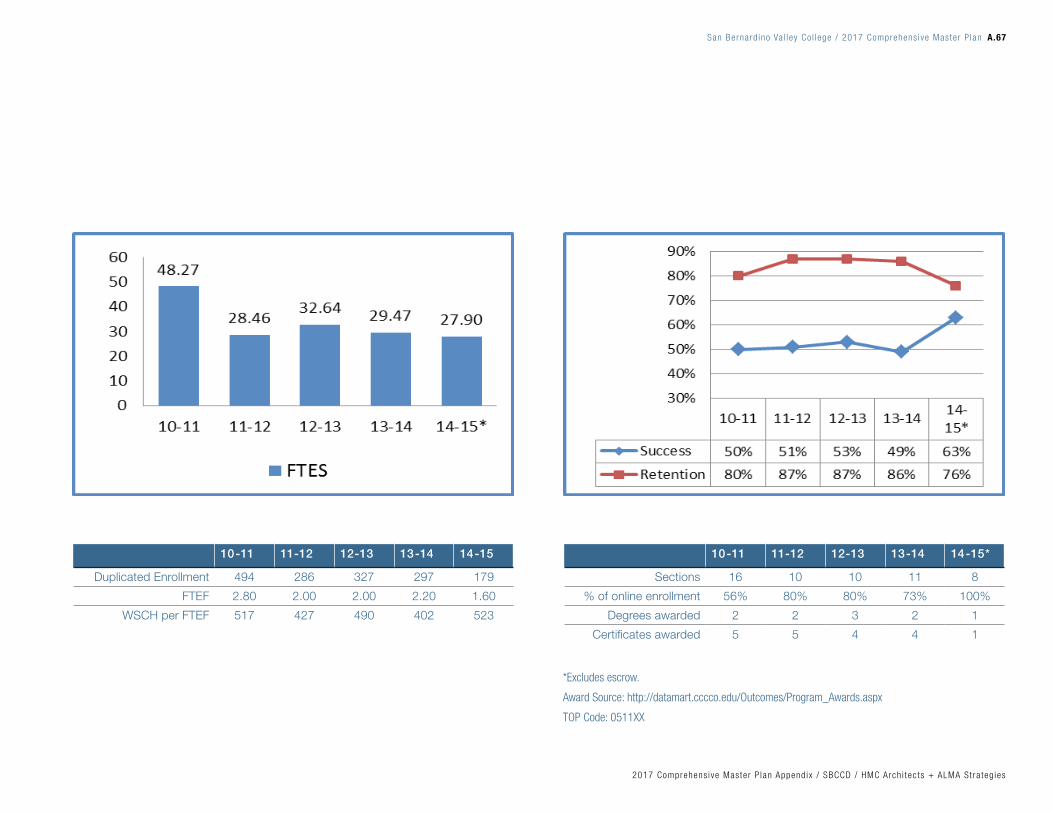
10-11 11-12 12-13 13-14 14-15
Duplicated Enrollment 494 286 327 297 179
FTEF 2.80 2.00 2.00 2.20 1.60
WSCH per FTEF 517 427 490 402 523
10-11 11-12 12-13 13-14 14-15*
Sections 16 10 10 11 8
% of online enrollment 56% 80% 80% 73% 100%
Degrees awarded 2 2 3 2 1
Certificates awarded 5 5 4 4 1
*Excludes escrow.
Award Source: http://datamart.cccco.edu/Outcomes/Program_Awards.aspx
TOP Code: 0511XX
San Bernard ino Va l l ey Co l lege / 2017 Comprehens ive Mas te r P lan A.67
2017 Comprehens ive Mas te r P lan Append ix / SBCCD / HMC Arch i tec ts + ALMA St ra teg ies
Individual Data Sheets By Division
SCIENCE DIVISION (INSTRUCTION)
ARCHITECTURE – 2014-2015
Description: › The architecture, environmental design, and
drafting program serves a variety of students
through instructional course offerings. The
architectural history courses serve both as major’s
preparation and as general education courses. The
architectural design sequence serves as major’s
preparation for transfer students to a variety of
architectural related fields. The drafting classes
serve career and technical education students as
well as support major’s preparation.
Assessment: › The FTES generation of the program grew
significantly until the college was forced to scale
back instructional offerings. The program has not
yet recovered. The success and retention rates of
students are good. The retention rates raised and
have remained at a relatively level 90%. The FTES
rates have dropped but will increase as soon as the
ARCH 200 and 201 courses can be offered again.
Department Goals: › The program has accomplished much of redesign
based on lengthy conversations within the division
and with an advisory group. The program now has
the possibility of some lecture content in an online
format for design students and has increased the
number of units to better align with the transfer
universities. The department has achieved student
success in terms of transfer to universities without
fulfillment of AA degrees. The department seeks to
offer more courses more frequently.
Challenges & Opportunities: › One major challenge is articulation with transfer
institutions. Most universities award credit only
by portfolio review for transfer students. The
program continues to explore mechanisms to
public and private institutions to ease the transfer
process in a variety of related fields. We have
achieved articulation with private universities and
an agreement relative to the Architectural History
courses with Cal Poly Pomona. We have aligned
our 100 and 101 design courses with the state
university as well. The architectural history classes
are now UC transferable.
Action Plan: › The program will:
› Submit needs request for model construction
studio and other needs through program
review
› Continue to explore transfer & career
programs in alternative segments including
urban planning, landscape, & construction
management
› Work with campus administration to get
certificates approved, offer second level
courses
› Implement on-line and hybrid offerings
› Investigate ways to improve degree and
certificate awards
› Make efforts to document the number of
students successfully transferring into the
university without degrees or with general
degrees specifically into the Architecture and
related fields at the university
San Bernard ino Va l l ey Co l lege / 2017 Comprehens ive Mas te r P lanA.68
2017 Comprehens ive Mas te r P lan Append ix / SBCCD / HMC Arch i tec ts + ALMA St ra teg ies

10-11 11-12 12-13 13-14 14-15
Duplicated Enrollment 539 463 357 283 239
FTEF 6.24 4.99 4.67 4.20 2.94
WSCH per FTEF 369 442 397 312 342
10-11 11-12 12-13 13-14 14-15
Sections 25 20 17 15 11
% of online enrollment 32% 20% 12% 13% 27%
Degrees awarded 1 0 0 1 0
Certificates awarded 1 0 0 1 0
Award Source: http://datamart.cccco.edu/Outcomes/Program_Awards.aspx
TOP Code: 020100
San Bernard ino Va l l ey Co l lege / 2017 Comprehens ive Mas te r P lan A.69
2017 Comprehens ive Mas te r P lan Append ix / SBCCD / HMC Arch i tec ts + ALMA St ra teg ies

BIOLOGY – 2014-2015
Description: › The biology department offers courses to prepare
students for opportunities towards four major
areas: 1) General education science requirements;
2) allied health careers; 3) biology major transfer
students; and, 4) Biotechnology related careers.
The development of student skills as they relate to
creative critical thinking, assessment of quantitative
information, deductive/ inductive reasoning, and
written communication are stressed.
Assessment: › Success and retention is stabilizing at about 60%
and 84% respectively.
› The learning support via Student Success Center is
essential.
› FTES started decreasing in 2011-2013 due to
sections cut but has increased and average of 5%
since 2012-2013.
› Enrollment and WSCH per FTEF has increased
from the past academic year.
Department Goals: › Continue to collaborate with general & STEM
counselors to guide biology majors to new majors
course sequence:
› Hire replacement faculty.
› Increase the number of degrees awarded
under the new AA-T degree and revised AS
degree.
› Implement the new department philosophy
plan for the re-expansion of sections and new
courses.
› Continue to support SBVC’s transformation to
a drought tolerant landscape.
› Maintain lab equipment and increase supplies
for quality education.
› Plan for adjunct mentoring.
Challenges & Opportunities: › Loss of faculty member resulted in low percentage
of classes taught by full time faculty.
› Poor lightning and sound issues in all rooms makes
teaching difficult.
› Work out the new snorkel system.
› Lack of funds for supplies.
› Lack of funds maintenance of equipment.
› Implementation of the transition from a two
semester biology majors program to a three
semester program.
Action Plan: › Advocate for faculty, increased budget, and
maintenance.
› Identify ideal characteristics in hiring new, full-time
faculty and develop a job announcement that
reflects these characteristics.
› Develop a strategic plan for growth in the
department consistent with departmental
philosophy.
› Create new opportunities in the SI program in
Biology to improve student success.
› Initiate a process of systematic data gathering of
student entrance and exit skills from each biology
course in a sequence.
› Review and refine SLO course level assessments.
Individual Data Sheets By Division
SCIENCE DIVISION (INSTRUCTION) (cont.)
San Bernard ino Va l l ey Co l lege / 2017 Comprehens ive Mas te r P lanA.70
2017 Comprehens ive Mas te r P lan Append ix / SBCCD / HMC Arch i tec ts + ALMA St ra teg ies

10-11 11-12 12-13 13-14 14-15
Duplicated Enrollment 3,752 2,744 2,406 2,659 2,587
FTEF 34.46 29.94 29.58 31.41 30.73
WSCH per FTEF 654 563 497 495 498
10-11 11-12 12-13 13-14 14-15
Sections 135 105 100 107 108
% of online enrollment 2% 3% 4% 6% 9%
A.S. Biology Degrees
Awarded4 4 6 6 8
A.A. Lib Arts: Bio
& PhySci Degrees
Awarded
54 92 129 151 148
Award Source: http://datamart.cccco.edu/Outcomes/Program_Awards.aspx
TOP Code: 040100
San Bernard ino Va l l ey Co l lege / 2017 Comprehens ive Mas te r P lan A.71
2017 Comprehens ive Mas te r P lan Append ix / SBCCD / HMC Arch i tec ts + ALMA St ra teg ies
CHEMISTRY + PHYSICAL SCIENCE – 2014-2015
Description: › The chemistry program provides instruction
and laboratory experience appropriate for
general education requirements in the area of
physical sciences, pre-nursing and allied health
preparation courses, and lower division preparation
required for chemistry and biochemistry transfer
students. The same lower- division courses
service transfer students in nearly every field of
science engineering, and pre-professional school
preparation, such as pharmacy, dental, and
medical schools.
Assessment: › The efficiency of the program has decreased to
a lower but still acceptable level for laboratory-
based instruction. Some of the factors that have
decreased efficiency include the need to generate
more FTES by offering single sections at a variety
of times. Another factor has been fulfilling the goal
of generating more chemistry and STEM related
degrees. Those classes required for majors have
lower caps due to safe laboratory practices and
therefore decrease efficiency. The department has
increased the number of STEM majors prepared
for transfer by offering and filling additional sections
of general and organic chemistry. The department
has also expanded our offerings in non-laboratory
based general education classes to increase
enrollment and options for students.
Department Goals: › Continue to increase the number of science, math,
and engineering majors to affect the economic
viability of our region.
› Continue to increase the number of STEM degrees
granted.
› Improve student success.
› Maintain laboratories with equipment and supplies
needed for quality education.
Challenges & Opportunities: › Identifying and retaining adjunct faculty to teach.
Every semester we must scramble to identify part-
time faculty as our current pool finishes grad school
and/or finds full-time employment. For the last six
semesters we have cancelled classes or asked
for waivers for faculty to teach above 67%. The
unemployment rate for chemists is low.
› The success rate continues to be an issue for the
program as we attempt ways to improve student
success.
Action Plan: › We must continue to increase the number of
major’s preparation sections to increase student
access to pathways that lead to STEM degrees.
› Implement and evaluate supplemental instruction
for major’s preparation courses.
› Evaluate effects of prerequisite implementation on
student success.
› Maintain our position in the region as the largest
community college chemistry program in the Inland
Empire.
› Design an allied health course in general, organic,
and biochemistry for CSU transfer nursing
students.
› Test online general education courses for efficacy.
Individual Data Sheets By Division
SCIENCE DIVISION (INSTRUCTION) (cont.)
San Bernard ino Va l l ey Co l lege / 2017 Comprehens ive Mas te r P lanA.72
2017 Comprehens ive Mas te r P lan Append ix / SBCCD / HMC Arch i tec ts + ALMA St ra teg ies

10-11 11-12 12-13 13-14 14-15
Duplicated Enrollment 1,839 1,611 1,678 1,737 1,801
FTEF 23.06 20.03 22.01 24.81 25.84
WSCH per FTEF 505 523 494 450 451
10-11 11-12 12-13 13-14 14-15
Sections 84 75 78 91 94
% of online enrollment 4% 3% 4% 7% 3%
Degrees awarded* 5 5 9 8 7
Certificates awarded N/A N/A N/A N/A N/A
*These degrees are in chemistry.
San Bernard ino Va l l ey Co l lege / 2017 Comprehens ive Mas te r P lan A.73
2017 Comprehens ive Mas te r P lan Append ix / SBCCD / HMC Arch i tec ts + ALMA St ra teg ies

GEOGRAPHY – 2014-2015
Description: › The spatial science of geography examines both
physical and cultural landscapes with an emphasis
on human-environmental interactions. Geography
integrates multiple natural and social sciences and
includes the study of: nature and interactions of
the atmosphere and the land; plants and animals;
earth’s waters; weather and climate; earth’s
dynamic surface; landforms and soils; and human
interaction with the physical environment through
forms of agriculture, language, religion, and cities.
Assessment: › FTES numbers have increased from a recession-
induced low ebb in 2011-12.
› Until 2014-15, efficiency rates have remained
above the college goal of 525. The recent decline
may be attributed to offering an array of new and
cross-listed geography courses.
› FTEF has increased during 2013-14 and 2014-
15, potentially demanding additional faculty in the
coming years.
› Success and retention rates have exceeded college
averages and, in general, have been stable since
2011-12.
› The number of degrees awarded must increase.
Department Goals: › Increase the number of degrees awarded under the
new AA-T degree and revised AS degree.
› Collaborate with other departments to offer service
based learning opportunities.
› Develop learning communities with other
disciplines, as well as support for tutors and SI
leaders.
› Increase the number of funded field trips and
maintain laboratories with equipment and supplies
needed for quality education.
› Identify study abroad opportunities.
› Cultivate relationships with four-year institutions
and area employers as a means to increase
transfer and career opportunities.
Challenges & Opportunities: › The AA-T geography transfer degree should
increase the number of degrees awarded, but
additional student recruitment is needed.
› Continue to fund field study opportunities, as
budgets remain flat or decline.
› As the field of geospatial technology grows,
emphasize how GIS can be used in the study of
geography and environmental science/studies.
› FTEF growth supports hiring an additional full-time
faculty member in the future.
Action Plan: › Advertise the geography department more
effectively, both on and off campus.
› Increase the number of geography graduates and
transfer students by cultivating grant, scholarship,
research, internship, and career opportunities.
› Increase the number of online/hybrid sections in
geography.
› Continue to revise curriculum, including new course
development.
› Hire another full-time geography faculty in the
coming years.
Individual Data Sheets By Division
SCIENCE DIVISION (INSTRUCTION) (cont.)
San Bernard ino Va l l ey Co l lege / 2017 Comprehens ive Mas te r P lanA.74
2017 Comprehens ive Mas te r P lan Append ix / SBCCD / HMC Arch i tec ts + ALMA St ra teg ies

10-11 11-12 12-13 13-14 14-15
Duplicated Enrollment 1,124 1,044 1,031 1,179 1,157
FTEF 5.94 5.74 5.74 6.60 7.90
WSCH per FTEF 558 548 566 551 455
10-11 11-12 12-13 13-14 14-15
Sections 33 33 35 40 49
% of online enrollment 0% 0% 3% 0% 2%
Degrees awarded 2 3 1 2 4
Certificates awarded N/A N/A N/A N/A N/A
Award Source: http://datamart.cccco.edu/Outcomes/Program_Awards.aspx
TOP Code: 220600
San Bernard ino Va l l ey Co l lege / 2017 Comprehens ive Mas te r P lan A.75
2017 Comprehens ive Mas te r P lan Append ix / SBCCD / HMC Arch i tec ts + ALMA St ra teg ies

GEOLOGY/OCEANOGRAPHY – 2014-2-15
Description: › The geology-oceanography department offers
courses that examine the Earth’s geological history,
structure, and economic resources. These courses
meet the needs of students: (1) planning to transfer
to a four-year institution and to prepare for careers
in research, mining, energy, hydrogeology, environ-
mental sciences, hazards, and related fields; (2)
fulfilling the undergraduate general education
science requirement; and (3) who wish to better
understand the planet on which we live.
Assessment: › FTES, enrollment, and FTEF have increased from
2013-14 to 2014-15.
› Efficiency has fallen below the institutional goal
of 525 since 2013-14, as the department retools
courses and schedules.
› Retention has remained above institutional
averages. How-ever, success declined in 2014-15.
› Geology AS and AS-T degrees have not been
awarded, how-ever, curriculum has recently been
updated to align with C-ID requirements and should
allow students to earn degrees.
Department Goals: › Hire a full-time faculty, as well as a tutor and
supplemental instruction (SI) leader.
› Maintain curricular and SLO updates to meet
changing transfer and career demands, including
distance education (DE) courses.
› Incorporate environmental and energy (fossil fuel
and alternative) research and careers into course
curriculum.
› Offer historical, mineralogy, national parks,
California, and field courses on a rotating basis to
increase options for students, including the number
of majors, degrees, transfers, and career-prepared
students.
› Maintain laboratories with equipment and supplies
needed for quality education.
Challenges & Opportunities: › Lack of a full-time faculty member has curtailed
growth, including: FTES, enrollment, FTEF,
efficiency, success, retention, and degrees
awarded.
› Renewed hiring within the environmental, energy,
and geotechnical sectors should increase student
interest in the program.
› Stagnant budgets over the last decade have
curtailed program development.
› Lack of a dedicated tutor and SI leader continues
to restrict growth and student success.
Action Plan: › Hire a full-time faculty member.
› Offer diverse courses, including DE format, so that
students can earn AS/AS-T degrees, successfully
transfer to four-year institutions, and prepare for
geotechnical careers.
› Coordinate with the institution to Increase the
department budget for crucial field trip, equipment,
tutor, and SI leader expenses and services.
› Increase the visibility of the program and better link
it with other SBVC science and CTE programs, as
well as off-campus entities.
› Pursue grant and scholarship opportunities to
better prepare students for four-year schools and
geotechnical industries.
Individual Data Sheets By Division
SCIENCE DIVISION (INSTRUCTION) (cont.)
San Bernard ino Va l l ey Co l lege / 2017 Comprehens ive Mas te r P lanA.76
2017 Comprehens ive Mas te r P lan Append ix / SBCCD / HMC Arch i tec ts + ALMA St ra teg ies

10-11 11-12 12-13 13-14 14-15
Duplicated Enrollment 485 251 289 268 286
FTEF 2.36 1.25 1.48 1.98 2.18
WSCH per FTEF 617 588 595 397 392
10-11 11-12 12-13 13-14 14-15
Sections 14 8 11 15 16
% of online enrollment 0% 0% 9% 8% 0%
Degrees awarded 0 0 0 0 0
Certificates awarded N/A N/A N/A N/A N/A
San Bernard ino Va l l ey Co l lege / 2017 Comprehens ive Mas te r P lan A.77
2017 Comprehens ive Mas te r P lan Append ix / SBCCD / HMC Arch i tec ts + ALMA St ra teg ies

GEOGRAPHIC INFORMATION SYSTEMS –
2014-2015
Description: › The GIS certificate is designed to provide the skills
and knowledge necessary for immediate entry-level
employment for persons interested in Geographic
Information Systems (GIS) and automated
mapping technology. The GIS certificate provides
a foundation for transfer to four year and graduate
education within the fields of GIS, geography,
remote sensing, environ-mental and earth sciences.
Assessment: › FTES and enrollment rates have declined since
2012-13, possibly due to curricular updates.
On- and off-campus recruitment efforts must be
increased. This may be partially addressed through
Perkins and CTE Enhancement grants.
› Success and retention rates have increased since
2011-12.
› Program lacks a full-time faculty assigned 100% to
this discipline.
› Efficiency will increase with a larger student
population. This may be addressed through
ongoing grant activities.
Department Goals: › Provide students with the skills needed to enter
geospatial technology realted fields.
› Maintain laboratories with equipment and supplies
needed for quality education.
› Advocate for full time faculty that could be shared
with geography and possibly earth science.
› Use grant funding to increase GIS awareness on
and off campus.
› Develop a service based learning course.
› Increase student participation in GIS realted events.
› Cultivate additional internship and employment
opportunities.
› Expand online and hybrid courses.
Challenges & Opportunities: › Increase awareness of entry-level geospatial
technology courses for non-GIS certificate oriented
students.
› Strengthen partnership with local high schools,
offering entry-level GIS courses, including ROP
programs.
› Leverage grant funding for GIS tutors and SI
leaders to extend lab hours.
› Lack of computer lab infrastructure to host
simultaneous labs creates scheduling issues.
› Lack of a full-time GIS faculty member.
Action Plan: › Partner with local agencies and businesses to
provide internship opportunities, including short
non-credit options through PDC and on campus.
› Incorporate entry-level classes in other certificate
programs, including water supply technology,
architecture and environmental design, real estate,
and others.
› Offer colloquium series–open to campus and
community–focused on industry based GIS
applications.
› Build on existing faculty, curricular, institutional,
and industry relationships to increase student
enrollment, transfer, and career placement.
› Hire a full-time GIS faculty member.
Individual Data Sheets By Division
SCIENCE DIVISION (INSTRUCTION) (cont.)
San Bernard ino Va l l ey Co l lege / 2017 Comprehens ive Mas te r P lanA.78
2017 Comprehens ive Mas te r P lan Append ix / SBCCD / HMC Arch i tec ts + ALMA St ra teg ies
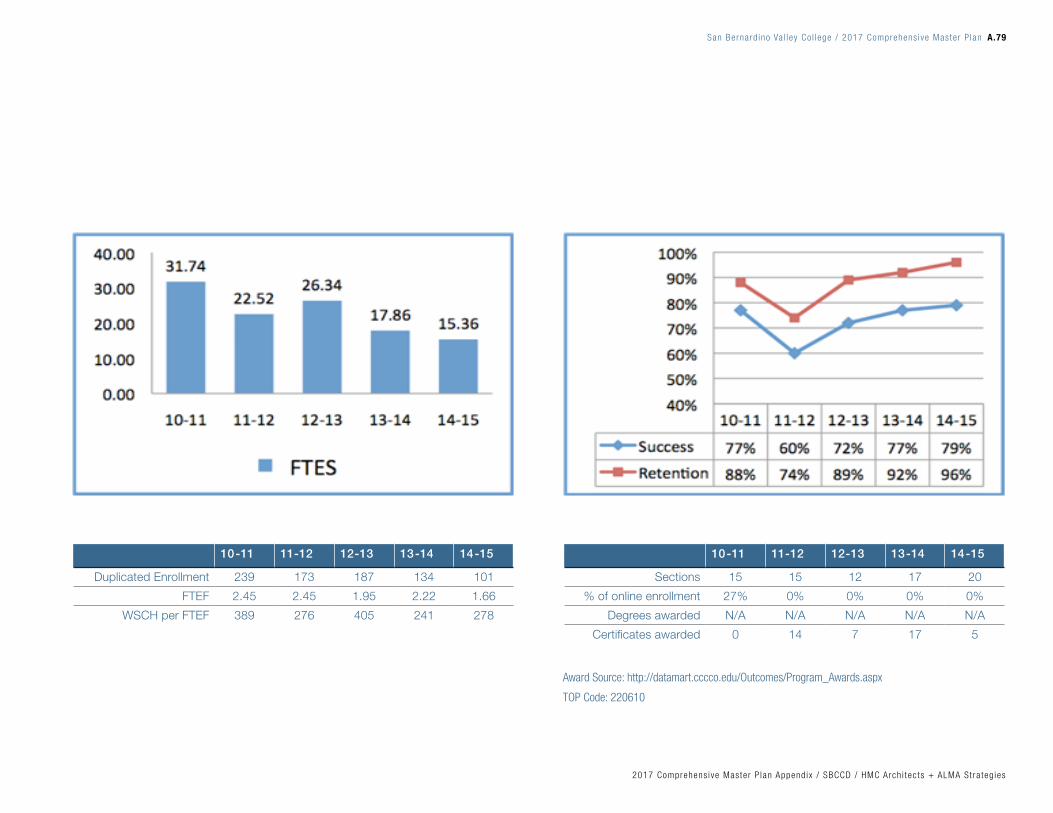
10-11 11-12 12-13 13-14 14-15
Duplicated Enrollment 239 173 187 134 101
FTEF 2.45 2.45 1.95 2.22 1.66
WSCH per FTEF 389 276 405 241 278
10-11 11-12 12-13 13-14 14-15
Sections 15 15 12 17 20
% of online enrollment 27% 0% 0% 0% 0%
Degrees awarded N/A N/A N/A N/A N/A
Certificates awarded 0 14 7 17 5
Award Source: http://datamart.cccco.edu/Outcomes/Program_Awards.aspx
TOP Code: 220610
San Bernard ino Va l l ey Co l lege / 2017 Comprehens ive Mas te r P lan A.79
2017 Comprehens ive Mas te r P lan Append ix / SBCCD / HMC Arch i tec ts + ALMA St ra teg ies

NURSING – 2014-2015
Description: › The nursing department offers a sequence of
courses leading to an Associate of Science degree
with a major in nursing. Graduates are eligible
to take the national licensing exam and become
licensed as a registered nurse in the state of
California. licensed vocational nurses may also take
courses to prepare for RN licensure.
Assessment: › Program meets the standards of and is accredited
by the California Board of Registered Nursing (BRN)
and the Accreditation Commission for Education in
Nursing (ACEN) formerly NLN.
› FTES increased from 40 students to 54 students
admitted in Spring 2015 and 57 students admitted
in Fall 2015 due to Enrollment & Growth Grant
2014-2015.
› NCLEX licensing exam year to date pass rate for
2014-2015 is 80.77%.
Department Goals: › To have state of art technology that supports
student learning for the discipline.
› To improve student success rate to greater than or
equal to 94% in program.
› As per ACEN and BRN recommendations to have
sufficient staff for student success.
› Faculty to continue to expand knowledge and skills
to remain current with advancing practice.
› Maintain qualified and consistent adjunct clinical
faculty.
› To have adequate space, adding more skills lab
space, to provide for expectations by accreditating
agencies ACEN and BRN for increase use of
technology and simulation.
› To hire nursing counselor for remediation from
Enrollment & Retention Grant.
› Increase incorporation of human-patient simulation
as per BRN and ACEN recommendation and
provide more training for faculty.
Challenges & Opportunities: › Improving the NCLEX pass rate.
› Funding for professional development.
› Expanding clinical sites.
› Incorporation human-patient simulation into all
courses.
› Seeking a half-time simulator technician support
specialist as recommended by BRN and ACEN.
› Funding from Enrollment & Growth Grant for HESI
examinations and remediation materials for all
courses.
› Finish curriculum revision by end of fall 2015.
› Continue conversations with institutions to provide
pathways to earn a Baccalaureate in Nursing
(BSN).
Action Plan: › Develop evidence-based skills in writing and
revising NCLEX-style test items.
› Curricular innovations to help students build skills
and knowledge.
› Identify professional development opportunities to
improve faculty exposure to advancing practice.
› Complete curriculum revision fall 2015 with initiation
fall 2017.
› Work with community to build clear pathways from
high school to RN to BSN.
Individual Data Sheets By Division
SCIENCE DIVISION (INSTRUCTION) (cont.)
San Bernard ino Va l l ey Co l lege / 2017 Comprehens ive Mas te r P lanA.80
2017 Comprehens ive Mas te r P lan Append ix / SBCCD / HMC Arch i tec ts + ALMA St ra teg ies
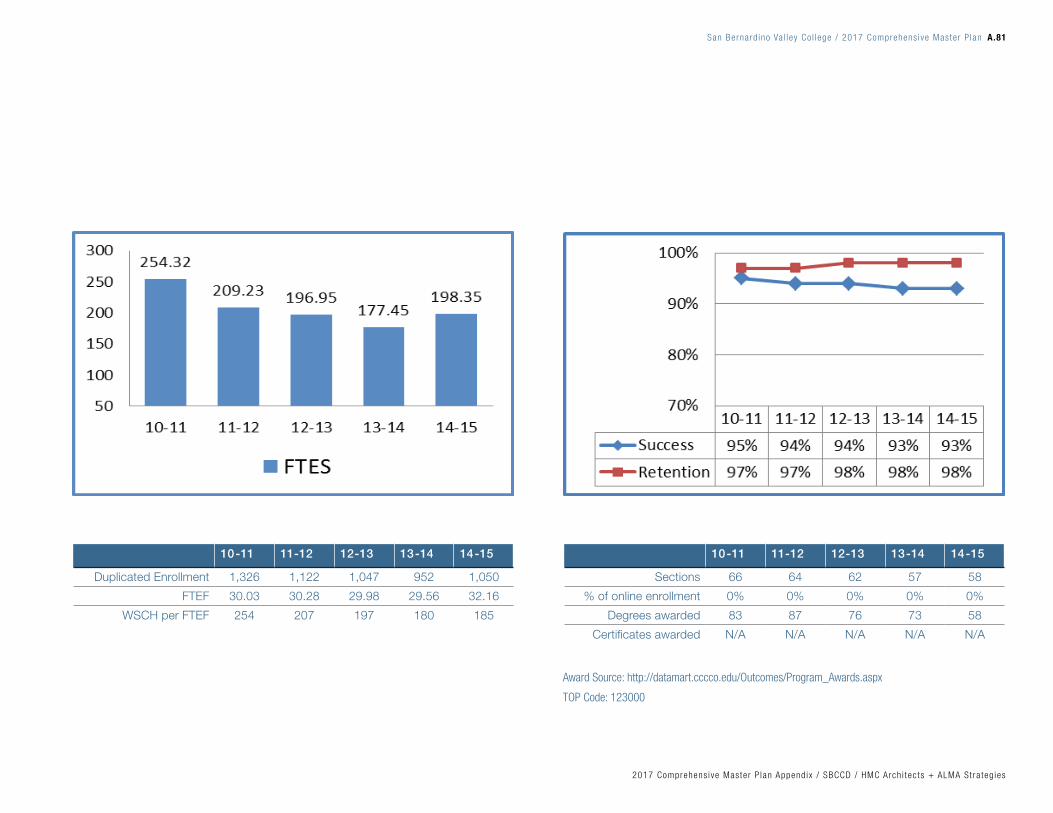
10-11 11-12 12-13 13-14 14-15
Duplicated Enrollment 1,326 1,122 1,047 952 1,050
FTEF 30.03 30.28 29.98 29.56 32.16
WSCH per FTEF 254 207 197 180 185
10-11 11-12 12-13 13-14 14-15
Sections 66 64 62 57 58
% of online enrollment 0% 0% 0% 0% 0%
Degrees awarded 83 87 76 73 58
Certificates awarded N/A N/A N/A N/A N/A
Award Source: http://datamart.cccco.edu/Outcomes/Program_Awards.aspx
TOP Code: 123000
San Bernard ino Va l l ey Co l lege / 2017 Comprehens ive Mas te r P lan A.81
2017 Comprehens ive Mas te r P lan Append ix / SBCCD / HMC Arch i tec ts + ALMA St ra teg ies

PHARMACY TECHNOLOGY – 2014-2015
Description: › The program prepares students to assist
pharmacists as pharmacy technicians in
community or institutional pharmacies by providing
medications and healthcare products to patients.
The program also prepares students to pass the
Pharmacy Technician Certification Board exam.
A pharmacy technology certificate requires 24-
36 units, including prerequisites of BIOL 155,
ENGL 015, and MATH 090 with two semesters of
pharmacy technology courses. The AS degree has
the addition of general breadth requirements.
Assessment: › FTES and enrollment have decreased due to the
combined effects curricular changes requiring
additional prerequisites.
› Efficiency has declined as a result of smaller
class sizes brought about changing curricular
requirements needed to meet ASHP accreditation.
› Success and retention have slightly declined due to
a more rigorous program.
› New curriculum with prerequisites started in
fall 2013 to meet accreditation standards has
impacted enrollment.
Department Goals: › Hire a full-time faculty as load will increase after
ASHP accreditation.
› Continue development of an accreditation action
plan.
› Finalize informational brochures for the program.
› Improve the PHT 067 courses, as well as the
modified PHT 062, PHT 070, and PHT 072 courses
in 2015-2016.
› Successfully complete the ASHP accreditation
process.
› Procure a faculty office and dedicated laboratory
facility.
› Expand community pharmacy and institutional
pharmacy clinical internship opportunities for
students.
› Maintain laboratories with equipment and supplies
needed for quality education.
Challenges & Opportunities: › There are no full-time faculty for this program
making student success difficult.
› Pharmacy technology programs will be required to
be accredited and the program will have increased
needs to meet ASHP accreditation standards.
› For-profit institutions offering pharmacy technology
are closing in the face of the need for ASHP
accreditation/
› Our institution needs to provide greater job
placement assistance.
› Lack of a dedicated faculty office and student
laboratory jeopardizes data privacy, student
success, and accreditation status.
Action Plan: › Provide information sessions on the program and
finalize an information packet.
› Hire a full time faculty.
› Become the premier pharmacy technology program
in the Inland Empire.
› Work with ASHP and PTEC to become fully
accredited.
› Expand the advisory committee to establish a
greater network for students and our graduates.
› Work with community and/or other CTE programs.
› Create a pathway from high school to the pharm
tech program.
› Make changes to curriculum to meet ASHP
standards.
Individual Data Sheets By Division
SCIENCE DIVISION (INSTRUCTION) (cont.)
San Bernard ino Va l l ey Co l lege / 2017 Comprehens ive Mas te r P lanA.82
2017 Comprehens ive Mas te r P lan Append ix / SBCCD / HMC Arch i tec ts + ALMA St ra teg ies

10-11 11-12 12-13 13-14 14-15
Duplicated Enrollment 351 281 335 194 167
FTEF 3.02 3.02 3.35 3.18 3.18
WSCH per FTEF 485 381 397 288 235
10-11 11-12 12-13 13-14 14-15
Sections 12 12 14 12 12
% of online enrollment 0% 0% 0% 0% 0%
Degrees awarded 6 13 6 20 8
Certificates awarded 21 6 9 23 2
Award Source: http://datamart.cccco.edu/Outcomes/Program_Awards.aspx
TOP Code: 122100
San Bernard ino Va l l ey Co l lege / 2017 Comprehens ive Mas te r P lan A.83
2017 Comprehens ive Mas te r P lan Append ix / SBCCD / HMC Arch i tec ts + ALMA St ra teg ies
PHYSICS/ASTRONOMY – 2014-2015
Description: › The physics/astronomy/engineering department
offers general education physics/astronomy
courses; a physics sequence for majors in the
life sciences, biology, pre-nursing/medicine, and
allied health programs; a physics sequence for
majors in astronomy, chemistry, engineering,
geology, physics, and other physical sciences; and
engineering courses. The department operates
a planetarium and an observatory supporting
instruction and offering astronomy programs for
local schools and community.
Assessment: › FTES, enrollment, and WSCH/FTEF increased
steadily, on average, through 13-14 since the slight
drop in 11-12 resulting from section cutbacks and
budget restrictions.
› Retention rates generally increased and leveled off
through 13-14; success rates dropped slightly from
11-12 to 13-14.
› With new sections opening, FTES, enrollment,
and WSCH/FTEF have increased in 13-14 after
dropping significantly in 11-12 due to cutbacks.
› Number of degrees awarded has remained fairly
constant, but with a slight, steadily increase since
10-11.
Department Goals: › Create more tutoring/workshop opportunities for
department students through the student success
center and the SI program.
› Strengthen/build the engineering program and offer
more Engineering courses.
› Offer Physics 101 as a hybrid course, with online
lectures and on-campus labs and/or tests.
› Maintain lab equipment and supplies for quality
education.
› Update the physics/astronomy labs and their
related equipment needs.
› Incorporate the use of on-line practice problem-
solving software as Mastering Physics or Web-
Assign in upper level courses.
Challenges & Opportunities: › Develop strategies to increase retention and
student success rates.
› Develop strategies to increase the productivity of
classes determined by WSCH/FTEF.
› Develop ways to encourage more students to
major in the physical sciences to increase the
number of degrees awarded.
› Enhance the department’s curriculum with more
engineering-related offerings and encourage more
pre-engineering students to attend SBVC.
› Encourage more pre-med students to attend
SBVC.
Action Plan: › Consult other on-line instructors to formulate a
hybrid Physics course.
› Update/revise the physics/astronomy labs and
related equipment with department lab technician.
› Work with local universities to enhance the
department curriculum with more engineering
courses and to encourage more pre-engineering
and pre-med students to attend SBVC.
› Incorporate and support the operation of the SI
program in all physics, astronomy, and engineering
courses.
› Test existing practice problem-solving software and
consult with other colleges using such software to
determine the most appropriate software for use at
SBVC.
Individual Data Sheets By Division
SCIENCE DIVISION (INSTRUCTION) (cont.)
San Bernard ino Va l l ey Co l lege / 2017 Comprehens ive Mas te r P lanA.84
2017 Comprehens ive Mas te r P lan Append ix / SBCCD / HMC Arch i tec ts + ALMA St ra teg ies

10-11 11-12 12-13 13-14 14-15
Duplicated Enrollment 814 604 656 771 797
FTEF 6.08 5.95 6.29 7.20 8.42
WSCH per FTEF 684 591 630 643 599
10-11 11-12 12-13 13-14 14-15
Sections 36 26 27 33 38
% of online enrollment 6% 8% 7% 6% 5%
Degrees awarded 0 2 1 4 1
Certificates awarded N/A N/A N/A N/A N/A
Award Source: http://datamart.cccco.edu/Outcomes/Program_Awards.aspx
TOP Code: 191100/190200
San Bernard ino Va l l ey Co l lege / 2017 Comprehens ive Mas te r P lan A.85
2017 Comprehens ive Mas te r P lan Append ix / SBCCD / HMC Arch i tec ts + ALMA St ra teg ies

PSYCHIATRIC TECHNOLOGY – 2014-2015
Description: › The psychiatric technician program is a one year
program consisting of two, 18 weeks (17 units
each) and one, 10 week term summer session (12
units). The program content areas include: nursing
science, developmental disabilities and mental
disorders. Twenty to thirty students are admitted
each fall and spring semesters. The program is
accredited by the Board of Vocation Nurses and
Psychiatric Technicians. Upon completion, the
students are eligible to take the BVNPT licensing
exam.
Assessment: › Retention and success rates are high and stable.
› State licensing first-time pass rates have been 95%
for January through December 2014 testing dates.
› Retention and success rates exceed the college
average.
› Shows a four-year period of small decrease in
FTES.
Department Goals: › Continue prerequisites at a college level.
› Expand the multimedia collection for students and
faculty use.
› Maintain first time pass rate at 95% or higher the
next three years.
› Encourage faculty to improve and expand
knowledge, skills, and teaching approaches.
› Provide adequate funding to meet program needs.
Challenges & Opportunities: › Continue to meet the faculty to student ratio of
1:10 as required by our clinical facilities.
› Build a pool of adjunct faculty. Knowledgeable,
experienced and qualified faculty are difficult to find.
› Enhance support for annual advisory meetings.
› Utilize Perkins funds to support our program’s
supply budget.
› Strengthening the partnerships between SBVC and
community agencies.
› Utilize funding for professional development, i.e., for
all full time instructors to attend our association’s
annual meeting.
Action Plan: › Utilize funding and support for annual advisory
meetings.
› Seek qualified instructors with experience and
expertise in areas of developmental disabilities,
mental disorders and nursing science.
› Strengthen advisory committee by providing
liaisons for increased clinical sites.
› Update equipment and software used in the
course.
› Evaluate courses offered each semester to ensure
degrees and certificates can continue to be earned
by students in a reasonable amount of time.
› Distribute our program brochure to prospective
students.
› Find funding source for required fields trips.
Individual Data Sheets By Division
SCIENCE DIVISION (INSTRUCTION) (cont.)
San Bernard ino Va l l ey Co l lege / 2017 Comprehens ive Mas te r P lanA.86
2017 Comprehens ive Mas te r P lan Append ix / SBCCD / HMC Arch i tec ts + ALMA St ra teg ies

10-11 11-12 12-13 13-14 14-15
Duplicated Enrollment 101 92 80 74 67
FTEF 12.18 11.88 11.18 10.46 9.74
WSCH per FTEF 257 236 222 219 214
10-11 11-12 12-13 13-14 14-15
Sections 4 4 4 4 4
% of online enrollment 0% 0% 0% 0% 0%
Degrees awarded 15 8 19 16 18
Certificates awarded 38 37 36 28 34
Award Source: http://datamart.cccco.edu/Outcomes/Program_Awards.aspx
TOP Code: 123900
San Bernard ino Va l l ey Co l lege / 2017 Comprehens ive Mas te r P lan A.87
2017 Comprehens ive Mas te r P lan Append ix / SBCCD / HMC Arch i tec ts + ALMA St ra teg ies

Individual Data Sheets By Division
SOCIAL SCIENCE (INSTRUCTION)
ADMINISTRATION OF JUSTICE – 2014-2015
Description: › The administration of justice department strives
to provide students with the legal, ethical, and
educational background necessary to pursue a
career in a criminal justice-related field and to
successfully transition into a four-year academic
program.
Assessment: › Enrollment recovering from severe cuts in 2011-12.
› WSCH per FTEF significantly above college norm.
› FTEF demonstrates need for more faculty.
› Retention and success rates consistently high.
› Online access between 25-30%.
› Degrees and certificates awarded significantly
higher in 2014-15.
› Charts demonstrate more faculty needed.
Department Goals: › Direct more students into more rigorous AS-T
degree which began in FA13.
› Continue to offer more online courses as funding
increases.
› Increase diversity of program adjunct faculty.
› Revise and update courses for relevancy and
currency to comply with C-ID requirements.
› Recover two more sections lost to budget cuts.
› Maintain high retention rates.
› Update SLOs for content review next school year.
Challenges & Opportunities: › Maintain academically rigid program while keeping
high retention and success rates.
› Continue course revisions as directed by C-ID.
› Continue fighting for sections lost in budget cuts.
Action Plan: › Give students campus resource lists, especially for
tutoring in reading and writing skill enhancement.
› Hold advisory committee meeting in SP16.
› Hired first black male adjunct faculty in SP15.
› Hiring first female Latina adjunct faculty to start in
SP16.
› Continue course SLO assessment every semester
until directed otherwise.
› Go over course and program SLO assessments
with faculty each semester making changes as
necessary.
› Update and publish the AOJ/Corrections color
brochure widely used by students and counselors.
San Bernard ino Va l l ey Co l lege / 2017 Comprehens ive Mas te r P lanA.88
2017 Comprehens ive Mas te r P lan Append ix / SBCCD / HMC Arch i tec ts + ALMA St ra teg ies

10-11 11-12 12-13 13-14 14-15
Duplicated Enrollment 1,235 934 1,095 1,081 1,098
FTEF 6.00 4.60 5.40 5.40 5.60
WSCH per FTEF 619 629 622 605 588
10-11 11-12 12-13 13-14 14-15
Sections 30 23 27 27 28
% of online enrollment 23% 17% 30% 30% 25%
Degrees awarded 23 50 44 46 54
Certificates awarded 18 26 21 16 27
*A.A.-T Degrees were established in 2013.
TOP Code: 210500
San Bernard ino Va l l ey Co l lege / 2017 Comprehens ive Mas te r P lan A.89
2017 Comprehens ive Mas te r P lan Append ix / SBCCD / HMC Arch i tec ts + ALMA St ra teg ies
ANTHROPOLOGY – 2014-2015
Description: › The origins, physical and cultural development,
technologies, social customs, and beliefs of
mankind. Anthropology is the study of humanity in
all times and places. As such, it has the broadest
scope of any of the social sciences. The program
offers course work in the four subspecialties
of anthropology and other areas related to art,
religion and indigenous populations. With the goal
of understanding people in all parts of the world,
anthropology is useful to anyone living or working in
a multicultural environment and provides students
with survival skills for the global community.
Assessment: › FTES have increased yearly to regain their position
prior to budget cuts, and from 2013-14 there was a
21.7% increase.
› Efficiency is maintained above the institutional
average and the program has load for two full time
instructors.
› Retention rates appear stable just below 90%.
› Success rates have increased but are close to the
five-year average of 62%. Thirty-five percent of
sections are offered online.
› The institution awarded one AA-T anthropology
degree during the first year that the degree became
available to students.
Department Goals: › Maintain retention and improve success rates.
› Continue to assess and evaluate SLOs with an
emphasis on increasing student success rates.
› Continue to assess equipment and supply needs.
› Keep faculty in the program informed of
professional development related to technology
and student success.
Challenges & Opportunities: › A significant challenge facing the department
is lack of a budget. The request for an annual
departmental budget was approved and ranked
highly (2nd) through the program review process
in 2014-15, but funding has not yet been
institutionalized. A budget will allow for the building
and maintenance of instructional equipment and
supplies to contribute to student success.
Action Plan: › Resubmit, if necessary, a program budget request
to program review.
› Continue to follow the articulation process of new
courses.
› Continue to send Anthro bulletins to faculty and
update faculty Blackboard shell.
› Seek to hold departmental meetings at part-time
orientation.
› Continue to promote the AA-T anthropology
degree.
› Update program website.
› Seek partnerships for field projects and continue
improving and discussing amongst faculty
experiential learning opportunities.
Individual Data Sheets By Division
SOCIAL SCIENCE (INSTRUCTION) (cont.)
San Bernard ino Va l l ey Co l lege / 2017 Comprehens ive Mas te r P lanA.90
2017 Comprehens ive Mas te r P lan Append ix / SBCCD / HMC Arch i tec ts + ALMA St ra teg ies

10-11 11-12 12-13 13-14 14-15
Duplicated Enrollment 1034 595 681 27 1045
FTEF 5.20 2.80 3.20 4.20 5.20
WSCH per FTEF 595 638 654 570 602
10-11 11-12 12-13 13-14 14-15
Sections 29 17 18 27 34
% of online enrollment 52% 36% 44% 37% 35%
Degrees awarded* N/A N/A N/A 1
Certificates awarded* N/A N/A N/A N/A
San Bernard ino Va l l ey Co l lege / 2017 Comprehens ive Mas te r P lan A.91
2017 Comprehens ive Mas te r P lan Append ix / SBCCD / HMC Arch i tec ts + ALMA St ra teg ies

CHILD DEVELOPMENT – 2014-2015
Description: › The child development department has an
academic as well as a vocational orientation which
prepares students for transfer and immediate
employment. The department currently has eight
certificates and three degrees, including an ECE
AS-T degree. All programs and respective courses
went through content review in 2012-13 and are
curriculum and board approved. All courses in
the TMC are C-ID approved. The department has
strong articulation agreements and partnerships
with secondary institutions, public and private
universities and community agencies, including a
special MOU with ULV. Currently, there are three
full-time faculty and 65% of courses are taught by
adjunct faculty. Child development has two state
contracts. Courses are offered to provide access
to students during the day, in the afternoons, on
Fridays and Saturdays and in a hybrid and ITV
formats. SLOs/PLOs are assessed regularly.
Assessment: › Increase in section offerings from 74 in 12-13 to
76 in 14-15—FTES are down slightly to 260.31.
Efficiency has dropped to 536, but is still higher
than average/
› Success rates are at 70%. Retention rates remain
high at 89%.
› Sixteen percent of courses were offered in a hybrid
format—50% increase since 10-11.
› Degrees awarded have increased with 33 degrees
awarded doubling the number of degrees awarded
since 10-11.
› Fifty certificates awarded in 13-14 remaining very
high.
› There is enough load for six full-time faculty—
currently, there are three FT faculty—65% of
sections are taught by adjunct faculty.
Department Goals: › Continue to Increase course offerings especially
feeder sections to meet the needs in the
community for work, career attainment and transfer
(Access).
› Continue to maintain and increase partnerships
in the community, such as California ECE Mentor
Program (state contract), Director Meetings, CD
Planning Council, Special Needs Committee, CD
Training Consortium (State Contract), University
of La Verne CD BA program, Head Start Friday
program, Adult Ed and ROP and other university
including CSUSB Articulations, etc. (Access and
Student Success).
› Hire a full-time faculty to help with the departmental
work, load, assessment, curriculum, and
partnerships acquire Perkins funding to meet the
needs of students, and bring back Education
Program (Student Success).
Challenges & Opportunities: › Decrease in full-time faculty/increased work load
since 2009.
› Departmental advising for eight certificates and
three degrees is a challenge—lost education
program due to lack of FT faculty.
› Maintaining departmental responsibilities
including vocational and academic responsibilities
including articulation, advisory boards, community
partnerships, site visits, vocational and academic
advising and maintaining state contracts.
› Many partnerships are beneficial to students
including work, transfer, student support and career
advancement, but increase work load for faculty/
need more support for students (Success).
Individual Data Sheets By Division
SOCIAL SCIENCE (INSTRUCTION) (cont.)
San Bernard ino Va l l ey Co l lege / 2017 Comprehens ive Mas te r P lanA.92
2017 Comprehens ive Mas te r P lan Append ix / SBCCD / HMC Arch i tec ts + ALMA St ra teg ies
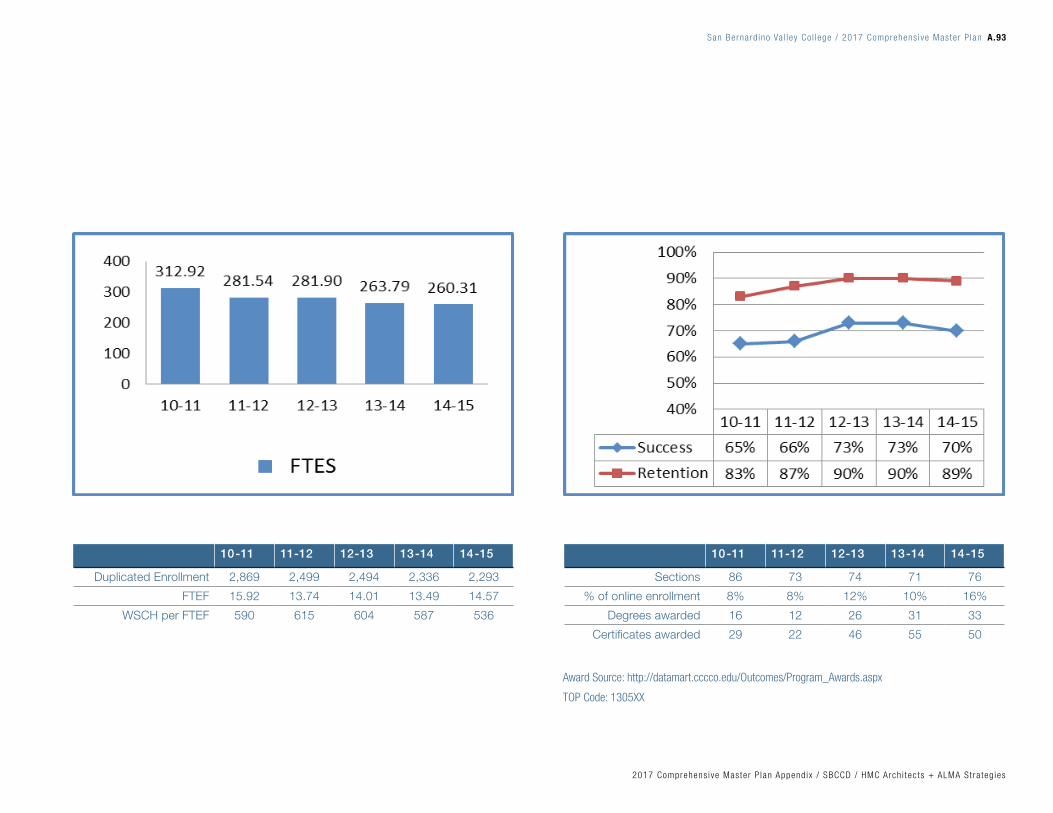
10-11 11-12 12-13 13-14 14-15
Duplicated Enrollment 2,869 2,499 2,494 2,336 2,293
FTEF 15.92 13.74 14.01 13.49 14.57
WSCH per FTEF 590 615 604 587 536
10-11 11-12 12-13 13-14 14-15
Sections 86 73 74 71 76
% of online enrollment 8% 8% 12% 10% 16%
Degrees awarded 16 12 26 31 33
Certificates awarded 29 22 46 55 50
Award Source: http://datamart.cccco.edu/Outcomes/Program_Awards.aspx
TOP Code: 1305XX
San Bernard ino Va l l ey Co l lege / 2017 Comprehens ive Mas te r P lan A.93
2017 Comprehens ive Mas te r P lan Append ix / SBCCD / HMC Arch i tec ts + ALMA St ra teg ies

Individual Data Sheets By Division
SOCIAL SCIENCE (INSTRUCTION) (cont.)
CHILD DEVELOPMENT – 2014-2015 (cont.)
Action Plan: › Continue to maintain and increase partnerships and
contracts (Access and Student Success).
› Increase pipeline feeder sections into programs
(Access).
› Offer all courses in certificate and degrees in 1-2
years and maintain quality programs (Access &
Student Success).
› To increase support resources for students—CD
meetings, brochures, smooth career pathway,
academic advising to ensure success, grants
(Student Success).
› Hire full-time faculty to help with department work,
education program, Perkins, partnerships (Student
Success).
San Bernard ino Va l l ey Co l lege / 2017 Comprehens ive Mas te r P lanA.94
2017 Comprehens ive Mas te r P lan Append ix / SBCCD / HMC Arch i tec ts + ALMA St ra teg ies

San Bernard ino Va l l ey Co l lege / 2017 Comprehens ive Mas te r P lan A.95
2017 Comprehens ive Mas te r P lan Append ix / SBCCD / HMC Arch i tec ts + ALMA St ra teg ies
CORRECTIONS – 2014-2015
Description: › The corrections department strives to provide our
students with the legal, ethical and educational
background necessary to pursue a career in a
corrections-related field.
Assessment: › Enrollment rebounding from extreme budget cuts in
2011-12 and 2012-13.
› Student retention rates still significantly above
college averages.
› Student success rates at state averages.
› WSCH per FTEF above college goals.
› FTEF shows need for a full-time faculty.
› Online enrollment significantly higher (33%) and
above college levels.
Department Goals: › Continue SLO assessments and make
improvements as needed.
› Maintain C-ID designation on CORREC 101.
› Increase certificates achieved.
› Increase diversity of instructional staff.
› Maintain/increase daytime and online class
offerings.
Challenges & Opportunities: › It will be a challenge to maintain such high student
success and retention rates with more effort on
success.
› Funding drives section offerings.
› Hard to market program with no funds while
competing with for-profit tech schools.
› Keeping C-ID designation as statewide elements
change.
Action Plan: › Give each student lists of college resources for
tutoring to help low reading and writing skills
improve.
› Update AOJ/Corrections color brochure.
› Add more online classes.
› Hired African American instructor beginning SP15.
› Hire Hispanic bilingual female instructor to begin
SP16.
› Continue course/program SLO assessment each
semester until notified otherwise.
Individual Data Sheets By Division
SOCIAL SCIENCE (INSTRUCTION) (cont.)
San Bernard ino Va l l ey Co l lege / 2017 Comprehens ive Mas te r P lanA.96
2017 Comprehens ive Mas te r P lan Append ix / SBCCD / HMC Arch i tec ts + ALMA St ra teg ies
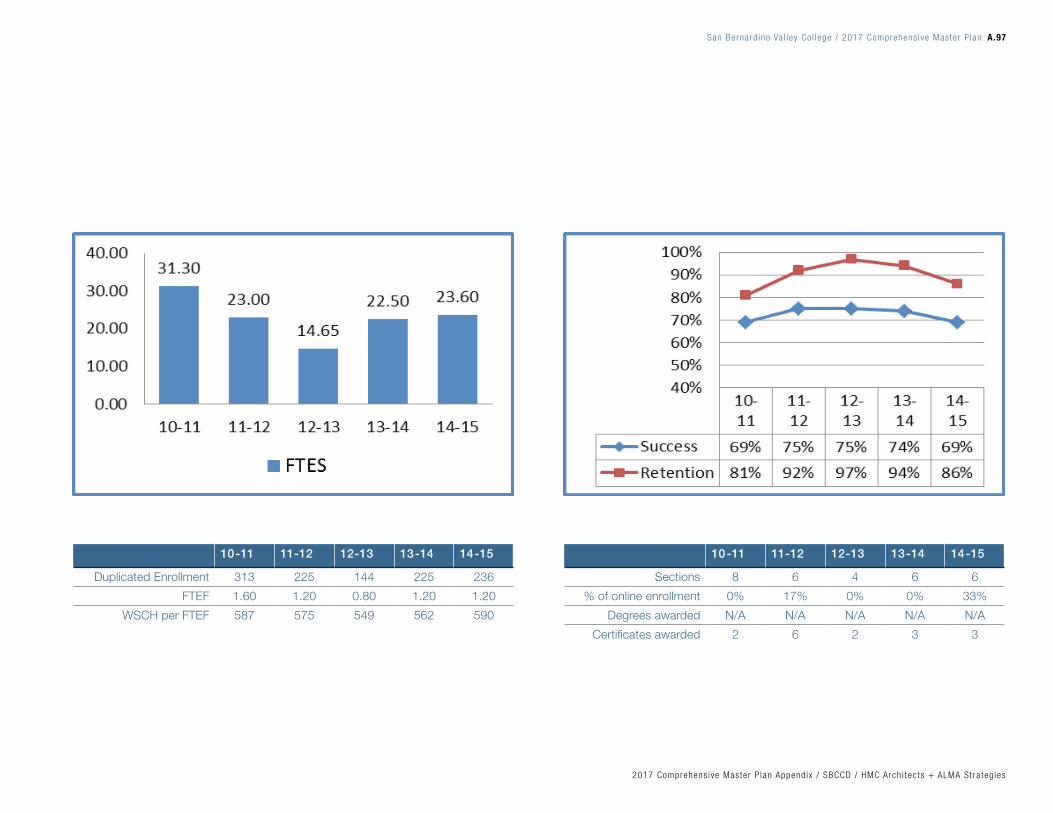
10-11 11-12 12-13 13-14 14-15
Duplicated Enrollment 313 225 144 225 236
FTEF 1.60 1.20 0.80 1.20 1.20
WSCH per FTEF 587 575 549 562 590
10-11 11-12 12-13 13-14 14-15
Sections 8 6 4 6 6
% of online enrollment 0% 17% 0% 0% 33%
Degrees awarded N/A N/A N/A N/A N/A
Certificates awarded 2 6 2 3 3
San Bernard ino Va l l ey Co l lege / 2017 Comprehens ive Mas te r P lan A.97
2017 Comprehens ive Mas te r P lan Append ix / SBCCD / HMC Arch i tec ts + ALMA St ra teg ies

ECONOMICS – 2014-2015
Description: › Economics provides excellent preparation for
careers in industry, government, and many
professions including management, law, education,
public administration and consulting. Economics is
concerned with how people produce various goods
and services, with scarce resources, and how
these are distributed within society, now and in the
future.
Assessment: › Since 2011-2015:
› FTES has grown by 13%.
› Duplicated enrollment has increased 12%.
› FTEF has improved by 8%.
› WSCH per FTEF increased by 4%.
› Success rates have remained similar high 60s
to low 70s.
› Retention rates have also remained fairly
constant at high 80s to low 90s.
› The percent of online enrollment has improved
by five percentage points.
Department Goals: › To work with department faculty and curriculum
committee to insure all courses transfer for credit to
all colleges and universities.
› To review SLOs for all economic courses.
› To provide tutors early in the semesters.
› To continue to select high quality low priced text
books.
Challenges & Opportunities: › The biggest challenge is to secure a computer lab
for our business and economics statistics classes.
The division does not have one single computer
lab to support this course and has relied on other
divisions for a lab room. This does not always work
out well.
› Our greatest opportunity is to serve the growing
number of economics students.
Action Plan: › To work with colleagues and the program review
committee to secure a computer lab for the
division.
› Work with curriculum committee, department and
division to insure all courses in economics transfer
for credit.
› Review all SLOs.
› Work with tutor center so tutors are available.
› Hold monthly meetings to monitor progress.
Individual Data Sheets By Division
SOCIAL SCIENCE (INSTRUCTION) (cont.)
San Bernard ino Va l l ey Co l lege / 2017 Comprehens ive Mas te r P lanA.98
2017 Comprehens ive Mas te r P lan Append ix / SBCCD / HMC Arch i tec ts + ALMA St ra teg ies

10-11 11-12 12-13 13-14 14-15
Duplicated Enrollment 1,069 982 1,025 1,078 1,104
FTEF 5.34 5.14 4.94 5.34 5.53
WSCH per FTEF 613 583 650 607 609
10-11 11-12 12-13 13-14 14-15
Sections 28 27 28 30 31
% of online enrollment 29% 30% 36% 33% 35%
Degrees awarded N/A N/A N/A N/A
Certificates awarded N/A N/A N/A N/A
San Bernard ino Va l l ey Co l lege / 2017 Comprehens ive Mas te r P lan A.99
2017 Comprehens ive Mas te r P lan Append ix / SBCCD / HMC Arch i tec ts + ALMA St ra teg ies

HEALTH EDUCATION – 2014-2015
Description: › The health education department offers transfer
level courses that fulfill general education
requirements for local universities and colleges.
Additionally, the department courses fulfill a general
education requirement for the SBVC associates
degrees. Health 101 is a required course for the
newly created AA degree starting in fall 2016.
Health courses provide students with guidelines
for healthy living, which may improve their overall
health and quality of life.
Assessment: › Enrollment slightly declined from 2010-11 to 2011-
12 before increasing again starting in 2012-13. The
drop in enrollment is consistent with the budget
decreases. Enrollment continues to increase
as sections are added. Health is a very strong
program offering students a way to fulfill the degree
requirements without having to exercise.
› Success rates have remained relatively steady
until the 2014-15 year dropping to 63%. Faculty
have discussed a possible reasons for decreased
success. High text cost is a possible reason for
decreased success. Students are struggling to
afford the text. Many students rely on sharing the
text, using older versions and/or utilizing reserve
texts at library. Retention rates remain steady.
Department Goals: › To increase number of sections offered as budget
allows and demand requires.
› To provide a diverse course offering to allow for
nontraditional students by giving varying times/
days/formats for enrollment.
› To add courses to the pallete of available classes
as college increases sections. A possible course to
include is holistic health.
Challenges & Opportunities: › The variety of courses offered is somewhat limited
by the lack of curriculum and section additions.
› Department needs to hire a replacement position
for a retiree with a background as a generalist.
› Use professional development resources to
encourage faculty to develop new courses the
represent current trends in health education.
› Many students are unwilling to participate in
“activity” classes so enrollment in health is high.
Capture this trend by increasing sections.
› Our student population demographics correlate
with a higher incidence of lifestyle related illnesses.
Education is essential to improve health and
wellbeing of students, their families and our
community.
Action Plan: › Develop new courses.
› Develop relationships with departments across
campus to create more collaborative opportunities
for healthy lifestyle development.
› Continue to search for alternative text options to
lower cost to student.
› Network with other departments on campus to
help promote enrollment.
› Hire a new faculty member with diverse expertise
to spearhead new curriculum development and
enrollment expansion.
Individual Data Sheets By Division
SOCIAL SCIENCE (INSTRUCTION) (cont.)
San Bernard ino Va l l ey Co l lege / 2017 Comprehens ive Mas te r P lanA.100
2017 Comprehens ive Mas te r P lan Append ix / SBCCD / HMC Arch i tec ts + ALMA St ra teg ies

10-11 11-12 12-13 13-14 14-15
Duplicated Enrollment 789 709 821 880 1046
FTEF 3.80 3.40 4.00 4.20 5.20
WSCH per FTEF 624 624 638 629 600
10-11 11-12 12-13 13-14 14-15
Sections 19 17 20 21 27
% of online enrollment 26% 29% 35% 38% 41%
Degrees awarded N/A N/A N/A N/A N/A
Certificates awarded N/A N/A N/A N/A N/A
San Bernard ino Va l l ey Co l lege / 2017 Comprehens ive Mas te r P lan A.101
2017 Comprehens ive Mas te r P lan Append ix / SBCCD / HMC Arch i tec ts + ALMA St ra teg ies

HISTORY – 2014-2015
Description: › The history department offers a variety of transfer
level courses to serve a diverse community of
learners. Course offerings include US history
courses, including two honors courses, which meet
the Cal State requirement for American Institutions.
Additionally, multicultural courses are offered
including Native American history, Chicano history,
African American history (2 courses), World history,
and an Ethnic Minorities course. We have created
a course that analyzes the History of Genocide
that was created in partnership with Rialto School
District. All of our courses can be used for AA
requirements and all transfer to universities. Most
importantly, we have developed a transfer history
major (AA-T) for our prospective history majors.
Assessment: › In the past year, we have increased our section
offerings from 87 to 94, and we have dramatically
increased our FTES from 309.56 to 333.14.
Duplicated enrollment reflects this increase from
3,099 to 3,335. WSCH/FTEF has stayed at
essentially the same level (580-574).
› In terms of retention, we have stayed the same at
the impressive level of 88%. These statistics show
that the department does an excellent job keeping
students engaged in their attempts to complete
the course. Success rates dropped a small amount
from 68% to 65%, but that can be explained by the
increased numbers of online sections, which are
known campus-wide to have a lower success rate.
› This is an extremely successful department in terms
of our enrollment, retention, and success rates
considering that all of our coursework is transfer
level and all courses meet degree requirements.
Department Goals: › We met several department goals in a productive
year.
› We updated all coursework for program review, at
least a semester early in all cases.
› We had our AA-T History Degree accepted through
the curriculum process.
› A new course on Genocide has been developed, in
a partnership with Rialto Unified School District.
› Two new adjunct were hired to help support the
increase in our course offerings.
Challenges & Opportunities: › The greatest challenge is finding faculty who can
teach World History. The majority of our current
and prospective faculty do not have the necessary
specialization to teach World History. Currently, we
have US historians teaching World History simply
to be able to offer the course. There are two World
History courses that are required for our AA-T
degree in History. We are struggling to meet the
demand for these courses, and as students begin
to enroll in this class for our degree, we will be hard
pressed to have the World specialists we need to
offer these courses. We are developing a Women
in United States history course that will also need a
specialist to teach that course.
› In terms of opportunities, we are working with
the counseling department to develop an Ethnic
Studies program that can develop into another
AA-T degree. Considering that UCR has an Ethnic
Studies major, we feel that this is an appropriate
transfer program.
Action Plan: › Hire a full time World History faculty member.
› Continue recruitment and professional development
of current history department faculty.
› Have the Women in US History course accepted
through the curriculum process this year.
› Continue completion of SLOs and SLO evaluation.
Individual Data Sheets By Division
SOCIAL SCIENCE (INSTRUCTION) (cont.)
San Bernard ino Va l l ey Co l lege / 2017 Comprehens ive Mas te r P lanA.102
2017 Comprehens ive Mas te r P lan Append ix / SBCCD / HMC Arch i tec ts + ALMA St ra teg ies

10-11 11-12 12-13 13-14 14-15
Duplicated Enrollment 3,230 2,754 2,981 3,099 3,335
FTEF 16.40 14.20 14.80 16.00 17.40
WSCH per FTEF 586 597 615 580 574
10-11 11-12 12-13 13-14 14-15
Sections 83 73 77 87 94
% of online enrollment 36% 36% 38% 37% 39%
Degrees awarded N/A N/A N/A N/A N/A
Certificates awarded N/A N/A N/A N/A N/A
San Bernard ino Va l l ey Co l lege / 2017 Comprehens ive Mas te r P lan A.103
2017 Comprehens ive Mas te r P lan Append ix / SBCCD / HMC Arch i tec ts + ALMA St ra teg ies

KINESIOLOGY/ATHLETICS – 2014-2015
Description: › Courses in kinesiology and health department are
designed to increase student’s skills in activities
that produce positive physiological results and
promote lifelong habits in fitness. Varsity classes
allow students to perform at maximum levels while
competing in intercollegiate sports. Kin-X classes
satisfy the kinesiology requirement for graduation
and, or transfer.
Assessment: › Kinesiology (Kin-X) shows a substantial increase
from the 13-14 to the 14-15 years with the same
amount of section offered. Possible reason for the
increase is the concerted effort of our coaching
staff to raise the number of recruits/participants of
each sport. In the past couple of years coaches
have intensified their recruiting efforts. The high
success rate of our programs is directly related to
the coaches recruiting efforts.
› Retention and success rate continue to be
extremely high. This is also a reflection of how well
our coaching staff preforms in the class/practice
setting.
› Data shows effectiveness of the Kin-X classes.
Department Goals: › To increase opportunities for students to participate
in intercollegiate sports.
› To increase graduation and transfer rates.
› To become fully compliant with Title IX.
› To add more full-time faculty to our coaching staff.
› To add more support staff to our department.
› To increase the budget to meet the yearly increase
in cost of basic day to day operations.
Challenges & Opportunities: › If the athletic department is to build upon the
success it has experienced in the past, it will need
to meet every goal stated above.
› The data clearly shows if we are to increase our
numbers we need to increase our support for our
students.
Action Plan: › Continue to participate in the program review
process.
› Become more transparent, open and informative.
› Develop a complete academic support program for
our student/athletes.
› Develop collaborative relationships with other
program on campus.
› Strengthen relationships with the foundation,
alumni and the community.
› Continue and increase our fundraising efforts.
Individual Data Sheets By Division
SOCIAL SCIENCE (INSTRUCTION) (cont.)
San Bernard ino Va l l ey Co l lege / 2017 Comprehens ive Mas te r P lanA.104
2017 Comprehens ive Mas te r P lan Append ix / SBCCD / HMC Arch i tec ts + ALMA St ra teg ies

10-11 11-12 12-13 13-14 14-15
Duplicated Enrollment 479 382 370 347 644
FTEF 4.32 5.28 5.76 5.71 8.58
WSCH per FTEF 1,042 721 639 615 525
10-11 11-12 12-13 13-14 14-15
Sections 47 40 45 45 31
% of online enrollment 0% 0% 0% 0% 0%
Degrees awarded N/A N/A N/A N/A N/A
Certificates awarded N/A N/A N/A N/A N/A
San Bernard ino Va l l ey Co l lege / 2017 Comprehens ive Mas te r P lan A.105
2017 Comprehens ive Mas te r P lan Append ix / SBCCD / HMC Arch i tec ts + ALMA St ra teg ies
KINESIOLOGY: TEAM/FITNESS/ADAPTED –
2015-2015
Description: › The kinesiology department offers a variety of
laboratory courses which offer students the
opportunity to improve their current health/fitness
levels while acquiring the skills to promote a lifelong
wellness lifestyle. All of the courses can be used
for electives in Category V: which is required for
graduation and/or transfer.
Assessment: › Enrollment is gradually decreasing throughout
the years represented. Some of the decrease is
reflective of the budget cuts seen across campus
which resulted in fewer sections offered. The
decreases may also be due in part to the transfer
of many sections to the KINX courses.
› Success and retention rates are stable and
acceptable.
› The efficiency rate of the department is still
relatively high with a WSCH of 586.
Department Goals: › To expand sections for more popular courses.
› To increase the variety of courses offered through
the development of new courses to stay current
with popular trends.
› To purchase a variety of equipment to allow more
students to participate safely.
Challenges & Opportunities: › Since we have leveled the courses, students may
only take each course one time which will limit the
number of students who can participate in our
courses.
› Sharing the gym spaces with dance has limited our
ability to schedule classes in our facilities
› Construction has decreased visibility and access
to our area. Fencing, lack of signage and reduced
locker/shower access has decreased enrollment
› Expand programs and services for the disabled
population. We have a faculty member with
expertise in this area that can work with curriculum
and DSPS for funding and recommendations
› New facilities opening in Fall 2016 shoud help
create a resurge of activity class enrollment
Action Plan: › Develop new courses.
› Develop relationships with departments across
Individual Data Sheets By Division
SOCIAL SCIENCE (INSTRUCTION) (cont.)
campus to create more collaboration opportunities
for healthy lifestyles.
› Discuss expanded course development with DSPS.
› Follow-up on sharing the MAC classroom.
› Advertise and develop more team sports to capture
enrollment for sport related classes.
San Bernard ino Va l l ey Co l lege / 2017 Comprehens ive Mas te r P lanA.106
2017 Comprehens ive Mas te r P lan Append ix / SBCCD / HMC Arch i tec ts + ALMA St ra teg ies

10-11 11-12 12-13 13-14 14-15
Duplicated Enrollment 3,299 2,697 2,759 2,680 2,015
FTEF 12.32 10.22 10.75 11.46 10.30
WSCH per FTEF 802 845 818 701 586
10-11 11-12 12-13 13-14 14-15
Sections 88 73 77 81 202*
% of online enrollment 0% 0% 0% 0% 0%
Degrees awarded N/A N/A N/A N/A N/A
Certificates awarded N/A N/A N/A N/A N/A
*Includes all sections of team, fitness, and adapted kinesiology courses.
San Bernard ino Va l l ey Co l lege / 2017 Comprehens ive Mas te r P lan A.107
2017 Comprehens ive Mas te r P lan Append ix / SBCCD / HMC Arch i tec ts + ALMA St ra teg ies
KINESIOLOGY – 2014-2015
Description: › The kinesiology department offers a variety of
lecture based courses that provide students
with foundational knowledege in fitness, sport,
physical education, athletics and related fields.
The classes result in improvements in conditioning,
performance for self or teams and/or training for
career opportunities in related fields. All of the
courses can be used for electives in Category V,
which is required for graduation and/or transfer.
Some KIN courses are required or electives for the
KIN AA and AA-T degrees starting fall 2016.
Assessment: › Enrollment slightly decreased 10/11 to 11/12 with
gradual increases through 13/14.
› There was an enrollment decline in 14/15.
› Success rates and retention rates remain relatively
stable.
› Both rates represent good retention and success.
› The efficiency rate is low with a WSCH of 442.
Department Goals: › To increase number of sections offered as
registration rates improve with the addition of the
degrees to the program.
› To pursue offering courses in hybrid or online
formats to possibly improve enrollment.
› To increase the variety of courses offered through
the development of new courses.
Challenges & Opportunities: › The variety of courses offered is somewhat limited.
› A lack of smart classroom space limits our ability to
offer more sections of our courses.
› Offering online, hybrid or ITV courses is a possible
avenue for making more courses available.
› Explore the possibility of creating personal trainer
certification programs.
› Changing our certification agency for CPR/First
Aid to Red Cross or American Heart Association
to capture our Nursing Program and Loma Linda
student enrollment.
Action Plan: › Develop new courses.
› Develop relationships with departments across
campus to create more collaboration opportunities
for healthy lifestyles.
› Acquire proper smart classroom space in order to
offer more sections.
› Adjust schedule to provide more diverse offerings
to capture non-traditional student enrollment.
› Pursue certification of faculty in CPR to more
recognized agency through professional
development.
› Advertise new courses and degree programs
across campus to increase enrollment.
Individual Data Sheets By Division
SOCIAL SCIENCE (INSTRUCTION) (cont.)
San Bernard ino Va l l ey Co l lege / 2017 Comprehens ive Mas te r P lanA.108
2017 Comprehens ive Mas te r P lan Append ix / SBCCD / HMC Arch i tec ts + ALMA St ra teg ies

10-11 11-12 12-13 13-14 14-15
Duplicated Enrollment 614 602 612 667 395
FTEF 3.93 3.93 3.92 4.05 2.89
WSCH per FTEF 531 520 538 554 442
10-11 11-12 12-13 13-14 14-15
Sections 24 21 21 22 14
% of online enrollment 0% 0% 0% 0% 0%
Degrees awarded N/A N/A N/A N/A N/A
Certificates awarded N/A N/A N/A N/A N/A
San Bernard ino Va l l ey Co l lege / 2017 Comprehens ive Mas te r P lan A.109
2017 Comprehens ive Mas te r P lan Append ix / SBCCD / HMC Arch i tec ts + ALMA St ra teg ies

PHILOSOPHY/RELIGIOUS STUDIES – 2014-2015
Description: › Philosophy and religious studies courses require
critical analysis of ideas, clarity of thought, and
openness to understanding the human project
in all its dimensions. These skills are achieved
through careful and close reading of texts, images,
and symbols, as well as through descriptive and
analytic writing. Although anyone can benefit from
courses in the two disciplines, the primary function
of each class is to fill requirements for students
transferring to four-year colleges.
Assessment: › FTES vary depending on the sections offered.
FTES are now stable after several years of cutting
sections.
› Retention and success rates are both stable
and mirror the rates for both the college and the
division.
› WSCH per FTEF vary slightly but are stable.
› Percentage of online enrollment is now stable at
approximately 60%.
Department Goals: › Offer at least one online section of every course
offered each semester.
› Offer at least 50% of sections online each
semester.
› Improve success and retention by 2% between fall
and spring semesters.
› Publicize and market the AA-T in Philosophy to
interested students.
Challenges & Opportunities: › The primary challenge and opportunity is
to imagine, create, and deliver high-quality
undergraduate educational opportunities at a time
in the culture when resources and support for
public higher education have been reduced over
the last several years.
› As a leader in online learning at the college, a
challenge and opportunity is to learn from the
increasing MOOC movement to maintain and
improve the quality of our online offerings.
Action Plan: › Publicize and market the AA-T in Philosophy.
› Develop departmental strategies for improving
success and retention.
Individual Data Sheets By Division
SOCIAL SCIENCE (INSTRUCTION) (cont.)
› Work collegially with other departments in the
division to improve success and retention.
San Bernard ino Va l l ey Co l lege / 2017 Comprehens ive Mas te r P lanA.110
2017 Comprehens ive Mas te r P lan Append ix / SBCCD / HMC Arch i tec ts + ALMA St ra teg ies
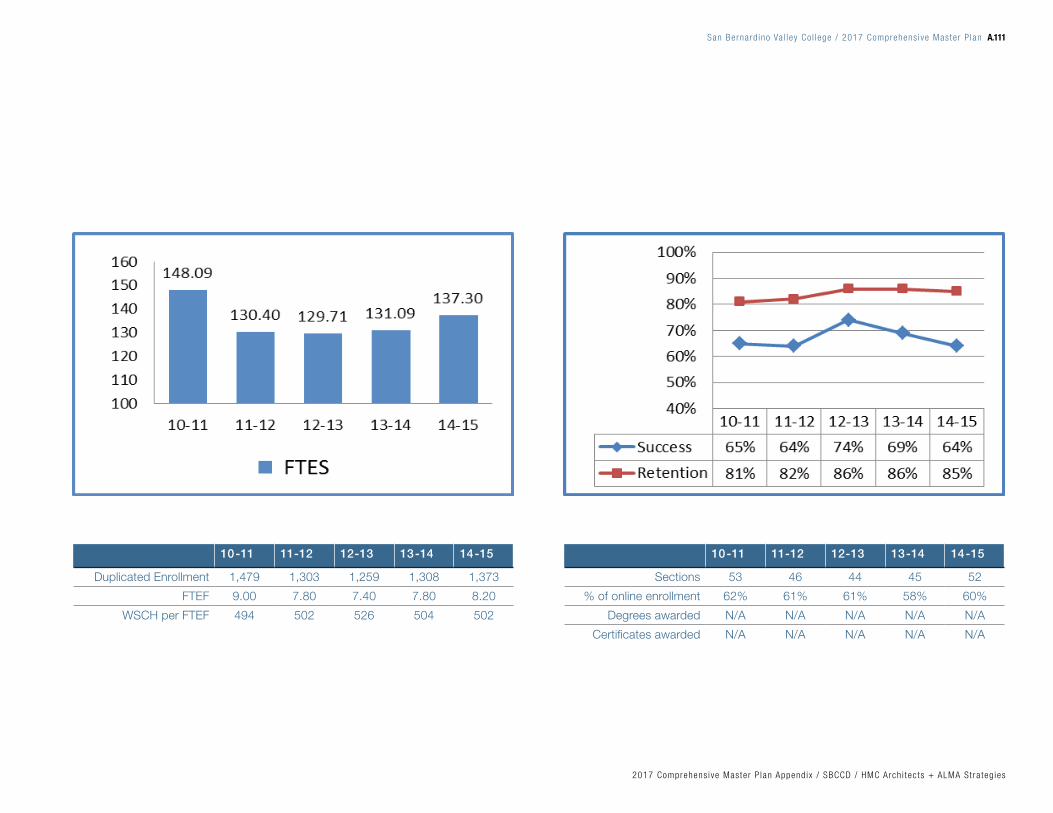
10-11 11-12 12-13 13-14 14-15
Duplicated Enrollment 1,479 1,303 1,259 1,308 1,373
FTEF 9.00 7.80 7.40 7.80 8.20
WSCH per FTEF 494 502 526 504 502
10-11 11-12 12-13 13-14 14-15
Sections 53 46 44 45 52
% of online enrollment 62% 61% 61% 58% 60%
Degrees awarded N/A N/A N/A N/A N/A
Certificates awarded N/A N/A N/A N/A N/A
San Bernard ino Va l l ey Co l lege / 2017 Comprehens ive Mas te r P lan A.111
2017 Comprehens ive Mas te r P lan Append ix / SBCCD / HMC Arch i tec ts + ALMA St ra teg ies

POLITICAL SCIENCE – 2014-2015
Description: › The political science department offers courses
that are transferrable to the UC and CSU systems.
In addition, it offers an AA-T degree under the
transfer model curriculum which allows a student
to simultaneously earn an AA degree and be able
to transfer to CSU as a junior. Political science
courses help to prepare students for careers in
government (including the foreign and national
security bureaucracy), politics, law, journalism,
business, teaching, industry, and community
relations.
Assessment: › Political science continues to register growth in
student enrollment; 2014-15 FTEs recorded a slight
rise over the previous year’s strong showing.
› Efficiency dropped significantly from 614 in 2013-
14 to 546 in 2014-15. This precipitous decline is
hard to explain. However, it may be explained in
part by our having to cancel POLIT 141-H when
we were informed belatedly that the articulation
process with UCR had not been done.
› Success rate took a dip from 64% in 2013-14 to
61% in 2014-15. This is worrisome since it is the
second time in a row we witnessed a dip. Joining
the supplemental instruction (SI) program has
enabled the department to get a tutor for political
science classes. Hopefully, this will help stop the
downward slide—or at least slow it down to a
crawl.
› Retention rate also saw a dip, but is still higher than
the 2010-11 and 2011-12 levels. While it is not
what I like to see, it is not cause for major concern
at present.
› The number of sections we offered rose by 13%
over 2013-14 level. We hope to maintain or exceed
this achievement in the next cycle.
› At 20% of enrollment, our online enrollment held
steady at last year’s level. We hope to maintain or
exceed this level during the next cycle.
› In 2013-14 we got approved to offer an AA-T
degree. Since then we have awarded two degrees.
This is the first time to my knowledge that the
department has awarded any degree. We will work
to raise that number sharply.
Department Goals: › Increase the number of degrees awarded in political
science. In this respect, raising awareness of our
AA-T program remains a goal from the last cycle.
› Create an internship program for our students who
enroll in POLIT 139. This course is one of the two
service learning courses we offer.
› Raise the number of sections offered—or at least
maintain current levels; and promote student
success and retention rates.
› Create a Model United Nations program, if we can
get funding commitment from the college for the
first two to three years of the program. During that
time, we will explore alternative avenues of support.
› Create two courses in Constitutional Law/Politics.
This should increase our offerings and raise the
appeal of our AA-T program. We have had in the
past instructors with a background in law and
politics who could teach such courses. We can hire
new ones at the appropriate time.
Challenges & Opportunities: › Our main challenge is to increase the number of
students who major in Political science. If we can
achieve this, it will give us grounds to create new
Political science courses—and raise the levels of
enrollment in existing courses. We are more likely,
for example, to create courses in Constitutional
Law and Politics in California if we had more
Individual Data Sheets By Division
SOCIAL SCIENCE (INSTRUCTION) (cont.)
San Bernard ino Va l l ey Co l lege / 2017 Comprehens ive Mas te r P lanA.112
2017 Comprehens ive Mas te r P lan Append ix / SBCCD / HMC Arch i tec ts + ALMA St ra teg ies

10-11 11-12 12-13 13-14 14-15
Duplicated Enrollment 1,800 1,631 1,720 1,674 1,726
FTEF 9.20 8.60 8.40 8.58 9.71
WSCH per FTEF 572 576 625 614 546
10-11 11-12 12-13 13-14 14-15
Sections 48 45 45 45 51
% of online enrollment 19% 20% 22% 20% 20%
Degrees awarded N/A N/A N/A N/A 2
Certificates awarded N/A N/A N/A N/A N/A
*A.A.-T Degrees were established in 2013.
San Bernard ino Va l l ey Co l lege / 2017 Comprehens ive Mas te r P lan A.113
2017 Comprehens ive Mas te r P lan Append ix / SBCCD / HMC Arch i tec ts + ALMA St ra teg ies

Individual Data Sheets By Division
SOCIAL SCIENCE (INSTRUCTION) (cont.)
POLITICAL SCIENCE – 2014-2015 (cont.)
students majoring in Political science. (Right now,
our course in American Government and Politics is
the only course in high demand because it is one of
the courses required for graduation.)
› A long-standing challenge noted in 2013-14, is the
less-than-satisfactory compensation our adjunct
colleagues receive. If we want to obtain and
maintain a faculty with an élan and esprit de corps,
we need to continue to place this issue on the front
burner.
› With respect to opportunities, the expected
increases in allocations the college will receive from
the state is a sign of hope. We also hope to locate
some modest funding for a Model United Nations
program.
Action Plan: › Step up collaborative efforts with counselors and
the associated student government to attract
students into political science.
› Continue to work with the SI program so that we
can maintain a tutor for our courses which will help
maintain student success and retention rates.
› Ask every department instructor to let students
know the career possibilities for political science
majors and to make a pitch for political science in
their classes. (Political science is a good brand!)
› Seek insights from departments in the division
which already have internship programs on
how this department can go about creating an
internship program for POLIT 139.
San Bernard ino Va l l ey Co l lege / 2017 Comprehens ive Mas te r P lanA.114
2017 Comprehens ive Mas te r P lan Append ix / SBCCD / HMC Arch i tec ts + ALMA St ra teg ies

San Bernard ino Va l l ey Co l lege / 2017 Comprehens ive Mas te r P lan A.115
2017 Comprehens ive Mas te r P lan Append ix / SBCCD / HMC Arch i tec ts + ALMA St ra teg ies

PSYCHOLOGY – 2014-2015
Description: › Psychology offers classes that meet general
education requirements for AA degrees and
transfer as well as classes that are prerequisites
for career and technical programs such as nursing
and psych tech. The AA-T in Psychology provides
students with a clear path to transfer to CSU. The
psychology program has made contributions to the
strategic plan goals of 1. Access and 2. Student
Success despite having only one full time faculty
member.
Assessment: › Faculty load, FTEF, success rates and WSCH/FTEF
demonstrate the urgent need for at least four more
full time faculty
› Efficiency rates remain high rates despite section
cuts
› Fluctuating FTES rates are based on section cuts
› Success rates have improved 6% since 09-10,
however, success rates will continue to be low
without more full time faculty
› Retention rates have improved 10% since 09-10
› The 11 degrees awarded in 13-14 are on par with
other division disciplines that offer degrees
› Number of online sections slightly increased to
23% and this has impacted success rates
Department Goals: › To increase strategic plan goals, 1. Access and 2.
Student Success by:
› Hiring at least four more full time faculty (with at
least one faculty in 14-15 specializing in teaching
research methods and statistics, which are core
courses for the AA-T in Psychology)
› Developing and implementing strategies for
increasing student success in psychology classes
› Having a computer lab available for students taking
statistics classes (also a general ed requirement)
and research methods classes to help increase
Student Success and AA-T degree achievement
› Increasing the number of sections offered for
general ed and core classes in the AA-T and
maintain an updated curriculum.
Challenges & Opportunities: › To hire at least one new full time faculty in 14-
15 capable of teaching Statistics and Research
Methods classes (with 4 total future hires)
› To develop and implement strategies to continue
to improve student success rates and maintain
retention rates as course offerings increase
› To have a computer lab for Statistics and Research
Methods classes that can also be used by other
disciplines in the division to support Student
Success
› To continue to offer quality instruction and diversity
in course offerings with a department consisting of
93% adjunct faculty
Action Plan: › To increase access and student success by
submitting requests for more psychology full-time
faculty hires
› To improve student success rates while maintaining
retention rates by requesting a computer lab in
SSHDPE and support other faculty with similar
requests
› To increase access and student success by offering
more courses that help students meet general ed
requirements and Psychology AA-T requirements
› To work with adjunct faculty to develop strategies
to increase student success.
Individual Data Sheets By Division
SOCIAL SCIENCE (INSTRUCTION) (cont.)
San Bernard ino Va l l ey Co l lege / 2017 Comprehens ive Mas te r P lanA.116
2017 Comprehens ive Mas te r P lan Append ix / SBCCD / HMC Arch i tec ts + ALMA St ra teg ies

09-10 10-11 11-12 12-13 13-14
Duplicated Enrollment 3,199 2,985 2,511 2,434 2,434
FTEF 15.20 15.20 12.60 12.20 12.40
WSCH per FTEF 635 586 620 617 587
09-10 10-11 11-12 12-13 13-14
Sections 82 80 68 65 66
% of online enrollment 18% 20% 19% 20% 23%
Degrees awarded N/A N/A N/A N/A 11
Certificates awarded N/A N/A N/A N/A N/A
*A.A.-T Degrees were established in 2013.
San Bernard ino Va l l ey Co l lege / 2017 Comprehens ive Mas te r P lan A.117
2017 Comprehens ive Mas te r P lan Append ix / SBCCD / HMC Arch i tec ts + ALMA St ra teg ies

SOCIOLOGY – 2014-2015
Description: › Sociology is a social science involving the study
of societies. Through analyses of society, its
institutions, groups, processes, and social lives of
people, sociologists attempt to understand and
predict social interactions and change. Sociology
prepares students for further study of and careers
in social work and counseling, social services,
probation, corrections, law enforcement, research,
public policy, law, education, and other fields
which require an understanding of social life. The
sociology program includes basic introductory
courses in sociology, social problems, institutions,
and social inequality.
Assessment: › FTES have been steadily increasing as the college
district is funding additional class sections.
› WSCH/FTEF continues to remain above the 525
average. Both success and retention rates have
dipped from previous year and this is most likely
due to the increased availability of courses to
students. Still, the dip in the success rate is a major
concern for the department.
› The department also continues to offer half of its
course offerings online and online success rates
tend to be lower when compared to F2F classes.
› The program now offers an AA-T degree in
sociology and there was a 42% increase in degree
attainment year-year.
Department Goals: › Long term planning of course offerings to increase
access to students seeking transfer degree and
student success rates.
› Monitor how new advisories which were placed on
sociology courses are impacting student success
rates.
› Promote the AA-T sociology degree to increase
productivity.
› Continue to advocate for a full time sociology
instructor through the program review needs
assessment processes.
› Continue to monitor SLO data as it relates to
student success.
› Continue to develop strategies to increase retention
and success.
Challenges & Opportunities: › Physical classroom space is limited and
subsequently the program offers a higher number
of sections online.
› The program continues to operate with only full
time instructor.
› Campus wide resources continue to be scarce.
› The 2015-16 academic year is the first year in
which all sociology courses have both English and
Math advisories. This presents an opportunity for
an increase in student success rates.
› The district goals include the hiring of additional
new full time instructors and the college budget has
a surplus. There is an opportunity for the sociology
program to be the beneficiary of some of these
resources.
Action Plan: › Continue to move more online sections to on-
campus and monitor enrollment trends.
› Continue to increase access to students seeking
AA-T degree by offering non SOC 100 courses
on-campus.
› Submit needs assessment paperwork requesting
instructor.
› Continue to participate in the sociology peer-tutor
program and encourage all program faculty to
utilize services.
› Continue SLO assessment and evaluation.
› Modify departmental Blackboard shell and
encourage faculty to make contributions.
Individual Data Sheets By Division
SOCIAL SCIENCE (INSTRUCTION) (cont.)
San Bernard ino Va l l ey Co l lege / 2017 Comprehens ive Mas te r P lanA.118
2017 Comprehens ive Mas te r P lan Append ix / SBCCD / HMC Arch i tec ts + ALMA St ra teg ies

10-11 11-12 12-13 13-14 14-15
Duplicated Enrollment 1,517 1,303 1,315 1,472 1,505
FTEF 8.00 6.80 6.80 7.40 7.60
WSCH per FTEF 567 574 591 594 594
10-11 11-12 12-13 13-14 14-15
Sections 42 36 36 40 40
% of online enrollment 48% 50% 50% 48% 48%
Degrees awarded* N/A N/A N/A 12 17
Certificates awarded N/A N/A N/A N/A N/A
*A.A.-T Degrees were established in 2013
San Bernard ino Va l l ey Co l lege / 2017 Comprehens ive Mas te r P lan A.119
2017 Comprehens ive Mas te r P lan Append ix / SBCCD / HMC Arch i tec ts + ALMA St ra teg ies

Individual Data Sheets By Division
STUDENT SERVICES
ADMISSIONS & RECORDS – 2014-2015
Description: › Admission to the college & registration
› Residency determination
› Evaluation of prior credit
› Evaluation of graduation requirements
› Maintenance of student academic records in
perpetuity
› Processing of grade changes, incompletes
› Processing of add/drop
› Late add petitions
› Veteran’s certification, information, and referral
› Online application, registration, and transcript
request services
› Petitions for Academic Exception
› Eligibility determination of concurrently enrolled high
school students
› Acceptance of payment for enrollment and auxiliary
fees
› Adjudicating and processing petitions for academic
exception
› Adjudicating and processing petitions for
readmission
› Requests for background checks in accordance
with FERPA
› Response to subpoenas in accordance with FERPA
› Welcome letters sent to every new applicant
› Drops for nonpayment
› Reinstatement of registration
› Communication with faculty and campus about
important admissions, records, and registration
deadlines and processes
Assessment: › Table 1 shows the number of petitions:
readmissions & academic exceptions reviewed and
processed within the last year.
› Table 2 shows the number of late adds we process
per term after the initial two-week add period.
› Table 3 shows the number of first-time students
enrolled for the 2014-15 year.
Program Goals: › More staff professional development participation
San Bernard ino Va l l ey Co l lege / 2017 Comprehens ive Mas te r P lanA.120
2017 Comprehens ive Mas te r P lan Append ix / SBCCD / HMC Arch i tec ts + ALMA St ra teg ies

› Improve and streamline the prerequisite clearance
process
› Improve technology services in admissions &
records
› Increase customer service efficiency
› Challenges and Opportunities:
› Staffing: funding issues and support are ongoing
challenges
› Physical conditions: carpet needs replacing and
front counter space too high is another challenge.
› Opportunities for innovation and partnership
abound
Action Plan: › Increase use of electronic communication with
students
› Reduce the number of late-add petitions that are
processed per term
San Bernard ino Va l l ey Co l lege / 2017 Comprehens ive Mas te r P lan A.121
2017 Comprehens ive Mas te r P lan Append ix / SBCCD / HMC Arch i tec ts + ALMA St ra teg ies

CalWORKS – 2014-2015
Description: › CalWORKs is the welfare reform program
established January 1998 by Assembly Bill (AB)
1542. San Bernardino Valley College CalWORKs
program is designed to assist students receiving
county CalWORKs to enhance and achieve their
educational goals and employment self-sufficiency.
Qualified students are eligible to receive the
following services: book vouchers, book loans,
access to computer lab, parking permit vouchers,
gas cards, child care assistance, educational
counseling, and employment assistance.
Assessment: › Data captured at the State Chancellor’s Office
indicates the program made a significant enrollment
increase for fiscal year 2013-14 compared to
fiscal year 2012-13. The SBVC CalWORKs
program enrollment was increased by an additional
156 students for the 2013-14 fiscal year; thus,
increasing the CalWORKs allocation for the 2014-
15 fiscal year.
› The CalWORKs program provides supportive
services to over300 students, male and female
from different age groups and ethnicities as well as
students with disabilities.
Department Goals: › Increase job placement (ongoing)
› Increase program enrollment (ongoing)
› Increase educational goal completion (ongoing)
Challenges & Opportunities: › Challenges: Tracking completion of certificate,
degree and transfer rates for CalWORKs students
(data captured by SBVC Research and Planning
Department).
› “Same-Day-Pay” process continues to impact
CalWORKs students’ course enrollment. Students
are continually dropped due to non-payment.
› Opportunities: Priority registration has afforded
CalWORKs students the opportunity to enroll
in courses to accommodate their educational
timeline.
› Due to the success of last year’s free tax
preparation service, San Bernardino County
Transitional Assistance Department (TAD) partnered
with SBVC again to provide free tax preparation
services through their Volunteer Income Tax
Assistance Program (VITA) for the 2015 tax season.
Action Plan: › Continue to obtain data from the Research and
Planning Department to assist in identifying the
cause of the decline in CalWORKs graduates.
› Probe administration to seek possible remedy for
“Same-Day-Pay” issue that affects CalWORKs
student enrollment status.
Individual Data Sheets By Division
STUDENT SERVICES (cont.)
San Bernard ino Va l l ey Co l lege / 2017 Comprehens ive Mas te r P lanA.122
2017 Comprehens ive Mas te r P lan Append ix / SBCCD / HMC Arch i tec ts + ALMA St ra teg ies

Annual 2012-2013 Annual 2013-2014
Student Count Student Count
San Bernardino Total 306 462
County-Referred Program Participant 84 173
Exempt Program Participant 38 42
Self-Initiated Program Participant 2 2
Self-Referred Program Participant 182 245
Annual 2012-2013 Annual 2013-2014
Student Count Student Count
San Bernardino Total 306 462
Female 255 388
Male 51 74
CalWORKs Cohor t 09-10 10-11 11-12 12-13 13-14
Count of SBVC Graduates 99 77 57 33 30
San Bernard ino Va l l ey Co l lege / 2017 Comprehens ive Mas te r P lan A.123
2017 Comprehens ive Mas te r P lan Append ix / SBCCD / HMC Arch i tec ts + ALMA St ra teg ies

COUNSELING – 2014-15
Description: › The counseling department is committed to
enhancing college success and career readiness
of students in the general population within the
framework of the Student Success Act. During the
2014-15 of mandates implementation, counseling
conducted an intentional focus on all prospective
and new students who were provided core services
of college orientation, assessment, counseling,
academic advising, abbreviated education
plans, and other related services including
career counseling and follow-up services. Thus,
registration of prospective and new students was
contingent on receipt of mandatory services. After
2014-15, these students are required to have an
academic goal and course of study or major as well
as possess comprehensive education plan and use
follow-up services whenever necessary until goal
achievement. Additionally, the department rendered
all services to continuing students albeit not made
a condition to registration except when students
are underachieving. Overall, the counseling services
revolve around the areas of general counseling,
academic advising and education plans, career,
transfer, and personal counseling including
approximately 22 other distinct services. Assistance
to students is conducted in a developmental
and comprehensive manner throughout the
students’ college experience for the completion of
educational goals within a reasonable time frame.
Counseling services are delivered via individual,
group, and online formats for all students including
those in special populations, such as basic skills,
veterans, athletes, PUENTE learning community,
among others. The department undertakes SBVC’s
Student Success and Support Program (SSSP)
Plan.
Assessment: › Marked increase in services utilization.
› Burgeoning need for all counseling services by
all students made more pronounced due to the
Student Success Act mandates.
› Ethnicities of counseling recipients more nearly
reflect the diverse cultures of the student body and
mirror the 2014 census data for San Bernardino
County and California as reported in www.
quickfacts.census.gov.
› Closely maintained performance outcomes of
counseling recipients with the imperative to elevate
overall academic success.
› Sustained demand for three heavily utilized services
related to general counseling, basic skills, and
education plans.
Department Goals: › Intensify accessibility of services and forge year 2
implementation of the Student Success Act.
› Augment counseling interventions to increase
retention and success of students and instill
accountability for demonstrated academic success
behaviors.
› Continue to enhance service delivery practices
including considerable use of counseling-related
technology and other innovative ways to engage
the greatest number of students.
› Maintain effective developmental as well as
comprehensive services to increase performance
outcomes among targeted segments of the
population, particularly at-risk groups, i.e., basic
skills, underachievers--students undecided in their
academic goals and those undecided in their major
or course of study.
Challenges & Opportunities: › Increased demand for counseling services and
continued disproportionate ratio of counselors to
students in the general population.
Individual Data Sheets By Division
STUDENT SERVICES (cont.)
San Bernard ino Va l l ey Co l lege / 2017 Comprehens ive Mas te r P lanA.124
2017 Comprehens ive Mas te r P lan Append ix / SBCCD / HMC Arch i tec ts + ALMA St ra teg ies

Ethnicity % 10-11 11-12 12-13 13-14 14-15
African-American 17.1% 16.1% 15.2% 15.5% 14.7%
American Native 0.7% 0.7% 0.6% 0.7% 0.7%
Asian 3.7% 3.5% 4.0% 3.9% 3.5%
Filipino 1.5% 1.6% 1.5% 1.5% 1.5%
Hispanic 42.4% 44.9% 47.9% 50.9% 51.2%
Pacific Islander 0.7% 0.6% 0.5% 0.5% 0.5%
White 13.2% 13.1% 13.8% 12.4% 12.5%
Unknown 20.8% 19.6% 16.6% 14.6% 15.3%
San Bernard ino Va l l ey Co l lege / 2017 Comprehens ive Mas te r P lan A.125
2017 Comprehens ive Mas te r P lan Append ix / SBCCD / HMC Arch i tec ts + ALMA St ra teg ies

Individual Data Sheets By Division
STUDENT SERVICES (cont.)
COUNSELING – 2014-15 (cont.)
› Greater demand for counseling resulting from
SSSP Plan and changes in Title 5 including federal
mandates relative to financial aid.
› Heightened need for additional clerical staff to
inter-act with the public and to further strengthen
documentation of services utilization due to
accountability and funding requirements.
› Increased awareness among the college
community as well as feeder high schools for more
robust collaboration due to the Student Success
Act.
Action Plan: › Advocate for additional four to five full-time
counselors and a clerk to accomplish the SSSP
Plan.
› Reinforce training among counseling faculty and
staff on the newer features of technology and other
counseling related databases to further promote
best practices.
› Sustain delivery of competent services and
interventions to students and fortify campaigns
for comprehensive education plans and students’
preemptive use of counseling services.
› Provide enhanced services to basic skills/ESL
students and other targeted groups and afford
expanded interventions to probation and dismissal
students via individual and group sessions.
› Design greater collaboration mechanisms in the
implementation of early alert to decrease the
number of at-risk students, particularly students on
probation/dismissal status .
› Promote enhanced partnership with instruction for
integrative approaches within the counseling and
teaching environments.
San Bernard ino Va l l ey Co l lege / 2017 Comprehens ive Mas te r P lanA.126
2017 Comprehens ive Mas te r P lan Append ix / SBCCD / HMC Arch i tec ts + ALMA St ra teg ies

San Bernard ino Va l l ey Co l lege / 2017 Comprehens ive Mas te r P lan A.127
2017 Comprehens ive Mas te r P lan Append ix / SBCCD / HMC Arch i tec ts + ALMA St ra teg ies

DISABLED STUDENTS SERVICES & PROGRAMS –
2014-2015
Description: › Disabled student programs & services (DSP&S)
provides support services and educational
accommodations to students with disabilities so
that they can participate as fully and benefit as
equitably from the college experience as their
non-disabled peers. The specific disability must
be verified, and there must be an educational
limitation that precludes the student from fully
participating in general education without additional
specialized services. A Student Educational
Contract (SEC) is developed for each student
which links student´s goals, curriculum program,
and academic accommodations to his/her specific
disability related educational limitation. Examples of
services available through DSPS that are over and
above those regularly offered by the college would
be academic support, assessment for learning
disabilities, specialized counseling, interpreter
services for hard-of-hearing or deaf students, note
taker services, alternate media, access to adaptive
equipment, adaptive physical education, and
registration assistance.
DSPS Disability Types 2014-2015
Acquired Brain Injury 2.04%
Developmentally Delayed Learner 2.82%
Hearing Impaired 5.73%
Learning Disabled 11.36%
Mobility Impaired 14.95%
Other Disability 38.45%
Psychological Disability 21.36%
Speech/Language Impaired 0.49%
Visually Impaired 2.82%
Assessment: › African-American and Hispanic students comprise
71% of the program.
› The age distribution of DSP&S students shows a
wide diversity between all age groups. 63% are
under 30 with 37% age 30 and above.
› We serve a wide range of disabilities with
the highest percentage of students having
psychological, mobility, and learning disabilities,
and other disabling conditions. The lowest
percentages of students served have speech/
language impairments, acquired brain injuries, and
are developmentally delayed learners.
Individual Data Sheets By Division
STUDENT SERVICES (cont.)
Program Goals: › Increase enrollment of students with disabilities
from feeder high schools by 5%.
› Increase the number of student enrollment in
Student Development 900, 905, and 906 courses.
Challenges and Opportunities: › Improve students’ understanding of their rights and
responsibilities in regards to their accommodations
through yearly mandated appointments.
› Continue to provide accommodations to students
despite reduction in funding.
› Maintain compliance with Title 5 and ADA
regulations.
San Bernard ino Va l l ey Co l lege / 2017 Comprehens ive Mas te r P lanA.128
2017 Comprehens ive Mas te r P lan Append ix / SBCCD / HMC Arch i tec ts + ALMA St ra teg ies

Source: http://datamart.cccco.edu/Services/FinAid_Summary.aspx
› Continue to develop workshops/trainings for
staff regarding accommodating students with
disabilities.
› Conduct student service satisfaction surveys.
› Add classified staff and faculty as the budget
permits.
Action Plan: › Dialog with the campus regarding DSP&S students’
needs that can be served in their areas.
› Collect data related to Service Area Outcomes
(SAO).
› Collect data related to Student Learning Outcomes
(SLO).
San Bernard ino Va l l ey Co l lege / 2017 Comprehens ive Mas te r P lan A.129
2017 Comprehens ive Mas te r P lan Append ix / SBCCD / HMC Arch i tec ts + ALMA St ra teg ies

FINANCIAL AID – 2014-2015
Description: › The Financial Aid Department oversees and is in
charge of administering federal and state financial
aid programs. The programs encompass grants,
loans and work study. These programs assist
students in paying for their educational expenses,
i.e., registration fees, books, supplies, room and
board, transportation, and personal miscellaneous
expenses.
Assessment: › The number of students receiving a Board of
Governors Fee Waiver (BOGW) has increased
over the past two years. The number of students
receiving a Pell Grant has decreased over the
last two years. It is believed the number of Pell
Grant recipients decreased due to the extended
processing time during the 2015-2016 award
year. Additionally, the overall number of FAFSA
applications received also decreased. The financial
aid office anticipates a gradual increase in these
numbers for future award years.
Department Goals: › Increase the number of students who file a FAFSA
application.
› Expedite the turnaround time from application
submission to disbursement of aid.
› Implement auto-packaging and train staff.
› Implement financial aid student prepaid card.
› Train staff on AB540 as well as all facets of
financial aid programs and regulations to ensure
compliance.
Challenges & Opportunities: › The department is serving more students,
› The number of student requests for consideration
for special circumstances has increased.
› Need to reduce the turnaround time from when an
application is received to disbursement.
› Cross train staff, particularly in AB540.
Individual Data Sheets By Division
STUDENT SERVICES (cont.)
San Bernard ino Va l l ey Co l lege / 2017 Comprehens ive Mas te r P lanA.130
2017 Comprehens ive Mas te r P lan Append ix / SBCCD / HMC Arch i tec ts + ALMA St ra teg ies

Action Plan: › The financial aid department plans to improve the
office functions by implement auto-packaging and
train staff on the new process.
› Expedite processing of student files for
disbursement. Increase the number of financial aid
workshops. Implement student financial aid prepaid
card.
› Involve staff in staff development and/or training
opportunities.
› Assess the use of technology for the overall
processing of files.
› Evaluate the SAO assessments to determine further
areas of needed improvement.
San Bernard ino Va l l ey Co l lege / 2017 Comprehens ive Mas te r P lan A.131
2017 Comprehens ive Mas te r P lan Append ix / SBCCD / HMC Arch i tec ts + ALMA St ra teg ies

FIRST YEAR EXPERIENCE – 2014-2015
Description: › The First Year Experience (FYE) program is
designed to successfully transition first year
students into college. FYE oversees other student
support programs: Valley-Bound Commitment
(VBC), Dreamers, Tumaini, and Guardian Scholars.
All of these programs provide a supportive and
welcoming environment where students connect
with student support services on campus to ensure
student success.
Assessment: › Students participating in the First Year Experience
and Valley-Bound Commitment programs will
develop tools (steps to success) to assist students
in navigating their first year of college.
› Measurements:
› End of the year evaluation
› Students who complete the First Year
Experience and Valley-Bound Commitment
programs will have a clear understanding of
the student support services on campus to
transition into for their second year.
› Measurements:
› End of the year evaluation
› FYE Survey Satisfaction
Department Goals: › Increase the number of students who successfully
complete their courses in their first year.
› Provide resources and services that promote
student success: Summer Bridge, orientation,
counseling, tutoring, course completion, degree
completion, and transfer.
› Successfully transition students to another student
support services program for the duration of their
academic career at Valley College.
Challenges & Opportunities: › Some challenges are getting the FYE program up
and going. This is the first year of the program’s
existence at Valley College. However, the FYE
program has an opportunity to establish itself to
be one of the premier programs on campus that
assist first year college students to transition into a
college environment.
Action Plan: › Provide more access to students in our service
area to Valley College.
› Enhance the relationships in the K-12 school
districts and community-based organizations to
ensure a seamless pipeline to Valley College.
› Market and promote all student equity programs.
Individual Data Sheets By Division
STUDENT SERVICES (cont.)
San Bernard ino Va l l ey Co l lege / 2017 Comprehens ive Mas te r P lanA.132
2017 Comprehens ive Mas te r P lan Append ix / SBCCD / HMC Arch i tec ts + ALMA St ra teg ies

Gender 2014-15
Female 31
Male 36
Unknown 0
Gender 2014-15
Female 112
Male 110
Unknown 0
Ethnicity 2014-15
African-American 30
Asian 1
Hispanic 34
Multi-Ethnicity 3
White 1
Other 1
Ethnicity 2014-15
African-American 21
American Indian/Alaskan 1
Asian 6
Hispanic 159
Multi-Ethnicity 17
Pacific Islander 1
White 17
Other 0
FIRST-YEAR EXPERIENCE VALLEY BOUND COMMITMENT
San Bernard ino Va l l ey Co l lege / 2017 Comprehens ive Mas te r P lan A.133
2017 Comprehens ive Mas te r P lan Append ix / SBCCD / HMC Arch i tec ts + ALMA St ra teg ies

STUDENT SUCCESS & SUPPORT
(FORMERLY MATRICULATION) – 2014-2015
Description: › Student Success & Support Program (SSSP) is
the tool that interfaces with Student Services and
Instruction to support and drive student success.
Matriculation provides the impetus for the student
services needed to ensure the delivery of the core
services to enhance student success. The core
services instrumental in student accomplishments
are: orientation, assessment, and counseling/
advisement, education plans, and follow-up.
These core components are derived to provide
access to students and to facilitate the avenues for
achievement. The core services are required and
their accountability is key in the allocation of funds
to colleges.
Assessment: › Assessment is mandatory for all first time students.
Overall, there has been no need for adjustments in
the assessment procedures and/or processes.
› One recognizable change is that by students being
able to make the assessment appointment online,
there are less not shows.
› However, coupled with the current enrollment trend
and low high school graduation rates, the number
of students assessed has decreased. Nevertheless,
since its inception, on-site assessment services has
increased students yearly.
Department Goals: › Continue building on the growth revealed by the
data, particularly in orientation and assessment.
› Build on the online assessment appointments.
› Research cost and options to develop and
implement an online bilingual orientation/
assessment component.
› Research cost and options to purchase STARFISH
Alert; student follow-up that would replace the
current SARS Alert System.
› Continue expanding the on-site SBVC admission
application, online orientation, assessment,
academic advising at target feeder high schools.
Challenges & Opportunities: › Based on required core SSSP services and the
expected outcomes the concerns are: the number
of staff needed in assessment, the number of
generalist counselors needed in the Counseling
Department to provide the mandated services.
The accountability of the core services are very
important as they have a key role in the funding
provided to colleges.
› Opportunity to work with Student Services
Programs and Instruction to explore new
partnerships to enhance student support, retention,
and success.
› Opportunity for college and feeder high schools
staff to meet and discuss common core and
teaching across the curriculum in an effort to
increase success in college courses.
Action Plan: › Expand the on-site SBVC admission application,
online orientation, assessment, academic advising
at target feeder high schools.
› Develop and implement an online bilingual
orientation/assessment component.
› Enhance early alert component to students.
› Work with DCS staff re: SSSP core requirements
for MIS reporting.
› More dissemination of information and staff
development to enhance faculty and staff regarding
SSSP.
Individual Data Sheets By Division
STUDENT SERVICES (cont.)
San Bernard ino Va l l ey Co l lege / 2017 Comprehens ive Mas te r P lanA.134
2017 Comprehens ive Mas te r P lan Append ix / SBCCD / HMC Arch i tec ts + ALMA St ra teg ies

Assessment
Tests
11-12 12-13 13-14 14-15
General 8014 7831 8213 7921
Population
Assessment
Tests
11-12 12-13 13-14 14-15
High School 447 596 870 1232
Students
San Bernard ino Va l l ey Co l lege / 2017 Comprehens ive Mas te r P lan A.135
2017 Comprehens ive Mas te r P lan Append ix / SBCCD / HMC Arch i tec ts + ALMA St ra teg ies
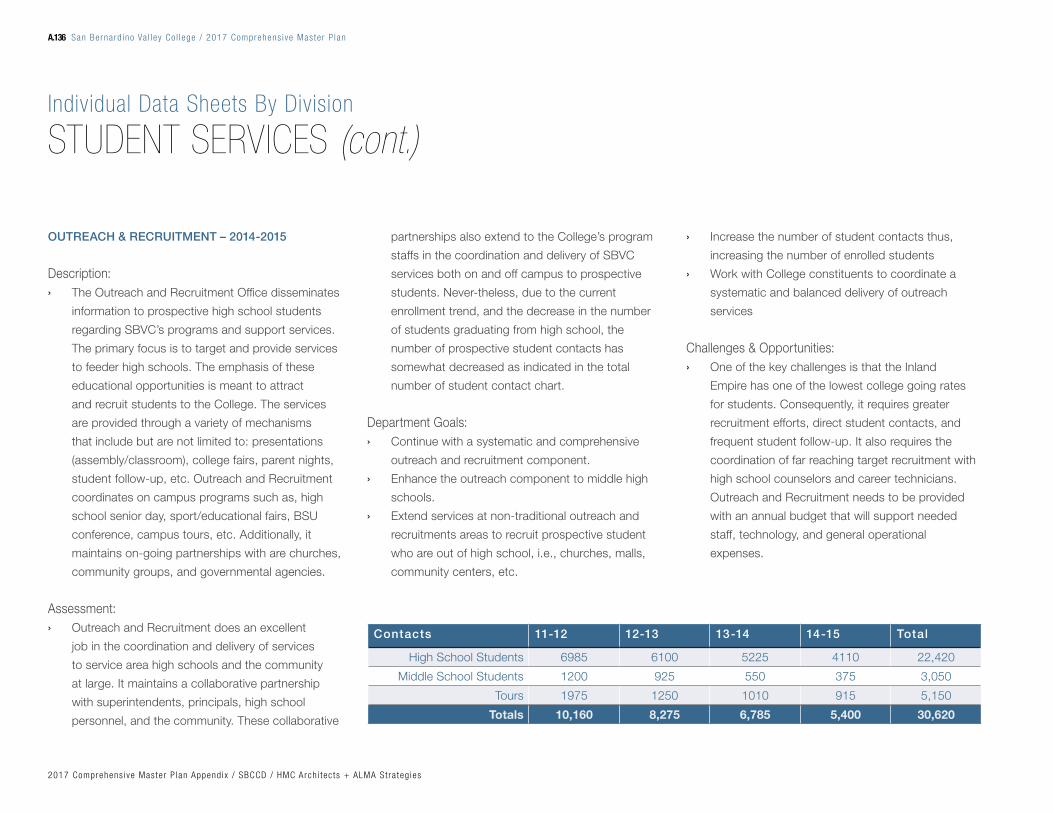
OUTREACH & RECRUITMENT – 2014-2015
Description: › The Outreach and Recruitment Office disseminates
information to prospective high school students
regarding SBVC’s programs and support services.
The primary focus is to target and provide services
to feeder high schools. The emphasis of these
educational opportunities is meant to attract
and recruit students to the College. The services
are provided through a variety of mechanisms
that include but are not limited to: presentations
(assembly/classroom), college fairs, parent nights,
student follow-up, etc. Outreach and Recruitment
coordinates on campus programs such as, high
school senior day, sport/educational fairs, BSU
conference, campus tours, etc. Additionally, it
maintains on-going partnerships with are churches,
community groups, and governmental agencies.
Assessment: › Outreach and Recruitment does an excellent
job in the coordination and delivery of services
to service area high schools and the community
at large. It maintains a collaborative partnership
with superintendents, principals, high school
personnel, and the community. These collaborative
partnerships also extend to the College’s program
staffs in the coordination and delivery of SBVC
services both on and off campus to prospective
students. Never-theless, due to the current
enrollment trend, and the decrease in the number
of students graduating from high school, the
number of prospective student contacts has
somewhat decreased as indicated in the total
number of student contact chart.
Department Goals: › Continue with a systematic and comprehensive
outreach and recruitment component.
› Enhance the outreach component to middle high
schools.
› Extend services at non-traditional outreach and
recruitments areas to recruit prospective student
who are out of high school, i.e., churches, malls,
community centers, etc.
Contacts 11-12 12-13 13-14 14-15 Total
High School Students 6985 6100 5225 4110 22,420
Middle School Students 1200 925 550 375 3,050
Tours 1975 1250 1010 915 5,150
Totals 10,160 8,275 6,785 5,400 30,620
› Increase the number of student contacts thus,
increasing the number of enrolled students
› Work with College constituents to coordinate a
systematic and balanced delivery of outreach
services
Challenges & Opportunities: › One of the key challenges is that the Inland
Empire has one of the lowest college going rates
for students. Consequently, it requires greater
recruitment efforts, direct student contacts, and
frequent student follow-up. It also requires the
coordination of far reaching target recruitment with
high school counselors and career technicians.
Outreach and Recruitment needs to be provided
with an annual budget that will support needed
staff, technology, and general operational
expenses.
Individual Data Sheets By Division
STUDENT SERVICES (cont.)
San Bernard ino Va l l ey Co l lege / 2017 Comprehens ive Mas te r P lanA.136
2017 Comprehens ive Mas te r P lan Append ix / SBCCD / HMC Arch i tec ts + ALMA St ra teg ies
Action Plan: › Increase the number of contacts of prospective
high school students.
› Enhance and expand partnerships with middle
schools.
› Establish with College constituents a systematic
and balanced delivery of outreach services to
feeder high schools.
› Work with the College’s PIO Officer to develop
recruitment materials.
› Coordinate and expand recruitment activities to
churches, community centers, malls, etc., to reach
non- traditional students.
› Pursue the allocation of a bona fide annual
outreach and recruitment budget that will support
staff needs, technology, and general operational
needs
San Bernard ino Va l l ey Co l lege / 2017 Comprehens ive Mas te r P lan A.137
2017 Comprehens ive Mas te r P lan Append ix / SBCCD / HMC Arch i tec ts + ALMA St ra teg ies

STUDENT SUCCESS CENTER/TUTORING –
2014-2015
Description:
Assessment:
Department Goals:
Challenges & Opportunities:
Action Plan:
Individual Data Sheets By Division
STUDENT SERVICES (cont.)
San Bernard ino Va l l ey Co l lege / 2017 Comprehens ive Mas te r P lanA.138
2017 Comprehens ive Mas te r P lan Append ix / SBCCD / HMC Arch i tec ts + ALMA St ra teg ies

Unduplicated Headcount Campus-wide Success Center
Count % of Campus Count % of Campus
2014-2015 17,044 100% 2,352 14%
2013-2014 16,080 100% 2,875 18%
2012-2013 15,441 100% 2,644 17%
2011-2012 16,593 100% 1,842 11%
Ethnicity 12-13 13-14 14-15
Asian/Nat.American/Pac.Isl. 10% 8% 8%
Black 17% 17% 18%
Hispanic 58% 61% 62%
White 13% 12% 11%
Gender 12-13 13-14 14-15
Female 61% 61% 63%
Male 39% 39% 37%
Success Center Student Contact Hours
2014-2015 32,291
2013-2014 42,902
2012-2013 46,218
2011-2012 25,480
San Bernard ino Va l l ey Co l lege / 2017 Comprehens ive Mas te r P lan A.139
2017 Comprehens ive Mas te r P lan Append ix / SBCCD / HMC Arch i tec ts + ALMA St ra teg ies

STAR PROGRAM – 2014-15
Description: › The Success Through Achievement and Retention
(STAR) program is a federally funded TRIO
Student Support Services program which provides
opportunities for academic develop-ment, assists
students with college requirements, and serves
to motivate students toward the successful
completion of their AA/AS degree, certificate and/or
transfer to a four-year university.
Assessment: › Documentation will be collected and kept in
student files indicating enrollment status and
progress. (Class schedules & transcripts,
registration, program application, and program
completion data, transfer acceptance letter.)
Department Goals: › Provide outstanding services to students
› Empower students to achieve their educational
goals allowing them to graduate and/or transfer to
a four-year university
› Teach students the importance of an educational
goal plan and how to make adjustments to the plan
when needed
› Maintain an positive learning environment for STAR
students
Challenges & Opportunities: › The program has many opportunities to help new
students each year. With students successfully
completing their graduation objectives, the program
normally brings in 35-60 new students each
academic year. This gives the program a chance
to help a different cohort of students, as well as
continuing students, each fall semester.
› Challenges continue with the budget cuts from the
past three years.
Action Plan: › Continue to enhance the following areas:
› Academic success strategies that begin as soon as
a student is accepted into the program.
› Track student participation, academic standing and
review student progress to ensure that participants
will meet or have met requirements for academic
success and graduation and/or transfer.
› Students will work directly with STAR counselors to
create a full educational plan.
› STAR will offer support services, grant aid, and
a privately funded book scholarship to assist
students to persist towards graduation and/or
transfer.
Individual Data Sheets By Division
STUDENT SERVICES (cont.)
› Students will participate in the STAR Academic
Intervention plan if their GPA falls below 2.3.
Overall, staff will continue work to increase
participant persistence rates.
San Bernard ino Va l l ey Co l lege / 2017 Comprehens ive Mas te r P lanA.140
2017 Comprehens ive Mas te r P lan Append ix / SBCCD / HMC Arch i tec ts + ALMA St ra teg ies

San Bernard ino Va l l ey Co l lege / 2017 Comprehens ive Mas te r P lan A.141
2017 Comprehens ive Mas te r P lan Append ix / SBCCD / HMC Arch i tec ts + ALMA St ra teg ies

STUDENT SUCCESS CENTER – 2014-2015
Description: › The Student Success Center offers academic
support through Tutoring and Supplemental
Instruction through a variety of venues including
drop-in, scheduled, and group tutoring as well as
facilitated workshops and supplemental instruction.
Assessment: › Data shows that the department continues to show
significant positive gains for students receiving
academic support versus students who do not.
While the numbers show decreases within the
SSC of unduplicated headcount the data does
not accurately reflect the impact as the SSC has
significantly increased supplemental instruction (SI)
which is not currently captured through the SSC
data gathering system. Slight decreases in SSC
success and retention rates can also be attributed
to the increase in the SI program which is reflected
in separate graphs.
Department Goals: › Provide a stable academic support program which
meets student academic support needs.
› Partner with faculty to support classroom
instruction through tutoring and supplemental
instruction.
› Increase student’s understanding of course
materials which translates to increases in student
success and retention.
Challenges & Opportunities: › Current budget allotment for academic support
will allow for 7 tutors for the campus across all
disciplines. Relying on grant funding does not allow
for stability within the program.
› Currently, the SSC supports 44 Academic Tutors
and 46 Supplemental Instructors across 22
academic disciplines within Science, Mathematics,
CIT, Humanities, and Social Science with 1 Tutorial
Coordinator. To provide a stable and manageable
academic support program that will support
student usage and provide adequate campus
coverage, the SSC will request funding which will
employ 30 Academic Tutors and 30 Supplemental
Instructors.
› A SI Coordinator position is needed to coordinate
SI services which are currently being done through
4 people across 2 divisions.
› Work through curriculum/State Chancellor/faculty
support to provide positive attendance funding
opportunities.
› Capturing consistent attendance data will be a
challenge without full implementation of SARS and
a staff member to facilitate data capture.
Action Plan: › Work with faculty/curriculum for a non-credit
staffed lab courses to support student success in
the basic skills classes.
› Submit needs assessments for stable budget for
academic support staff including tutoring, SI, and
SI coordinator.
› Expand current faculty support within the SSC
to provide needed content expert support to
academic support staff/students.
› Track unmet requests for academic support to
identify areas of need and provide academic
support for them.
› Increase SARS usage to capture accurate student
usage data.
Individual Data Sheets By Division
STUDENT SERVICES (cont.)
San Bernard ino Va l l ey Co l lege / 2017 Comprehens ive Mas te r P lanA.142
2017 Comprehens ive Mas te r P lan Append ix / SBCCD / HMC Arch i tec ts + ALMA St ra teg ies
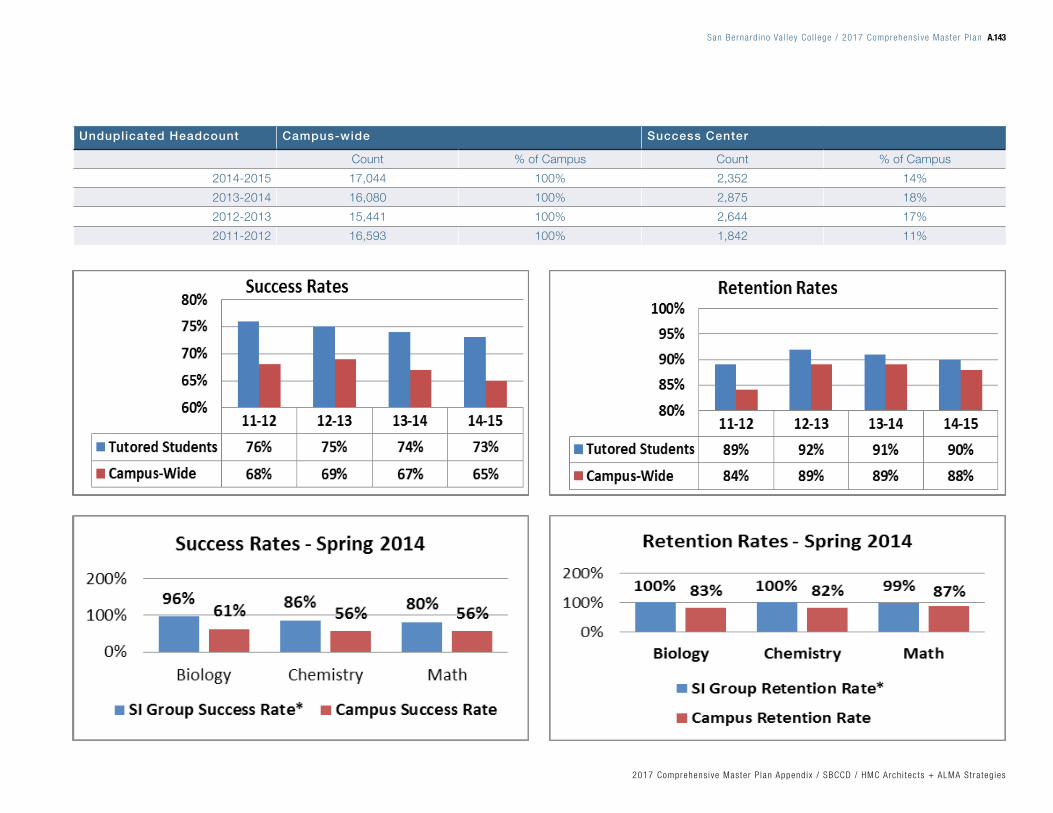
Unduplicated Headcount Campus-wide Success Center
Count % of Campus Count % of Campus
2014-2015 17,044 100% 2,352 14%
2013-2014 16,080 100% 2,875 18%
2012-2013 15,441 100% 2,644 17%
2011-2012 16,593 100% 1,842 11%
San Bernard ino Va l l ey Co l lege / 2017 Comprehens ive Mas te r P lan A.143
2017 Comprehens ive Mas te r P lan Append ix / SBCCD / HMC Arch i tec ts + ALMA St ra teg ies

TRANSFER CENTER – 2014-2015
Description: › The transfer center designs, develops and
implement a variety of transfer and career
strategies that increase the number of San
Bernardino Valley College students prepared to
transfer to a baccalaureate level institution and
ensure students are knowledgeable of their career
goals and how that relates in the global market
place. The department works to foster a transfer
culture on campus and to enhance student
awareness of their educational options beyond the
community college while increasing the number of
students, especially historically underrepresented
students, who apply to transfer from SBVC to a
four-year institution.
Assessment: › The numbers reported under services do not
reflect the total services we offered this just reflects
what it reported in SARS. Other fall 2014 services
included: table the on Quad by staff or university
reps 1,895; fall transfer fair 675; application
workshops and class presentations 277; four-year
university campus visits 69.
› CSUSB contacts have changed because our
representative is only coming twice a month
rather than every Wednesday and Cal Ploy has
increased their visits to twice a month thus increase
in contacts. The number of students who are
using our computer lab has decreased due to the
number of application workshops that we facilitate
where students can work on the application in
the workshop. We have also worked with several
student development classes by providing their
students with career assessment tools either in the
center or in the classroom 120.
Program Goals: › Program goals are established by Title 5
requirements:
› Enhance and strengthen services that foster
transfer awareness and readiness, transfer
culture and increase transfer applications.
› Provide space that will centralize transfer
center staff so they can adequately
accommodate and streamline transfer services
and programs that are accessible to students,
faculty and staff.
› Ensure targeted student populations are
identified, contacted and provided transfer
support services in collaboration with faculty.
› Ensure that students receive accurate and
up-to-date academic and transfer information
through counseling services.
› In cooperation with the four-year college and
university personnel, develop a schedule of
services to transfer students.
Challenges and Opportunities: › Full-time transfer and career counseling faculty
are needed to serve more transfer students and to
be able to provide much needed career services.
There has only been a PT counselor for the past
several years who does transfer, career and honors
twice a week.
› There is a greater need to assist our students
in finding part-time jobs while going to school.
Students are dropping out of school daily because
they need to work.
› Targeting underrepresented groups to increase
transfer. Campus-wide African-American students
are not transferring and rate is not increasing.
Action Plan: › Gain additional access to a database so transfer
students can be identified, so that targeted
Individual Data Sheets By Division
STUDENT SERVICES (cont.)
San Bernard ino Va l l ey Co l lege / 2017 Comprehens ive Mas te r P lanA.144
2017 Comprehens ive Mas te r P lan Append ix / SBCCD / HMC Arch i tec ts + ALMA St ra teg ies

Gender Fall 2011
(n=600)
Fall 2012
(n=440)
Fall 2013
(n=419)
Fall 2014*
(n=526)
Female 59% 62% 60% 53%
Male 41% 38% 40% 37%
*10% = unreported
Gender Fall 2011
(n=600)
Fall 2012
(n=440)
Fall 2013
(n=419)
Fall 2014
(n=526)
Asian 6% 6% 5% 6%
Black 19% 13% 16% 13%
Hispanic 56% 63% 65% 61%
Native American 1% 1% 1% <1%
Pacific Islander 2% <1% 0% <1%
White 14% 13% 11% 8%
Declined to State 3% 3% 1% 11%
DEMOGRAPHICS
ETHNICITY
information can be sent to those students who
identify transfer as a goal on their application to
SVBC.
› Hire a full-time transfer counselor.
› Provide some type of job listing services for
students.
› Increase the number of African-American students
participating in the Tumaini learning community to
support them.
San Bernard ino Va l l ey Co l lege / 2017 Comprehens ive Mas te r P lan A.145
2017 Comprehens ive Mas te r P lan Append ix / SBCCD / HMC Arch i tec ts + ALMA St ra teg ies

Individual Data Sheets By Division
NON-INSTRUCTIONAL DEPARTMENTS/SERVICES
CAMPUS TECHNOLOGY SERVICES
Description: › The CTS Department is a service oriented
department that supports all technology located on
the SBVC campus. Installs, maintains, configures
and services computer based hardware and
software along with the network infrastructure
that includes switches, cabling, servers, and other
networking equipment. Uses the helpdesk system
to support campus/district owned systems used
by students, faculty and staff. Maintains all of
the academic/service/open computer labs and
classroom technology. Consults with the campus
community as needed to evaluate, specify, and
purchase software/equipment that is then deployed
to the campus. Works with the technology
committee to develop standards and procedures
for technology.
Assessment: › Assessment of Campus Technology services is
based on campus surveys and feedback from
helpdesk tickets.
Department Goals: › Goals are set by the technology committee. These
are the Goals from the 2013-2016 technology plan:
› Goal 1. Provide exemplary technology
resources and support while maintaining fiscal
and environmental responsibility.
› Goal 2. Support the Online Program
Committee’s Plans and Goals.
› Goal 3. Encourage partnerships and
promote awareness with businesses, other
organizations, and the surrounding community.
› Goal 4. Collaborate with the District on
projects that are beneficial to all.
› Goal 5. Work cooperatively through the Office
of Professional Development to provide
appropriate technology training.
› Goal 6. Identify and meet accessibility
standards set by Section 508.
Challenges & Opportunities: › Use of technology continues to rise. Faculty,
students, and staff are using multiple systems that
require support.
› Many new systems need to be connected to the
network and requires technical configuration.
HVAC, security cameras, door locks, alarms,
PA systems, and marquees are just a few of the
items that only recently have been added to the
campuses computer systems.
› Cloud computing is pushing more systems to the
network these system require configuration.
› While budgets and demands for technology have
increased staffing levels have remained the same.
› Many of the new grants and categorical programs
(ecspecially in student services) come with funds
for new equipment but no funds to support it.
Action Plan: › Continued support for technology is essential
to our campus community. The department will
continue to meet the needs of the community as
well as it can with the resource it has. Increased
staffing would go a long way toward implementing
the technology needs of the Campus Community in
a timely manner.
San Bernard ino Va l l ey Co l lege / 2017 Comprehens ive Mas te r P lanA.146
2017 Comprehens ive Mas te r P lan Append ix / SBCCD / HMC Arch i tec ts + ALMA St ra teg ies

San Bernard ino Va l l ey Co l lege / 2017 Comprehens ive Mas te r P lan A.147
2017 Comprehens ive Mas te r P lan Append ix / SBCCD / HMC Arch i tec ts + ALMA St ra teg ies

GRANT DEVELOPMENT & MANAGEMENT – 2014-15
Description: › The Grant Development and Management Office
is responsible for the development, submission,
and management of grant projects awarded by
federal, state, and private entities. The grants
team researches opportunities and ensures they
are a good fit with college and district priorities.
Additionally, the office administers and manages
the project after funding is awarded. Grants are
tools of change for an institution. Innovative grants
projects raise community awareness of the college
and build prestige. Grants assume an even more
important role in supporting college priorities as
state funding fluctuates.
Assessment: › The Grants Office is fulfilling its purpose on campus
and operating at a high level of performance as
indicated by benchmarks for the profession.
› As shown in the performance measure
comparisons table, grant awards have provided the
foundation for the development of programs and
resources that contribute to student success.
› Grants management is a time-consuming process.
The more effective the Grants Office is at bringing
in awards, the less effective the department will
become unless staffing ratios match the workload
created by new awards.
Department Goals: › Increase collaboration with campus population and
focus on success.
› Increase grant applications and awards and
enhance student access and success through
grant funded projects.
› Educate campus population re: grant timelines,
process, and proper grant management.
Challenges & Opportunities: › Institutionalization of programs and positions that
have been identified as a campus priority.
› Ample grants exist for colleges with SBVC social-
economic base and demographics.
› Instability in staffing and resources have created
a situation where at times there is limited ability to
respond to funding opportunities. Regular funding
for a grant writer is a must.
Individual Data Sheets By Division
NON-INSTRUCTIONAL DEPARTMENTS/SERVICES (cont.)
Action Plan: › Desire to build partnerships with adult education,
K-12, and ROP institutional segments, as well as
with business and industry.
› Initiate and manage projects as lead institution,
with partners such as UC Riverside, CSUSB, and
other colleges and universities; also participate as a
partner in others’ grants
› Create ongoing funding streams to support
campus initiatives such as StrengthsQuest,
supplemental instruction, and tutoring.
› Continue working with deans (instruction and
student services) to prioritize and respond to grant
opportunities.
San Bernard ino Va l l ey Co l lege / 2017 Comprehens ive Mas te r P lanA.148
2017 Comprehens ive Mas te r P lan Append ix / SBCCD / HMC Arch i tec ts + ALMA St ra teg ies

Programs and Services Suppor ted by Ongoing Major Grant Awards
2011-12 2012-13 2013-14 2014-15
$1,699,253 $1,767,571 $1,932,789 $3,109,269
Depar tmental Ef f iency and Productivity (Ratio of Salary to Income Generated)
2011-12 2012-13 2013-14 2014-15
$206,710 $212,623 $214,703 $233,799
$1,699,253 $1,767,571 $1,932,789 $3,109,269
1:8 1:8 1:9 1:13
Ongoing Major Grand Awards — 2014-15
HSI STEM PASS GO $1,102,349
MSEIP $235,124
MCHS $99,000
AB86 $348,137
CTE $43,269
TAAACT $636,844
Nursing Enrollment $126,737
Ramp-up $409,235
NSF Water Grant $58,574
Campus Mental Health $50,000
Per formance Measures by Group — 2014-15 Success Retention
HSI STEM—SI Groups 63% 99%
Campus-wide— $212,623 $214,703
courses without SI* 57% 85%
MCHS—All SBVC Courses 90% 99%
Campus-wide—All Courses 66% 88%
*same courses as the HSI STEM_SI Group
San Bernard ino Va l l ey Co l lege / 2017 Comprehens ive Mas te r P lan A.149
2017 Comprehens ive Mas te r P lan Append ix / SBCCD / HMC Arch i tec ts + ALMA St ra teg ies

MARKETING & PUBLIC RELATIONS – 2014-2015
Description: › Marketing and Public Relations leads all strategic
and tactical marketing and public relations activities
at the college, including, but not limited, to: press
releases, media relations, crisis communications,
campus-wide publications, special event
coordination, website development, social media,
photography, and other duties, as assigned, under
direct supervision of the campus president. The
department consists of one director-level position
and part-time support from an administrative
assistant.
Assessment: › Assessing the effectiveness of Marketing and
Public Relations takes on different strategies
depending on the evolving enrollment environment
at the campus. When SBCCD campuses
were over-enrolled from 2009 -2011, the
marketing budget was greatly reduced and
nearly all advertising/promotional activities were
discontinued, requiring a departmental shift in
focus to public relations, reputation management,
event planning and internal communications. After
a drop in enrollment in 2012, the college was
directed to assist with increasing FTES, placing
advertising/promotional activities at the forefront of
department duties.
Department Goals: › The economic downturn in 2009-2011 temporarily
eliminated enrollment growth goals, which
resulted in the department focusing on a redesign
of the website, development of an internal
newsletter, distribution of press releases, and the
establishment of a college presence on social
media. For the 2014-2015 academic year, the
college was focused on enrollment growth in an
environment of increasing competition for online
publicity and recruitment from local nonprofit and
for-profit colleges. The department’s activities were
focused on:
› Increasing community awareness about
the college and its programs via social
media, digital, print, broadcast, and outdoor
advertising;
› Maintaining accurate, up-to-date information
on the college website;
› Stewarding the college’s reputation in a time
of increased negative press coverage of the
college and district.
Challenges & Opportunities: › After the departure of the Director of Marketing
and Public Relations in 2013, the department
experienced a loss in momentum that resulted in
decreased student and community engagement,
decreased online visibility for the college, and a
negative impact to the college’s local reputation.
The interim director faced a number of challenges,
including a lack of resources and staff to develop
compelling digital media that matches the content
being produced by competitor colleges.
Individual Data Sheets By Division
NON-INSTRUCTIONAL DEPARTMENTS/SERVICES (cont.)
San Bernard ino Va l l ey Co l lege / 2017 Comprehens ive Mas te r P lanA.150
2017 Comprehens ive Mas te r P lan Append ix / SBCCD / HMC Arch i tec ts + ALMA St ra teg ies

Year Social Media Posts Press
Release
Total
Twitter Facebook Instagram
2010-11 223 89 37 349
2011-12 193 237 41 471
2012-13 961 440 23 47 1,471
2013-14 41 205 30 12 288
2014-15 88 157 13 9 267
Year Social Media Followers Total
Twitter Facebook Instagram
2010-11 1,250 1,250
2011-12 4,150 4,150
2012-13 1,050 6,050 7,100
2013-14 1,460 7,465 305 9,230
2014-15 2,008 8,459 502 10,969
Student Campus Climate Survey Results Students’ Overall Impression of the Reputation of
SBVC
Rating % 10-11 11-12 12-13 13-14 14-15
Excellent 31 26 30 36 29
Good 48 39 44 49 45
Average 15 19 17 10 18
Below Average 2 5 5 3 5
Poor 1 1 3 2 3
Student Headcount 10-11 11-12 12-13 13-14 14-15
Unduplicated 63% 99%
Enrollment 19,169 16,593 15,441 16,080 17,044
Day Class Enrollment* 9,789 9,158 8,781 9,220 9,639
*Reporting period is fall term only of the academic year.
San Bernard ino Va l l ey Co l lege / 2017 Comprehens ive Mas te r P lan A.151
2017 Comprehens ive Mas te r P lan Append ix / SBCCD / HMC Arch i tec ts + ALMA St ra teg ies

PROFESSIONAL & ORGANIZATIONAL
DEVELOPMENT – 2014-2015
Description:
Assessment:
Department Goals:
Challenges & Opportunities:
Action Plan:
Individual Data Sheets By Division
NON-INSTRUCTIONAL DEPARTMENTS/SERVICES (cont.)
San Bernard ino Va l l ey Co l lege / 2017 Comprehens ive Mas te r P lanA.152
2017 Comprehens ive Mas te r P lan Append ix / SBCCD / HMC Arch i tec ts + ALMA St ra teg ies

Employee Count Fall 2010 Fall 2011 Fall 2012 Fall 2013 Fall 2014
Administrators 18 18 17 15 17
Classified Staff 219 219 218 199 193
Adjunct Faculty 364 309 336 344 386
Tenured Faculty 154 151 148 146 147
Campus Events 2012-13 2013-14 2014-15
Workshops
Great Teachers Retreat
Flex Day
Staff Appreciation
San Bernard ino Va l l ey Co l lege / 2017 Comprehens ive Mas te r P lan A.153
2017 Comprehens ive Mas te r P lan Append ix / SBCCD / HMC Arch i tec ts + ALMA St ra teg ies

RESEARCH, PLANNING & INSTITUTIONAL
EFFECTIVENESS – 2014-2015
Description: › Research, Planning, & Institutional Effectiveness
(RPIE) serves all campus constituents by creating
detailed data reports that support campus
planning, grants, and continuous program
improvement. Reports assess and track student
performance, assessment placement, enrollment
projection, graduation and transfer rates,
demographic, workforce, and economic data.
RPIE assists with developing methods, measures,
and databases to assess and evaluate programs.
ORPIE also supports SLO data collection, tracking,
and analysis. It provides data to all student
service departments and campus committees,
including the program review committee. RPIE
supports the district office by gathering requested
data and administering surveys for district-level
planning and evaluation. It maintains webpages
with tables, graphs, maps, summary reports,
Research Requests 10-11 11-12 12-13 13-14 14-15
Research requests using online RR Form 39 36 31 55 91
Research requests without RR Form (via email/phone) 34 37 38 6 8
Percentage of requests completed within 10 working days Not Recorded Not Recorded 65% 97% 86%
*One of many grants supported by RPIE
gainful employment information, and other college
planning documents to communicate information
to the campus and surrounding community. RPIE is
also responsible for most local, state, and federal,
mandated reporting of campus data.
Assessment: › The department has maintained campus-wide
data support in a timely manner despite the
increasing state and federal demands for empirical
accountability. The increased campus awareness
of the research request process has allowed the
generation of 65% more request completions than
during 13-14; however, the department is greatly
pressed by an increased quantity of projects and
only one researcher and dean, responding to last
minute requests and deadlines, with no time for
creative investigation. Ideally, this department
would like to write investigative statistical
reports outside the scope of our regular reports.
Unfortunately, a lack of time and staff does not
allow this to occur.
Department Goals: › The department would like to expand its staff so
that investigative statistical reports can be written.
› We are beginning to create research briefs for
camps-wide and community access, but this
process is slow, as time does not usually allow for
this.
› If additional staff is provided, more time for these
research projects will be available.
› Open forum Q&A sessions throughout campus
may also increase our visibility and campus-wide
awareness of the campus planning processes to
which we contribute.
Challenges & Opportunities: › Fulfilling growing state and federal requirements is
a continuous challenge, as well as the increased
data-tracking and program evaluation for grant-
funded programs. We accomplished our goal
of becoming more visible, as shown in the 65%
increase in research requests. However, staffing
Individual Data Sheets By Division
NON-INSTRUCTIONAL DEPARTMENTS/SERVICES (cont.)
San Bernard ino Va l l ey Co l lege / 2017 Comprehens ive Mas te r P lanA.154
2017 Comprehens ive Mas te r P lan Append ix / SBCCD / HMC Arch i tec ts + ALMA St ra teg ies
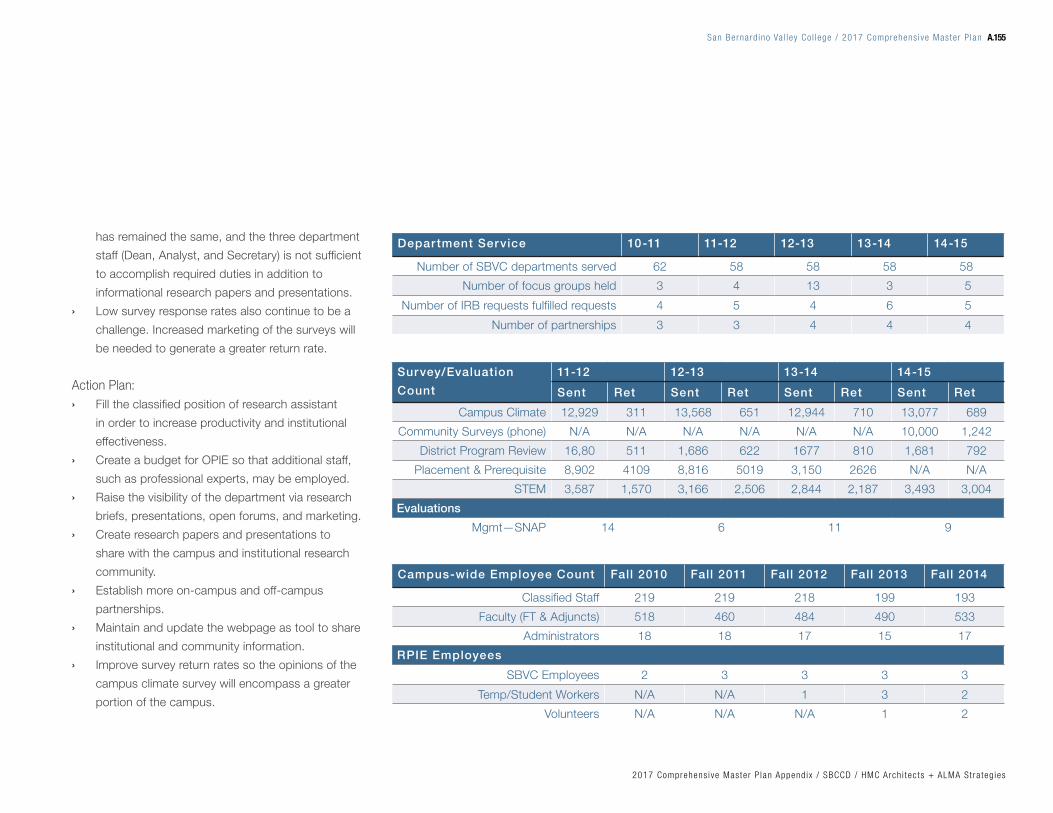
Campus-wide Employee Count Fall 2010 Fall 2011 Fall 2012 Fall 2013 Fall 2014
Classified Staff 219 219 218 199 193
Faculty (FT & Adjuncts) 518 460 484 490 533
Administrators 18 18 17 15 17
RPIE Employees
SBVC Employees 2 3 3 3 3
Temp/Student Workers N/A N/A 1 3 2
Volunteers N/A N/A N/A 1 2
Depar tment Service 10-11 11-12 12-13 13-14 14-15
Number of SBVC departments served 62 58 58 58 58
Number of focus groups held 3 4 13 3 5
Number of IRB requests fulfilled requests 4 5 4 6 5
Number of partnerships 3 3 4 4 4
Survey/Evaluation
Count
11-12 12-13 13-14 14-15
Sent Ret Sent Ret Sent Ret Sent Ret
Campus Climate 12,929 311 13,568 651 12,944 710 13,077 689
Community Surveys (phone) N/A N/A N/A N/A N/A N/A 10,000 1,242
District Program Review 16,80 511 1,686 622 1677 810 1,681 792
Placement & Prerequisite 8,902 4109 8,816 5019 3,150 2626 N/A N/A
STEM 3,587 1,570 3,166 2,506 2,844 2,187 3,493 3,004
Evaluations
Mgmt—SNAP 14 6 11 9
has remained the same, and the three department
staff (Dean, Analyst, and Secretary) is not sufficient
to accomplish required duties in addition to
informational research papers and presentations.
› Low survey response rates also continue to be a
challenge. Increased marketing of the surveys will
be needed to generate a greater return rate.
Action Plan: › Fill the classified position of research assistant
in order to increase productivity and institutional
effectiveness.
› Create a budget for OPIE so that additional staff,
such as professional experts, may be employed.
› Raise the visibility of the department via research
briefs, presentations, open forums, and marketing.
› Create research papers and presentations to
share with the campus and institutional research
community.
› Establish more on-campus and off-campus
partnerships.
› Maintain and update the webpage as tool to share
institutional and community information.
› Improve survey return rates so the opinions of the
campus climate survey will encompass a greater
portion of the campus.
San Bernard ino Va l l ey Co l lege / 2017 Comprehens ive Mas te r P lan A.155
2017 Comprehens ive Mas te r P lan Append ix / SBCCD / HMC Arch i tec ts + ALMA St ra teg ies


Full Listing Of Service Area + Regional Job Openings By Occupation (2015–2025)
San Bernard ino Va l l ey Co l lege / 2017 Comprehens ive Mas te r P lan A.157
2017 Comprehens ive Mas te r P lan Append ix / SBCCD / HMC Arch i tec ts + ALMA St ra teg ies

Related Program
Description Annual Openings
2015 Jobs
2025 Jobs
2015 - 2025 Change
2015 - 2025 % Change
Avg. Hourly Earnings
ACCT Accountants and Auditors 111 2,103 2,522 419 20% $34.16
ACCT Bookkeeping, Accounting, and Auditing Clerks 101 3,688 4,318 630 17% $19.14
ACCT Tellers 73 1,176 1,278 102 9% $13.94
ACCT Billing and Posting Clerks 64 1,453 1,790 337 23% $17.22
ACCT Financial Managers 37 1,114 1,256 142 13% $55.32
ACCT Loan Officers 25 621 742 121 19% $37.75
ACCT Payroll and Timekeeping Clerks 24 643 730 87 14% $19.69
ACCT Insurance Claims and Policy Processing Clerks 23 601 664 63 10% $16.53
ACCT Securities, Commodities, and Financial Services Sales Agents 21 550 609 59 11% $28.47
ACCT Loan Interviewers and Clerks 13 455 546 91 20% $19.66
ACCT Financial Analysts 9 157 201 44 28% $41.22
ACCT Personal Financial Advisors 7 181 216 35 19% $40.08
ACCT Tax Preparers 7 199 225 26 13% $19.60
ACCT Budget Analysts 6 133 138 5 4% $31.12
ACCT Financial Specialists, All Other 6 305 327 22 7% $24.89
ACCT Credit Counselors 5 141 164 23 16% $22.74
ACCT Credit Analysts 4 74 91 17 23% $35.37
ACCT Financial Clerks, All Other 3 67 78 11 16% $18.98
ACCT Tax Examiners and Collectors, and Revenue Agents 2 72 67 (5) (7%) $34.31
ACCT New Accounts Clerks 2 59 60 1 2% $17.11
ACCT Credit Authorizers, Checkers, and Clerks 2 59 69 10 17% $15.77
ADJUS/CORREC Security Guards 77 2,693 3,014 321 12% $12.60
ADJUS/CORREC Protective Service Workers, All Other 54 633 706 73 12% $15.39
ADJUS/CORREC Dispatchers, Except Police, Fire, and Ambulance 47 982 1,133 151 15% $19.29
ADJUS/CORREC Police and Sheriff's Patrol Officers 18 440 479 39 9% $42.30
ADJUS/CORREC Correctional Officers and Jailers 13 390 407 17 4% $34.64
ADJUS/CORREC First-Line Supervisors of Protective Service Workers, All Other 5 140 159 19 14% $25.53
ADJUS/CORREC Detectives and Criminal Investigators 4 178 176 (2) (1%) $45.03
ADJUS/CORREC Police, Fire, and Ambulance Dispatchers 3 83 91 8 10% $24.91
ADJUS/CORREC Transportation Security Screeners 3 97 99 2 2% $19.78
SERVICE AREA JOB OPENINGS BY OCCUPATION (2015-2025) - RELATED TO EXISTING PROGRAMS (GROUPED BY DEPARTMENT)
San Bernard ino Va l l ey Co l lege / 2017 Comprehens ive Mas te r P lanA.158
2017 Comprehens ive Mas te r P lan Append ix / SBCCD / HMC Arch i tec ts + ALMA St ra teg ies

Related Program
Description Annual Openings
2015 Jobs
2025 Jobs
2015 - 2025 Change
2015 - 2025 % Change
Avg. Hourly Earnings
ADJUS/CORREC Probation Officers and Correctional Treatment Specialists 2 81 82 1 1% $40.30
ADJUS/CORREC First-Line Supervisors of Correctional Officers 2 50 51 1 2% $45.79
ADJUS/CORREC Private Detectives and Investigators 2 19 27 8 42% $28.02
ADJUS/CORREC First-Line Supervisors of Police and Detectives 1 26 30 4 16% $59.84
ADJUS/CORREC Administrative Law Judges, Adjudicators, and Hearing Officers Insf. Data 17 16 (1) (6%) $59.53
ADJUS/CORREC Judges, Magistrate Judges, and Magistrates Insf. Data 12 13 1 8% $103.50
AERO Aircraft Mechanics and Service Technicians 8 172 201 29 17% $28.03
AERO Aircraft Structure, Surfaces, Rigging, and Systems Assemblers 2 50 57 7 14% $24.25
AERO Air Traffic Controllers Insf. Data 14 15 1 7% $50.52
AERO Avionics Technicians Insf. Data 12 15 3 25% $31.79
ANTHRO Anthropologists and Archeologists 1 29 36 7 24% $25.59
ARCH Architectural and Engineering Managers 9 280 298 18 6% $63.84
ARCH Interior Designers 5 82 104 22 27% $25.00
ARCH Architects, Except Landscape and Naval 5 66 92 26 39% $44.10
ARCH Architectural and Civil Drafters 3 161 162 1 1% $28.12
ARCH Urban and Regional Planners 2 39 44 5 13% $38.29
ARCH Landscape Architects 2 36 44 8 22% $37.08
ARCH Drafters, All Other Insf. Data 22 25 3 13% $25.07
ART Graphic Designers 11 289 316 27 9% $21.66
ART Photographers 4 133 154 21 16% $21.97
ART Photographic Process Workers and Processing Machine Operators 2 56 62 6 11% $14.27
ART Fine Artists, Including Painters, Sculptors, and Illustrators 2 46 49 3 6% $38.37
ART Furnace, Kiln, Oven, Drier, and Kettle Operators and Tenders 1 34 34 0 0% $15.07
ART Fashion Designers 1 21 25 4 19% $27.45
ART Art Directors Insf. Data 24 26 2 8% $39.50
ART Designers, All Other Insf. Data 13 15 2 16% $24.48
ART Multimedia Artists and Animators Insf. Data 15 18 3 20% $30.40
ART Artists and Related Workers, All Other Insf. Data 18 19 1 5% $28.60
AUTO Maintenance and Repair Workers, General 109 3,016 3,478 462 15% $18.75
AUTO Automotive Service Technicians and Mechanics 101 2,350 2,707 357 15% $19.74
San Bernard ino Va l l ey Co l lege / 2017 Comprehens ive Mas te r P lan A.159
2017 Comprehens ive Mas te r P lan Append ix / SBCCD / HMC Arch i tec ts + ALMA St ra teg ies

Related Program
Description Annual Openings
2015 Jobs
2025 Jobs
2015 - 2025 Change
2015 - 2025 % Change
Avg. Hourly Earnings
AUTO First-Line Supervisors of Mechanics, Installers, and Repairers 43 1,048 1,177 129 12% $34.52
AUTO Industrial Machinery Mechanics 37 663 813 150 23% $26.05
AUTO Tire Repairers and Changers 30 685 737 52 8% $12.99
AUTO Installation, Maintenance, and Repair Workers, All Other 13 444 488 44 10% $18.20
AUTO Mobile Heavy Equipment Mechanics, Except Engines 12 316 337 21 7% $26.18
AUTO Maintenance Workers, Machinery 9 304 350 46 15% $21.61
AUTO Automotive Body and Related Repairers 8 327 284 (43) (13%) $21.44
AUTO Recreational Vehicle Service Technicians 3 58 61 3 5% $20.09
AUTO Motorboat Mechanics and Service Technicians 2 38 49 11 29% $18.05
AUTO Motorcycle Mechanics 2 48 54 6 13% $24.15
AUTO Outdoor Power Equipment and Other Small Engine Mechanics 2 40 46 6 15% $16.08
AUTO Engine and Other Machine Assemblers 2 53 59 6 11% $20.27
AUTO Automotive Glass Installers and Repairers 1 41 30 (11) (27%) $14.66
AUTO Farm Equipment Mechanics and Service Technicians Insf. Data 17 15 (2) (11%) $20.32
AUTO Electronic Equipment Installers and Repairers, Motor Vehicles Insf. Data 56 55 (1) (2%) $16.24
AUTO Insurance Appraisers, Auto Damage Insf. Data 24 21 (3) (12%) $25.17
BIOL Physicians and Surgeons, All Other 51 943 1,177 234 25% $59.30
BIOL Family and General Practitioners 24 509 602 93 18% $101.26
BIOL Medical and Clinical Laboratory Technicians 21 319 427 108 34% $19.56
BIOL Medical and Clinical Laboratory Technologists 11 163 220 57 35% $33.10
BIOL Medical Scientists, Except Epidemiologists 10 238 277 39 16% $43.14
BIOL Surgeons 9 152 195 43 28% $103.52
BIOL Forest and Conservation Technicians 8 202 185 (17) (8%) $19.94
BIOL Veterinary Assistants and Laboratory Animal Caretakers 6 255 268 13 5% $13.89
BIOL Anesthesiologists 6 102 134 32 31% $112.30
BIOL Veterinary Technologists and Technicians 6 152 191 39 26% $15.58
BIOL Internists, General 5 74 103 29 39% $85.18
BIOL Life, Physical, and Social Science Technicians, All Other 5 86 100 14 16% $24.95
BIOL Veterinarians 5 103 117 14 14% $45.07
BIOL Pediatricians, General 5 92 114 22 24% $89.48
SERVICE AREA JOB OPENINGS BY OCCUPATION (2015-2025) - RELATED TO EXISTING PROGRAMS (GROUPED BY DEPARTMENT) (cont.)
San Bernard ino Va l l ey Co l lege / 2017 Comprehens ive Mas te r P lanA.160
2017 Comprehens ive Mas te r P lan Append ix / SBCCD / HMC Arch i tec ts + ALMA St ra teg ies

Related Program
Description Annual Openings
2015 Jobs
2025 Jobs
2015 - 2025 Change
2015 - 2025 % Change
Avg. Hourly Earnings
BIOL Health Diagnosing and Treating Practitioners, All Other 5 163 172 9 6% $32.31
BIOL Biological Technicians 4 86 101 15 17% $19.63
BIOL Obstetricians and Gynecologists 4 67 83 16 24% $114.46
BIOL Biomedical Engineers 3 83 81 (2) (2%) $48.14
BIOL Biological Scientists, All Other 3 86 81 (5) (6%) $32.72
BIOL Chiropractors 2 59 68 9 15% $44.31
BIOL Microbiologists 2 27 32 5 19% $35.44
BIOL Life Scientists, All Other Insf. Data 15 18 3 21% $45.07
BIOL Soil and Plant Scientists Insf. Data 11 13 2 18% $30.99
BIOL Zoologists and Wildlife Biologists Insf. Data 24 25 1 4% $32.59
BIOL Forest and Conservation Workers Insf. Data 19 20 1 5% $12.02
BIOL Genetic Counselors Insf. Data 14 18 4 29% $31.40
BUSAD Office Clerks, General 265 8,271 9,081 810 10% $14.58
BUSAD General and Operations Managers 205 5,653 6,550 897 16% $51.26
BUSAD First-Line Supervisors of Office and Administrative Support Workers 179 4,033 4,766 733 18% $25.41
BUSADSecretaries and Administrative Assistants, Except Legal, Medical, and
Executive149 5,094 5,910 816 16% $17.90
BUSAD Receptionists and Information Clerks 131 2,656 3,167 511 19% $13.52
BUSAD Business Operations Specialists, All Other 47 1,865 2,061 196 11% $31.15
BUSAD Office and Administrative Support Workers, All Other 45 1,361 1,409 48 4% $13.19
BUSAD Sales Managers 43 1,171 1,334 163 14% $54.11
BUSAD Management Analysts 40 985 1,212 227 23% $39.36
BUSAD Market Research Analysts and Marketing Specialists 39 747 1,011 264 35% $27.70
BUSAD Human Resources Specialists 37 1,053 1,207 154 15% $28.28
BUSAD Production, Planning, and Expediting Clerks 37 890 1,013 123 14% $19.92
BUSAD Order Clerks 31 838 915 77 9% $16.52
BUSAD Cost Estimators 28 643 679 36 6% $31.88
BUSAD Executive Secretaries and Executive Administrative Assistants 26 1,343 1,425 82 6% $25.88
BUSAD Transportation, Storage, and Distribution Managers 24 481 594 113 23% $41.14
BUSAD Administrative Services Managers 23 641 752 111 17% $39.84
San Bernard ino Va l l ey Co l lege / 2017 Comprehens ive Mas te r P lan A.161
2017 Comprehens ive Mas te r P lan Append ix / SBCCD / HMC Arch i tec ts + ALMA St ra teg ies

Related Program
Description Annual Openings
2015 Jobs
2025 Jobs
2015 - 2025 Change
2015 - 2025 % Change
Avg. Hourly Earnings
BUSAD Chief Executives 18 518 577 59 11% $87.79
BUSAD Paralegals and Legal Assistants 17 475 555 80 17% $24.15
BUSAD Managers, All Other 17 492 545 53 11% $50.57
BUSAD Claims Adjusters, Examiners, and Investigators 16 638 606 (32) (5%) $29.26
BUSAD First-Line Supervisors of Non-Retail Sales Workers 16 517 600 83 16% $29.95
BUSAD Purchasing Agents, Except Wholesale, Retail, and Farm Products 16 556 603 47 8% $26.62
BUSAD File Clerks 15 546 565 19 3% $15.01
BUSAD Human Resources Assistants, Except Payroll and Timekeeping 15 415 452 37 9% $18.38
BUSAD Education Administrators, Postsecondary 14 276 330 54 20% $52.22
BUSAD Compliance Officers 14 497 533 36 7% $34.05
BUSAD Marketing Managers 11 253 301 48 19% $58.91
BUSAD Human Resources Managers 11 218 260 42 19% $48.39
BUSAD Procurement Clerks 10 204 221 17 8% $20.21
BUSAD Advertising Sales Agents 7 193 177 (16) (8%) $20.29
BUSAD Purchasing Managers 5 131 144 13 10% $46.51
BUSAD Compensation, Benefits, and Job Analysis Specialists 4 130 148 18 14% $29.93
BUSAD Legal Secretaries 4 166 181 15 9% $17.50
BUSAD Sales Engineers 4 88 109 21 24% $46.05
BUSAD Labor Relations Specialists 3 183 172 (11) (6%) $32.53
BUSAD Insurance Underwriters 3 85 84 (1) (1%) $28.51
BUSAD Court, Municipal, and License Clerks 2 76 86 10 13% $21.02
BUSAD Training and Development Managers 2 41 50 9 22% $49.74
BUSAD Advertising and Promotions Managers 2 47 50 3 6% $39.05
BUSAD Legal Support Workers, All Other 2 95 94 (1) (1%) $21.88
BUSAD Correspondence Clerks 1 20 25 5 25% $12.60
BUSAD Arbitrators, Mediators, and Conciliators Insf. Data 14 15 1 7% $35.89
BUSAD Compensation and Benefits Managers Insf. Data 22 25 3 14% $57.24
CD Elementary School Teachers, Except Special Education 187 5,414 6,019 605 11% $35.16
CD Teacher Assistants 138 4,410 4,745 335 8% $14.34
CD Substitute Teachers 95 4,343 4,535 192 4% $18.57
SERVICE AREA JOB OPENINGS BY OCCUPATION (2015-2025) - RELATED TO EXISTING PROGRAMS (GROUPED BY DEPARTMENT) (cont.)
San Bernard ino Va l l ey Co l lege / 2017 Comprehens ive Mas te r P lanA.162
2017 Comprehens ive Mas te r P lan Append ix / SBCCD / HMC Arch i tec ts + ALMA St ra teg ies

Related Program
Description Annual Openings
2015 Jobs
2025 Jobs
2015 - 2025 Change
2015 - 2025 % Change
Avg. Hourly Earnings
CD Childcare Workers 86 2,082 2,289 207 10% $12.70
CDSecondary School Teachers, Except Special and Career/Technical
Education84 2,317 2,500 183 8% $33.44
CD Middle School Teachers, Except Special and Career/Technical Education 57 1,528 1,733 205 13% $34.95
CD Kindergarten Teachers, Except Special Education 37 919 1,013 94 10% $31.29
CD Preschool Teachers, Except Special Education 37 893 991 98 11% $15.11
CD Teachers and Instructors, All Other 27 970 1,064 94 10% $27.41
CD Education Administrators, Elementary and Secondary School 22 633 680 47 7% $50.70
CD Special Education Teachers, Kindergarten and Elementary School 18 691 743 52 8% $36.51
CD Special Education Teachers, Secondary School 8 301 325 24 8% $33.50
CD Special Education Teachers, Middle School 6 246 263 17 7% $31.80
CD Education Administrators, All Other 5 132 145 13 10% $44.33
CD Career/Technical Education Teachers, Secondary School 5 116 128 12 10% $32.76
CD Education Administrators, Preschool and Childcare Center/Program 4 103 116 13 13% $25.32
CD Special Education Teachers, All Other 4 119 134 15 13% $37.72
CD Special Education Teachers, Preschool 3 61 81 20 33% $24.36
CHEM Chemists 5 105 127 22 21% $31.11
CHEM Chemical Technicians 4 63 80 17 27% $20.75
CHEM Chemical Plant and System Operators 2 36 36 0 0% $28.17
CHEM Chemical Equipment Operators and Tenders 2 29 32 3 10% $18.12
CHEM Forensic Science Technicians 1 24 27 3 12% $31.73
CHEM Chemical Engineers Insf. Data 25 27 2 8% $47.40
CIT/CS Computer User Support Specialists 32 846 1,020 174 21% $25.64
CIT/CS Software Developers, Applications 26 733 890 157 21% $48.76
CIT/CS Computer Systems Analysts 23 489 629 140 29% $37.33
CIT/CS Network and Computer Systems Administrators 18 534 626 92 17% $41.97
CIT/CS Computer and Information Systems Managers 14 419 492 73 17% $56.45
CIT/CS Computer Programmers 10 204 242 38 19% $37.42
CIT/CS Software Developers, Systems Software 9 155 217 62 40% $50.25
CIT/CS Computer Occupations, All Other 7 268 287 19 7% $37.33
San Bernard ino Va l l ey Co l lege / 2017 Comprehens ive Mas te r P lan A.163
2017 Comprehens ive Mas te r P lan Append ix / SBCCD / HMC Arch i tec ts + ALMA St ra teg ies

Related Program
Description Annual Openings
2015 Jobs
2025 Jobs
2015 - 2025 Change
2015 - 2025 % Change
Avg. Hourly Earnings
CIT/CS Computer Network Support Specialists 6 224 250 26 12% $31.84
CIT/CS Web Developers 6 161 190 29 18% $31.00
CIT/CS Database Administrators 5 106 129 23 22% $40.57
CIT/CS Computer Network Architects 4 72 94 22 31% $50.69
CIT/CS Information Security Analysts 3 44 64 20 45% $46.27
CIT/CS Computer Operators 2 114 115 1 1% $19.30
CIT/CS Computer Hardware Engineers 1 18 24 6 34% $53.23
CIT/CS Computer and Information Research Scientists 1 36 41 5 14% $50.70
COMMSTSales Representatives, Wholesale and Manufacturing, Except Technical
and Scientific Products145 3,127 3,886 759 24% $31.53
COMMST Sales Representatives, Services, All Other 90 1,957 2,276 319 16% $27.26
COMMSTSales Representatives, Wholesale and Manufacturing, Technical and
Scientific Products24 454 590 136 30% $34.28
COMMST Public Relations Specialists 8 230 274 44 19% $25.82
COMMST Audio and Video Equipment Technicians 5 155 172 17 11% $17.66
COMMST Radio and Television Announcers 4 124 138 14 11% $14.49
COMMST Fundraisers 4 71 91 20 28% $26.71
COMMST Public Relations and Fundraising Managers 3 63 77 14 22% $45.79
COMMST Media and Communication Workers, All Other 1 50 54 4 8% $18.92
COMMST Broadcast Technicians Insf. Data 13 14 1 8% $26.34
COMMST Audio-Visual and Multimedia Collections Specialists Insf. Data 43 42 (1) (2%) $18.65
COMMST Reporters and Correspondents Insf. Data 24 <10 Insf. Data $18.83
COMMST Media and Communication Equipment Workers, All Other Insf. Data 32 30 (2) (6%) $31.60
COMMST Sound Engineering Technicians Insf. Data 13 14 1 8% $20.45
CULART First-Line Supervisors of Food Preparation and Serving Workers 150 2,678 3,316 638 24% $14.93
CULART Bakers 41 989 1,117 128 13% $12.43
CULART Cooks, Institution and Cafeteria 37 788 982 194 25% $13.96
CULART Food Service Managers 27 861 962 101 12% $23.91
CULART Butchers and Meat Cutters 21 493 574 81 16% $14.78
CULART Food Batchmakers 20 452 485 33 7% $13.49
SERVICE AREA JOB OPENINGS BY OCCUPATION (2015-2025) - RELATED TO EXISTING PROGRAMS (GROUPED BY DEPARTMENT) (cont.)
San Bernard ino Va l l ey Co l lege / 2017 Comprehens ive Mas te r P lanA.164
2017 Comprehens ive Mas te r P lan Append ix / SBCCD / HMC Arch i tec ts + ALMA St ra teg ies

Related Program
Description Annual Openings
2015 Jobs
2025 Jobs
2015 - 2025 Change
2015 - 2025 % Change
Avg. Hourly Earnings
CULART Chefs and Head Cooks 12 382 431 49 13% $17.50
CULART Food Processing Workers, All Other 4 93 106 13 14% $14.19
CULART Food Cooking Machine Operators and Tenders 3 86 94 8 9% $14.23
CULART Cooks, All Other 2 36 48 12 33% $12.87
CULART Cooks, Private Household Insf. Data 15 16 1 7% $20.90
DANCE Choreographers Insf. Data 15 18 3 20% $28.78
DANCE Dancers Insf. Data 22 20 (2) (9%) $14.38
DIESEL Bus and Truck Mechanics and Diesel Engine Specialists 49 1,374 1,549 175 13% $21.75
ECON Economists 2 47 56 9 19% $33.80
ELEC/ELECTR Electricians 44 1,290 1,450 160 12% $29.52
ELEC/ELECTR Electrical Power-Line Installers and Repairers 27 448 529 81 18% $44.14
ELEC/ELECTR Telecommunications Line Installers and Repairers 18 398 473 75 19% $25.86
ELEC/ELECTRTelecommunications Equipment Installers and Repairers, Except Line
Installers14 432 502 70 16% $28.94
ELEC/ELECTR Home Appliance Repairers 14 254 303 49 19% $22.76
ELEC/ELECTR Electrical and Electronic Equipment Assemblers 10 278 328 50 18% $15.45
ELEC/ELECTR Control and Valve Installers and Repairers, Except Mechanical Door 8 195 195 0 0% $31.40
ELEC/ELECTR Power Plant Operators 8 192 196 4 2% $31.42
ELEC/ELECTR Electronics Engineers, Except Computer 8 254 264 10 4% $46.21
ELEC/ELECTR Electrical and Electronics Engineering Technicians 7 232 246 14 6% $29.18
ELEC/ELECTR Computer, Automated Teller, and Office Machine Repairers 6 125 156 31 25% $17.44
ELEC/ELECTR Electrical Engineers 6 131 154 23 18% $46.42
ELEC/ELECTR Medical Equipment Repairers 6 69 101 32 46% $26.70
ELEC/ELECTR Helpers--Electricians 5 110 137 27 25% $13.98
ELEC/ELECTRElectrical and Electronics Repairers, Commercial and Industrial
Equipment5 140 154 14 10% $28.15
ELEC/ELECTR Electronic Home Entertainment Equipment Installers and Repairers 4 81 86 5 6% $21.84
ELEC/ELECTR Meter Readers, Utilities 3 109 92 (17) (16%) $22.65
ELEC/ELECTR Solar Photovoltaic Installers 2 54 61 7 13% $23.77
ELEC/ELECTR Electrical and Electronics Drafters 2 64 69 5 8% $29.00
San Bernard ino Va l l ey Co l lege / 2017 Comprehens ive Mas te r P lan A.165
2017 Comprehens ive Mas te r P lan Append ix / SBCCD / HMC Arch i tec ts + ALMA St ra teg ies

Related Program
Description Annual Openings
2015 Jobs
2025 Jobs
2015 - 2025 Change
2015 - 2025 % Change
Avg. Hourly Earnings
ELEC/ELECTR Electromechanical Equipment Assemblers 2 47 52 5 11% $14.31
ELEC/ELECTR Electrical and Electronics Repairers, Powerhouse, Substation, and Relay 1 28 33 5 18% $38.78
ELEC/ELECTR Precision Instrument and Equipment Repairers, All Other 1 25 29 4 16% $25.72
ELEC/ELECTR Electro-Mechanical Technicians Insf. Data 13 14 1 8% $27.61
ELEC/ELECTR Radio, Cellular, and Tower Equipment Installers and Repairs Insf. Data 34 36 2 6% $23.21
ELEC/ELECTR Electric Motor, Power Tool, and Related Repairers Insf. Data 18 21 3 17% $23.76
ELEC/ELECTRElectrical and Electronics Installers and Repairers, Transportation
EquipmentInsf. Data 13 14 1 8% $25.72
ENGLAdult Basic and Secondary Education and Literacy Teachers and
Instructors4 160 176 16 10% $39.59
ENGL Technical Writers 3 53 65 12 23% $38.11
ENGL Editors 2 48 42 (6) (12%) $21.86
ENGL Writers and Authors 1 37 40 3 8% $31.18
ENGL Court Reporters Insf. Data 23 24 1 4% $40.85
ENGR Civil Engineers 16 502 530 28 6% $46.07
ENGR Industrial Engineers 12 250 282 32 13% $37.34
ENGR Engineering Technicians, Except Drafters, All Other 5 197 200 3 2% $31.38
ENGR Engineers, All Other 5 194 202 8 4% $46.07
ENGR Environmental Engineers 3 67 78 11 16% $43.01
ENGR Environmental Engineering Technicians 2 37 44 7 19% $24.60
ENGR Civil Engineering Technicians 1 49 49 0 0% $30.26
FN Dietitians and Nutritionists 7 173 219 46 27% $33.00
FN Dietetic Technicians 4 138 164 26 19% $14.51
FN Agricultural and Food Science Technicians 4 81 86 5 6% $14.22
FN Food Scientists and Technologists 3 56 63 7 12% $28.26
GEOG Surveyors 3 82 90 8 10% $34.47
GEOG Surveying and Mapping Technicians 2 47 55 8 17% $28.40
GEOG Cartographers and Photogrammetrists 1 32 38 6 19% $27.22
GEOL Geoscientists, Except Hydrologists and Geographers 2 46 52 6 13% $37.26
GEOL Geological and Petroleum Technicians Insf. Data 11 13 2 18% $25.54
SERVICE AREA JOB OPENINGS BY OCCUPATION (2015-2025) - RELATED TO EXISTING PROGRAMS (GROUPED BY DEPARTMENT) (cont.)
San Bernard ino Va l l ey Co l lege / 2017 Comprehens ive Mas te r P lanA.166
2017 Comprehens ive Mas te r P lan Append ix / SBCCD / HMC Arch i tec ts + ALMA St ra teg ies

Related Program
Description Annual Openings
2015 Jobs
2025 Jobs
2015 - 2025 Change
2015 - 2025 % Change
Avg. Hourly Earnings
HIST Library Technicians 10 156 169 13 8% $18.40
HIST Museum Technicians and Conservators Insf. Data 12 12 0 0% $18.45
HUMSERV Marriage and Family Therapists 3 88 99 11 13% $24.86
HUMSV Social and Human Service Assistants 67 1,055 1,383 328 31% $15.70
HUMSV Healthcare Social Workers 34 534 731 197 37% $31.15
HUMSV Rehabilitation Counselors 25 504 623 119 24% $16.58
HUMSV Educational, Guidance, School, and Vocational Counselors 24 755 826 71 9% $30.88
HUMSV Social and Community Service Managers 18 303 407 104 34% $38.18
HUMSV Child, Family, and School Social Workers 15 364 429 65 18% $24.61
HUMSV Community and Social Service Specialists, All Other 15 260 327 67 26% $19.75
HUMSV Mental Health Counselors 14 350 408 58 17% $20.41
HUMSV Substance Abuse and Behavioral Disorder Counselors 10 260 298 38 15% $19.11
HUMSV Social Workers, All Other 10 292 319 27 9% $28.86
HUMSV Mental Health and Substance Abuse Social Workers 9 203 247 44 22% $22.90
HUMSV Occupational Therapists 9 227 282 55 24% $43.41
HUMSV Community Health Workers 9 131 177 46 35% $21.24
HUMSV Health Educators 7 131 158 27 21% $24.92
HUMSV Occupational Therapy Assistants 4 69 90 21 30% $30.98
HUMSV Recreational Therapists 3 55 67 12 22% $34.05
HVAC/R Heating, Air Conditioning, and Refrigeration Mechanics and Installers 25 599 684 85 14% $24.50
HVAC/R Cooling and Freezing Equipment Operators and Tenders Insf. Data 13 16 3 22% $15.22
INSPEC Inspectors, Testers, Sorters, Samplers, and Weighers 50 1,258 1,437 179 14% $17.45
INSPEC Construction and Building Inspectors 5 127 141 14 11% $38.22
INSPEC Transportation Inspectors 3 56 65 9 16% $23.65
KIN Physical Therapists 22 401 505 104 26% $41.70
KIN Fitness Trainers and Aerobics Instructors 15 525 611 86 16% $18.73
KIN Physical Therapist Assistants 9 157 202 45 29% $29.93
KIN Massage Therapists 8 231 283 52 23% $20.35
KIN Physical Therapist Aides 5 102 124 22 22% $13.69
KIN Athletic Trainers 2 28 35 7 25% $20.95
San Bernard ino Va l l ey Co l lege / 2017 Comprehens ive Mas te r P lan A.167
2017 Comprehens ive Mas te r P lan Append ix / SBCCD / HMC Arch i tec ts + ALMA St ra teg ies

Related Program
Description Annual Openings
2015 Jobs
2025 Jobs
2015 - 2025 Change
2015 - 2025 % Change
Avg. Hourly Earnings
KIN Exercise Physiologists Insf. Data 11 14 3 28% $25.08
MACH Machinists 39 1,012 1,144 132 13% $17.25
MACH Assemblers and Fabricators, All Other 20 556 643 87 16% $13.41
MACH Mixing and Blending Machine Setters, Operators, and Tenders 15 372 391 19 5% $15.14
MACH Computer-Controlled Machine Tool Operators, Metal and Plastic 13 256 305 49 19% $17.42
MACH Woodworking Machine Setters, Operators, and Tenders, Except Sawing 9 265 311 46 17% $12.90
MACHCutting, Punching, and Press Machine Setters, Operators, and Tenders,
Metal and Plastic8 612 600 (12) (2%) $16.49
MACHSeparating, Filtering, Clarifying, Precipitating, and Still Machine Setters,
Operators, and Tenders6 93 118 25 27% $15.43
MACH Rolling Machine Setters, Operators, and Tenders, Metal and Plastic 6 217 223 6 3% $16.39
MACHMolding, Coremaking, and Casting Machine Setters, Operators, and
Tenders, Metal and Plastic6 374 355 (19) (5%) $14.84
MACHExtruding, Forming, Pressing, and Compacting Machine Setters,
Operators, and Tenders5 162 149 (13) (8%) $12.97
MACHGrinding, Lapping, Polishing, and Buffing Machine Tool Setters,
Operators, and Tenders, Metal and Plastic5 219 194 (25) (11%) $14.34
MACHExtruding and Forming Machine Setters, Operators, and Tenders,
Synthetic and Glass Fibers4 60 85 25 42% $14.71
MACHComputer Numerically Controlled Machine Tool Programmers, Metal and
Plastic4 61 80 19 31% $24.72
MACH Forging Machine Setters, Operators, and Tenders, Metal and Plastic 4 145 146 1 1% $16.95
MACHLathe and Turning Machine Tool Setters, Operators, and Tenders, Metal
and Plastic3 141 140 (1) (1%) $17.00
MACH Paper Goods Machine Setters, Operators, and Tenders 3 238 220 (18) (8%) $18.40
MACH Multiple Machine Tool Setters, Operators, and Tenders, Metal and Plastic 3 107 110 3 3% $15.68
MACHMilling and Planing Machine Setters, Operators, and Tenders, Metal and
Plastic3 140 133 (7) (5%) $16.52
MACHExtruding and Drawing Machine Setters, Operators, and Tenders, Metal
and Plastic3 97 101 4 4% $14.01
SERVICE AREA JOB OPENINGS BY OCCUPATION (2015-2025) - RELATED TO EXISTING PROGRAMS (GROUPED BY DEPARTMENT) (cont.)
San Bernard ino Va l l ey Co l lege / 2017 Comprehens ive Mas te r P lanA.168
2017 Comprehens ive Mas te r P lan Append ix / SBCCD / HMC Arch i tec ts + ALMA St ra teg ies

Related Program
Description Annual Openings
2015 Jobs
2025 Jobs
2015 - 2025 Change
2015 - 2025 % Change
Avg. Hourly Earnings
MACH Mechanical Drafters 2 123 120 (3) (2%) $25.73
MACH Metal Workers and Plastic Workers, All Other 2 101 108 7 7% $13.26
MACHCrushing, Grinding, and Polishing Machine Setters, Operators, and
Tenders2 59 51 (8) (14%) $17.89
MACHPlating and Coating Machine Setters, Operators, and Tenders, Metal and
Plastic2 97 83 (14) (14%) $15.29
MACH Cutting and Slicing Machine Setters, Operators, and Tenders 1 74 64 (10) (13%) $17.33
MACHDrilling and Boring Machine Tool Setters, Operators, and Tenders, Metal
and Plastic1 67 61 (6) (9%) $13.74
MACH Millwrights 1 38 43 5 13% $21.85
MACH Roustabouts, Oil and Gas 1 29 31 2 7% $20.67
MACH Patternmakers, Metal and Plastic Insf. Data 25 25 0 0% $15.08
MATH Logisticians 11 285 360 75 26% $36.81
MATH Operations Research Analysts 3 48 68 20 42% $41.53
MATH Statisticians 1 16 22 6 39% $31.66
MODLANG Interpreters and Translators 7 149 196 47 32% $19.93
MUS Musicians and Singers 4 97 99 2 2% $32.89
MUS Music Directors and Composers 3 68 72 4 6% $25.52
MUS Musical Instrument Repairers and Tuners Insf. Data 12 16 4 32% $20.14
NURS Registered Nurses 368 8,305 10,147 1,842 22% $42.92
NURS Nursing Assistants 198 3,597 4,755 1,158 32% $13.58
NURS Home Health Aides 172 1,596 2,854 1,258 79% $13.22
NURS Licensed Practical and Licensed Vocational Nurses 134 2,327 2,994 667 29% $23.13
NURS Medical Assistants 123 2,603 3,257 654 25% $14.07
NURS Medical Secretaries 89 2,008 2,613 605 30% $15.71
NURS Medical Records and Health Information Technicians 30 550 685 135 25% $21.75
NURS Nurse Practitioners 22 366 499 133 36% $55.05
NURS Health Technologists and Technicians, All Other 19 601 726 125 21% $21.00
NURS Phlebotomists 19 409 505 96 23% $16.63
NURS Physician Assistants 16 236 344 108 46% $49.38
San Bernard ino Va l l ey Co l lege / 2017 Comprehens ive Mas te r P lan A.169
2017 Comprehens ive Mas te r P lan Append ix / SBCCD / HMC Arch i tec ts + ALMA St ra teg ies

Related Program
Description Annual Openings
2015 Jobs
2025 Jobs
2015 - 2025 Change
2015 - 2025 % Change
Avg. Hourly Earnings
NURS Healthcare Practitioners and Technical Workers, All Other 14 340 375 35 10% $29.42
NURS Healthcare Support Workers, All Other 13 378 428 50 13% $16.86
NURS Surgical Technologists 12 279 367 88 32% $23.48
NURS Medical Equipment Preparers 9 236 276 40 17% $19.98
NURS Cardiovascular Technologists and Technicians 8 180 231 51 28% $25.18
NURS Nurse Anesthetists 3 39 62 23 59% $68.78
NURS Medical Transcriptionists 3 71 88 17 24% $23.08
NURS Nurse Midwives Insf. Data 13 17 4 31% $48.52
PHIL Lawyers 20 541 639 98 18% $57.01
PHT Pharmacists 42 849 1,039 190 22% $63.37
PHT Pharmacy Technicians 38 981 1,250 269 27% $17.98
PHT Pharmacy Aides 9 252 289 37 15% $14.73
PHYS Materials Engineers 1 27 29 2 7% $42.95
PHYSICS Mechanical Engineers 13 289 313 24 8% $41.17
PHYSICS Aerospace Engineers 2 50 53 3 6% $46.38
PHYSICS Mechanical Engineering Technicians 1 41 45 4 10% $22.07
PS Environmental Scientists and Specialists, Including Health 12 257 297 40 16% $38.30
PS Environmental Science and Protection Technicians, Including Health 3 39 53 14 36% $24.51
PS Conservation Scientists Insf. Data 17 17 0 0% $37.52
PS Physical Scientists, All Other Insf. Data 28 27 (1) (4%) $47.70
PSYCH Clinical, Counseling, and School Psychologists 17 431 474 43 10% $41.37
PSYCH Psychiatrists 4 73 87 14 19% $111.90
PSYCH Counselors, All Other 2 58 67 9 16% $14.59
PSYCH Therapists, All Other 1 28 35 7 25% $36.23
PSYCH Psychologists, All Other Insf. Data 27 28 1 4% $39.53
PSYTCH Psychiatric Technicians 4 245 256 11 4% $27.39
PSYTCH Psychiatric Aides 3 112 119 7 6% $13.37
REALST Property, Real Estate, and Community Association Managers 17 390 465 75 19% $29.81
REALST Real Estate Sales Agents 7 208 248 40 19% $25.63
REALST Title Examiners, Abstractors, and Searchers 3 129 136 7 5% $27.41
SERVICE AREA JOB OPENINGS BY OCCUPATION (2015-2025) - RELATED TO EXISTING PROGRAMS (GROUPED BY DEPARTMENT) (cont.)
San Bernard ino Va l l ey Co l lege / 2017 Comprehens ive Mas te r P lanA.170
2017 Comprehens ive Mas te r P lan Append ix / SBCCD / HMC Arch i tec ts + ALMA St ra teg ies

Related Program
Description Annual Openings
2015 Jobs
2025 Jobs
2015 - 2025 Change
2015 - 2025 % Change
Avg. Hourly Earnings
REALST Real Estate Brokers 2 111 119 8 7% $30.89
REALST Appraisers and Assessors of Real Estate 1 43 52 9 21% $34.12
RELIG Clergy 8 155 196 41 27% $28.77
RELIG Directors, Religious Activities and Education 7 114 138 24 21% $22.16
RELIG Religious Workers, All Other 1 24 31 7 29% $23.80
SOC Social Science Research Assistants 1 12 18 6 50% $22.15
SOC Social Scientists and Related Workers, All Other 1 53 54 1 2% $36.09
THART Actors 7 179 183 4 2% $34.35
THART Producers and Directors 2 49 53 4 8% $32.96
THART Costume Attendants 1 19 19 0 0% $20.94
THART Entertainers and Performers, Sports and Related Workers, All Other Insf. Data 13 16 3 22% $18.76
THRAT Set and Exhibit Designers Insf. Data 11 12 1 9% $21.36
WELD Welders, Cutters, Solderers, and Brazers 29 950 908 (42) (4%) $17.53
WELD Structural Metal Fabricators and Fitters 10 219 198 (21) (10%) $16.24
WELD Sheet Metal Workers 9 296 294 (2) (1%) $23.14
WELD Structural Iron and Steel Workers 6 175 146 (29) (17%) $33.68
WELDWelding, Soldering, and Brazing Machine Setters, Operators, and
Tenders4 73 86 13 18% $15.40
WELD Boilermakers 1 22 23 1 5% $36.26
WELD Pourers and Casters, Metal 1 77 71 (6) (8%) $14.50
WST Water and Wastewater Treatment Plant and System Operators 6 116 126 10 9% $31.20
WST Plant and System Operators, All Other Insf. Data 19 20 1 5% $25.25
San Bernard ino Va l l ey Co l lege / 2017 Comprehens ive Mas te r P lan A.171
2017 Comprehens ive Mas te r P lan Append ix / SBCCD / HMC Arch i tec ts + ALMA St ra teg ies

Related Program
Description Annual Openings
2015 Jobs
2025 Jobs
2015 - 2025 Change
2015 - 2025 % Change
Avg. Hourly Earnings
ACCT Accountants and Auditors 393 7,554 9,014 1,460 19% $43.04
ACCT Bookkeeping, Accounting, and Auditing Clerks 347 13,270 15,416 2,146 16% $14.57
ACCT Tellers 199 3,782 3,963 181 5% $51.21
ACCT Billing and Posting Clerks 193 4,507 5,495 988 22% $12.10
ACCT Bill and Account Collectors 164 3,586 4,136 550 15% $25.37
ACCT Financial Managers 124 3,970 4,426 456 11% $35.11
ACCT Cost Estimators 118 2,486 2,763 277 11% $31.15
ACCT Insurance Claims and Policy Processing Clerks 88 2,051 2,344 293 14% $13.61
ACCT Payroll and Timekeeping Clerks 80 2,173 2,463 290 13% $15.07
ACCT Loan Officers 70 1,990 2,302 312 16% $17.85
ACCT Securities, Commodities, and Financial Services Sales Agents 64 2,009 2,163 154 8% $13.32
ACCT Loan Interviewers and Clerks 35 1,444 1,690 246 17% $18.77
ACCT Financial Analysts 31 564 719 155 28% $14.32
ACCT Personal Financial Advisors 29 705 863 158 22% $13.51
ACCT Budget Analysts 26 561 591 30 5% $33.59
ACCT Tax Preparers 26 663 774 111 17% $23.06
ACCT Financial Specialists, All Other 20 1,066 1,145 79 7% $19.07
ACCT Credit Counselors 17 450 530 80 18% $13.80
ACCT Tax Examiners and Collectors, and Revenue Agents 13 369 370 1 0% $19.46
ACCT Credit Analysts 12 252 305 53 21% $27.17
ACCT Financial Clerks, All Other 10 238 269 31 13% $18.55
ACCT Credit Authorizers, Checkers, and Clerks 5 195 224 29 15% $15.64
ACCT New Accounts Clerks 5 200 197 (3) (2%) $33.39
ACCT Brokerage Clerks 5 160 158 (2) (1%) $42.09
ACCT Actuaries 3 29 45 16 56% $12.69
ACCT Financial Examiners 2 41 49 8 20% $15.37
ADJUS/CORREC Security Guards 650 15,768 19,495 3,727 24% $14.22
ADJUS/CORREC Police and Sheriff's Patrol Officers 253 5,832 6,428 596 10% $17.05
ADJUS/CORREC Protective Service Workers, All Other 202 2,457 2,692 235 10% $33.49
ADJUS/CORREC Correctional Officers and Jailers 178 4,801 5,237 436 9% $34.91
REGIONAL JOB OPENINGS BY OCCUPATION (2015-2025) - RELATED TO EXISTING PROGRAMS (GROUPED BY DEPARTMENT)
San Bernard ino Va l l ey Co l lege / 2017 Comprehens ive Mas te r P lanA.172
2017 Comprehens ive Mas te r P lan Append ix / SBCCD / HMC Arch i tec ts + ALMA St ra teg ies

Related Program
Description Annual Openings
2015 Jobs
2025 Jobs
2015 - 2025 Change
2015 - 2025 % Change
Avg. Hourly Earnings
ADJUS/CORREC Dispatchers, Except Police, Fire, and Ambulance 132 2,766 3,217 451 16% $15.89
ADJUS/CORREC First-Line Supervisors of Protective Service Workers, All Other 36 745 913 168 23% $13.21
ADJUS/CORREC Police, Fire, and Ambulance Dispatchers 35 819 914 95 12% $28.91
ADJUS/CORREC Detectives and Criminal Investigators 30 1,127 1,173 46 4% $31.48
ADJUS/CORREC Probation Officers and Correctional Treatment Specialists 29 995 1,021 26 3% $16.64
ADJUS/CORREC First-Line Supervisors of Correctional Officers 26 588 633 45 8% $34.30
ADJUS/CORREC First-Line Supervisors of Police and Detectives 17 314 377 63 20% $53.83
ADJUS/CORREC Private Detectives and Investigators 9 104 158 54 52% $39.81
ADJUS/CORREC Transportation Security Screeners 8 281 290 9 3% $21.40
ADJUS/CORREC Judges, Magistrate Judges, and Magistrates 4 163 176 13 8% $17.44
ADJUS/CORREC Parking Enforcement Workers 4 115 116 1 1% $27.93
ADJUS/CORREC Administrative Law Judges, Adjudicators, and Hearing Officers 2 109 111 2 2% $59.06
ADJUS/CORREC Bailiffs 1 14 23 9 62% $63.40
ADJUS/CORREC Transit and Railroad Police Insf. Data 10 12 2 19% $17.34
AERO Aircraft Mechanics and Service Technicians 43 862 1,032 170 20% $19.06
AERO Aircraft Structure, Surfaces, Rigging, and Systems Assemblers 5 168 186 18 11% $17.97
AERO Avionics Technicians 3 56 72 16 29% $55.56
AERO Air Traffic Controllers 3 43 49 6 14% $28.35
ANTHRO Anthropologists and Archeologists 4 101 118 17 17% $31.63
ARCH Architectural and Engineering Managers 34 1,114 1,173 59 5% $19.91
ARCH Urban and Regional Planners 24 414 456 42 10% $26.08
ARCH Interior Designers 18 372 439 67 18% $24.11
ARCH Architects, Except Landscape and Naval 17 284 376 92 32% $25.42
ARCH Architectural and Civil Drafters 12 680 667 (13) (2%) $12.47
ARCH Landscape Architects 7 163 191 28 17% $16.23
ARCH Drafters, All Other 2 84 94 10 12% $31.23
ART Graphic Designers 48 1,294 1,417 123 10% $14.84
ART Photographers 12 470 529 59 13% $14.02
ART Photographic Process Workers and Processing Machine Operators 9 203 226 23 11% $17.50
ART Fashion Designers 8 127 167 40 31% $24.23
San Bernard ino Va l l ey Co l lege / 2017 Comprehens ive Mas te r P lan A.173
2017 Comprehens ive Mas te r P lan Append ix / SBCCD / HMC Arch i tec ts + ALMA St ra teg ies

Related Program
Description Annual Openings
2015 Jobs
2025 Jobs
2015 - 2025 Change
2015 - 2025 % Change
Avg. Hourly Earnings
ART Fine Artists, Including Painters, Sculptors, and Illustrators 5 166 176 10 6% $48.03
ART Art Directors 4 98 110 12 12% $12.99
ART Furnace, Kiln, Oven, Drier, and Kettle Operators and Tenders 3 111 105 (6) (5%) $31.49
ART Multimedia Artists and Animators 2 58 65 7 12% $16.83
ART Designers, All Other 2 47 55 8 17% $56.90
ART Artists and Related Workers, All Other 2 63 66 3 5% $34.07
ART Camera and Photographic Equipment Repairers 1 18 23 5 27% $25.80
ART Craft Artists Insf. Data 22 21 (1) (5%) $21.70
AUTO Maintenance and Repair Workers, General 413 12,074 13,722 1,648 14% $27.38
AUTO Automotive Service Technicians and Mechanics 326 7,882 9,010 1,128 14% $36.96
AUTO First-Line Supervisors of Mechanics, Installers, and Repairers 158 3,831 4,311 480 13% $45.79
AUTO Industrial Machinery Mechanics 116 2,163 2,627 464 21% $19.63
AUTO Tire Repairers and Changers 90 1,984 2,157 173 9% $39.81
AUTO Installation, Maintenance, and Repair Workers, All Other 49 1,659 1,856 197 12% $14.92
AUTO Mobile Heavy Equipment Mechanics, Except Engines 45 1,157 1,262 105 9% $41.69
AUTO Automotive Body and Related Repairers 31 1,050 1,058 8 1% $41.14
AUTO Maintenance Workers, Machinery 25 1,023 1,136 113 11% $30.89
AUTO Recreational Vehicle Service Technicians 7 177 179 2 1% $38.47
AUTO Outdoor Power Equipment and Other Small Engine Mechanics 6 173 196 23 13% $24.16
AUTO Motorboat Mechanics and Service Technicians 6 130 156 26 20% $25.21
AUTO Motorcycle Mechanics 5 145 155 10 7% $29.91
AUTO Engine and Other Machine Assemblers 5 209 219 10 5% $50.61
AUTO Roustabouts, Oil and Gas 4 115 126 11 10% $19.63
AUTO Automotive Glass Installers and Repairers 4 125 112 (13) (10%) $18.37
AUTO Insurance Appraisers, Auto Damage 4 112 116 4 4% $29.71
AUTO Farm Equipment Mechanics and Service Technicians 3 116 105 (11) (10%) $43.38
AUTO Electronic Equipment Installers and Repairers, Motor Vehicles 2 178 180 2 1% $29.56
BIO Physicians and Surgeons, All Other 140 2,740 3,364 624 23% $51.19
BIO Family and General Practitioners 63 1,452 1,684 232 16% $28.59
BIO Surgeons 23 423 534 111 26% $99.35
REGIONAL JOB OPENINGS BY OCCUPATION (2015-2025) - RELATED TO EXISTING PROGRAMS (GROUPED BY DEPARTMENT) (cont.)
San Bernard ino Va l l ey Co l lege / 2017 Comprehens ive Mas te r P lanA.174
2017 Comprehens ive Mas te r P lan Append ix / SBCCD / HMC Arch i tec ts + ALMA St ra teg ies

Related Program
Description Annual Openings
2015 Jobs
2025 Jobs
2015 - 2025 Change
2015 - 2025 % Change
Avg. Hourly Earnings
BIO Anesthesiologists 16 280 361 81 29% $41.72
BIO Internists, General 14 207 283 76 37% $16.79
BIO Health Diagnosing and Treating Practitioners, All Other 14 504 532 28 6% $13.37
BIO Pediatricians, General 13 255 309 54 21% $54.25
BIO Biological Technicians 12 284 307 23 8% $29.84
BIO Obstetricians and Gynecologists 9 186 225 39 21% $38.28
BIO Chiropractors 9 222 263 41 18% $16.74
BIO Biological Scientists, All Other 8 274 259 (15) (5%) $41.33
BIO Biomedical Engineers 7 222 210 (12) (5%) $26.83
BIO Zoologists and Wildlife Biologists 4 118 127 9 8% $24.18
BIO Microbiologists 4 94 99 5 5% $20.70
BIO Soil and Plant Scientists 3 54 65 11 20% $34.45
BIO Genetic Counselors 3 42 55 13 31% $36.49
BIO Life Scientists, All Other 2 52 62 10 19% $19.34
BIO Biochemists and Biophysicists 2 40 47 7 17% $14.90
BIO Foresters 2 41 47 6 15% $18.14
BIOL Medical and Clinical Laboratory Technicians 67 1,013 1,362 349 34% $13.49
BIOL Environmental Scientists and Specialists, Including Health 59 1,334 1,499 165 12% $30.57
BIOL Medical and Clinical Laboratory Technologists 36 531 724 193 36% $56.21
BIOL Forest and Conservation Technicians 27 676 634 (42) (6%) $21.91
BIOL Medical Scientists, Except Epidemiologists 26 825 903 78 9% $17.77
BIOL Veterinary Assistants and Laboratory Animal Caretakers 25 1,020 1,067 47 5% $38.66
BIOL Veterinary Technologists and Technicians 23 612 769 157 26% $18.40
BIOL Veterinarians 20 416 472 56 13% $41.45
BIOL Life, Physical, and Social Science Technicians, All Other 17 297 343 46 16% $26.09
BIOL Environmental Science and Protection Technicians, Including Health 14 186 239 53 28% $17.47
BIOL Environmental Engineers 13 307 354 47 15% $19.78
BIOL Environmental Engineering Technicians 6 158 186 28 18% $20.57
BIOL Forest and Conservation Workers 4 149 151 2 1% $48.53
BUSAD Office Clerks, General 926 29,566 32,330 2,764 9% $28.49
San Bernard ino Va l l ey Co l lege / 2017 Comprehens ive Mas te r P lan A.175
2017 Comprehens ive Mas te r P lan Append ix / SBCCD / HMC Arch i tec ts + ALMA St ra teg ies

Related Program
Description Annual Openings
2015 Jobs
2025 Jobs
2015 - 2025 Change
2015 - 2025 % Change
Avg. Hourly Earnings
BUSAD General and Operations Managers 716 20,281 23,346 3,065 15% $29.54
BUSAD First-Line Supervisors of Office and Administrative Support Workers 607 14,391 16,735 2,344 16% $21.84
BUSADSecretaries and Administrative Assistants, Except Legal, Medical, and
Executive516 17,907 20,732 2,825 16% $51.87
BUSAD Receptionists and Information Clerks 401 8,579 10,048 1,469 17% $17.02
BUSAD Office and Administrative Support Workers, All Other 170 5,245 5,446 201 4% $19.41
BUSAD Business Operations Specialists, All Other 164 6,672 7,344 672 10% $29.13
BUSAD Sales Managers 157 4,351 4,930 579 13% $15.14
BUSAD Management Analysts 151 3,747 4,600 853 23% $59.22
BUSAD Market Research Analysts and Marketing Specialists 142 2,795 3,754 959 34% $37.27
BUSAD Human Resources Specialists 121 3,486 4,010 524 15% $33.37
BUSAD Production, Planning, and Expediting Clerks 117 3,049 3,417 368 12% $48.48
BUSAD Order Clerks 112 3,146 3,396 250 8% $24.05
BUSAD Executive Secretaries and Executive Administrative Assistants 85 5,113 5,337 224 4% $37.65
BUSAD Administrative Services Managers 77 2,343 2,698 355 15% $20.04
BUSAD Transportation, Storage, and Distribution Managers 73 1,479 1,819 340 23% $24.71
BUSAD Paralegals and Legal Assistants 70 2,106 2,434 328 16% $22.91
BUSAD Claims Adjusters, Examiners, and Investigators 68 2,283 2,373 90 4% $23.45
BUSAD Managers, All Other 63 1,891 2,089 198 10% $64.21
BUSAD First-Line Supervisors of Non-Retail Sales Workers 60 1,982 2,306 324 16% $20.41
BUSAD Purchasing Agents, Except Wholesale, Retail, and Farm Products 54 2,016 2,176 160 8% $36.77
BUSAD Compliance Officers 53 1,995 2,136 141 7% $16.28
BUSAD File Clerks 49 1,955 1,992 37 2% $20.61
BUSAD Human Resources Assistants, Except Payroll and Timekeeping 46 1,363 1,464 101 7% $20.66
BUSAD Education Administrators, Postsecondary 39 847 993 146 17% $37.83
BUSAD Marketing Managers 37 903 1,065 162 18% $21.96
BUSAD Human Resources Managers 36 784 921 137 17% $49.71
BUSAD Procurement Clerks 34 718 782 64 9% $41.84
BUSAD Court, Municipal, and License Clerks 32 1,048 1,195 147 14% $17.04
BUSAD Advertising Sales Agents 21 699 634 (65) (9%) $23.19
REGIONAL JOB OPENINGS BY OCCUPATION (2015-2025) - RELATED TO EXISTING PROGRAMS (GROUPED BY DEPARTMENT) (cont.)
San Bernard ino Va l l ey Co l lege / 2017 Comprehens ive Mas te r P lanA.176
2017 Comprehens ive Mas te r P lan Append ix / SBCCD / HMC Arch i tec ts + ALMA St ra teg ies

Related Program
Description Annual Openings
2015 Jobs
2025 Jobs
2015 - 2025 Change
2015 - 2025 % Change
Avg. Hourly Earnings
BUSAD Legal Secretaries 16 769 834 65 8% $14.71
BUSAD Compensation, Benefits, and Job Analysis Specialists 16 501 565 64 13% $45.64
BUSAD Purchasing Managers 15 468 514 46 10% $43.48
BUSAD Insurance Underwriters 14 351 384 33 9% $38.62
BUSAD Sales Engineers 13 338 407 69 20% $29.92
BUSAD Labor Relations Specialists 9 419 415 (4) (1%) $42.63
BUSAD Legal Support Workers, All Other 8 427 435 8 2% $26.17
BUSAD Advertising and Promotions Managers 8 199 213 14 7% $46.89
BUSAD Training and Development Managers 7 140 169 29 21% $20.03
BUSAD Compensation and Benefits Managers 3 77 86 9 12% $31.19
BUSAD Correspondence Clerks 3 58 71 13 22% $15.83
BUSAD Arbitrators, Mediators, and Conciliators 2 79 87 8 10% $26.40
BUSAD Chief Executives (16) 1,919 2,114 195 10% $20.28
BUSAD Agents and Business Managers of Artists, Performers, and Athletes Insf. Data 21 24 3 14% $20.42
CD Elementary School Teachers, Except Special Education 569 16,400 18,248 1,848 11% $25.99
CD Teacher Assistants 413 13,372 14,340 968 7% $31.37
CD Substitute Teachers 295 13,120 13,766 646 5% $44.06
CDSecondary School Teachers, Except Special and Career/Technical
Education255 7,032 7,592 560 8% $18.58
CD Childcare Workers 245 6,327 6,822 495 8% $43.87
CD Middle School Teachers, Except Special and Career/Technical Education 172 4,628 5,256 628 14% $21.54
CD Kindergarten Teachers, Except Special Education 111 2,791 3,073 282 10% $29.61
CD Preschool Teachers, Except Special Education 109 2,851 3,096 245 9% $13.86
CD Teachers and Instructors, All Other 83 3,035 3,319 284 9% $21.44
CD Education Administrators, Elementary and Secondary School 68 1,929 2,071 142 7% $25.28
CD Special Education Teachers, Kindergarten and Elementary School 52 2,075 2,230 155 7% $38.04
CD Special Education Teachers, Secondary School 23 908 980 72 8% $33.48
CD Special Education Teachers, Middle School 19 744 797 53 7% $101.48
CD Education Administrators, All Other 16 411 453 42 10% $31.60
CD Career/Technical Education Teachers, Secondary School 14 352 392 40 11% $35.70
San Bernard ino Va l l ey Co l lege / 2017 Comprehens ive Mas te r P lan A.177
2017 Comprehens ive Mas te r P lan Append ix / SBCCD / HMC Arch i tec ts + ALMA St ra teg ies

Related Program
Description Annual Openings
2015 Jobs
2025 Jobs
2015 - 2025 Change
2015 - 2025 % Change
Avg. Hourly Earnings
CD Education Administrators, Preschool and Childcare Center/Program 12 322 355 33 10% $15.55
CD Special Education Teachers, All Other 11 347 389 42 12% $38.03
CD Special Education Teachers, Preschool 8 166 215 49 30% $16.43
CD Career/Technical Education Teachers, Middle School 1 17 23 6 35% $30.68
CHEM Forensic Science Technicians 15 300 324 24 8% $24.94
CHEM Chemists 14 372 404 32 9% $21.56
CHEM Chemical Technicians 10 219 259 40 18% $32.95
CHEM Chemical Plant and System Operators 8 204 179 (25) (12%) $45.01
CHEM Chemical Equipment Operators and Tenders 5 131 133 2 2% $28.04
CHEM Chemical Engineers 3 101 104 3 3% $25.26
COMMSTSales Representatives, Wholesale and Manufacturing, Except Technical
and Scientific Products541 11,759 14,587 2,828 24% $28.21
COMMST Sales Representatives, Services, All Other 321 7,053 8,187 1,134 16% $14.56
COMMSTSales Representatives, Wholesale and Manufacturing, Technical and
Scientific Products86 1,811 2,267 456 25% $13.81
COMMST Public Relations Specialists 28 867 1,016 149 17% $31.77
COMMST Audio and Video Equipment Technicians 17 583 642 59 10% $25.20
COMMST Fundraisers 9 212 259 47 22% $21.69
COMMST Public Relations and Fundraising Managers 9 218 259 41 19% $32.71
COMMST Radio and Television Announcers 8 282 282 0 0% $47.01
COMMST Media and Communication Workers, All Other 4 202 213 11 5% $13.68
COMMST Reporters and Correspondents 3 123 75 (48) (39%) $27.56
COMMST Media and Communication Equipment Workers, All Other 1 114 104 (10) (9%) $15.15
COMMST Film and Video Editors 1 54 57 3 6% $25.24
COMMST Sound Engineering Technicians 1 55 57 2 4% $23.03
COMMST Audio-Visual and Multimedia Collections Specialists 1 134 134 0 0% $41.65
COMMST Broadcast News Analysts Insf. Data 12 11 (1) (8%) $18.05
COMMST Camera Operators, Television, Video, and Motion Picture Insf. Data 41 44 3 7% $31.77
COMST Broadcast Technicians 1 55 54 (1) (2%) $59.61
CS/CIT Computer User Support Specialists 113 3,031 3,633 602 20% $46.74
REGIONAL JOB OPENINGS BY OCCUPATION (2015-2025) - RELATED TO EXISTING PROGRAMS (GROUPED BY DEPARTMENT) (cont.)
San Bernard ino Va l l ey Co l lege / 2017 Comprehens ive Mas te r P lanA.178
2017 Comprehens ive Mas te r P lan Append ix / SBCCD / HMC Arch i tec ts + ALMA St ra teg ies

Related Program
Description Annual Openings
2015 Jobs
2025 Jobs
2015 - 2025 Change
2015 - 2025 % Change
Avg. Hourly Earnings
CS/CIT Software Developers, Applications 93 2,706 3,248 542 20% $109.78
CS/CIT Computer Systems Analysts 83 1,841 2,337 496 27% $17.35
CS/CIT Network and Computer Systems Administrators 63 1,937 2,232 295 15% $31.90
CS/CIT Computer and Information Systems Managers 48 1,562 1,810 248 16% $29.89
CS/CIT Computer Programmers 33 739 862 123 17% $44.21
CS/CIT Software Developers, Systems Software 31 584 808 224 38% $21.39
CS/CIT Computer Network Support Specialists 23 866 952 86 10% $46.77
CS/CIT Computer Occupations, All Other 22 891 966 75 8% $40.40
CS/CIT Web Developers 22 613 723 110 18% $39.62
CS/CIT Database Administrators 15 387 460 73 19% $31.15
CS/CIT Computer Network Architects 13 279 358 79 28% $12.83
CS/CIT Information Security Analysts 10 160 229 69 43% $32.73
CS/CIT Computer Hardware Engineers 4 70 95 25 36% $14.20
CS/CIT Computer Operators 4 409 405 (4) (1%) $14.36
CS/CIT Computer and Information Research Scientists 3 117 128 11 9% $83.69
CS/CIT Desktop Publishers Insf. Data 39 40 1 3% $24.43
CULART First-Line Supervisors of Food Preparation and Serving Workers 528 9,361 11,627 2,266 24% $31.57
CULART Bakers 112 2,640 3,059 419 16% $32.72
CULART Cooks, Institution and Cafeteria 108 2,382 2,926 544 23% $29.06
CULART Food Service Managers 97 3,140 3,507 367 12% $31.22
CULART Butchers and Meat Cutters 75 1,631 1,931 300 18% $45.37
CULART Food Batchmakers 49 1,126 1,222 96 9% $34.70
CULART Chefs and Head Cooks 47 1,645 1,832 187 11% $14.16
CULART Food Processing Workers, All Other 13 269 322 53 20% $31.02
CULART Food Cooking Machine Operators and Tenders 9 225 251 26 12% $43.20
CULART Cooks, All Other 6 117 149 32 27% $50.26
CULART Cooks, Private Household 1 39 42 3 8% $23.85
DANCE Choreographers 2 43 52 9 21% $24.91
DANCE Dancers 2 70 69 (1) (1%) $87.60
DIESEL Bus and Truck Mechanics and Diesel Engine Specialists 144 3,917 4,458 541 14% $24.86
San Bernard ino Va l l ey Co l lege / 2017 Comprehens ive Mas te r P lan A.179
2017 Comprehens ive Mas te r P lan Append ix / SBCCD / HMC Arch i tec ts + ALMA St ra teg ies

Related Program
Description Annual Openings
2015 Jobs
2025 Jobs
2015 - 2025 Change
2015 - 2025 % Change
Avg. Hourly Earnings
ECON Economists 9 197 226 29 15% $27.61
ELECT/ELECTR Electricians 169 5,155 5,717 562 11% $35.82
ELECT/ELECTR Telecommunications Line Installers and Repairers 68 1,519 1,788 269 18% $14.55
ELECT/ELECTR Electrical Power-Line Installers and Repairers 65 1,184 1,386 202 17% $22.26
ELECT/ELECTRTelecommunications Equipment Installers and Repairers, Except Line
Installers63 2,146 2,459 313 15% $27.24
ELECT/ELECTR Home Appliance Repairers 40 776 912 136 18% $41.77
ELECT/ELECTR Computer, Automated Teller, and Office Machine Repairers 31 535 710 175 33% $12.95
ELECT/ELECTR Electronics Engineers, Except Computer 28 1,081 1,115 34 3% $20.05
ELECT/ELECTR Control and Valve Installers and Repairers, Except Mechanical Door 27 646 692 46 7% $22.30
ELECT/ELECTR Electrical and Electronic Equipment Assemblers 27 1,285 1,392 107 8% $33.44
ELECT/ELECTR Medical Equipment Repairers 27 295 457 162 55% $15.46
ELECT/ELECTR Electrical and Electronics Engineering Technicians 25 967 1,003 36 4% $24.36
ELECT/ELECTRElectrical and Electronics Repairers, Commercial and Industrial
Equipment19 581 649 68 12% $111.56
ELECT/ELECTR Helpers--Electricians 19 467 570 103 22% $37.83
ELECT/ELECTR Electronic Home Entertainment Equipment Installers and Repairers 18 384 417 33 9% $38.17
ELECT/ELECTR Electrical Engineers 18 477 543 66 14% $19.26
ELECT/ELECTR Power Plant Operators 16 473 478 5 1% $23.09
ELECT/ELECTR Meter Readers, Utilities 11 488 438 (50) (10%) $20.57
ELECT/ELECTR Solar Photovoltaic Installers 6 226 249 23 10% $46.05
ELECT/ELECTR Precision Instrument and Equipment Repairers, All Other 6 107 130 23 21% $13.46
ELECT/ELECTR Electrical and Electronics Drafters 5 254 263 9 4% $15.65
ELECT/ELECTR Electromechanical Equipment Assemblers 5 214 233 19 9% $27.41
ELECT/ELECTR Radio, Cellular, and Tower Equipment Installers and Repairs 4 155 164 9 6% $26.20
ELECT/ELECTR Electrical and Electronics Repairers, Powerhouse, Substation, and Relay 3 75 87 12 16% $46.38
ELECT/ELECTR Electric Motor, Power Tool, and Related Repairers 3 82 92 10 12% $33.06
ELECT/ELECTRElectrical and Electronics Installers and Repairers, Transportation
Equipment2 62 70 8 13% $34.11
ELECT/ELECTR Electro-Mechanical Technicians 2 50 56 6 12% $28.22
REGIONAL JOB OPENINGS BY OCCUPATION (2015-2025) - RELATED TO EXISTING PROGRAMS (GROUPED BY DEPARTMENT) (cont.)
San Bernard ino Va l l ey Co l lege / 2017 Comprehens ive Mas te r P lanA.180
2017 Comprehens ive Mas te r P lan Append ix / SBCCD / HMC Arch i tec ts + ALMA St ra teg ies

Related Program
Description Annual Openings
2015 Jobs
2025 Jobs
2015 - 2025 Change
2015 - 2025 % Change
Avg. Hourly Earnings
ELECT/ELECTR Signal and Track Switch Repairers Insf. Data 16 18 2 12% $112.08
ENGLAdult Basic and Secondary Education and Literacy Teachers and
Instructors15 552 604 52 9% $14.23
ENGL Technical Writers 10 190 229 39 21% $17.23
ENGL Editors 6 235 226 (9) (4%) $67.97
ENGL Court Reporters 5 209 225 16 8% $46.94
ENGL Writers and Authors 4 132 144 12 9% $16.22
ENGL Proofreaders and Copy Markers Insf. Data 38 38 0 0% $37.51
ENGR Civil Engineers 80 2,557 2,717 160 6% $33.09
ENGR Industrial Engineers 36 862 950 88 10% $14.32
ENGR Engineering Technicians, Except Drafters, All Other 17 682 706 24 4% $33.99
ENGR Engineers, All Other 16 675 712 37 5% $24.60
ENGR Civil Engineering Technicians 7 330 326 (4) (1%) $13.95
FN Dietitians and Nutritionists 20 552 680 128 23% $22.23
FN Agricultural and Food Science Technicians 14 316 333 17 5% $16.47
FN Dietetic Technicians 12 414 491 77 19% $17.87
FN Food Scientists and Technologists 9 181 205 24 13% $27.63
GEOG Surveyors 11 368 393 25 7% $27.04
GEOG Surveying and Mapping Technicians 8 227 263 36 16% $20.11
GEOG Cartographers and Photogrammetrists 7 179 205 26 14% $33.76
GEOL Geoscientists, Except Hydrologists and Geographers 9 190 217 27 14% $40.36
GEOL Geological and Petroleum Technicians 2 40 47 7 17% $25.77
GEOL Mining and Geological Engineers, Including Mining Safety Engineers 2 45 53 8 18% $14.29
HIST Library Technicians 66 1,010 1,098 88 9% $14.50
HIST Museum Technicians and Conservators 2 60 68 8 13% $28.50
HIST Curators 2 30 39 9 30% $19.21
HUMSERV Social and Human Service Assistants 172 2,942 3,749 807 27% $29.56
HUMSERV Healthcare Social Workers 88 1,458 1,957 499 34% $33.49
HUMSERV Educational, Guidance, School, and Vocational Counselors 72 2,281 2,488 207 9% $35.64
HUMSERV Rehabilitation Counselors 62 1,318 1,615 297 23% $49.66
San Bernard ino Va l l ey Co l lege / 2017 Comprehens ive Mas te r P lan A.181
2017 Comprehens ive Mas te r P lan Append ix / SBCCD / HMC Arch i tec ts + ALMA St ra teg ies

Related Program
Description Annual Openings
2015 Jobs
2025 Jobs
2015 - 2025 Change
2015 - 2025 % Change
Avg. Hourly Earnings
HUMSERV Child, Family, and School Social Workers 54 1,436 1,641 205 14% $34.31
HUMSERV Social and Community Service Managers 47 855 1,111 256 30% $49.33
HUMSERV Community and Social Service Specialists, All Other 44 895 1,071 176 20% $17.83
HUMSERV Mental Health Counselors 44 1,151 1,324 173 15% $26.98
HUMSERV Substance Abuse and Behavioral Disorder Counselors 38 1,003 1,149 146 15% $16.80
HUMSERV Social Workers, All Other 38 1,278 1,369 91 7% $24.64
HUMSERV Mental Health and Substance Abuse Social Workers 31 732 866 134 18% $23.09
HUMSERV Occupational Therapists 29 684 867 183 27% $25.32
HUMSERV Community Health Workers 24 389 509 120 31% $16.01
HUMSERV Health Educators 21 454 532 78 17% $22.09
HUMSERV Occupational Therapy Assistants 13 205 274 69 34% $13.27
HUMSERV Marriage and Family Therapists 11 314 351 37 12% $12.90
HUMSERV Counselors, All Other 8 203 232 29 14% $17.43
HUMSERV Recreational Therapists 7 174 204 30 17% $25.62
HUMSERV Occupational Therapy Aides 2 25 37 12 47% $46.42
HVACR Heating, Air Conditioning, and Refrigeration Mechanics and Installers 115 2,929 3,299 370 13% $14.72
HVACR Cooling and Freezing Equipment Operators and Tenders 2 40 48 8 20% $15.84
INSPEC Inspectors, Testers, Sorters, Samplers, and Weighers 143 4,095 4,583 488 12% $17.47
INSPEC Construction and Building Inspectors 32 918 1,010 92 10% $21.80
INSPEC Transportation Inspectors 13 242 283 41 17% $38.63
KIN Physical Therapists 73 1,254 1,619 365 29% $39.87
KIN Fitness Trainers and Aerobics Instructors 50 1,962 2,211 249 13% $17.15
KIN Massage Therapists 32 923 1,134 211 23% $22.82
KIN Physical Therapist Assistants 29 487 645 158 32% $18.47
KIN Physical Therapist Aides 18 327 417 90 28% $21.14
KIN Athletic Trainers 5 88 111 23 26% $23.86
KIN Exercise Physiologists 1 31 39 8 26% $28.95
MACH Machinists 138 3,564 4,068 504 14% $15.14
MACH Assemblers and Fabricators, All Other 61 1,803 2,101 298 17% $22.17
MACH Computer-Controlled Machine Tool Operators, Metal and Plastic 45 890 1,065 175 20% $24.00
REGIONAL JOB OPENINGS BY OCCUPATION (2015-2025) - RELATED TO EXISTING PROGRAMS (GROUPED BY DEPARTMENT) (cont.)
San Bernard ino Va l l ey Co l lege / 2017 Comprehens ive Mas te r P lanA.182
2017 Comprehens ive Mas te r P lan Append ix / SBCCD / HMC Arch i tec ts + ALMA St ra teg ies

Related Program
Description Annual Openings
2015 Jobs
2025 Jobs
2015 - 2025 Change
2015 - 2025 % Change
Avg. Hourly Earnings
MACH Mixing and Blending Machine Setters, Operators, and Tenders 38 1,158 1,174 16 1% $14.60
MACHCutting, Punching, and Press Machine Setters, Operators, and Tenders,
Metal and Plastic22 1,759 1,713 (46) (3%) $20.25
MACHMolding, Coremaking, and Casting Machine Setters, Operators, and
Tenders, Metal and Plastic19 1,419 1,320 (99) (7%) $36.04
MACHSeparating, Filtering, Clarifying, Precipitating, and Still Machine Setters,
Operators, and Tenders17 298 356 58 19% $21.20
MACHExtruding, Forming, Pressing, and Compacting Machine Setters,
Operators, and Tenders15 533 488 (45) (8%) $32.75
MACHGrinding, Lapping, Polishing, and Buffing Machine Tool Setters,
Operators, and Tenders, Metal and Plastic14 686 613 (73) (11%) $19.52
MACHComputer Numerically Controlled Machine Tool Programmers, Metal and
Plastic13 211 271 60 28% $53.75
MACH Woodworking Machine Setters, Operators, and Tenders, Except Sawing 12 789 717 (72) (9%) $32.10
MACH Multiple Machine Tool Setters, Operators, and Tenders, Metal and Plastic 10 366 371 5 1% $19.28
MACHLathe and Turning Machine Tool Setters, Operators, and Tenders, Metal
and Plastic9 450 441 (9) (2%) $31.75
MACH Rolling Machine Setters, Operators, and Tenders, Metal and Plastic 9 382 385 3 1% $99.89
MACHExtruding and Drawing Machine Setters, Operators, and Tenders, Metal
and Plastic8 315 316 1 0% $15.02
MACHMilling and Planing Machine Setters, Operators, and Tenders, Metal and
Plastic8 423 399 (24) (6%) $22.21
MACH Paper Goods Machine Setters, Operators, and Tenders 8 736 708 (28) (4%) $22.95
MACH Mechanical Drafters 8 453 441 (12) (3%) $13.87
MACHCrushing, Grinding, and Polishing Machine Setters, Operators, and
Tenders7 228 219 (9) (4%) $25.60
MACH Forging Machine Setters, Operators, and Tenders, Metal and Plastic 7 332 321 (11) (3%) $36.57
MACH Metal Workers and Plastic Workers, All Other 6 296 324 28 9% $25.92
MACHExtruding and Forming Machine Setters, Operators, and Tenders,
Synthetic and Glass Fibers5 191 210 19 10% $41.39
San Bernard ino Va l l ey Co l lege / 2017 Comprehens ive Mas te r P lan A.183
2017 Comprehens ive Mas te r P lan Append ix / SBCCD / HMC Arch i tec ts + ALMA St ra teg ies

Related Program
Description Annual Openings
2015 Jobs
2025 Jobs
2015 - 2025 Change
2015 - 2025 % Change
Avg. Hourly Earnings
MACH Millwrights 5 143 172 29 20% $19.86
MACH Cutting and Slicing Machine Setters, Operators, and Tenders 5 263 241 (22) (8%) $12.03
MACHPlating and Coating Machine Setters, Operators, and Tenders, Metal and
Plastic5 267 231 (36) (13%) $22.63
MACHDrilling and Boring Machine Tool Setters, Operators, and Tenders, Metal
and Plastic4 215 191 (24) (11%) $36.26
MACH Patternmakers, Metal and Plastic 2 80 76 (4) (5%) $37.08
MACH Rotary Drill Operators, Oil and Gas 1 22 23 1 5% $20.60
MATH Logisticians 37 929 1,172 243 26% $22.90
MATH Operations Research Analysts 12 169 239 70 41% $57.47
MATH Statisticians 4 57 78 21 37% $51.88
MATH Statistical Assistants 2 45 54 9 20% $43.10
MATH Mathematicians Insf. Data 19 22 3 16% $15.07
MODERNLANG Interpreters and Translators 27 533 716 183 34% $31.92
MUSIC Musicians and Singers 7 216 224 8 4% $12.52
MUSIC Music Directors and Composers 6 190 200 10 5% $20.00
MUSIC Musical Instrument Repairers and Tuners 3 50 62 12 24% $40.64
NURS Registered Nurses 1,076 24,849 30,146 5,297 21% $25.38
NURS Nursing Assistants 533 9,577 12,714 3,137 33% $31.90
NURS Home Health Aides 437 4,029 7,240 3,211 80% $48.16
NURS Licensed Practical and Licensed Vocational Nurses 359 6,562 8,286 1,724 26% $39.30
NURS Medical Assistants 331 7,415 9,118 1,703 23% $19.15
NURS Medical Secretaries 256 5,911 7,631 1,720 29% $47.57
NURS Medical Records and Health Information Technicians 85 1,612 1,977 365 23% $31.19
NURS Nurse Practitioners 60 1,059 1,415 356 34% $38.06
NURS Phlebotomists 58 1,261 1,566 305 24% $51.39
NURS Health Technologists and Technicians, All Other 53 1,753 2,090 337 19% $23.82
NURS Physician Assistants 44 661 947 286 43% $24.89
NURS Healthcare Practitioners and Technical Workers, All Other 41 1,006 1,119 113 11% $16.08
NURS Healthcare Support Workers, All Other 39 1,125 1,280 155 14% $28.95
REGIONAL JOB OPENINGS BY OCCUPATION (2015-2025) - RELATED TO EXISTING PROGRAMS (GROUPED BY DEPARTMENT) (cont.)
San Bernard ino Va l l ey Co l lege / 2017 Comprehens ive Mas te r P lanA.184
2017 Comprehens ive Mas te r P lan Append ix / SBCCD / HMC Arch i tec ts + ALMA St ra teg ies

Related Program
Description Annual Openings
2015 Jobs
2025 Jobs
2015 - 2025 Change
2015 - 2025 % Change
Avg. Hourly Earnings
NURS Surgical Technologists 35 804 1,055 251 31% $25.15
NURS Medical Equipment Preparers 28 700 828 128 18% $21.00
NURS Cardiovascular Technologists and Technicians 24 522 677 155 30% $30.38
NURS Medical Transcriptionists 10 223 276 53 24% $44.98
NURS Nurse Anesthetists 9 110 172 62 56% $19.52
NURS Nurse Midwives 2 37 49 12 32% $24.51
PHARM Pharmacists 139 2,777 3,411 634 23% $35.67
PHARM Pharmacy Technicians 131 3,256 4,185 929 29% $25.59
PHARM Pharmacy Aides 31 834 966 132 16% $49.68
PHIL Lawyers 87 2,597 3,008 411 16% $49.15
PHIL Judicial Law Clerks 1 38 44 6 16% $36.53
PHYS Aerospace Engineering and Operations Technicians Insf. Data 25 27 2 8% $59.02
PHYSICS Mechanical Engineers 46 1,077 1,147 70 6% $74.00
PHYSICS Aerospace Engineers 6 176 187 11 6% $15.23
PHYSICS Mechanical Engineering Technicians 5 160 172 12 8% $17.40
PHYSICS Materials Engineers 3 79 83 4 5% $47.61
PHYSICS Physicists 1 27 33 6 23% $24.15
PHYSICS Materials Scientists Insf. Data 22 22 0 0% $32.74
POLIT Political Scientists Insf. Data 15 19 4 27% $29.46
PS Physical Scientists, All Other 2 97 96 (1) (1%) $15.06
PS Atmospheric and Space Scientists Insf. Data 20 24 4 20% $15.16
PS Conservation Scientists 3 80 83 3 4% $22.92
PSYCH Clinical, Counseling, and School Psychologists 55 1,371 1,522 151 11% $27.71
PSYCH Psychiatrists 11 259 297 38 15% $24.77
PSYCH Psychologists, All Other 3 79 86 7 9% $14.46
PSYCH Therapists, All Other 3 92 113 21 23% $24.91
PSYCHT Psychiatric Technicians 12 1,221 1,185 (36) (3%) $32.42
PSYCHT Psychiatric Aides 10 451 448 (3) (1%) $58.60
REALST Property, Real Estate, and Community Association Managers 65 1,713 1,948 235 14% $19.71
San Bernard ino Va l l ey Co l lege / 2017 Comprehens ive Mas te r P lan A.185
2017 Comprehens ive Mas te r P lan Append ix / SBCCD / HMC Arch i tec ts + ALMA St ra teg ies
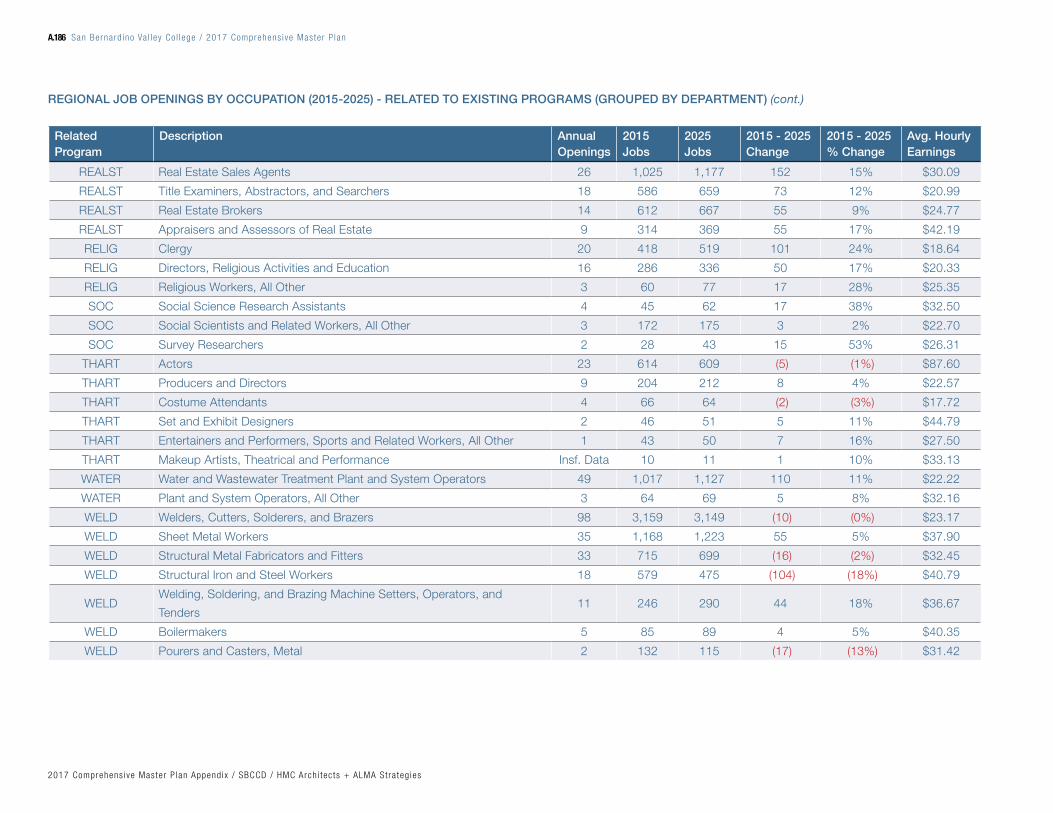
Related Program
Description Annual Openings
2015 Jobs
2025 Jobs
2015 - 2025 Change
2015 - 2025 % Change
Avg. Hourly Earnings
REALST Real Estate Sales Agents 26 1,025 1,177 152 15% $30.09
REALST Title Examiners, Abstractors, and Searchers 18 586 659 73 12% $20.99
REALST Real Estate Brokers 14 612 667 55 9% $24.77
REALST Appraisers and Assessors of Real Estate 9 314 369 55 17% $42.19
RELIG Clergy 20 418 519 101 24% $18.64
RELIG Directors, Religious Activities and Education 16 286 336 50 17% $20.33
RELIG Religious Workers, All Other 3 60 77 17 28% $25.35
SOC Social Science Research Assistants 4 45 62 17 38% $32.50
SOC Social Scientists and Related Workers, All Other 3 172 175 3 2% $22.70
SOC Survey Researchers 2 28 43 15 53% $26.31
THART Actors 23 614 609 (5) (1%) $87.60
THART Producers and Directors 9 204 212 8 4% $22.57
THART Costume Attendants 4 66 64 (2) (3%) $17.72
THART Set and Exhibit Designers 2 46 51 5 11% $44.79
THART Entertainers and Performers, Sports and Related Workers, All Other 1 43 50 7 16% $27.50
THART Makeup Artists, Theatrical and Performance Insf. Data 10 11 1 10% $33.13
WATER Water and Wastewater Treatment Plant and System Operators 49 1,017 1,127 110 11% $22.22
WATER Plant and System Operators, All Other 3 64 69 5 8% $32.16
WELD Welders, Cutters, Solderers, and Brazers 98 3,159 3,149 (10) (0%) $23.17
WELD Sheet Metal Workers 35 1,168 1,223 55 5% $37.90
WELD Structural Metal Fabricators and Fitters 33 715 699 (16) (2%) $32.45
WELD Structural Iron and Steel Workers 18 579 475 (104) (18%) $40.79
WELDWelding, Soldering, and Brazing Machine Setters, Operators, and
Tenders11 246 290 44 18% $36.67
WELD Boilermakers 5 85 89 4 5% $40.35
WELD Pourers and Casters, Metal 2 132 115 (17) (13%) $31.42
REGIONAL JOB OPENINGS BY OCCUPATION (2015-2025) - RELATED TO EXISTING PROGRAMS (GROUPED BY DEPARTMENT) (cont.)
San Bernard ino Va l l ey Co l lege / 2017 Comprehens ive Mas te r P lanA.186
2017 Comprehens ive Mas te r P lan Append ix / SBCCD / HMC Arch i tec ts + ALMA St ra teg ies

San Bernard ino Va l l ey Co l lege / 2017 Comprehens ive Mas te r P lan A.187
2017 Comprehens ive Mas te r P lan Append ix / SBCCD / HMC Arch i tec ts + ALMA St ra teg ies

Description Annual Openings
2015 Jobs
2025 Jobs
2015 - 2025 Change
2015 - 2025 % Change
Avg. Hourly Earnings
Adhesive Bonding Machine Operators and Tenders 3 75 76 1 1% $16.94
Agricultural Equipment Operators 2 85 65 (20) (24%) $12.11
Agricultural Inspectors Insf. Data 30 29 (1) (3%) $24.68
Agricultural Workers, All Other Insf. Data 20 16 (4) (20%) $14.40
Airline Pilots, Copilots, and Flight Engineers 2 63 66 3 5% $54.36
Animal Control Workers Insf. Data 16 17 1 6% $22.16
Audiologists 1 14 22 8 55% $38.45
Automotive and Watercraft Service Attendants 19 327 411 84 26% $12.76
Barbers 1 26 32 6 23% $13.10
Bicycle Repairers 1 12 17 5 43% $12.08
Bill and Account Collectors 51 1,081 1,255 174 16% $16.65
Brickmasons and Blockmasons 3 201 118 (83) (41%) $26.12
Brokerage Clerks 1 36 38 2 5% $22.32
Building Cleaning Workers, All Other 2 46 50 4 9% $12.67
Bus Drivers, School or Special Client 47 1,432 1,605 173 12% $16.39
Bus Drivers, Transit and Intercity 4 134 131 (3) (2%) $18.93
Buyers and Purchasing Agents, Farm Products Insf. Data 25 28 3 12% $37.70
Cabinetmakers and Bench Carpenters 16 476 511 35 7% $14.40
Cargo and Freight Agents 14 191 268 77 40% $18.68
Carpenters 61 2,597 2,584 (13) (1%) $23.09
Carpet Installers 3 90 104 14 16% $20.43
Cement Masons and Concrete Finishers 16 712 703 (9) (1%) $22.69
Cleaning, Washing, and Metal Pickling Equipment Operators and Tenders 1 46 48 2 4% $12.37
Coaches and Scouts 22 458 525 67 15% $17.52
Coating, Painting, and Spraying Machine Setters, Operators, and Tenders 8 370 354 (16) (4%) $16.77
Coil Winders, Tapers, and Finishers 2 35 49 14 40% $13.96
Coin, Vending, and Amusement Machine Servicers and Repairers 2 80 90 10 12% $17.39
Commercial and Industrial Designers 3 65 73 8 12% $29.98
Commercial Pilots 4 57 79 22 39% $36.58
Concierges 3 39 52 13 33% $13.57
SERVICE AREA JOB OPENINGS BY OCCUPATION (2015-2025) - UNRELATED TO EXISTING PROGRAMS
San Bernard ino Va l l ey Co l lege / 2017 Comprehens ive Mas te r P lanA.188
2017 Comprehens ive Mas te r P lan Append ix / SBCCD / HMC Arch i tec ts + ALMA St ra teg ies
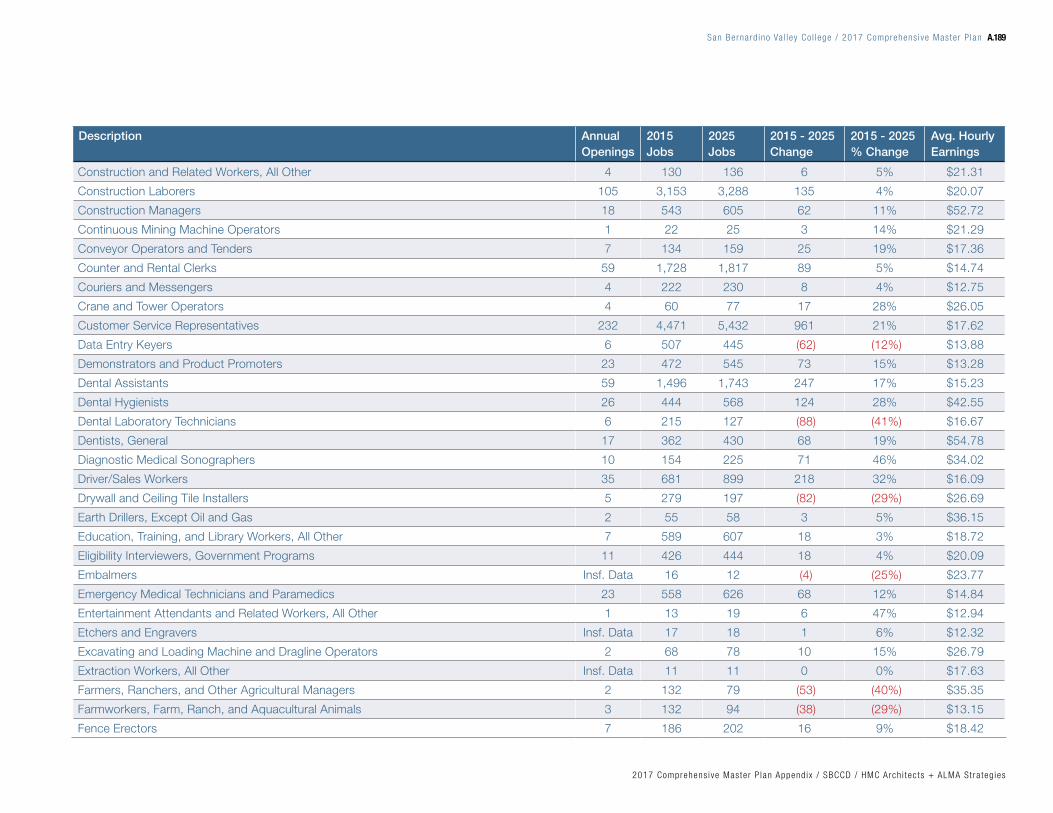
Description Annual Openings
2015 Jobs
2025 Jobs
2015 - 2025 Change
2015 - 2025 % Change
Avg. Hourly Earnings
Construction and Related Workers, All Other 4 130 136 6 5% $21.31
Construction Laborers 105 3,153 3,288 135 4% $20.07
Construction Managers 18 543 605 62 11% $52.72
Continuous Mining Machine Operators 1 22 25 3 14% $21.29
Conveyor Operators and Tenders 7 134 159 25 19% $17.36
Counter and Rental Clerks 59 1,728 1,817 89 5% $14.74
Couriers and Messengers 4 222 230 8 4% $12.75
Crane and Tower Operators 4 60 77 17 28% $26.05
Customer Service Representatives 232 4,471 5,432 961 21% $17.62
Data Entry Keyers 6 507 445 (62) (12%) $13.88
Demonstrators and Product Promoters 23 472 545 73 15% $13.28
Dental Assistants 59 1,496 1,743 247 17% $15.23
Dental Hygienists 26 444 568 124 28% $42.55
Dental Laboratory Technicians 6 215 127 (88) (41%) $16.67
Dentists, General 17 362 430 68 19% $54.78
Diagnostic Medical Sonographers 10 154 225 71 46% $34.02
Driver/Sales Workers 35 681 899 218 32% $16.09
Drywall and Ceiling Tile Installers 5 279 197 (82) (29%) $26.69
Earth Drillers, Except Oil and Gas 2 55 58 3 5% $36.15
Education, Training, and Library Workers, All Other 7 589 607 18 3% $18.72
Eligibility Interviewers, Government Programs 11 426 444 18 4% $20.09
Embalmers Insf. Data 16 12 (4) (25%) $23.77
Emergency Medical Technicians and Paramedics 23 558 626 68 12% $14.84
Entertainment Attendants and Related Workers, All Other 1 13 19 6 47% $12.94
Etchers and Engravers Insf. Data 17 18 1 6% $12.32
Excavating and Loading Machine and Dragline Operators 2 68 78 10 15% $26.79
Extraction Workers, All Other Insf. Data 11 11 0 0% $17.63
Farmers, Ranchers, and Other Agricultural Managers 2 132 79 (53) (40%) $35.35
Farmworkers, Farm, Ranch, and Aquacultural Animals 3 132 94 (38) (29%) $13.15
Fence Erectors 7 186 202 16 9% $18.42
San Bernard ino Va l l ey Co l lege / 2017 Comprehens ive Mas te r P lan A.189
2017 Comprehens ive Mas te r P lan Append ix / SBCCD / HMC Arch i tec ts + ALMA St ra teg ies

Description Annual Openings
2015 Jobs
2025 Jobs
2015 - 2025 Change
2015 - 2025 % Change
Avg. Hourly Earnings
Fiberglass Laminators and Fabricators 2 71 68 (3) (4%) $15.62
Firefighters 9 269 286 17 6% $28.35
First-Line Supervisors of Construction Trades and Extraction Workers 29 1,173 1,256 83 7% $34.36
First-Line Supervisors of Farming, Fishing, and Forestry Workers 1 63 46 (17) (27%) $19.32
First-Line Supervisors of Fire Fighting and Prevention Workers 1 20 22 2 10% $49.72
First-Line Supervisors of Helpers, Laborers, and Material Movers, Hand 61 1,054 1,329 275 26% $24.55
First-Line Supervisors of Housekeeping and Janitorial Workers 15 365 418 53 15% $18.00
First-Line Supervisors of Landscaping, Lawn Service, and Groundskeeping Workers 8 288 329 41 14% $20.18
First-Line Supervisors of Personal Service Workers 27 498 657 159 32% $19.30
First-Line Supervisors of Production and Operating Workers 36 1,545 1,630 85 6% $25.91
First-Line Supervisors of Retail Sales Workers 160 3,576 4,308 732 20% $20.82
First-Line Supervisors of Transportation and Material-Moving Machine and Vehicle Operators 43 810 988 178 22% $27.38
Floor Layers, Except Carpet, Wood, and Hard Tiles 2 52 60 8 15% $16.09
Floor Sanders and Finishers Insf. Data 20 24 4 20% $20.20
Floral Designers 2 90 64 (26) (29%) $15.94
Food and Tobacco Roasting, Baking, and Drying Machine Operators and Tenders 1 31 35 4 13% $16.82
Foundry Mold and Coremakers Insf. Data 38 35 (3) (8%) $13.15
Funeral Attendants 2 85 74 (11) (13%) $14.18
Funeral Service Managers Insf. Data 20 19 (1) (5%) $30.20
Furniture Finishers 3 52 71 19 36% $12.40
Gaming Cage Workers 1 50 50 0 0% $12.58
Gaming Change Persons and Booth Cashiers 3 72 73 1 1% $12.18
Gaming Dealers 6 268 277 9 3% $12.22
Gaming Service Workers, All Other 4 137 146 9 7% $13.93
Gaming Supervisors Insf. Data 26 26 0 0% $23.73
Gaming Surveillance Officers and Gaming Investigators Insf. Data 24 25 1 4% $16.56
Gas Plant Operators 2 51 45 (6) (12%) $35.54
Glaziers 4 74 73 (1) (1%) $30.33
Grinding and Polishing Workers, Hand 4 130 119 (11) (8%) $13.82
Grounds Maintenance Workers, All Other 1 17 23 6 35% $18.90
SERVICE AREA JOB OPENINGS BY OCCUPATION (2015-2025) - UNRELATED TO EXISTING PROGRAMS (cont.)
San Bernard ino Va l l ey Co l lege / 2017 Comprehens ive Mas te r P lanA.190
2017 Comprehens ive Mas te r P lan Append ix / SBCCD / HMC Arch i tec ts + ALMA St ra teg ies

Description Annual Openings
2015 Jobs
2025 Jobs
2015 - 2025 Change
2015 - 2025 % Change
Avg. Hourly Earnings
Hairdressers, Hairstylists, and Cosmetologists 23 514 609 95 18% $12.14
Hazardous Materials Removal Workers 3 46 59 13 28% $18.36
Health and Safety Engineers, Except Mining Safety Engineers and Inspectors 1 27 31 4 15% $40.86
Hearing Aid Specialists Insf. Data 22 26 4 18% $21.26
Heat Treating Equipment Setters, Operators, and Tenders, Metal and Plastic 1 39 42 3 8% $16.92
Heavy and Tractor-Trailer Truck Drivers 406 11,393 13,428 2,035 18% $23.12
Helpers, Construction Trades, All Other 2 73 70 (3) (4%) $17.40
Helpers--Brickmasons, Blockmasons, Stonemasons, and Tile and Marble Setters 3 127 79 (48) (38%) $17.68
Helpers--Carpenters 3 66 75 9 14% $13.41
Helpers--Extraction Workers Insf. Data 15 18 3 20% $16.56
Helpers--Installation, Maintenance, and Repair Workers 15 342 380 38 11% $14.87
Helpers--Painters, Paperhangers, Plasterers, and Stucco Masons Insf. Data 22 18 (4) (18%) $13.57
Helpers--Pipelayers, Plumbers, Pipefitters, and Steamfitters 4 141 157 16 11% $15.23
Helpers--Roofers 1 37 45 8 22% $12.71
Highway Maintenance Workers 1 36 41 5 14% $23.63
Industrial Engineering Technicians 3 92 97 5 5% $24.52
Industrial Production Managers 11 422 437 15 4% $47.15
Industrial Truck and Tractor Operators 138 3,317 3,837 520 16% $15.93
Information and Record Clerks, All Other 9 342 345 3 1% $18.73
Instructional Coordinators 11 525 583 58 11% $36.41
Insulation Workers, Floor, Ceiling, and Wall Insf. Data 32 27 (5) (16%) $30.42
Insulation Workers, Mechanical Insf. Data 15 20 5 33% $27.43
Insurance Sales Agents 33 862 972 110 13% $25.03
Interviewers, Except Eligibility and Loan 16 423 490 67 16% $18.82
Janitors and Cleaners, Except Maids and Housekeeping Cleaners 173 5,265 5,932 667 13% $13.56
Jewelers and Precious Stone and Metal Workers 2 39 45 6 15% $16.90
Laborers and Freight, Stock, and Material Movers, Hand 835 14,935 17,997 3,062 21% $13.46
Landscaping and Groundskeeping Workers 118 2,965 3,343 378 13% $12.35
Laundry and Dry-Cleaning Workers 16 331 382 51 15% $12.16
Layout Workers, Metal and Plastic Insf. Data 14 14 0 0% $21.38
San Bernard ino Va l l ey Co l lege / 2017 Comprehens ive Mas te r P lan A.191
2017 Comprehens ive Mas te r P lan Append ix / SBCCD / HMC Arch i tec ts + ALMA St ra teg ies

Description Annual Openings
2015 Jobs
2025 Jobs
2015 - 2025 Change
2015 - 2025 % Change
Avg. Hourly Earnings
Legislators Insf. Data 25 28 3 12% $25.03
Librarians 5 114 132 18 16% $28.63
Library Assistants, Clerical 8 130 146 16 12% $13.44
Light Truck or Delivery Services Drivers 96 2,922 3,374 452 15% $19.22
Locksmiths and Safe Repairers 3 71 77 6 8% $24.88
Lodging Managers 2 41 50 9 22% $23.57
Machine Feeders and Offbearers 34 608 802 194 32% $14.97
Magnetic Resonance Imaging Technologists 3 49 66 17 35% $36.81
Mail Clerks and Mail Machine Operators, Except Postal Service 2 88 87 (1) (1%) $13.71
Material Moving Workers, All Other 11 243 276 33 14% $19.19
Mechanical Door Repairers 2 37 47 10 27% $21.66
Medical and Health Services Managers 43 793 1,001 208 26% $57.94
Medical Appliance Technicians 2 58 42 (16) (28%) $23.20
Meeting, Convention, and Event Planners 7 149 191 42 28% $20.01
Merchandise Displayers and Window Trimmers 9 142 189 47 33% $16.55
Metal-Refining Furnace Operators and Tenders 1 33 40 7 21% $17.59
Models Insf. Data 13 17 4 31% $15.25
Molders, Shapers, and Casters, Except Metal and Plastic 10 244 237 (7) (3%) $16.00
Morticians, Undertakers, and Funeral Directors Insf. Data 30 28 (2) (7%) $37.60
Motor Vehicle Operators, All Other 17 401 447 46 11% $15.34
Natural Sciences Managers 2 70 75 5 7% $51.36
Nuclear Medicine Technologists 2 60 74 14 23% $46.28
Occupational Health and Safety Specialists 5 111 125 14 13% $34.93
Occupational Health and Safety Technicians Insf. Data 17 20 3 18% $28.06
Office Machine Operators, Except Computer 4 186 176 (10) (5%) $17.03
Operating Engineers and Other Construction Equipment Operators 28 770 833 63 8% $31.16
Ophthalmic Laboratory Technicians 2 35 42 7 20% $14.17
Ophthalmic Medical Technicians 4 81 110 29 36% $18.74
Opticians, Dispensing 13 218 272 54 25% $16.81
Optometrists 4 71 90 19 27% $51.58
SERVICE AREA JOB OPENINGS BY OCCUPATION (2015-2025) - UNRELATED TO EXISTING PROGRAMS (cont.)
San Bernard ino Va l l ey Co l lege / 2017 Comprehens ive Mas te r P lanA.192
2017 Comprehens ive Mas te r P lan Append ix / SBCCD / HMC Arch i tec ts + ALMA St ra teg ies

Description Annual Openings
2015 Jobs
2025 Jobs
2015 - 2025 Change
2015 - 2025 % Change
Avg. Hourly Earnings
Oral and Maxillofacial Surgeons Insf. Data 12 15 3 24% $104.88
Orderlies 6 122 152 30 25% $17.26
Orthotists and Prosthetists Insf. Data 12 15 3 24% $38.96
Packaging and Filling Machine Operators and Tenders 53 1,407 1,551 144 10% $13.62
Packers and Packagers, Hand 180 3,794 4,465 671 18% $12.08
Painters, Construction and Maintenance 14 592 582 (10) (2%) $21.28
Painters, Transportation Equipment 3 157 128 (29) (19%) $19.09
Painting, Coating, and Decorating Workers 3 118 110 (8) (7%) $13.43
Parts Salespersons 34 873 980 107 12% $18.08
Paving, Surfacing, and Tamping Equipment Operators 4 183 171 (12) (7%) $30.58
Pest Control Workers 12 319 344 25 8% $13.99
Petroleum Pump System Operators, Refinery Operators, and Gaugers 3 61 57 (4) (7%) $33.71
Pile-Driver Operators Insf. Data 16 16 0 0% $27.25
Pipelayers 2 53 59 6 11% $26.05
Plasterers and Stucco Masons 1 157 99 (58) (37%) $18.59
Plumbers, Pipefitters, and Steamfitters 18 695 785 90 13% $23.61
Podiatrists Insf. Data 16 18 2 13% $70.27
Postal Service Clerks 3 203 154 (49) (24%) $25.40
Postal Service Mail Carriers 28 907 720 (187) (21%) $25.65
Postal Service Mail Sorters, Processors, and Processing Machine Operators 2 248 197 (51) (21%) $23.03
Postmasters and Mail Superintendents Insf. Data 23 20 (3) (13%) $37.66
Postsecondary Teachers 127 3,189 3,907 718 23% $41.67
Power Distributors and Dispatchers 2 32 36 4 12% $41.44
Prepress Technicians and Workers 1 48 39 (9) (19%) $17.44
Print Binding and Finishing Workers Insf. Data 43 38 (5) (12%) $16.55
Printing Press Operators 4 186 170 (16) (9%) $17.05
Production Workers, All Other 24 548 619 71 13% $13.89
Public Address System and Other Announcers Insf. Data 40 40 0 0% $15.53
Radiation Therapists 3 70 84 14 20% $49.23
Radiologic Technologists 20 443 565 122 28% $30.34
San Bernard ino Va l l ey Co l lege / 2017 Comprehens ive Mas te r P lan A.193
2017 Comprehens ive Mas te r P lan Append ix / SBCCD / HMC Arch i tec ts + ALMA St ra teg ies

Description Annual Openings
2015 Jobs
2025 Jobs
2015 - 2025 Change
2015 - 2025 % Change
Avg. Hourly Earnings
Rail Car Repairers Insf. Data 17 19 2 12% $16.99
Recreation Workers 39 987 1,242 255 26% $12.19
Refuse and Recyclable Material Collectors 21 376 489 113 30% $18.90
Reinforcing Iron and Rebar Workers 4 223 162 (61) (27%) $28.71
Reservation and Transportation Ticket Agents and Travel Clerks 1 53 57 4 8% $15.48
Residential Advisors 10 83 129 46 56% $16.75
Respiratory Therapists 14 427 497 70 16% $32.02
Respiratory Therapy Technicians Insf. Data 21 26 5 24% $28.88
Retail Salespersons 784 12,621 15,575 2,954 23% $12.48
Riggers Insf. Data 20 23 3 15% $26.69
Roofers 13 318 368 50 16% $20.59
Sales and Related Workers, All Other 11 280 332 52 19% $13.93
Sawing Machine Setters, Operators, and Tenders, Wood 10 216 240 24 11% $14.06
Security and Fire Alarm Systems Installers 6 174 194 20 11% $24.02
Self-Enrichment Education Teachers 18 424 524 100 24% $17.57
Semiconductor Processors Insf. Data 22 16 (6) (28%) $16.41
Septic Tank Servicers and Sewer Pipe Cleaners 3 51 65 14 28% $24.08
Shipping, Receiving, and Traffic Clerks 124 2,882 3,291 409 14% $15.33
Skincare Specialists 5 111 153 42 38% $14.50
Slot Supervisors Insf. Data 17 17 0 0% $21.99
Speech-Language Pathologists 9 234 280 46 20% $38.62
Stationary Engineers and Boiler Operators 4 101 105 4 4% $29.78
Stock Clerks and Order Fillers 363 7,774 8,856 1,082 14% $12.84
Stonemasons 1 88 60 (28) (32%) $18.55
Switchboard Operators, Including Answering Service 6 319 307 (12) (4%) $13.55
Tailors, Dressmakers, and Custom Sewers 2 68 83 15 22% $14.46
Tapers 1 68 45 (23) (34%) $23.78
Taxi Drivers and Chauffeurs 16 265 382 117 44% $12.31
Team Assemblers 90 3,054 3,267 213 7% $12.89
Telemarketers 7 146 185 39 27% $12.07
SERVICE AREA JOB OPENINGS BY OCCUPATION (2015-2025) - UNRELATED TO EXISTING PROGRAMS (cont.)
San Bernard ino Va l l ey Co l lege / 2017 Comprehens ive Mas te r P lanA.194
2017 Comprehens ive Mas te r P lan Append ix / SBCCD / HMC Arch i tec ts + ALMA St ra teg ies
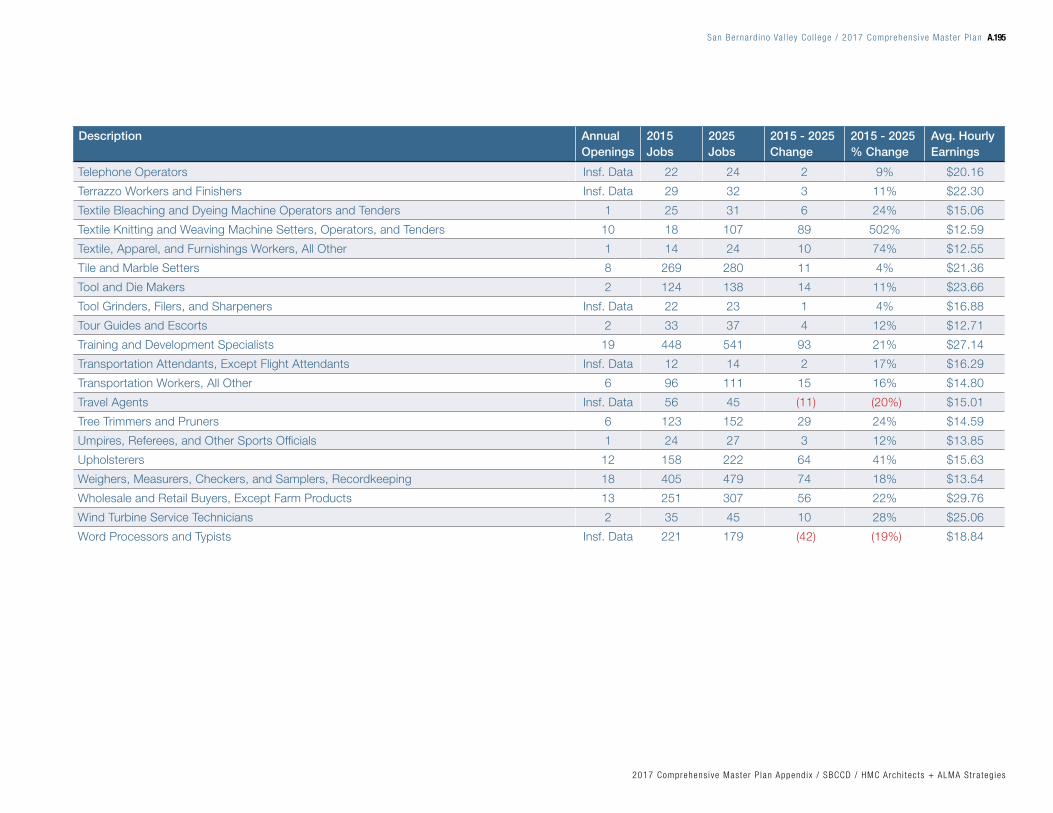
Description Annual Openings
2015 Jobs
2025 Jobs
2015 - 2025 Change
2015 - 2025 % Change
Avg. Hourly Earnings
Telephone Operators Insf. Data 22 24 2 9% $20.16
Terrazzo Workers and Finishers Insf. Data 29 32 3 11% $22.30
Textile Bleaching and Dyeing Machine Operators and Tenders 1 25 31 6 24% $15.06
Textile Knitting and Weaving Machine Setters, Operators, and Tenders 10 18 107 89 502% $12.59
Textile, Apparel, and Furnishings Workers, All Other 1 14 24 10 74% $12.55
Tile and Marble Setters 8 269 280 11 4% $21.36
Tool and Die Makers 2 124 138 14 11% $23.66
Tool Grinders, Filers, and Sharpeners Insf. Data 22 23 1 4% $16.88
Tour Guides and Escorts 2 33 37 4 12% $12.71
Training and Development Specialists 19 448 541 93 21% $27.14
Transportation Attendants, Except Flight Attendants Insf. Data 12 14 2 17% $16.29
Transportation Workers, All Other 6 96 111 15 16% $14.80
Travel Agents Insf. Data 56 45 (11) (20%) $15.01
Tree Trimmers and Pruners 6 123 152 29 24% $14.59
Umpires, Referees, and Other Sports Officials 1 24 27 3 12% $13.85
Upholsterers 12 158 222 64 41% $15.63
Weighers, Measurers, Checkers, and Samplers, Recordkeeping 18 405 479 74 18% $13.54
Wholesale and Retail Buyers, Except Farm Products 13 251 307 56 22% $29.76
Wind Turbine Service Technicians 2 35 45 10 28% $25.06
Word Processors and Typists Insf. Data 221 179 (42) (19%) $18.84
San Bernard ino Va l l ey Co l lege / 2017 Comprehens ive Mas te r P lan A.195
2017 Comprehens ive Mas te r P lan Append ix / SBCCD / HMC Arch i tec ts + ALMA St ra teg ies

Description Annual Openings
2015 Jobs
2025 Jobs
2015 - 2025 Change
2015 - 2025 % Change
Avg. Hourly Earnings
Adhesive Bonding Machine Operators and Tenders 8 289 279 (10) (3%) $16.68
Agricultural Engineers Insf. Data 12 14 2 17% $37.49
Agricultural Equipment Operators 17 610 551 (59) (10%) $12.23
Agricultural Inspectors 4 133 133 0 0% $24.98
Agricultural Workers, All Other 3 112 100 (12) (11%) $14.54
Aircraft Cargo Handling Supervisors 3 52 61 9 17% $18.22
Airfield Operations Specialists 1 11 16 5 45% $23.56
Airline Pilots, Copilots, and Flight Engineers 10 436 289 (147) (34%) $54.61
Animal Breeders Insf. Data 19 16 (3) (16%) $20.23
Animal Control Workers 7 211 226 15 7% $22.04
Athletes and Sports Competitors 1 36 37 1 3% $40.93
Audiologists 4 44 68 24 55% $38.21
Automotive and Watercraft Service Attendants 76 1,253 1,594 341 27% $12.63
Barbers 5 104 127 23 22% $13.40
Bicycle Repairers 5 54 79 25 46% $12.09
Brickmasons and Blockmasons 13 612 524 (88) (14%) $26.56
Building Cleaning Workers, All Other 5 180 197 17 9% $12.41
Bus Drivers, School or Special Client 135 4,850 5,256 406 8% $16.39
Bus Drivers, Transit and Intercity 34 1,124 1,245 121 11% $18.57
Buyers and Purchasing Agents, Farm Products 4 103 119 16 16% $38.30
Cabinetmakers and Bench Carpenters 18 1,528 1,179 (349) (23%) $14.46
Captains, Mates, and Pilots of Water Vessels 1 19 22 3 16% $31.64
Cargo and Freight Agents 41 572 789 217 38% $19.04
Carpenters 257 10,463 10,793 330 3% $23.01
Carpet Installers 15 423 477 54 13% $20.24
Cement Masons and Concrete Finishers 71 2,687 2,885 198 7% $22.55
Cleaning, Washing, and Metal Pickling Equipment Operators and Tenders 4 130 132 2 2% $12.40
Coaches and Scouts 69 1,528 1,731 203 13% $17.64
Coating, Painting, and Spraying Machine Setters, Operators, and Tenders 24 1,146 1,083 (63) (5%) $16.72
Coil Winders, Tapers, and Finishers 3 133 146 13 10% $14.97
REGIONAL JOB OPENINGS BY OCCUPATION (2015-2025) - UNRELATED TO EXISTING PROGRAMS
San Bernard ino Va l l ey Co l lege / 2017 Comprehens ive Mas te r P lanA.196
2017 Comprehens ive Mas te r P lan Append ix / SBCCD / HMC Arch i tec ts + ALMA St ra teg ies

Description Annual Openings
2015 Jobs
2025 Jobs
2015 - 2025 Change
2015 - 2025 % Change
Avg. Hourly Earnings
Coin, Vending, and Amusement Machine Servicers and Repairers 10 434 483 49 11% $17.23
Commercial and Industrial Designers 10 272 291 19 7% $29.86
Commercial Pilots 17 246 331 85 35% $35.63
Communications Equipment Operators, All Other Insf. Data 33 34 1 3% $16.88
Concierges 12 200 258 58 29% $14.09
Construction and Related Workers, All Other 16 577 613 36 6% $21.11
Construction Laborers 418 11,705 12,926 1,221 10% $20.01
Construction Managers 71 2,220 2,517 297 13% $52.43
Continuous Mining Machine Operators 4 92 106 14 15% $21.15
Conveyor Operators and Tenders 24 481 569 88 18% $17.22
Counter and Rental Clerks 231 6,342 6,905 563 9% $14.68
Couriers and Messengers 13 839 860 21 3% $12.74
Crane and Tower Operators 12 161 218 57 35% $25.65
Customer Service Representatives 833 16,189 19,613 3,424 21% $17.62
Data Entry Keyers 19 1,740 1,543 (197) (11%) $13.81
Demonstrators and Product Promoters 75 1,601 1,858 257 16% $13.58
Dental Assistants 190 4,713 5,520 807 17% $15.56
Dental Hygienists 83 1,400 1,803 403 29% $43.50
Dental Laboratory Technicians 11 429 262 (167) (39%) $16.79
Dentists, All Other Specialists 1 30 33 3 10% $62.86
Dentists, General 53 1,149 1,364 215 19% $55.86
Derrick Operators, Oil and Gas Insf. Data 15 15 0 0% $23.28
Diagnostic Medical Sonographers 30 468 684 216 46% $34.06
Driver/Sales Workers 136 2,430 3,321 891 37% $16.17
Drywall and Ceiling Tile Installers 130 2,915 3,578 663 23% $24.70
Earth Drillers, Except Oil and Gas 10 239 268 29 12% $36.88
Education, Training, and Library Workers, All Other 23 1,887 1,948 61 3% $18.74
Elevator Installers and Repairers 3 71 90 19 27% $44.61
Eligibility Interviewers, Government Programs 88 3,114 3,342 228 7% $19.94
Embalmers Insf. Data 41 34 (7) (17%) $22.59
San Bernard ino Va l l ey Co l lege / 2017 Comprehens ive Mas te r P lan A.197
2017 Comprehens ive Mas te r P lan Append ix / SBCCD / HMC Arch i tec ts + ALMA St ra teg ies

Description Annual Openings
2015 Jobs
2025 Jobs
2015 - 2025 Change
2015 - 2025 % Change
Avg. Hourly Earnings
Emergency Management Directors 2 53 61 8 15% $40.31
Emergency Medical Technicians and Paramedics 117 2,027 2,550 523 26% $14.45
Entertainment Attendants and Related Workers, All Other 6 55 79 24 44% $12.97
Epidemiologists 1 31 35 4 13% $27.71
Etchers and Engravers 2 69 74 5 7% $12.34
Excavating and Loading Machine and Dragline Operators 7 240 283 43 18% $26.57
Explosives Workers, Ordnance Handling Experts, and Blasters Insf. Data 19 22 3 16% $28.24
Extraction Workers, All Other Insf. Data 42 44 2 5% $17.53
Fabric and Apparel Patternmakers Insf. Data 37 37 0 0% $19.90
Farm and Home Management Advisors Insf. Data 11 14 3 27% $29.60
Farmers, Ranchers, and Other Agricultural Managers 10 716 545 (171) (24%) $36.37
Farmworkers, Farm, Ranch, and Aquacultural Animals 18 677 553 (124) (18%) $13.24
Fence Erectors 24 601 677 76 13% $18.02
Fiberglass Laminators and Fabricators 6 300 276 (24) (8%) $15.10
Fire Inspectors and Investigators 2 45 53 8 18% $34.51
Firefighters 133 3,534 3,852 318 9% $28.28
First-Line Supervisors of Construction Trades and Extraction Workers 128 4,868 5,470 602 12% $34.10
First-Line Supervisors of Farming, Fishing, and Forestry Workers 8 413 348 (65) (16%) $19.78
First-Line Supervisors of Fire Fighting and Prevention Workers 17 265 309 44 17% $49.62
First-Line Supervisors of Helpers, Laborers, and Material Movers, Hand 196 3,477 4,338 861 25% $24.45
First-Line Supervisors of Housekeeping and Janitorial Workers 56 1,459 1,648 189 13% $18.11
First-Line Supervisors of Landscaping, Lawn Service, and Groundskeeping Workers 38 1,401 1,612 211 15% $20.08
First-Line Supervisors of Personal Service Workers 72 1,397 1,804 407 29% $19.77
First-Line Supervisors of Production and Operating Workers 104 5,164 5,314 150 3% $25.90
First-Line Supervisors of Retail Sales Workers 608 13,373 16,191 2,818 21% $20.79
First-Line Supervisors of Transportation and Material-Moving Machine and Vehicle Operators 129 2,423 2,964 541 22% $27.23
Fish and Game Wardens Insf. Data 27 29 2 7% $26.94
Fishers and Related Fishing Workers Insf. Data 11 <10 Insf. Data Insf. Data $16.98
Flight Attendants 1 39 36 (3) (8%) $19.79
Floor Layers, Except Carpet, Wood, and Hard Tiles 8 238 268 30 13% $15.85
REGIONAL JOB OPENINGS BY OCCUPATION (2015-2025) - UNRELATED TO EXISTING PROGRAMS (cont.)
San Bernard ino Va l l ey Co l lege / 2017 Comprehens ive Mas te r P lanA.198
2017 Comprehens ive Mas te r P lan Append ix / SBCCD / HMC Arch i tec ts + ALMA St ra teg ies

Description Annual Openings
2015 Jobs
2025 Jobs
2015 - 2025 Change
2015 - 2025 % Change
Avg. Hourly Earnings
Floor Sanders and Finishers 3 91 104 13 14% $19.77
Floral Designers 7 313 255 (58) (19%) $17.11
Food and Tobacco Roasting, Baking, and Drying Machine Operators and Tenders 4 81 94 13 16% $16.90
Foundry Mold and Coremakers 1 115 93 (22) (19%) $13.22
Funeral Attendants 6 223 214 (9) (4%) $13.53
Funeral Service Managers 2 53 55 2 4% $28.71
Furniture Finishers 4 153 157 4 3% $12.40
Gaming Cage Workers 13 503 531 28 6% $12.65
Gaming Change Persons and Booth Cashiers 42 841 887 46 5% $12.21
Gaming Dealers 70 3,027 3,192 165 5% $12.24
Gaming Managers 3 105 112 7 7% $37.54
Gaming Service Workers, All Other 18 614 676 62 10% $13.96
Gaming Supervisors 8 304 321 17 6% $23.87
Gaming Surveillance Officers and Gaming Investigators 7 314 332 18 6% $16.47
Gas Plant Operators 7 148 146 (2) (1%) $34.97
Glaziers 10 239 227 (12) (5%) $29.42
Grinding and Polishing Workers, Hand 12 412 376 (36) (9%) $13.82
Grounds Maintenance Workers, All Other 5 80 105 25 31% $18.90
Hairdressers, Hairstylists, and Cosmetologists 92 2,033 2,414 381 19% $12.21
Hazardous Materials Removal Workers 7 135 176 41 30% $18.23
Health and Safety Engineers, Except Mining Safety Engineers and Inspectors 5 107 122 15 14% $41.00
Hearing Aid Specialists 3 73 90 17 23% $21.49
Heat Treating Equipment Setters, Operators, and Tenders, Metal and Plastic 2 89 95 6 7% $16.78
Heavy and Tractor-Trailer Truck Drivers 1,022 26,335 31,860 5,525 21% $22.84
Helpers, Construction Trades, All Other 9 299 318 19 6% $17.06
Helpers--Brickmasons, Blockmasons, Stonemasons, and Tile and Marble Setters 11 404 354 (50) (12%) $17.87
Helpers--Carpenters 11 262 303 41 16% $13.46
Helpers--Extraction Workers 3 59 70 11 19% $16.72
Helpers--Installation, Maintenance, and Repair Workers 57 1,304 1,465 161 12% $14.79
Helpers--Painters, Paperhangers, Plasterers, and Stucco Masons 3 132 127 (5) (4%) $13.42
San Bernard ino Va l l ey Co l lege / 2017 Comprehens ive Mas te r P lan A.199
2017 Comprehens ive Mas te r P lan Append ix / SBCCD / HMC Arch i tec ts + ALMA St ra teg ies

Description Annual Openings
2015 Jobs
2025 Jobs
2015 - 2025 Change
2015 - 2025 % Change
Avg. Hourly Earnings
Helpers--Pipelayers, Plumbers, Pipefitters, and Steamfitters 20 718 797 79 11% $15.05
Helpers--Roofers 5 130 161 31 24% $12.74
Highway Maintenance Workers 15 428 506 78 18% $23.29
Hydrologists 2 40 44 4 10% $45.24
Industrial Engineering Technicians 8 335 337 2 1% $24.88
Industrial Production Managers 31 1,387 1,390 3 0% $47.19
Industrial Truck and Tractor Operators 398 9,849 11,357 1,508 15% $15.89
Information and Record Clerks, All Other 28 1,178 1,189 11 1% $19.03
Instructional Coordinators 33 1,694 1,872 178 11% $36.28
Insulation Workers, Floor, Ceiling, and Wall 23 311 462 151 49% $28.20
Insulation Workers, Mechanical 10 104 182 78 75% $27.02
Insurance Sales Agents 112 2,752 3,171 419 15% $25.79
Interviewers, Except Eligibility and Loan 51 1,361 1,582 221 16% $19.02
Janitors and Cleaners, Except Maids and Housekeeping Cleaners 610 18,992 21,282 2,290 12% $13.55
Jewelers and Precious Stone and Metal Workers 13 215 289 74 34% $16.95
Laborers and Freight, Stock, and Material Movers, Hand 2,624 47,382 57,228 9,846 21% $13.45
Landscaping and Groundskeeping Workers 576 14,111 16,053 1,942 14% $12.33
Laundry and Dry-Cleaning Workers 59 1,322 1,490 168 13% $12.13
Layout Workers, Metal and Plastic 1 49 48 (1) (2%) $21.31
Legislators 13 353 400 47 13% $24.93
Librarians 20 501 580 79 16% $28.58
Library Assistants, Clerical 61 968 1,121 153 16% $13.43
Light Truck or Delivery Services Drivers 323 9,684 11,232 1,548 16% $19.14
Locksmiths and Safe Repairers 8 177 198 21 12% $24.59
Locomotive Engineers Insf. Data 21 19 (2) (10%) $28.23
Lodging Managers 15 328 367 39 12% $25.67
Logging Equipment Operators Insf. Data 14 14 0 0% $19.28
Machine Feeders and Offbearers 92 1,853 2,344 491 26% $14.98
Magnetic Resonance Imaging Technologists 9 161 218 57 35% $37.03
Mail Clerks and Mail Machine Operators, Except Postal Service 8 311 312 1 0% $13.90
REGIONAL JOB OPENINGS BY OCCUPATION (2015-2025) - UNRELATED TO EXISTING PROGRAMS (cont.)
San Bernard ino Va l l ey Co l lege / 2017 Comprehens ive Mas te r P lanA.200
2017 Comprehens ive Mas te r P lan Append ix / SBCCD / HMC Arch i tec ts + ALMA St ra teg ies

Description Annual Openings
2015 Jobs
2025 Jobs
2015 - 2025 Change
2015 - 2025 % Change
Avg. Hourly Earnings
Manufactured Building and Mobile Home Installers Insf. Data 28 25 (3) (11%) $12.06
Material Moving Workers, All Other 35 784 903 119 15% $19.15
Mechanical Door Repairers 10 171 211 40 23% $21.42
Medical and Health Services Managers 126 2,385 2,979 594 25% $58.00
Medical Appliance Technicians 4 132 107 (25) (19%) $23.42
Meeting, Convention, and Event Planners 29 685 870 185 27% $20.34
Merchandise Displayers and Window Trimmers 35 538 721 183 34% $16.53
Metal-Refining Furnace Operators and Tenders 2 53 63 10 19% $17.57
Mine Cutting and Channeling Machine Operators 1 25 30 5 20% $22.68
Model Makers, Metal and Plastic Insf. Data 21 23 2 10% $19.65
Model Makers, Wood Insf. Data 14 13 (1) (7%) $16.83
Models 3 52 68 16 31% $15.28
Molders, Shapers, and Casters, Except Metal and Plastic 27 736 694 (42) (6%) $15.62
Morticians, Undertakers, and Funeral Directors 3 79 82 3 4% $35.81
Motor Vehicle Operators, All Other 58 1,322 1,500 178 13% $15.24
Motorboat Operators Insf. Data 13 16 3 23% $23.69
Natural Sciences Managers 6 256 263 7 3% $52.77
Nuclear Engineers 1 26 31 5 19% $55.97
Nuclear Medicine Technologists 7 179 221 42 23% $46.42
Nuclear Power Reactor Operators Insf. Data 20 23 3 15% $43.62
Nuclear Technicians Insf. Data 13 17 4 31% $41.12
Occupational Health and Safety Specialists 17 406 460 54 13% $35.09
Occupational Health and Safety Technicians 3 69 83 14 20% $28.19
Office Machine Operators, Except Computer 16 649 629 (20) (3%) $16.91
Operating Engineers and Other Construction Equipment Operators 114 3,032 3,444 412 14% $31.03
Ophthalmic Laboratory Technicians 8 104 138 34 33% $14.33
Ophthalmic Medical Technicians 11 236 317 81 34% $18.20
Opticians, Dispensing 47 800 1,003 203 25% $16.66
Optometrists 16 263 332 69 26% $50.33
Oral and Maxillofacial Surgeons 2 38 47 9 24% $107.07
San Bernard ino Va l l ey Co l lege / 2017 Comprehens ive Mas te r P lan A.201
2017 Comprehens ive Mas te r P lan Append ix / SBCCD / HMC Arch i tec ts + ALMA St ra teg ies
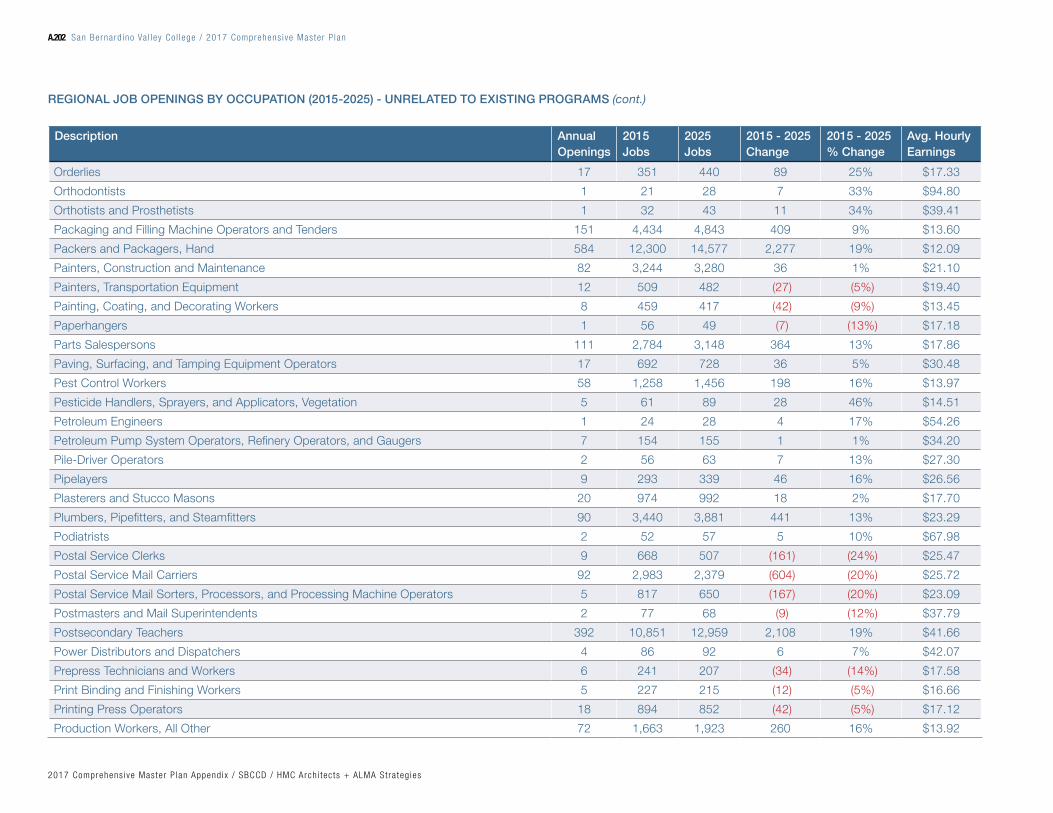
Description Annual Openings
2015 Jobs
2025 Jobs
2015 - 2025 Change
2015 - 2025 % Change
Avg. Hourly Earnings
Orderlies 17 351 440 89 25% $17.33
Orthodontists 1 21 28 7 33% $94.80
Orthotists and Prosthetists 1 32 43 11 34% $39.41
Packaging and Filling Machine Operators and Tenders 151 4,434 4,843 409 9% $13.60
Packers and Packagers, Hand 584 12,300 14,577 2,277 19% $12.09
Painters, Construction and Maintenance 82 3,244 3,280 36 1% $21.10
Painters, Transportation Equipment 12 509 482 (27) (5%) $19.40
Painting, Coating, and Decorating Workers 8 459 417 (42) (9%) $13.45
Paperhangers 1 56 49 (7) (13%) $17.18
Parts Salespersons 111 2,784 3,148 364 13% $17.86
Paving, Surfacing, and Tamping Equipment Operators 17 692 728 36 5% $30.48
Pest Control Workers 58 1,258 1,456 198 16% $13.97
Pesticide Handlers, Sprayers, and Applicators, Vegetation 5 61 89 28 46% $14.51
Petroleum Engineers 1 24 28 4 17% $54.26
Petroleum Pump System Operators, Refinery Operators, and Gaugers 7 154 155 1 1% $34.20
Pile-Driver Operators 2 56 63 7 13% $27.30
Pipelayers 9 293 339 46 16% $26.56
Plasterers and Stucco Masons 20 974 992 18 2% $17.70
Plumbers, Pipefitters, and Steamfitters 90 3,440 3,881 441 13% $23.29
Podiatrists 2 52 57 5 10% $67.98
Postal Service Clerks 9 668 507 (161) (24%) $25.47
Postal Service Mail Carriers 92 2,983 2,379 (604) (20%) $25.72
Postal Service Mail Sorters, Processors, and Processing Machine Operators 5 817 650 (167) (20%) $23.09
Postmasters and Mail Superintendents 2 77 68 (9) (12%) $37.79
Postsecondary Teachers 392 10,851 12,959 2,108 19% $41.66
Power Distributors and Dispatchers 4 86 92 6 7% $42.07
Prepress Technicians and Workers 6 241 207 (34) (14%) $17.58
Print Binding and Finishing Workers 5 227 215 (12) (5%) $16.66
Printing Press Operators 18 894 852 (42) (5%) $17.12
Production Workers, All Other 72 1,663 1,923 260 16% $13.92
REGIONAL JOB OPENINGS BY OCCUPATION (2015-2025) - UNRELATED TO EXISTING PROGRAMS (cont.)
San Bernard ino Va l l ey Co l lege / 2017 Comprehens ive Mas te r P lanA.202
2017 Comprehens ive Mas te r P lan Append ix / SBCCD / HMC Arch i tec ts + ALMA St ra teg ies

Description Annual Openings
2015 Jobs
2025 Jobs
2015 - 2025 Change
2015 - 2025 % Change
Avg. Hourly Earnings
Public Address System and Other Announcers 3 127 129 2 2% $15.72
Pump Operators, Except Wellhead Pumpers 1 17 23 6 35% $17.94
Radiation Therapists 9 201 242 41 20% $49.06
Radiologic Technologists 59 1,345 1,715 370 28% $30.39
Rail Car Repairers 4 50 68 18 36% $18.83
Railroad Brake, Signal, and Switch Operators Insf. Data 12 13 1 8% $27.57
Railroad Conductors and Yardmasters Insf. Data 24 23 (1) (4%) $26.83
Rail-Track Laying and Maintenance Equipment Operators 1 21 29 8 38% $28.25
Recreation Workers 127 3,957 4,701 744 19% $12.24
Refractory Materials Repairers, Except Brickmasons Insf. Data 15 14 (1) (7%) $20.46
Refuse and Recyclable Material Collectors 60 1,369 1,649 280 20% $19.02
Reinforcing Iron and Rebar Workers 11 719 515 (204) (28%) $27.89
Reservation and Transportation Ticket Agents and Travel Clerks 6 500 410 (90) (18%) $16.42
Residential Advisors 23 208 319 111 53% $16.85
Respiratory Therapists 43 1,247 1,478 231 19% $32.18
Respiratory Therapy Technicians 2 62 77 15 24% $29.12
Retail Salespersons 3,052 49,183 60,673 11,490 23% $12.46
Riggers 3 69 80 11 16% $26.56
Roofers 47 1,123 1,331 208 19% $20.74
Sailors and Marine Oilers 1 16 19 3 19% $16.72
Sales and Related Workers, All Other 40 1,016 1,200 184 18% $13.90
Sawing Machine Setters, Operators, and Tenders, Wood 21 618 563 (55) (9%) $14.16
Security and Fire Alarm Systems Installers 18 482 552 70 15% $23.58
Self-Enrichment Education Teachers 53 1,286 1,569 283 22% $17.57
Semiconductor Processors 3 160 123 (37) (23%) $18.13
Septic Tank Servicers and Sewer Pipe Cleaners 9 204 250 46 23% $23.87
Service Unit Operators, Oil, Gas, and Mining Insf. Data 15 17 2 13% $22.96
Shipping, Receiving, and Traffic Clerks 409 9,840 11,155 1,315 13% $15.24
Shoe and Leather Workers and Repairers 1 52 51 (1) (2%) $13.28
Shoe Machine Operators and Tenders Insf. Data 20 17 (3) (15%) $12.94
San Bernard ino Va l l ey Co l lege / 2017 Comprehens ive Mas te r P lan A.203
2017 Comprehens ive Mas te r P lan Append ix / SBCCD / HMC Arch i tec ts + ALMA St ra teg ies

Description Annual Openings
2015 Jobs
2025 Jobs
2015 - 2025 Change
2015 - 2025 % Change
Avg. Hourly Earnings
Skincare Specialists 20 422 579 157 37% $14.63
Slot Supervisors 6 207 220 13 6% $22.07
Speech-Language Pathologists 27 705 857 152 22% $38.66
Stationary Engineers and Boiler Operators 12 309 327 18 6% $29.50
Stock Clerks and Order Fillers 1,209 26,373 29,870 3,497 13% $12.83
Stonemasons 6 294 270 (24) (8%) $18.67
Switchboard Operators, Including Answering Service 21 1,198 1,138 (60) (5%) $13.56
Tailors, Dressmakers, and Custom Sewers 9 267 321 54 20% $14.37
Tank Car, Truck, and Ship Loaders 4 23 48 25 109% $22.25
Tapers 31 733 876 143 20% $21.99
Taxi Drivers and Chauffeurs 44 816 1,138 322 39% $12.39
Team Assemblers 243 10,003 10,484 481 5% $12.87
Telemarketers 36 820 996 176 21% $12.14
Telephone Operators 3 109 105 (4) (4%) $20.50
Terrazzo Workers and Finishers 3 125 137 12 10% $21.69
Textile Bleaching and Dyeing Machine Operators and Tenders 1 45 44 (1) (2%) $14.86
Textile Knitting and Weaving Machine Setters, Operators, and Tenders 12 24 126 102 425% $12.80
Textile, Apparel, and Furnishings Workers, All Other 2 45 62 17 38% $12.62
Tile and Marble Setters 36 1,206 1,293 87 7% $20.94
Tire Builders Insf. Data 26 23 (3) (12%) $15.93
Tool and Die Makers 6 417 451 34 8% $23.53
Tool Grinders, Filers, and Sharpeners 2 79 82 3 4% $17.03
Tour Guides and Escorts 14 226 248 22 10% $13.13
Training and Development Specialists 62 1,526 1,831 305 20% $27.13
Transportation Attendants, Except Flight Attendants 2 53 65 12 23% $16.47
Transportation Workers, All Other 28 485 554 69 14% $15.13
Travel Agents 5 345 275 (70) (20%) $16.72
Travel Guides 3 61 61 0 0% $16.56
Tree Trimmers and Pruners 29 547 684 137 25% $14.26
Umpires, Referees, and Other Sports Officials 6 139 153 14 10% $14.01
REGIONAL JOB OPENINGS BY OCCUPATION (2015-2025) - UNRELATED TO EXISTING PROGRAMS (cont.)
San Bernard ino Va l l ey Co l lege / 2017 Comprehens ive Mas te r P lanA.204
2017 Comprehens ive Mas te r P lan Append ix / SBCCD / HMC Arch i tec ts + ALMA St ra teg ies

Description Annual Openings
2015 Jobs
2025 Jobs
2015 - 2025 Change
2015 - 2025 % Change
Avg. Hourly Earnings
Upholsterers 17 426 455 29 7% $15.61
Watch Repairers 2 23 34 11 48% $22.07
Weighers, Measurers, Checkers, and Samplers, Recordkeeping 58 1,432 1,669 237 17% $13.45
Wholesale and Retail Buyers, Except Farm Products 49 932 1,154 222 24% $29.48
Wind Turbine Service Technicians 4 100 126 26 26% $24.76
Word Processors and Typists 4 1,260 1,032 (228) (18%) $18.71
San Bernard ino Va l l ey Co l lege / 2017 Comprehens ive Mas te r P lan A.205
2017 Comprehens ive Mas te r P lan Append ix / SBCCD / HMC Arch i tec ts + ALMA St ra teg ies