2017 soa annual meeting & exhibit · 2017 soa annual meeting & exhibit karen glenn session...
TRANSCRIPT

2017 SOA Annual Meeting & ExhibitKAREN GLENNSession 184, Future of Social Security (US & Canada)October 18, 2017

SOCIETY OF ACTUARIESAntitrust Compliance Guidelines
Active participation in the Society of Actuaries is an important aspect of membership. While the positive contributions of professional societies and associations are well-recognized and encouraged, association activities are vulnerable to close antitrust scrutiny. By their very nature, associations bring together industry competitors and other market participants.
The United States antitrust laws aim to protect consumers by preserving the free economy and prohibiting anti-competitive business practices; they promote competition. There are both state and federal antitrust laws, although state antitrust laws closely follow federal law. The Sherman Act, is the primary U.S. antitrust law pertaining to association activities. The Sherman Act prohibits every contract, combination or conspiracy that places an unreasonable restraint on trade. There are, however, some activities that are illegal under all circumstances, such as price fixing, market allocation and collusive bidding.
There is no safe harbor under the antitrust law for professional association activities. Therefore, association meeting participants should refrain from discussing any activity that could potentially be construed as having an anti-competitive effect. Discussions relating to product or service pricing, market allocations, membership restrictions, product standardization or other conditions on trade could arguably be perceived as a restraint on trade and may expose the SOA and its members to antitrust enforcement procedures.
While participating in all SOA in person meetings, webinars, teleconferences or side discussions, you should avoid discussing competitively sensitive information with competitors and follow these guidelines:
• Do not discuss prices for services or products or anything else that might affect prices• Do not discuss what you or other entities plan to do in a particular geographic or product markets or with particular customers.• Do not speak on behalf of the SOA or any of its committees unless specifically authorized to do so.
• Do leave a meeting where any anticompetitive pricing or market allocation discussion occurs.• Do alert SOA staff and/or legal counsel to any concerning discussions• Do consult with legal counsel before raising any matter or making a statement that may involve competitively sensitive information.
Adherence to these guidelines involves not only avoidance of antitrust violations, but avoidance of behavior which might be so construed. These guidelines only provide an overview of prohibited activities. SOA legal counsel reviews meeting agenda and materials as deemed appropriate and any discussion that departs from the formal agenda should be scrutinized carefully. Antitrust compliance is everyone’s responsibility; however, please seek legal counsel if you have any questions or concerns.
2

Presentation Disclaimer
Presentations are intended for educational purposes only and do not replace independent professional judgment. Statements of fact and opinions expressed are those of the participants individually and, unless expressly stated to the contrary, are not the opinion or position of the Society of Actuaries, its cosponsors or its committees. The Society of Actuaries does not endorse or approve, and assumes no responsibility for, the content, accuracy or completeness of the information presented. Attendees should note that the sessions are audio-recorded and may be published in various media, including print, audio and video formats without further notice.
3

Outline
1) Background and results from the 2017 Trustees Report2) Challenges and selected issues
• Aging• Mortality• Disability• Earnings dispersion• Adequacy of benefits
3) Potential long-term solutions
4

Social Security Trust Funds
• Two legally distinct trust funds:• OASI = Old-Age and Survivors Insurance• DI = Disability Insurance
• Financial operations are overseen by the Social Security Board of Trustees
• The two funds are often looked at on a theoretical combined basis and referred to as OASDI
• As of December 31, 2016, the OASDI trust funds hold about $2.85 trillion in asset reserves
5

How Is Social Security Financed (Income)?
• Payroll taxes• Employees and employers each pay 6.2% of covered earnings• The self-employed pay 12.4% of covered earnings• On earnings up to $127,200 in 2017
• Taxes on Social Security benefits• High-income beneficiaries pay federal income tax on their benefits
• Interest on trust fund reserves• Invested in interest-bearing securities of the US government
6

Where Does the Money Go (Outgo)?
• Benefit payments• About 61 million people getting benefits as of December 2016:
• 44 million retired workers and dependents of retired workers• 6 million survivors of deceased workers• 11 million disabled workers and dependents of disabled workers
• Benefits are:• Calculated using the highest 35 years of wage-indexed earnings• Calculated using a progressive benefit formula• Increased each year with COLA based on CPI-W
• Administrative expenses• Only about 0.7 percent of total expenditures in 2016
7

What Is the Legislative Mandate for the Annual Social Security Trustees Report?1) Trust Fund operations of the past year and the next five years2) Actuarial status of the trust funds
• This means the ability to meet the cost of scheduled benefits with scheduled revenue and trust fund reserves
• And the extent to which scheduled revenue will fall short, forcing cuts or delays in benefits in the absence of legislative change
8
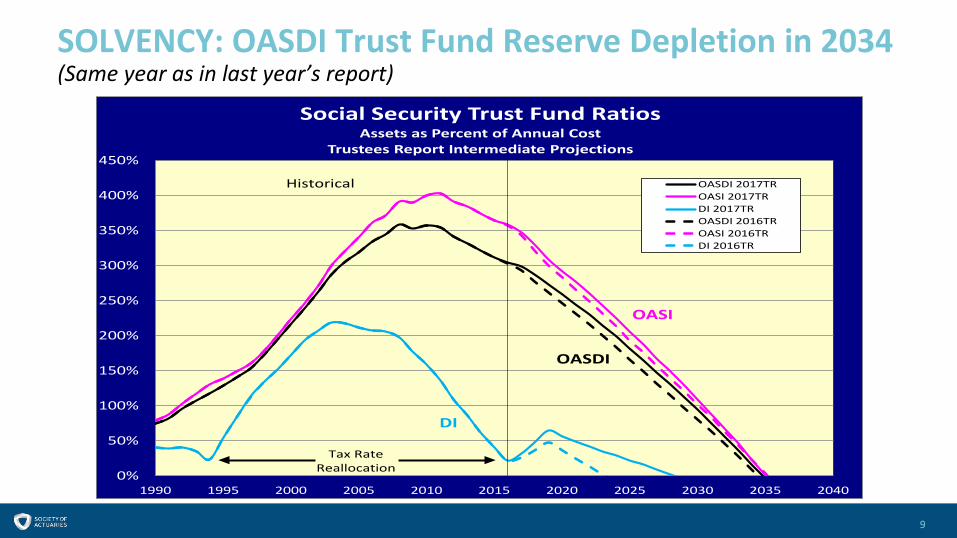
SOLVENCY: OASDI Trust Fund Reserve Depletion in 2034(Same year as in last year’s report)
9
0%
50%
100%
150%
200%
250%
300%
350%
400%
450%
1990 1995 2000 2005 2010 2015 2020 2025 2030 2035 2040
Social Security Trust Fund RatiosAssets as Percent of Annual Cost
Trustees Report Intermediate Projections
OASDI 2017TROASI 2017TRDI 2017TROASDI 2016TROASI 2016TRDI 2016TR
Historical
Tax RateReallocation
DI
OASDI
OASI

OASDI Annual Cost and Non-Interest Income as a Percent of Taxable Payroll
10
0%
5%
10%
15%
20%
25%
2005 2015 2025 2035 2045 2055 2065 2075 2085 2095Calendar year
Cost: Scheduled and payable benefits
Non-interest Income
Payable benefits as percentof scheduled benefits:2016-33: 100%2034: 77%2091: 73%
Cost: Scheduled but not fully payable benefits
Expenditures: Payable benefits = income after trust fund depletion in 2034

OASDI Beneficiaries per 100 Workers
11
0
10
20
30
40
50
60
70
80
90
100
1980 1990 2000 2010 2020 2030 2040 2050 2060 2070 2080 2090
Calendar year
Historical Estimated

Increasing Cost as Percent of Taxable Payroll and GDP due to Aging• “Macro Aging”
• Changing age distribution— getting older• Mainly from permanent drop in birth rates after 1965
• “Micro Aging”• People are living longer• Lower death rates• Higher life expectancy
12

Aging (change in age distribution)Mainly due to drop in birth rates
13
0.00
0.05
0.10
0.15
0.20
0.25
0.30
0.35
0.40
0.45
0.50
1940 1950 1960 1970 1980 1990 2000 2010 2020 2030 2040 2050 2060 2070 2080 2090 2100
Aged Dependency Ratio 2017 TRPopulation 65+/(20-64)
Actual and TR Intermediate
TFR remains at 3.0 after 1964
TFR remains at 3.3 after 1964
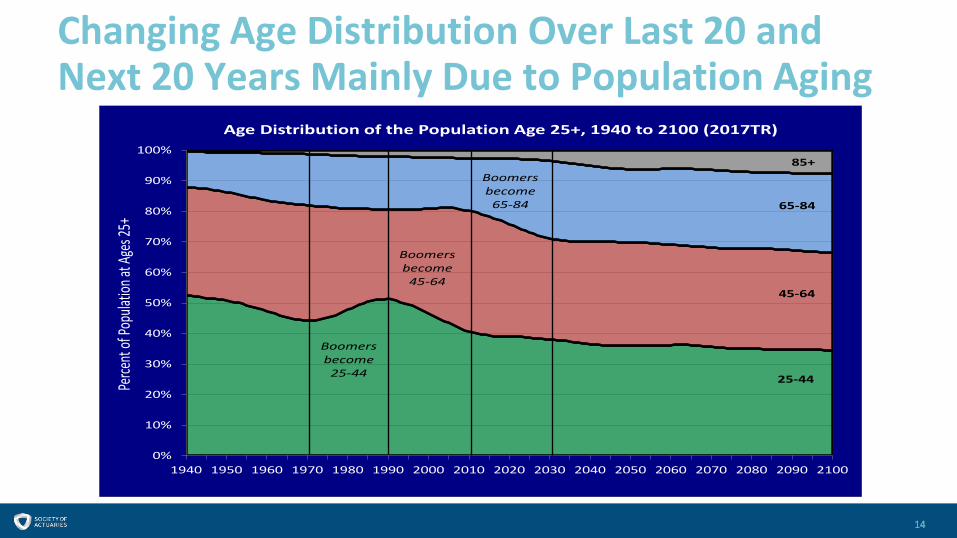
Changing Age Distribution Over Last 20 and Next 20 Years Mainly Due to Population Aging
14
0%
10%
20%
30%
40%
50%
60%
70%
80%
90%
100%
1940 1950 1960 1970 1980 1990 2000 2010 2020 2030 2040 2050 2060 2070 2080 2090 2100
Perce
nt of
Popu
lation
at Ag
es 25
+Age Distribution of the Population Age 25+, 1940 to 2100 (2017TR)
25-44
45-64
65-84
85+
Boomers become 25-44
Boomers become 45-64
Boomers become 65-84

Mortality Experience: All AgesReductions continue to fall short of expectations
15

Mortality Experience: Ages 65 and OlderReductions since 2009 continue to fall short of expectations
16

Mortality Experience: Ages Under 65Actual increase since 2010
17

Applications for Disability Benefits Continue to Fall
18
1.5
1.6
1.7
1.8
1.9
2.0
2.1
2003 2005 2007 2009 2011 2013 2015 2017 2019 2021 2023 2025
(milli
ons)Total Social Security Disability Receipts by Calendar Year:
Historical and Intermediate Assumptions for 2012 through 2017 Trustees Reports
2012TR
2017TR
2016TR
2015TR
2014TR2013TR

Disability Incidence Rate Falls to Historic Lows
19
4
4.5
5
5.5
6
6.5
1990 1995 2000 2005 2010 2015 2020 2025 2030
DI Age-Sex-Adjusted Incidence Rates:Historical and Intermediate Assumptions for 2012 through 2017 Trustees Reports
2012TR
2017TR
2016TR
2015TR
2014TR
2013TR
Average 1990-2016 5.27Ultimate Assumption 5.40

Fewer Disabled Worker BeneficiariesFewer now and in near term based on recent applications and incidence rates
20
6,000
7,000
8,000
9,000
10,000
11,000
2006 2007 2008 2009 2010 2011 2012 2013 2014 2015 2016 2017 2018 2019 2020 2021 2022 2023 2024 2025 2026
Disabled Worker BeneficiariesIn Current Payment Status at End of Year (in thousands)
2008 TR (no recession)
2017 TR
2016 TR

Taxable RatioDeclined over time: concentration of earnings at the top of the income distribution
21
0.8
0.82
0.84
0.86
0.88
0.9
1984 1987 1990 1993 1996 1999 2002 2005 2008 2011 2014 2017 2020 2023 2026
Taxable Ratio
Historical Projected

Trend in Wages in Excess of OASDI Taxable Maximum
22
0.00
0.02
0.04
0.06
0.08
0.10
0.12
0.14
0.16
0.18
1983 1985 1987 1989 1991 1993 1995 1997 1999 2001 2003 2005 2007 2009 2011 2013
Share of workers and share of wages above OASDI taxable maximum.
Workers
Wages

Share of Wages Earned by the Top 1% of Wage EarnersRises throughout 1980s and 1990s, but fairly flat since 2000
23
0.00
0.02
0.04
0.06
0.08
0.10
0.12
0.14
0.16
1983 1985 1987 1989 1991 1993 1995 1997 1999 2001 2003 2005 2007 2009 2011 2013
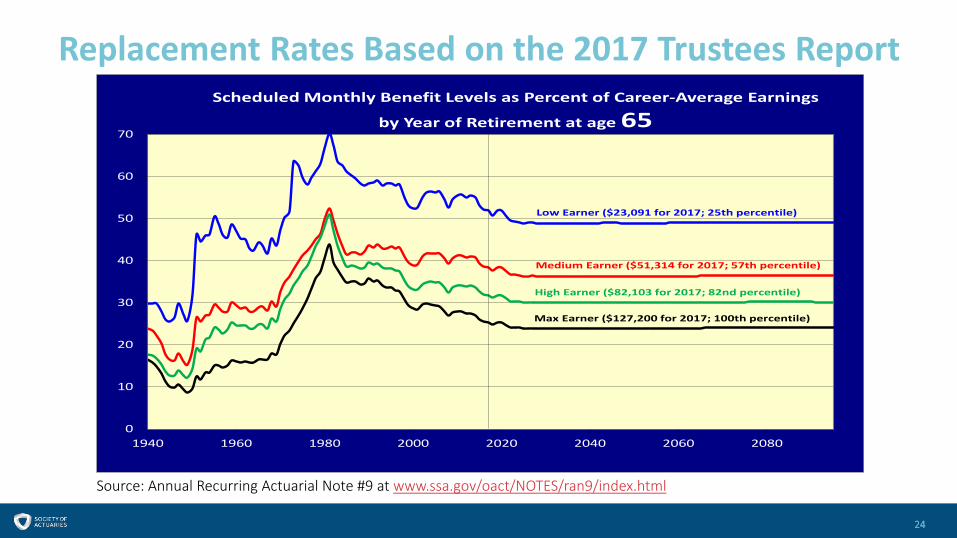
Replacement Rates Based on the 2017 Trustees Report
Source: Annual Recurring Actuarial Note #9 at www.ssa.gov/oact/NOTES/ran9/index.html
24
0
10
20
30
40
50
60
70
1940 1960 1980 2000 2020 2040 2060 2080
Scheduled Monthly Benefit Levels as Percent of Career-Average Earnings
by Year of Retirement at age 65
Low Earner ($23,091 for 2017; 25th percentile)
Medium Earner ($51,314 for 2017; 57th percentile)
High Earner ($82,103 for 2017; 82nd percentile)
Max Earner ($127,200 for 2017; 100th percentile)

How About at Age 62, When Most Start Benefits?
Source: Annual Recurring Actuarial Note #9 at www.ssa.gov/oact/NOTES/ran9/index.html
25
0
10
20
30
40
50
60
70
1960 1980 2000 2020 2040 2060 2080
Scheduled Monthly Benefit Levels as Percent of Career-Average Earnings
by Year of Retirement at age 62
Low Earner ($23,091 in 2017; 25th percentile)
Medium Earner ($51,314 in 2017; 57th percentile)
High Earner ($82,103 in 2017; 82nd percentile)
Max Earner ($127,200 in 2017; 100th percentile)

Payable Benefits Under the Law, After Trust Fund Reserves Are Depleted, Are Even Lower
Source: Annual Recurring Actuarial Note #9 at www.ssa.gov/oact/NOTES/ran9/index.html
26
0
10
20
30
40
50
60
70
1960 1980 2000 2020 2040 2060 2080
PAYABLE Monthly Benefit Levels as Percent of Career-Average Earnings by Year
of Retirement at age 62
Low Earner ($23,091 in 2017; 25th percentile)
Medium Earner ($51,314 in 2017; 57th percentile)
High Earner ($82,103 in 2017; 82nd percentile)
Max Earner ($127,200 in 2017; 100th percentile)

How to Fix Social Security Long-Term
How can the financing shortfalls be covered?• Lower cost (reduce benefits) by about 25%• Increase revenues by about 33%• Or some combination of approaches• Also consider benefit adequacy?
27

Ways to Lower Cost
• Lower benefits for retirees—not disabled• Increase normal retirement age (lowers OASDI cost, but increases DI cost)• Can exempt long-career low earners
• Lower benefits mainly for high earners• Reduce PIA above some level• Often combined with increasing PIA below some level, subject to work
year requirements
28

Ways to Lower Cost (continued)
• Lower benefits mainly for the oldest old• Reduce the COLA by using a chained version of the CPI• Some say instead raise the COLA by using the CPI-E (based on purchases
of consumers over age 62)
• Increase the number of years used in calculation (currently 35)
• Especially hurts those who haven’t been in the workforce for more than 35 years
29

Ways to Increase Revenue
• Raise tax rate on all earners• Increasing rate from current 12.4 percent to about 15.3 percent is
projected to eliminate the long-range shortfall
• Raise tax on highest earners• Increase taxable maximum amount• Some tax on all earnings above the maximum
30

Ways to Increase Revenue (continued)
• Tax employer group health insurance premiums• Affects only middle class if taxable maximum remains the same
• Tax certain investment income• Consistent with ACA approach?
• Maintain larger trust fund reserves• Could do this by investing some portion of reserves in equities• Added interest/yield can lower needed taxes
31
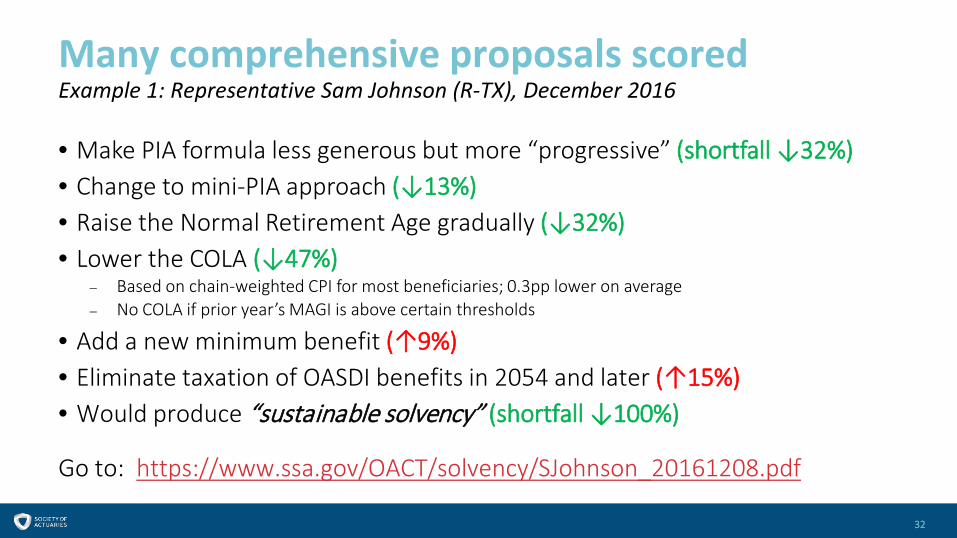
Many comprehensive proposals scoredExample 1: Representative Sam Johnson (R-TX), December 2016
• Make PIA formula less generous but more “progressive” (shortfall ↓32%)• Change to mini-PIA approach (↓13%)• Raise the Normal Retirement Age gradually (↓32%)• Lower the COLA (↓47%)
– Based on chain-weighted CPI for most beneficiaries; 0.3pp lower on average– No COLA if prior year’s MAGI is above certain thresholds
• Add a new minimum benefit (↑9%)• Eliminate taxation of OASDI benefits in 2054 and later (↑15%)• Would produce “sustainable solvency” (shortfall ↓100%)
Go to: https://www.ssa.gov/OACT/solvency/SJohnson_20161208.pdf
32

Many comprehensive proposals scoredExample 2: Representative John Larson (D-CT), April 2017
• Make PIA formula slightly more generous, more “progressive” (shortfall ↑9%)• Increase the COLA (↑15%)
– Based on CPI-E for all beneficiaries; 0.2pp higher on average– Index designed to better reflect the purchases of the elderly
• Improve the minimum benefit (↑5%)• Lower taxation of OASDI benefits slightly (↑7%)• Tax earnings above $400K (not indexed) with small benefit credit (↓71%)• Increase payroll tax rate gradually from 12.4 percent to 14.8 percent (↓67%)• Would produce “sustainable solvency” (shortfall ↓112%)
Go to: https://www.ssa.gov/OACT/solvency/JLarson_20170405.pdf
33

For More Information Go To http://www.ssa.gov/oact/There you will find:
• The 2017 and all prior OASDI Trustees Reports, back to 1941• Detailed single-year tables for recent reports• Our estimates for comprehensive proposals• Our estimates for the individual provisions• Actuarial notes; including replacement rates• Actuarial studies• Extensive databases• Congressional testimonies
34

Questions?