2018 ecology – sample-c (year 2) - science olympiad · 2018 ecology – sample-c (year 2) part 1...
TRANSCRIPT
1
2018 ECOLOGY – SAMPLE-C (YEAR 2) PART 1 – GENERAL PRINCIPLES OF ECOLOGY
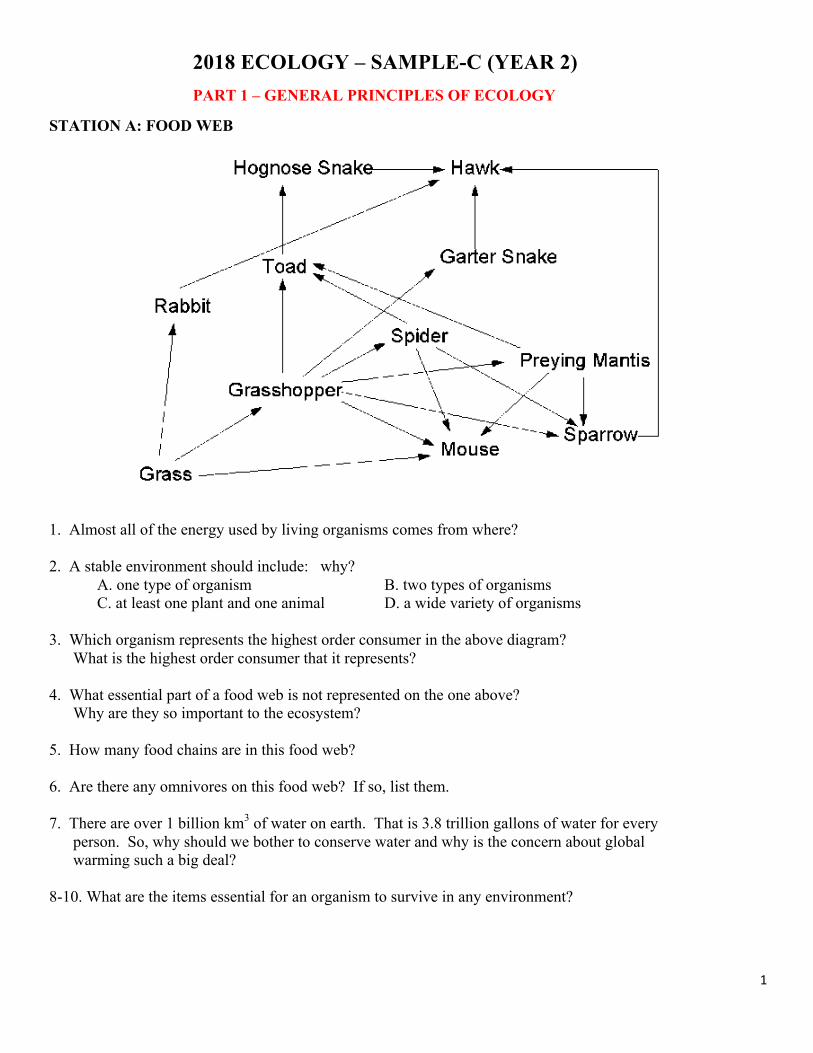
STATION A: FOOD WEB 1. Almost all of the energy used by living organisms comes from where? 2. A stable environment should include: why? A. one type of organism B. two types of organisms C. at least one plant and one animal D. a wide variety of organisms 3. Which organism represents the highest order consumer in the above diagram? What is the highest order consumer that it represents? 4. What essential part of a food web is not represented on the one above? Why are they so important to the ecosystem? 5. How many food chains are in this food web? 6. Are there any omnivores on this food web? If so, list them. 7. There are over 1 billion km3 of water on earth. That is 3.8 trillion gallons of water for every person. So, why should we bother to conserve water and why is the concern about global warming such a big deal? 8-10. What are the items essential for an organism to survive in any environment?

2
2018 ECOLOGY – SAMPLE TOURNAMENT – DIV C- (YEAR 2) PART 1 – GENERAL PRINCIPLES OF ECOLOGY
STATION A: FOOD WEB 1. Almost all of the energy used by living organisms comes from where? sun 2. A stable environment should include: why? A. one type of organism B. two types of organisms C. at least one plant and one animal D. a wide variety of organisms 3. Which organism represents the highest order consumer in the above diagram? Hawk What is the highest order consumer that it represents? 5th order 4. What essential part of a food web is not represented on the one above? decomposers Why are they so important to the ecosystem? recycle materials 5. How many food chains are in this food web? 13 6. Are there any omnivores on this food web? If so, list them. yes, mouse 7. There are over 1 billion km3 of water on earth. That is 3.8 trillion gallons of water for every person. So, why should we bother to conserve water and why is the concern about global warming such a big deal? Most of the water on earth is salt water 8-10. What are the items essential for an organism to survive in any environment? Survival Needs: fresh water, food,raw materials, energy, oxygen for most organisms, living space, appropriate climate

3
STATION B: ENERGY
Diagram 1 Diagram 2 Diagram 3 Diagram 4 11. What is a trophic level? 12. An energy flow pyramid has kcal/m2/yr. Which diagram 1, 2, or 3 is an energy flow pyramid? 13. Why do most food chains only have 3 -5 trophic levels? 14. A numbers pyramid represents the actual number of organisms. Which diagram 1, 2, or 3 is a numbers pyramid? It is from an acre of bluegrass. 15. A biomass pyramid has grams/m2. Which diagram 1, 2, or 3 is a biomass pyramid? 16. What is the 10% rule for the pyramids? 17. Why does diagram 4 not fit the 10% rule? 18-20.What types of activities use up the energy at each trophic level? What percent of the producer trophic level is actually available for the first order consumer in each of the pyramids above (figures 1,2, and 3)?

4
STATION B: ENERGY
Diagram 1 Diagram 2 Diagram 3 Diagram 4 11. What is a trophic level? feeding level 12. An energy flow pyramid has kcal/m2/yr. Which diagram 1, 2, or 3 is an energy flow pyramid? diagram 3 13. Why do most food chains only have 3 -5 trophic levels? 10% rule – 10% of energy to next level 14. A numbers pyramid represents the actual number of organisms. Which diagram 1, 2, or 3 is a numbers pyramid? It is from an acre of bluegrass. diagram 1 15. A biomass pyramid has grams/m2. Which diagram 1, 2, or 3 is a biomass pyramid? diagram 2 16. What is the 10% rule for the pyramids? only 10 % of the energy is available for the next level 17. Why does diagram 4 not fit the 10% rule? It is a numbers pyramid and it has only one producer – the tree 18-20.What types of activities use up the energy at each trophic level? What percent of the producer trophic level is actually available for the first order consumer in each of the pyramids above (figures 1,2, and 3)? respiration, growth, maintaining body tissues, body processes, body temperature #1 = 12%, #2= 4.6%, #3= 17%
5
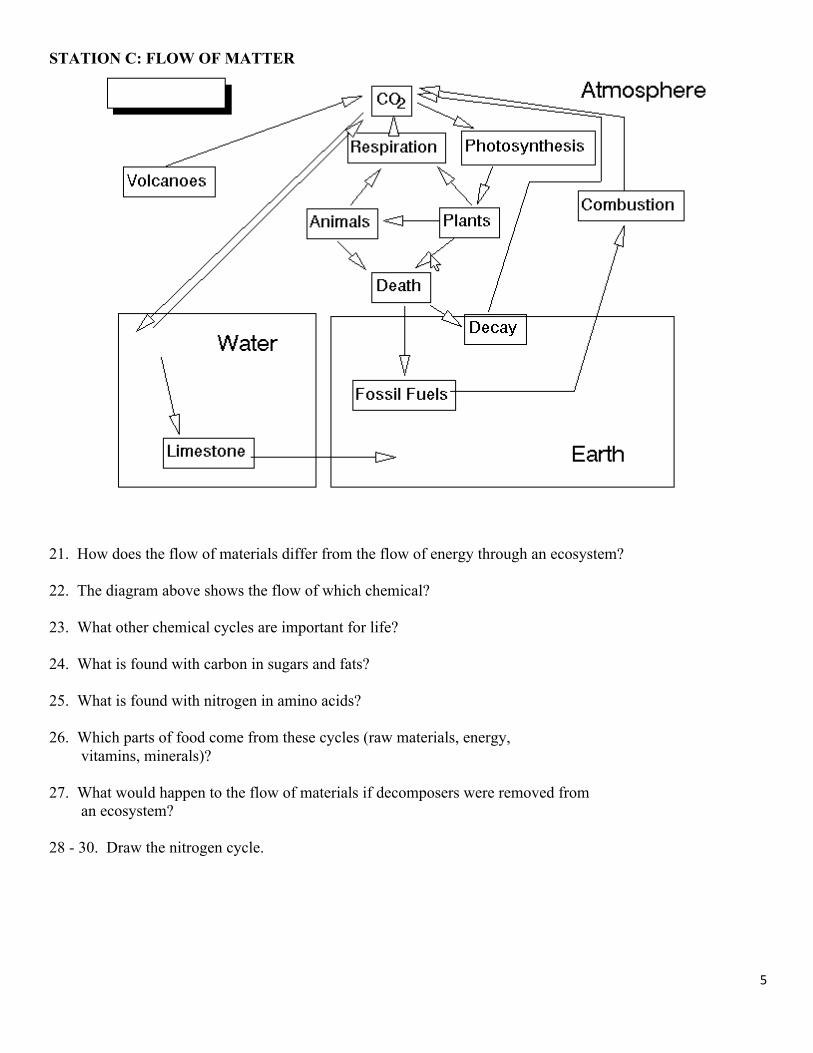
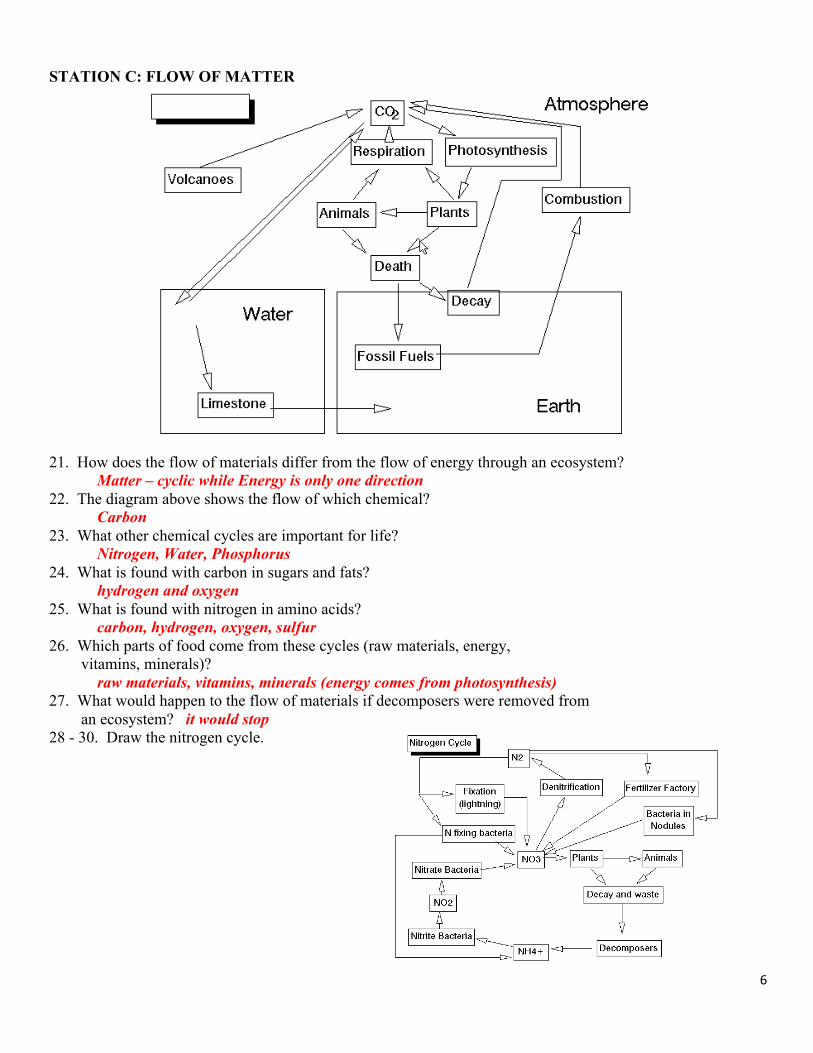
STATION C: FLOW OF MATTER 21. How does the flow of materials differ from the flow of energy through an ecosystem? 22. The diagram above shows the flow of which chemical? 23. What other chemical cycles are important for life? 24. What is found with carbon in sugars and fats? 25. What is found with nitrogen in amino acids? 26. Which parts of food come from these cycles (raw materials, energy, vitamins, minerals)? 27. What would happen to the flow of materials if decomposers were removed from an ecosystem? 28 - 30. Draw the nitrogen cycle.
6
STATION C: FLOW OF MATTER 21. How does the flow of materials differ from the flow of energy through an ecosystem? Matter – cyclic while Energy is only one direction 22. The diagram above shows the flow of which chemical? Carbon 23. What other chemical cycles are important for life? Nitrogen, Water, Phosphorus 24. What is found with carbon in sugars and fats? hydrogen and oxygen 25. What is found with nitrogen in amino acids? carbon, hydrogen, oxygen, sulfur 26. Which parts of food come from these cycles (raw materials, energy, vitamins, minerals)? raw materials, vitamins, minerals (energy comes from photosynthesis) 27. What would happen to the flow of materials if decomposers were removed from an ecosystem? it would stop 28 - 30. Draw the nitrogen cycle.

7
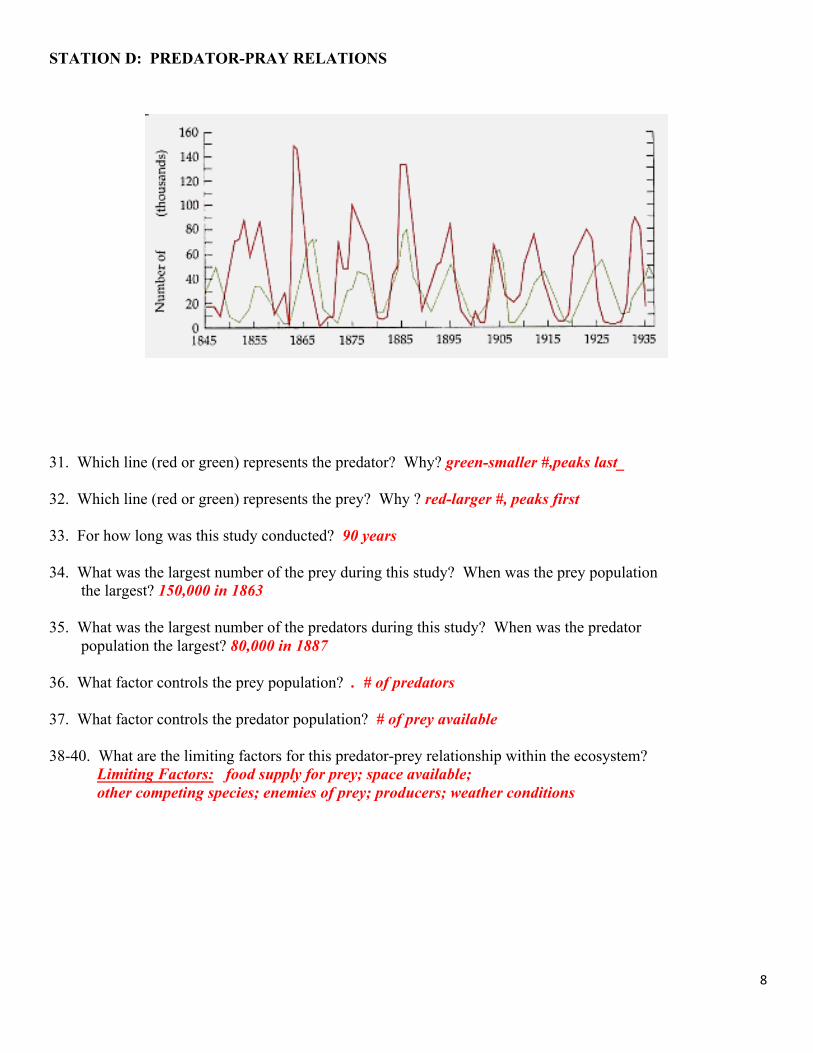
STATION D: PREDATOR-PRAY RELATIONS 31. Which line (red or green) represents the predator? Why? 32. Which line (red or green) represents the prey? Why ? 33. For how long was this study conducted? 34. What was the largest number of the prey during this study? When was the prey population the largest? 35. What was the largest number of the predators during this study? When was the predator population the largest? 36. What factor controls the prey population? 37. What factor controls the predator population? 38-40. What are the limiting factors for this predator-prey relationship within the ecosystem?
8
STATION D: PREDATOR-PRAY RELATIONS 31. Which line (red or green) represents the predator? Why? green-smaller #,peaks last_ 32. Which line (red or green) represents the prey? Why ? red-larger #, peaks first 33. For how long was this study conducted? 90 years 34. What was the largest number of the prey during this study? When was the prey population the largest? 150,000 in 1863 35. What was the largest number of the predators during this study? When was the predator population the largest? 80,000 in 1887 36. What factor controls the prey population? . # of predators 37. What factor controls the predator population? # of prey available 38-40. What are the limiting factors for this predator-prey relationship within the ecosystem? Limiting Factors: food supply for prey; space available; other competing species; enemies of prey; producers; weather conditions
9
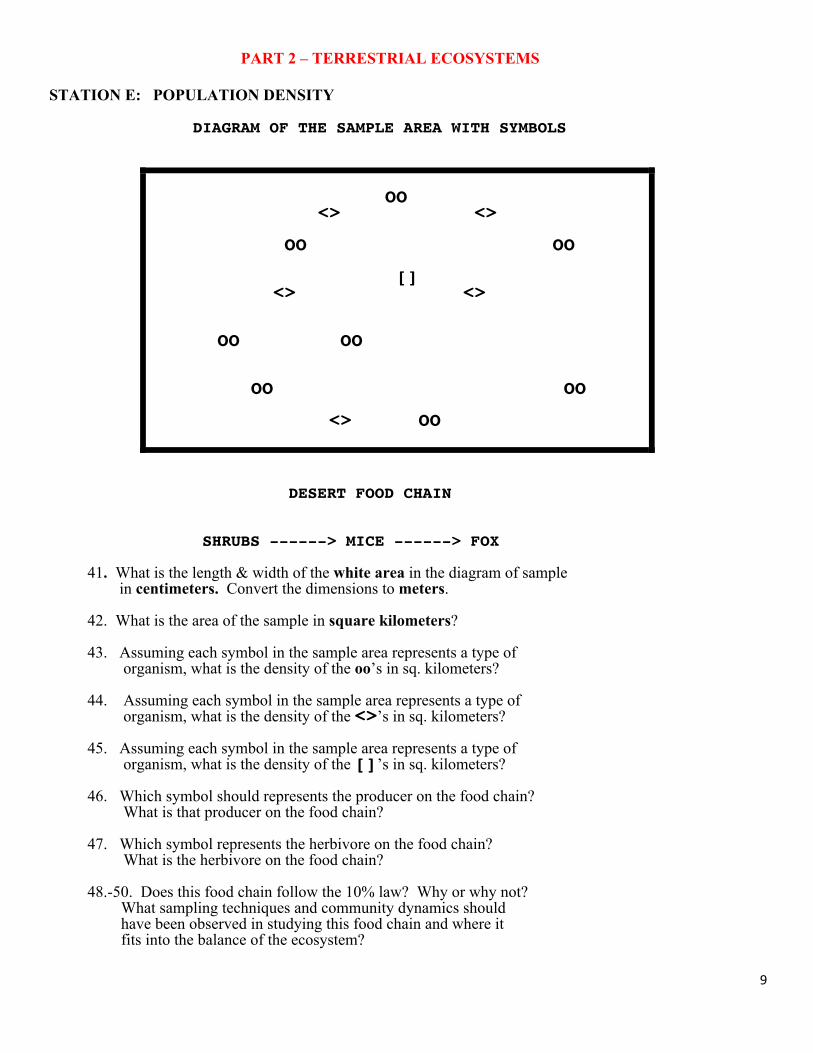
PART 2 – TERRESTRIAL ECOSYSTEMS STATION E: POPULATION DENSITY DIAGRAM OF THE SAMPLE AREA WITH SYMBOLS
OO <> <> OO OO [] <> <> OO OO OO OO <> OO
DESERT FOOD CHAIN SHRUBS ------> MICE ------> FOX 41. What is the length & width of the white area in the diagram of sample in centimeters. Convert the dimensions to meters. 42. What is the area of the sample in square kilometers? 43. Assuming each symbol in the sample area represents a type of organism, what is the density of the oo’s in sq. kilometers? 44. Assuming each symbol in the sample area represents a type of organism, what is the density of the <>’s in sq. kilometers? 45. Assuming each symbol in the sample area represents a type of organism, what is the density of the []’s in sq. kilometers? 46. Which symbol should represents the producer on the food chain? What is that producer on the food chain? 47. Which symbol represents the herbivore on the food chain? What is the herbivore on the food chain? 48.-50. Does this food chain follow the 10% law? Why or why not?
What sampling techniques and community dynamics should have been observed in studying this food chain and where it fits into the balance of the ecosystem?

10
PART 2 – TERRESTRIAL ECOSYSTEMS STATION E: POPULATION DENSITY DIAGRAM OF THE SAMPLE AREA WITH SYMBOLS
OO <> <> OO OO [] <> <> OO OO OO OO <> OO
DESERT FOOD CHAIN SHRUB ------> MICE ------> FOX 41. What is the length & width of the white area in the diagram of sample in centimeters. Convert the dimensions to meters. 13.4 cm X 7.2 cm .134 m X .072 m 42. What is the area of the sample in square kilometers? 0.01 sq. kilometers 43. Assuming each symbol in the sample area represents a type of organism, what is the density of the oo’s in sq. kilometers? 200 circle organisms/sq km 44. Assuming each symbol in the sample area represents a type of organism, what is the density of the <>’s in sq. kilometers? 1400 X organisms/sq km 45. Assuming each symbol in the sample area represents a type of organism, what is the density of the []’s in sq. kilometers? 2700 triangle organisms/sq km 46. Which symbol should represents the producer on the food chain? What is that producer on the food chain? triangles – SHRUB 47. Which symbol represents the herbivore on the food chain? What is the herbivore on the food chain? squares – MICE 48.-50. Does this food chain follow the 10% law? Why or why not?
What sampling techniques and community dynamics should have been observed in studying this food chain and where it fits into the balance of the ecosystem? No there is not 10% at next level
Sampling Techniques: random samples, several samples, large enough level of samples plus the Community dynamics – other food webs, abiotic factors

11
STATION F: ADAPTIONS – GRASSLANDS AND DESERTS Plants and animals must adapt to the environment in which they live. 51. – 52 . List the adaptations of Grassland Plants 53. – 54. List the adaptations of Grassland Animals 55. - 56. List the adaptations of Desert Plants 57. – 58. List the adaptations of Desert Animals 59. – 60. What is the impact of man on Desert Biomes?

12
STATION F: ADAPTIONS – GRASSLANDS AND DESERTS Plants and animals must adapt to the environment in which they live. 51. – 52 . List the adaptations of Grassland Plants
Grasses have three strata – roots, growth at ground level, and taller foliage Half of growth may be below ground Grazed taller foliage will grow back Taller foliage above ground adapted to withstand strong winds, fires, extreme temperature changes
53. – 54. List the adaptations of Grassland Animals
Long distance vision for predator & prey Eyes of grazing animals well above snout Many are built for speed – live in herds or colonies Small creatures can stand on haunches Some hop up and down or hop long distances Camouflage coloration Underground burrows Birds – strong fliers (strong winds), flight song birds to attract mates in air, nest in tall grass)
55. - 56. List the adaptations of Desert Plants
Many small with spines, ground hugging shrubs and short woody trees. Leaves have water conserving characteristics as small, thick and covered with thick cuticles. Some have stomates only open at night when evaporation is lowest. Cacti have photosynthesis in stems (leaves are spines). Annuals flower during rainy periods.
57. – 58. List the adaptations of Desert Animals
Many are small nocturnal carnivores. Burrowers to protect from daytime heat and dry conditions. Insects, arachnids, reptiles are cold-blooded ectotherms
59. – 60. What is the impact of man on Desert Biomes?
Competition of man for water Expansion of deserts due to human land use practices.
13
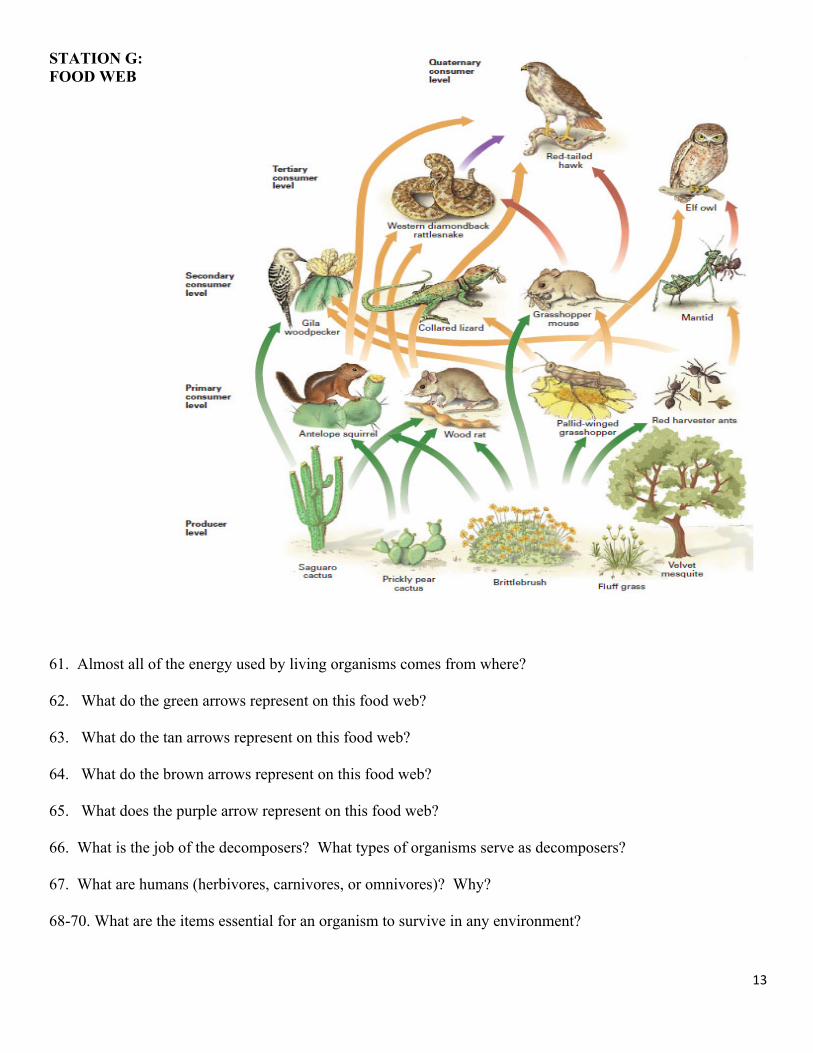
STATION G: FOOD WEB 61. Almost all of the energy used by living organisms comes from where? 62. What do the green arrows represent on this food web? 63. What do the tan arrows represent on this food web? 64. What do the brown arrows represent on this food web? 65. What does the purple arrow represent on this food web? 66. What is the job of the decomposers? What types of organisms serve as decomposers? 67. What are humans (herbivores, carnivores, or omnivores)? Why? 68-70. What are the items essential for an organism to survive in any environment?

14
STATION G: FOODWEB 61. Almost all of the energy used by living organisms comes from where? the sun 62. What do the green arrows represent on this food web? nutrient transfer from producers to primary consumers 63. What do the tan arrows represent on this food web? nutrient transfer from primary consumers to secondary consumers 64. What do the brown arrows represent on this food web? nutrient transfer from secondary consumers to tertiary consumers 65. What does the purple arrow represent on this food web? nutrient transfer from tertiary consumer to quaternary consumers 66. What is the job of the decomposers? What types of organisms serve as decomposers? consumes dead animals or debris - Bacteria or fungi 67. What are humans (herbivores, carnivores, or omnivores)? Why? omnivores – they eat both plants & animals 68-70. What are the items essential for an organism to survive in any environment? appropriate climate; water – fresh water; food – raw materials; energy; oxygen for most organisms living space
15
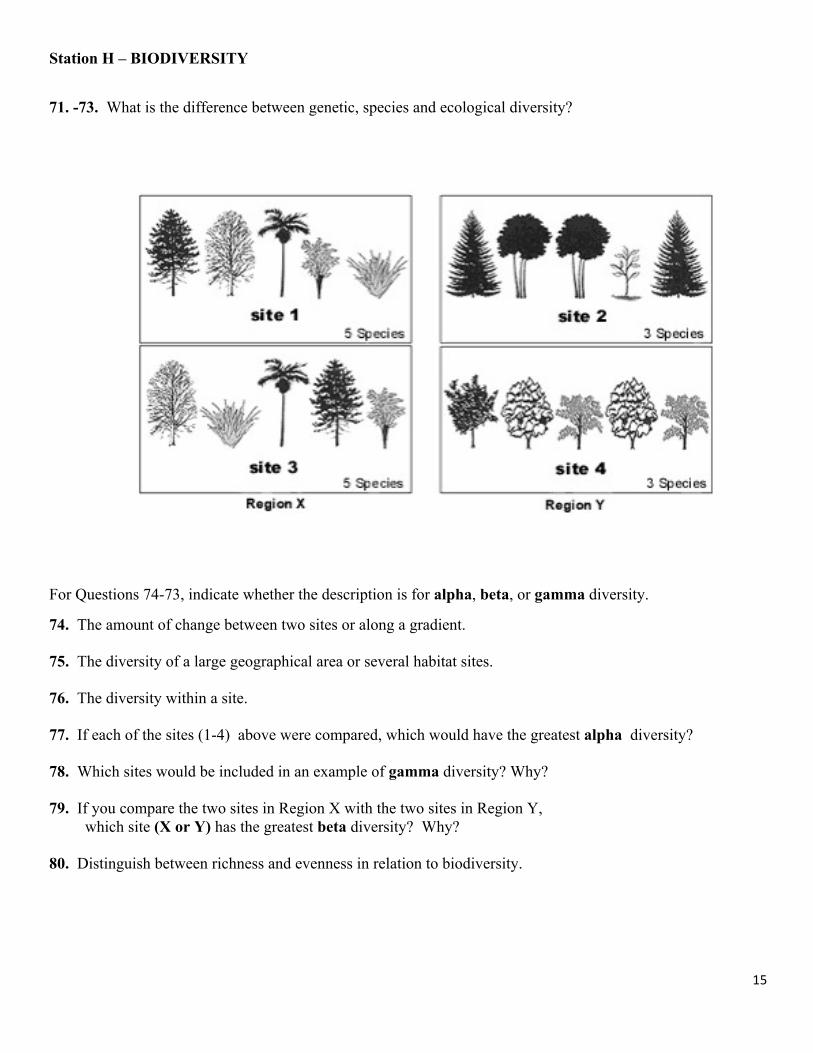
Station H – BIODIVERSITY
71. -73. What is the difference between genetic, species and ecological diversity?
For Questions 74-73, indicate whether the description is for alpha, beta, or gamma diversity.
74. The amount of change between two sites or along a gradient. 75. The diversity of a large geographical area or several habitat sites. 76. The diversity within a site. 77. If each of the sites (1-4) above were compared, which would have the greatest alpha diversity? 78. Which sites would be included in an example of gamma diversity? Why? 79. If you compare the two sites in Region X with the two sites in Region Y,
which site (X or Y) has the greatest beta diversity? Why?
80. Distinguish between richness and evenness in relation to biodiversity.
16
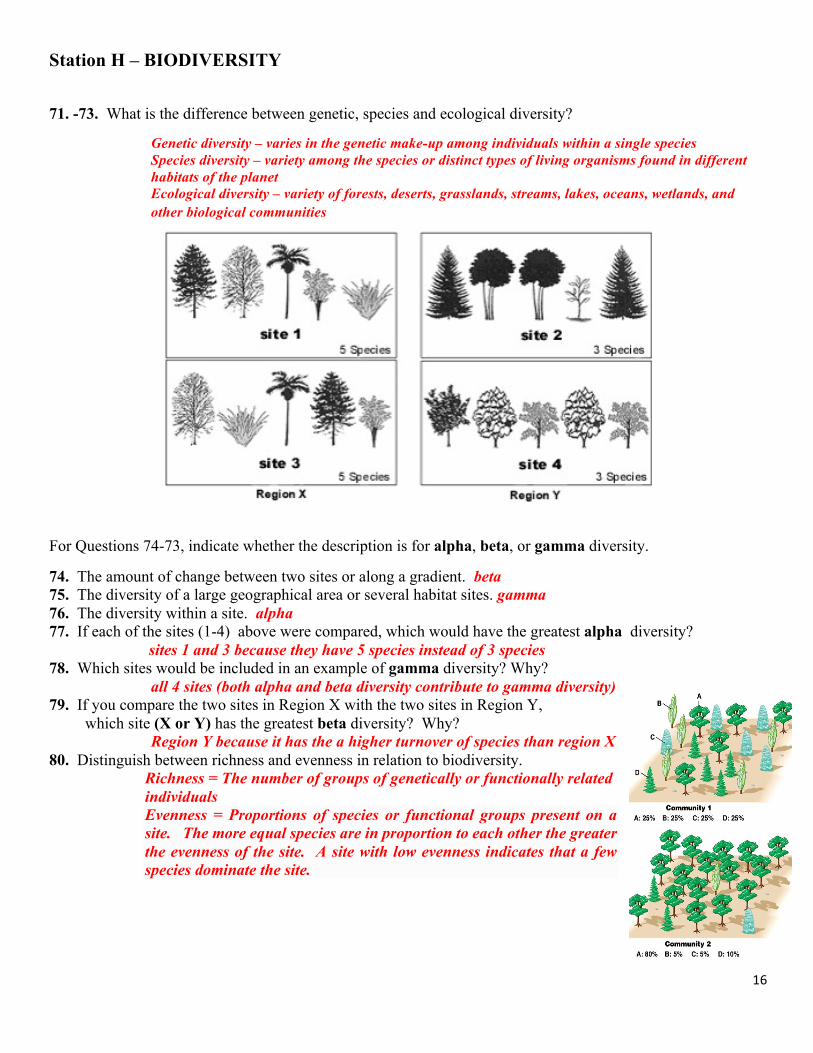
Station H – BIODIVERSITY
71. -73. What is the difference between genetic, species and ecological diversity?
Genetic diversity – varies in the genetic make-up among individuals within a single species Species diversity – variety among the species or distinct types of living organisms found in different habitats of the planet Ecological diversity – variety of forests, deserts, grasslands, streams, lakes, oceans, wetlands, and other biological communities
For Questions 74-73, indicate whether the description is for alpha, beta, or gamma diversity.
74. The amount of change between two sites or along a gradient. beta 75. The diversity of a large geographical area or several habitat sites. gamma 76. The diversity within a site. alpha 77. If each of the sites (1-4) above were compared, which would have the greatest alpha diversity?
sites 1 and 3 because they have 5 species instead of 3 species 78. Which sites would be included in an example of gamma diversity? Why?
all 4 sites (both alpha and beta diversity contribute to gamma diversity) 79. If you compare the two sites in Region X with the two sites in Region Y,
which site (X or Y) has the greatest beta diversity? Why? Region Y because it has the a higher turnover of species than region X
80. Distinguish between richness and evenness in relation to biodiversity. Richness = The number of groups of genetically or functionally related individuals Evenness = Proportions of species or functional groups present on a site. The more equal species are in proportion to each other the greater the evenness of the site. A site with low evenness indicates that a few species dominate the site.
17
PART 3 – HUMAN IMPACTS ON TERRESTRIAL ENVIRONMENTS STATION I: ENVIRONMENTAL CONCERNS
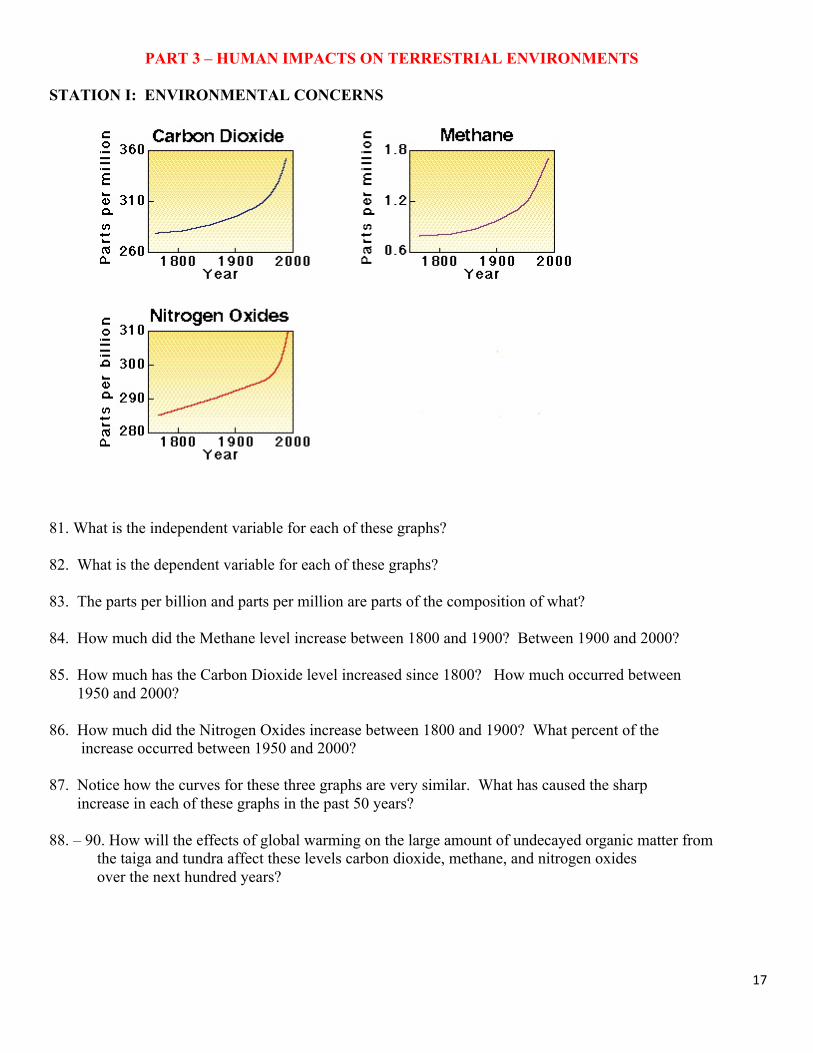
81. What is the independent variable for each of these graphs? 82. What is the dependent variable for each of these graphs? 83. The parts per billion and parts per million are parts of the composition of what? 84. How much did the Methane level increase between 1800 and 1900? Between 1900 and 2000? 85. How much has the Carbon Dioxide level increased since 1800? How much occurred between 1950 and 2000? 86. How much did the Nitrogen Oxides increase between 1800 and 1900? What percent of the increase occurred between 1950 and 2000? 87. Notice how the curves for these three graphs are very similar. What has caused the sharp increase in each of these graphs in the past 50 years? 88. – 90. How will the effects of global warming on the large amount of undecayed organic matter from the taiga and tundra affect these levels carbon dioxide, methane, and nitrogen oxides over the next hundred years?

18
PART 3 – HUMAN IMPACTS ON TERRESTRIAL ENVIRONMENTS STATION I: ENVIRONMENTAL CONCERNS
81. What is the independent variable for each of these graphs? year 82. What is the dependent variable for each of these graphs? parts per million or parts per billion 83. The parts per billion and parts per million are parts of the composition of what? air 84. How much did the Methane level increase between 1800 and 1900? Between 1900 and 2000? ~ 0.2 ppm ~ 1.0 ppm 85. How much has the Carbon Dioxide level increased since 1800? How much occurred between 1950 and 2000? ~ 80 ppm ~ 50 ppm (over half of increase) 86. How much did the Nitrogen Oxides increase between 1800 and 1900? What percent of the increase occurred between 1950 and 2000? ~ 25 ppb ~ 60 % in the last 50 years 87. Notice how the curves for these three graphs are very similar. What has caused the sharp increase in each of these graphs in the past 50 years? air pollution 88. – 90. How will the effects of global warming on the large amount of undecayed organic matter from the taiga and tundra affect these levels carbon dioxide, methane, and nitrogen oxides over the next hundred years? It could continue to sharply increase

19
STATION J: ECOLOGICAL IMPACTS 91. -92. Despite being a desert, when it does rain, deserts are prone to flooding?
93. By late summer, the dense grasslands in California are often so dry that they catch fire. Which of the following is a result of wildfires?
a. helps clear out old vegetation b. adds nutrients to the soil c. enables the seeds of many species to germinate d. all of the above
94.-96. Which of the following are true about grasslands? Choose all that apply
a. They can support a high density of grazing animals b. There are more high trophic level predators than mid-level c. Grasses are wind-pollinated plants d. They lack shelter from predators e. Autotrophs cannot survive because of all the grass f. Dominant vertebrates are herbivorous grazers called ungulates
97. What of the following are main ways humans interact with the grassland biome? Choose all that apply
a. Habitation b. Farming and agriculture c. Raising grazing animals d. None of the above Use the following information to answer the following questions
Organisms A, B, C, D, are counted in three different areas, and the results appear below.
Area # A # B #C # D 1 17 6 1 2 2 15 8 9 1 3 8 9 15 9
Total 40 23 25 12 98. What percent of organisms in area 2 are Type A? 99. What percent of the total organisms are Type C? 100. Which area has the greatest biodiversity?

20
STATION J: ECOLOGICAL IMPACTS
91. – 92. Despite being a desert, when it does rain, deserts are prone to flooding? The extremely dry soil does not absorb sudden heavy rainfall quickly. 93. . By late summer, the dense grasslands in California are often so dry that they catch fire. Which of the
following is a result of wildfires?
a. helps clear out old vegetation b. adds nutrients to the soil c. enables the seeds of many species to germinate d. all of the above
94.-96. Which of the following are true about grasslands? Choose all that apply
a. They can support a high density of grazing animals b. There are more high trophic level predators than mid-level c. Grasses are wind-pollinated plants d. They lack shelter from predators e. Autotrophs cannot survive because of all the grass f. Dominant vertebrates are herbivorous grazers called ungulates
97. What of the following are main ways humans interact with the grassland biome? Choose all that apply
a. Habitation b. Farming and agriculture c. Raising grazing animals d. None of the above Use the following information to answer the following questions
Organisms A, B, C, D, are counted in three different areas, and the results appear below.
Area # A # B #C # D 1 17 6 1 2 2 15 8 9 1 3 8 9 15 9
Total 40 23 25 12 98. What percent of organisms in area 2 are Type A? (15/33 about 45%) 99. What percent of the total organisms are Type C? (25/100= 25%) 100. Which area has the greatest biodiversity? (3)

21
STATION K: DESERTIFICATION
101. – 103. What are the primary causes of Desertification?
104- – 107. What are the harmful effects of desertification?
108.-110. What strategies can be used to prevent desertification?
22
STATION K: DESERTIFICATION
101.-103. What are the primary causes of Desertification?
• Overgrazing: Animal grazing is a huge problem for many areas that are starting to become desert biomes. If there are too many animals that are overgrazing in certain spots, it makes it difficult for the plants to grow back, which hurts the biome and makes it lose its former green glory.
• Deforestation: When people are looking to move into an area, or they need trees in order to make houses and do other tasks, then they are contributing to the problems related to desertification. Without the plants (especially the trees) around, the rest of the biome cannot thrive.
• Farming Practices: Some farmers do not know how to use the land effectively. They may essentially strip the land of everything that it has before moving on to another plot of land. By stripping the soil of its nutrients, desertification becomes more and more of a reality for the area that is being used for farming.
• Urbanization and other types of land development. As mentioned above, development can cause people to go through and kill the plant life. It can also cause issues with the soil due to chemicals and other things that may harm the ground. As areas become more urbanized, there are less places for plants to grow, thus causing desertification.
• Climate Change: Climate change plays a huge role in desertification. As the days get warmer and periods of drought become more frequent, desertification becomes more and more eminent. Unless climate change is slowed down, huge areas of land will become desert; some of those areas may even become uninhabitable as time goes on.
• Stripping the land of resources. If an area of land has natural resources like natural gas, oil, or minerals, people will come in and mine it or take it out. This usually strips the soil of nutrients, which in turn kills the plant life, which in turn starts the process toward becoming a desert biome as time goes on.
• Natural Disasters: There are some cases where the land gets damaged because of natural disasters, including drought. In those cases, there isn’t a lot that people can do except work to try and help rehabilitate the land after it has already been damaged by nature.
104 – 107. What are the harmful effects of desertification?
• Farming becomes next to impossible. If an area becomes a desert, then it’s almost impossible to grow substantial crops there without special technologies. This can cost a lot of money to try and do, so many farmers will have to sell their land and leave the desert areas.
• Hunger: Without farms in these areas, the food that those farms produce will become much scarcer, and the people who live in those local areas will be a lot more likely to try and deal with hunger problems. Animals will also go hungry, which will cause even more of a food shortage.
• Flooding: Without the plant life in an area, flooding is a lot more eminent. Not all deserts are dry; those that are wet could experience a lot of flooding because there is nothing to stop the water from gathering and going all over the place. Flooding can also negatively affect the water supply, which we will discuss next.
• Poor Water Quality: If an area becomes a desert, the water quality is going to become a lot worse than it would have been otherwise. This is because the plant life plays a significant role in keeping the water clean and clear; without its presence, it becomes a lot more difficult for you to be able to do that.
• Overpopulation: When areas start to become desert, animals and people will go to other areas where they can actually thrive. This causes crowding and overpopulation, which will, in the long run, end up continuing the cycle of desertification that started this whole thing anyway.
• Poverty: All of the issues that we’ve talked about above (related to the problem of desertification) can lead to poverty if it is not kept in check. Without food and water, it becomes harder for people to thrive, and they take a lot of time to try and get the things that they need.
23
108.-110. What strategies can be used to prevent desertification?
• Policy Changes Related to How People can Farm. In countries where policy change will actually be enforced on those in the country, policy change related to how often people can farm and how much they can farm on certain areas could be put into place to help reduce the problems that are often associated with farming and desertification.
• Policy Changes to Other Types of Land Use. If people are using land to get natural resources or they are developing it for people to live on, then the policies that govern them should be ones that will help the land to thrive instead of allowing them to harm the land further. The policy changes could be sweeping or they could be depending on the type of land use at hand.
• Education: In developing countries, education is an incredibly important tool that needs to be utilized in order to help people to understand the best way to use the land that they are farming on. By educating them on sustainable practices, more land will be saved from becoming desert.
• Technology Advances. In some cases, it’s difficult to try and prevent desertification from happening. In those cases, there needs to be research and advancements in technology that push the limits of what we currently know. Advancements could help us find more ways to prevent the issue from becoming epidemic.
• Putting Together Rehabilitation Efforts. There are some ways that we can go back and rehabilitate the land that we’ve already pushed into desertification; it just takes some investment of time and money. By putting these together, we can prevent the issue from becoming even more widespread in the areas that have already been affected.
• Sustainable practices to prevent desertification from happening. There are plenty of sustainable practices that can be applied to those acts that may be causing desertification.