2018 taulbee survey undergrad enrollment continues upward ... · doctoral enrollment rises by...
TRANSCRIPT

cra.org/crn3 May 2019
2018 Taulbee SurveyUndergrad Enrollment Continues Upward; Doctoral Degree Production Declines but Doctoral Enrollment Rises
By Stuart Zweben and Betsy Bizot
This article and the accompanying figures and tables present the results from the 48th annual CRA Taulbee Survey1. The survey, conducted annually by the Computing Research Association, documents trends in student enrollment, degree production, employment of graduates, and faculty salaries in academic units in the United States and Canada that grant the Ph.D. in computer science (CS), computer engineering (CE), or information (I)2. Most of these academic units are departments, but some are colleges or schools of information or computing. In this report, we will use the term “department” to refer to the unit offering the program.
CRA gathers survey data during the fall. Responses received by
February 14, 2019 are included in the analysis. The period covered
by the data varies from table to table. Degree production and
enrollment (Ph.D., Master’s, and Bachelor’s) refer to the previous
academic year (2017-18). Data for new students in all categories
refer to the current academic year (2018-19). Projected student
production and information on faculty salaries are also for the
current academic year; salaries are those effective January 1, 2019.
We surveyed a total of 283 Ph.D.-granting departments and
received responses from 174, for an overall response rate of 61
percent. This is lower than last year’s 181 respondents and 64
percent response rate. One contributing factor to the lower
response rate may be the additional questions about department
profiles that are only asked every three years, along with some
new questions to learn more about enrollment responses and
the use of teaching faculty. The response rates from CE and
Canadian departments in particular continue to be low. The U.S.
CS response rate of 73 percent is, as usual, the highest of all
of the categories, although it also dropped from last year’s 77
percent. Figure 1 shows the history of the survey’s response
rates. Response rates are inexact because some departments
provide only partial data, and some institutions provide a single
joint response for multiple departments. Thus, in some tables the
number of departments shown as reporting will not equal the
overall total number of respondents shown in Figure 1 for that
category of department.
To account for the changes in response rate, we will
comment not only on aggregate totals but also on averages
per department reporting or data from those departments
that responded to both 2017 and 2018 surveys. This is a more
meaningful indication of the one-year changes affecting the data.
Departments that responded to the survey were sent preliminary
results about faculty salaries in December 2018; these results
included additional distributional information not contained in
this report. The CRA Board views this as a benefit of participating
in the survey.
Degree, enrollment, and faculty salary data for the U.S CS
departments are stratified according to: a) whether the institution
is public or private; and b) the tenure-track faculty size of the
reporting department. The faculty size strata deliberately overlap,
so that data from most departments affect multiple strata. This
may be especially useful to departments near the boundary
of one stratum. Salary data is also stratified according to the
population of the locale in which the institution is located.3
These stratifications allow our readers to see multiple views of
important data, and hopefully gain new insights from them. In
addition to tabular presentations of data, we will use “box and
whisker” diagrams to show medians, quartiles, and the range
between the 10th and 90th percentile data points.
This year’s survey includes for the first time data about the
existence of online and hybrid master’s programs, and about the
size of startup packages for new assistant professors. We also
obtained more fine-grained information about teaching faculty
and about the previous position held by new faculty hires. This
year’s survey also included questions asked only every three
years, about such matters as teaching loads, space, support
staff, recruitment incentives and reasons for salary differential
among grad students, and sources of external research funding.

cra.org/crn4 May 2019
2018 Taulbee Survey (continued)
We took advantage of this extra section to also include a few
questions about the manner that departments are responding
to the undergraduate enrollment surge, to see if there are any
noticeable changes from three years ago. We will comment on
the results of one of these enrollment surge questions in this
report; a supplementary report with more complete results will
be published in the June issue of Computing Research News.
We thank all of the respondents to this year’s questionnaire.
The participating departments are listed at the end of this
article. CRA member respondents will again be given the
opportunity to obtain certain survey information for a self-
selected peer group. Instructions for doing this will be emailed
to all such departments.
Figure 1. Number of Respondents to the Taulbee Survey
Year US CS Depts. US CE Depts. Canadian US Information Total
1995 110/133 (83%) 9/13 (69%) 11/16 (69%) 130/162 (80%)
1996 98/131 (75%) 8/13 (62%) 9/16 (56%) 115/160 (72%)
1997 111/133 (83%) 6/13 (46%) 13/17 (76%) 130/163 (80%)
1998 122/145 (84%) 7/19 (37%) 12/18 (67%) 141/182 (77%)
1999 132/156 (85%) 5/24 (21%) 19/23 (83%) 156/203 (77%)
2000 148/163 (91%) 6/28 (21%) 19/23 (83%) 173/214 (81%)
2001 142/164 (87%) 8/28 (29%) 23/23 (100%) 173/215 (80%)
2002 150/170 (88%) 10/28 (36%) 22/27 (82%) 182/225 (80%)
2003 148/170 (87%) 6/28 (21%) 19/27 (70%) 173/225 (77%)
2004 158/172 (92%) 10/30 (33%) 21/27 (78%) 189/229 (83%)
2005 156/174 (90%) 10/31 (32%) 22/27 (81%) 188/232 (81%)
2006 156/175 (89%) 12/33 (36%) 20/28 (71%) 188/235 (80%)
2007 155/176 (88%) 10/30 (33%) 21/28 (75%) 186/234 (79%)
2008 151/181 (83%) 12/32 (38%) 20/30 (67%) 9/19 (47%) 192/264 (73%)
2009 147/184 (80%) 13/31 (42%) 16/30 (53.3%) 12/20 (60%) 188/265 (71%)
2010 150/184 (82%) 12/30 (40%) 18/29 (62%) 15/22 (68%) 195/265 (74%)
2011 142/185 (77%) 13/31 (42%) 13/30 (43%) 16/21 (76%) 184/267 (69%)
2012 152/189 (80%) 11/32 (34%) 14/30 (47%) 16/26 (62%) 193/277 (70%)
2013 144/188 (77%) 10/30 (33%) 14/26 (54%) 11/22 (50%) 179/266 (67%)
2014 143/188 (76%) 13/31 (42%) 12/26 (46%) 13/19 (68%) 181/268 (68%)
2015 146/190 (77%) 8/32 (25%) 12/26 (46%) 12/18 (67%) 178/266 (67%)
2016 150/188 (80%) 8/33 (24%) 11/26 (42%) 14/21 (67%) 183/268 (68%)
2017 148/192 (77%) 8/35 (23%) 11/30 (37%) 14/24 (58%) 181/281 (64%)
2018 143/195 (73%) 5/34 (15%) 12/30 (40%) 14/24 (58%) 174/283 (61%)
cra.org/crn5 May 2019
2018 Taulbee Survey (continued)
Doctoral Degree Production, Enrollment, and Employment(Tables 1, D1-D10; Figures D1-D6)
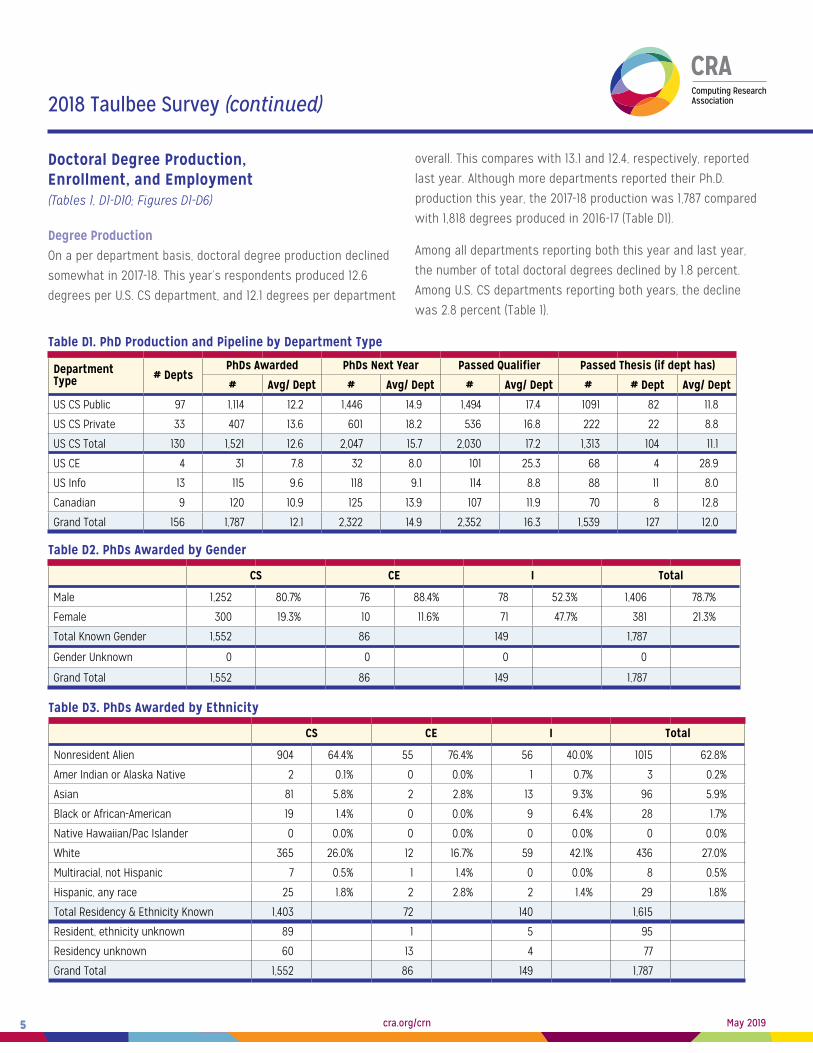
Degree ProductionOn a per department basis, doctoral degree production declined
somewhat in 2017-18. This year’s respondents produced 12.6
degrees per U.S. CS department, and 12.1 degrees per department
overall. This compares with 13.1 and 12.4, respectively, reported
last year. Although more departments reported their Ph.D.
production this year, the 2017-18 production was 1,787 compared
with 1,818 degrees produced in 2016-17 (Table D1).
Among all departments reporting both this year and last year,
the number of total doctoral degrees declined by 1.8 percent.
Among U.S. CS departments reporting both years, the decline
was 2.8 percent (Table 1).
Table D1. PhD Production and Pipeline by Department Type
Department Type # Depts
PhDs Awarded PhDs Next Year Passed Qualifier Passed Thesis (if dept has)
# Avg/ Dept # Avg/ Dept # Avg/ Dept # # Dept Avg/ Dept
US CS Public 97 1,114 12.2 1,446 14.9 1,494 17.4 1091 82 11.8
US CS Private 33 407 13.6 601 18.2 536 16.8 222 22 8.8
US CS Total 130 1,521 12.6 2,047 15.7 2,030 17.2 1,313 104 11.1
US CE 4 31 7.8 32 8.0 101 25.3 68 4 28.9
US Info 13 115 9.6 118 9.1 114 8.8 88 11 8.0
Canadian 9 120 10.9 125 13.9 107 11.9 70 8 12.8
Grand Total 156 1,787 12.1 2,322 14.9 2,352 16.3 1,539 127 12.0
Table D2. PhDs Awarded by Gender
CS CE I Total
Male 1,252 80.7% 76 88.4% 78 52.3% 1,406 78.7%
Female 300 19.3% 10 11.6% 71 47.7% 381 21.3%
Total Known Gender 1,552 86 149 1,787
Gender Unknown 0 0 0 0
Grand Total 1,552 86 149 1,787
Table D3. PhDs Awarded by Ethnicity
CS CE I Total
Nonresident Alien 904 64.4% 55 76.4% 56 40.0% 1015 62.8%
Amer Indian or Alaska Native 2 0.1% 0 0.0% 1 0.7% 3 0.2%
Asian 81 5.8% 2 2.8% 13 9.3% 96 5.9%
Black or African-American 19 1.4% 0 0.0% 9 6.4% 28 1.7%
Native Hawaiian/Pac Islander 0 0.0% 0 0.0% 0 0.0% 0 0.0%
White 365 26.0% 12 16.7% 59 42.1% 436 27.0%
Multiracial, not Hispanic 7 0.5% 1 1.4% 0 0.0% 8 0.5%
Hispanic, any race 25 1.8% 2 2.8% 2 1.4% 29 1.8%
Total Residency & Ethnicity Known 1,403 72 140 1,615
Resident, ethnicity unknown 89 1 5 95
Residency unknown 60 13 4 77
Grand Total 1,552 86 149 1,787

cra.org/crn6 May 2019
2018 Taulbee Survey (continued)
Table D4. Employment of New PhD Recipients By Specialty
Artif
icia
l Int
ellig
ence
/ Mac
hine
Lea
rnin
g
Com
puti
ng E
duca
tion
Data
base
s / I
nfor
mat
ion
Retr
ieva
l
Grap
hics
/Vis
ualiz
atio
n
Hard
war
e/Ar
chit
ectu
re
High
-Per
form
ance
Com
puti
ng
Hum
an-C
ompu
ter I
nter
acti
on
Info
rmat
ics:
Bio
med
ical
/ Oth
er S
cien
ce
Info
rmat
ion
Scie
nce
Info
rmat
ion
Syst
ems
Netw
orks
Oper
atin
g Sy
stem
s
Prog
ram
min
g La
ngua
ges/
Com
pile
rs
Robo
tics
/Vis
ion
Scie
ntifi
c/ N
umer
ical
Com
puti
ng
Secu
rity
/ Inf
orm
atio
n As
sura
nce
Soci
al C
ompu
ting
/ Soc
ial I
nfor
mat
ics
Soft
war
e En
gine
erin
g
Theo
ry a
nd A
lgor
ithm
s
Othe
r
Unkn
own
Tota
l
North American PhD Granting Depts.
Tenure-track 22 4 5 3 6 4 17 3 6 1 8 5 4 4 1 14 6 7 7 4 2 133 9.9%
Researcher 7 1 1 5 1 2 2 4 3 0 1 0 1 3 1 6 1 1 5 0 1 46 3.4%
Postdoc 36 0 7 4 5 0 3 10 6 0 6 4 5 12 2 9 5 5 24 12 5 160 11.9%
Teaching Faculty 5 7 6 2 1 2 3 1 3 1 2 0 5 2 1 3 1 5 3 2 1 56 4.2%
North American, Other Academic
Other CS/CE/I Dept. 2 0 2 0 0 2 3 2 0 0 1 0 0 1 0 0 1 2 1 0 0 17 1.3%
Non-CS/CE/I Dept 1 0 0 0 0 2 0 0 1 0 0 0 0 0 0 2 0 0 0 0 1 7 0.5%
North American, Non-Academic
Industry 162 2 54 55 19 26 22 17 15 10 59 35 17 37 7 54 9 75 30 37 24 766 57.0%
Government 3 0 0 0 1 3 1 2 4 2 2 0 0 2 2 3 0 0 0 2 2 29 2.2%
Self-Employed 2 0 1 2 0 0 0 1 0 0 2 0 1 1 0 1 0 0 0 0 0 11 0.8%
Unemployed 1 0 1 0 0 0 0 0 1 0 0 0 0 0 0 1 0 0 0 0 1 5 0.4%
Other 1 0 1 0 0 0 0 0 1 2 0 0 1 1 1 0 0 1 2 2 1 14 1.0%
Total Inside North America
242 14 78 71 33 41 51 40 40 16 81 44 34 63 15 93 23 96 72 59 38 1,244 92.6%
Outside North America
Ten-Track in PhD 5 0 3 0 1 0 1 1 2 0 3 2 1 0 0 2 0 2 1 3 0 27 2.0%
Researcher in PhD 0 0 1 1 0 0 0 0 0 0 0 0 0 1 0 1 0 0 1 1 0 6 0.4%
Postdoc in PhD 4 2 1 0 0 1 1 0 1 0 0 0 0 0 0 2 0 0 1 1 0 14 1.0%
Teaching in PhD 0 0 0 0 2 0 1 0 0 1 2 0 1 0 1 1 1 0 1 0 0 11 0.8%
Other Academic 1 0 0 0 0 0 0 0 0 0 2 0 1 0 0 0 0 0 1 0 0 5 0.4%
Industry 5 0 2 1 0 0 0 1 1 0 0 2 1 2 0 4 0 2 2 3 0 26 1.9%
Government 2 0 0 0 0 0 0 0 0 0 0 0 0 0 0 2 0 0 0 0 1 5 0.4%
Self-Employed 2 0 0 0 0 0 0 0 1 0 0 0 0 1 0 0 0 0 0 0 0 4 0.3%
Unemployed 0 0 0 0 0 0 0 0 0 0 0 0 0 0 0 0 0 0 0 0 0 0 0.0%
Other 0 0 0 0 0 0 0 0 0 0 0 0 0 0 0 1 0 0 1 0 0 2 0.1%
Total Outside NA 19 2 7 2 3 1 3 2 5 1 7 4 4 4 1 13 1 4 8 8 1 100 7.4%
Total with Employment Data, Inside North America plus Outside North America
261 16 85 73 36 42 54 42 45 17 88 48 38 67 16 106 24 100 80 67 39 1,344
Employment Type & Location Unknown
36 0 7 18 20 5 18 10 10 6 31 4 7 7 2 8 2 26 9 206 11 443
Grand Total 297 16 92 91 56 47 72 52 55 23 119 52 45 74 18 114 26 126 89 273 50 1,787

cra.org/crn7 May 2019
2018 Taulbee Survey (continued)
Table D4a. Detail of Industry Employment
Artif
icia
l Int
ellig
ence
/ Mac
hine
Lea
rnin
g
Com
puti
ng E
duca
tion
Data
base
s/In
form
atio
n Re
trie
val
Grap
hics
/Vis
ualiz
atio
n
Hard
war
e/Ar
chit
ectu
re
High
Per
form
ance
Com
puti
ng
Hum
an-C
ompu
ter I
nter
acti
on
Info
rmat
ics:
Bio
med
ical
/Oth
er S
cien
ce
Info
rmat
ion
Scie
nce
Info
rmat
ion
Syst
ems
Netw
orks
Oper
atin
g Sy
stem
s
Prog
ram
min
g La
ngua
ges/
Com
pile
rs
Robo
tics
/Vis
ion
Scie
ntifi
c/Nu
mer
ical
Com
puti
ng
Secu
rity
/ Inf
orm
atio
n As
sura
nce
Soci
al C
ompu
ting
/Soc
ial I
nfor
mat
ics
Soft
war
e En
gine
erin
g
Theo
ry a
nd A
lgor
ithm
s
Othe
r
Unkn
own
Tota
l
Inside North America
Research 107 1 32 37 12 11 18 9 10 5 30 22 6 20 6 27 2 35 19 24 14 447 58.4%
Non-Research 41 1 17 15 5 12 3 7 4 3 23 13 10 13 1 20 5 36 5 4 7 245 32.0%
Postdoctorate 5 0 0 1 2 1 1 1 0 0 0 0 0 3 0 0 0 0 1 1 0 16 2.1%
Type Not Specified 9 0 5 2 0 2 0 0 1 2 6 0 1 1 0 7 2 4 5 8 3 58 7.6%
Total Inside NA 162 2 54 55 19 26 22 17 15 10 59 35 17 37 7 54 9 75 30 37 24 766
Outside North America
Research 4 0 1 0 0 0 0 1 1 0 0 1 0 2 0 3 0 0 1 2 0 16 61.5%
Non-Research 1 0 1 1 0 0 0 0 0 0 0 0 1 0 0 1 0 2 1 1 0 9 34.6%
Postdoctorate 0 0 0 0 0 0 0 0 0 0 0 0 0 0 0 0 0 0 0 0 0 0 0.0%
Type Not Specified 0 0 0 0 0 0 0 0 0 0 0 1 0 0 0 0 0 0 0 0 0 1 3.8%
Total Outside NA 5 0 2 1 0 0 0 1 1 0 0 2 1 2 0 4 0 2 2 3 0 26
Table D5. New PhD Students by Department Type
CS CE I Total
Department Type
New Admit
MS to
PhDTotal
Avg. per
Dept.New
AdmitMS to PhD Total
Avg. per
Dept.New
AdmitMS to PhD Total
Avg. per
Dept.Total
Avg. per
Dept
US CS Public 2,064 160 2,224 22.5 132 4 136 8.0 67 7 74 10.6 2,434 24.3
US CS Private 845 98 943 28.6 9 1 10 2.5 7 1 8 8.0 961 29.1
US CS Total 2,909 258 3,167 24.0 141 5 146 7.0 74 8 82 10.3 3,395 25.5
US CE 0 0 0 46 5 51 12.8 0 0 0 51 12.8
US Information 15 0 15 7.5 0 0 0 127 9 136 9.7 151 10.8
Canadian 151 16 167 15.2 5 0 5 5.0 0 0 0 172 15.6
Grand Total 3,075 274 3,349 23.1 192 10 202 7.8 201 17 218 9.9 3,769 23.3

cra.org/crn8 May 2019
2018 Taulbee Survey (continued)
Table D5a. New PhD Students from Outside North America
Department Type CS CE I Total New
Outside Total New% outside
North America
US CS Public 1,347 101 20 1,468 2,434 60.3%
US CS Private 533 7 9 549 961 57.1%
Total US CS 1,880 108 29 2,017 3,395 59.4%
US CE 29 29 51 56.9%
US Info 11 0 84 95 151 62.9%
Canadian 79 5 0 84 172 48.8%
Grand Total 1,970 142 113 2,225 3,769 59.0%
Table D6. PhD Enrollment by Department Type
Department Type # Depts CS CE I Total
US CS Public 104 10,075 68.4% 700 54.9% 373 33.5% 11,148 65.2%
US CS Private 35 3,727 25.3% 77 6.0% 40 3.6% 3,844 22.5%
Total US CS 139 13,802 93.8% 777 60.9% 413 37.1% 14,992 87.6%
US CE 5 0.0% 487 38.2% 0.0% 487 2.8%
US Info 14 110 0.7% 0.0% 673 60.5% 783 4.6%
Canadian 11 809 5.5% 12 0.9% 27 2.4% 848 5.0%
Grand Total 169 14,721 1,276 1,113 17,110
Table D7. PhD Enrollment by Gender
CS CE I Total
Male 11,180 77.7% 1,015 80.7% 639 57.5% 12,834 76.6%
Female 3,212 22.3% 242 19.3% 472 42.5% 3,926 23.4%
Total Known Gender
14,392 1,257 1,111 16,760
Gender Unknown 329 19 2 350
Grand Total 14,721 1,276 1,113 17,110
Table D8. PhD Enrollment by Ethnicity
CS CE I Total
Nonresident Alien 8,588 63.2% 789 66.2% 530 50.5% 9,907 62.6%
Amer Indian or Alaska Native 69 0.5% 0 0.0% 1 0.1% 70 0.4%
Asian 991 7.3% 135 11.3% 68 6.5% 1194 7.5%
Black or African-American 198 1.5% 23 1.9% 47 4.5% 268 1.7%
Native Hawaiian/Pac Islander 19 0.1% 2 0.2% 1 0.1% 22 0.1%
White 3,057 22.5% 206 17.3% 359 34.2% 3,622 22.9%
Multiracial, not Hispanic 404 3.0% 13 1.1% 16 1.5% 433 2.7%
Hispanic, any race 265 1.9% 24 2.0% 27 2.6% 316 2.0%
Total Known 13,591 1,192 1,049 15,832
Resident, ethnicity unknown 434 68 18 520
Residency unknown 696 16 46 758
Grand Total 14,721 1,276 1,113 17,110

cra.org/crn9 May 2019
2018 Taulbee Survey (continued)
Table D9. PhDs Awarded by Gender and Ethnicity, From 148 Departments
CS CE I Ethnicity Totals
Male Fem N/R % of M*
% of F* Male Fem N/R % of
M*% of F* Male Fem N/R % of
M*% of F* Total %
Nonresident Alien 726 178 0 64 69 52 3 0 80 43 31 25 0 44 36 1,015 62.8
Amer Indian or Alaska Native 1 1 0 0 0 0 0 0 0 0 0 1 0 0 1 3 0.2
Asian 62 19 0 5 7 1 1 0 2 14 4 9 0 6 13 96 5.9
Black or African-American 11 8 0 1 3 0 0 0 0 0 5 4 0 7 6 28 1.7
Native Hawaiian/ Pac Islander - 0 0 0 0 0 0 0 0 0 0 0 0 0 0 - 0.0
White 316 49 0 28 19 10 2 0 15 29 31 28 0 44 41 436 27.0
Multiracial, not Hispanic 6 1 0 1 0 0 1 0 0 14 0 0 0 0 0 8 0.5
Hispanic, any race 21 4 0 2 2 2 0 0 3 0 0 2 0 0 3 29 1.8Total Res & Ethnicity Known 1,143 260 0 0 0 65 7 0 71 69 0 1,615
Resident, ethnicity unknown 60 29 0 1 0 0 4 1 0 95
Not Reported (N/R) 49 11 0 10 3 0 3 1 0 77
Gender Totals 1,252 300 0 76 10 0 78 71 0 1,787
% 80.7% 19.3% 88.4% 11.6% 52.3% 47.7%
* % of M and % of F columns are the percent of that gender who are of the specified ethnicity, of those whose ethnicity is known
Table D10. PhD Enrollment by Gender and Ethnicity, From 169 Departments
CS CE I Ethnicity Totals
Male Fem N/R % of M*
% of F* Male Fem N/R % of
M*% of F* Male Fem N/R % of
M*% of F* Total %
Nonresident Alien 6,588 1,914 86 63 64 623 158 8 66 70 304 226 0 51 50 9,907 62.6%
Amer Indian or Alaska Native 52 17 0 1 1 0 0 0 0 0 0 1 0 0 0 70 0.4%
Asian 710 256 25 7 9 107 26 2 11 12 36 32 0 6 7 1194 7.5%
Black or African-American 131 66 1 1 2 15 7 1 2 3 18 29 0 3 6 268 1.7%
Native Hawaiian/ Pac Islander 12 7 0 0 0 1 1 0 0 0 1 0 0 0 0 22 0.1%
White 2,425 587 45 23 20 171 29 6 18 13 214 143 2 36 32 3,622 22.9%
Multiracial, not Hispanic 305 95 4 3 3 10 2 1 1 1 11 5 0 2 1 433 2.7%
Hispanic, any race 208 52 5 2 2 21 3 0 2 1 13 14 0 2 3 316 2.0%Total Res & Ethnicity Known 10,431 2,994 166 948 226 597 450 2 15,832
Resident, ethnicity unknown 327 95 12 53 14 10 8 0 520
Not Reported (N/R) 422 123 151 14 2 32 14 0 758
Gender Totals 11,180 3,212 329 1,015 242 639 472 2 17,110
% 77.7% 22.3% 80.7% 19.3% 57.5% 42.5%
* % of M and % of F columns are the percent of that gender who are of the specified ethnicity, of those whose ethnicity is known

cra.org/crn10 May 2019
2018 Taulbee Survey (continued)
Figure D1. PhD Production
CRA Taulbee Survey 2018
For the second year in a row, the percentage of women
among Ph.D. recipients increased. In 2017-18, women received
19.3 percent of CS doctoral degrees and 21.3 percent of all
doctoral computing degrees (Table D2). A greater percentage
of non-resident Aliens comprised 2017-18 Ph.D. recipients in all
three areas (CS, CE and I) compared with 2016-17 recipients.
A smaller percentage of Ph.D.s were Asian and and a larger
percentage were Black/African-American in 2017-18 among CS
recipients, while a smaller percentage were Hispanic and a
larger percentage were White among I recipients (Table D3).
The combined percentage of CS doctoral graduates who were
American Indian or Alaska Native, Black or African American,
Native Hawaiian/Pacific Islander, Hispanic, or Multiracial Non-
Hispanic was only 3.8 percent, though that represents a gain of
about one percentage point over 2016-17.
As we have found in previous years, Non-resident Aliens
comprised a higher percentage of the CS female doctoral
graduates than they did CS male graduates, while Whites
comprised a lower percentage of the female graduates as
compared with male graduates. The percentage differences
are greater for 2017-18 graduates than they were for 2016-17
graduates (Table D9).
Doctoral Program EnrollmentDespite the decline in doctoral degree production, total doctoral
enrollment increased by 7.9 percent among programs that
reported both years. If only U.S. computer science departments
are considered, the increase was 7.7 percent (Table 1). For the
third straight year, total doctoral enrollment by gender is more
diverse in all department areas (CS, CE, and I). The overall fraction
of current doctoral students who are women is 23.5 percent,
versus 22.1 percent last year (Table D7). In CS, women comprise
22.3% of the students currently enrolled. The fraction of doctoral
students who are neither Non-resident Aliens, Asian, nor White
rose to 7 percent from under 5 percent. This is true overall and
also within CS programs (Table D8).
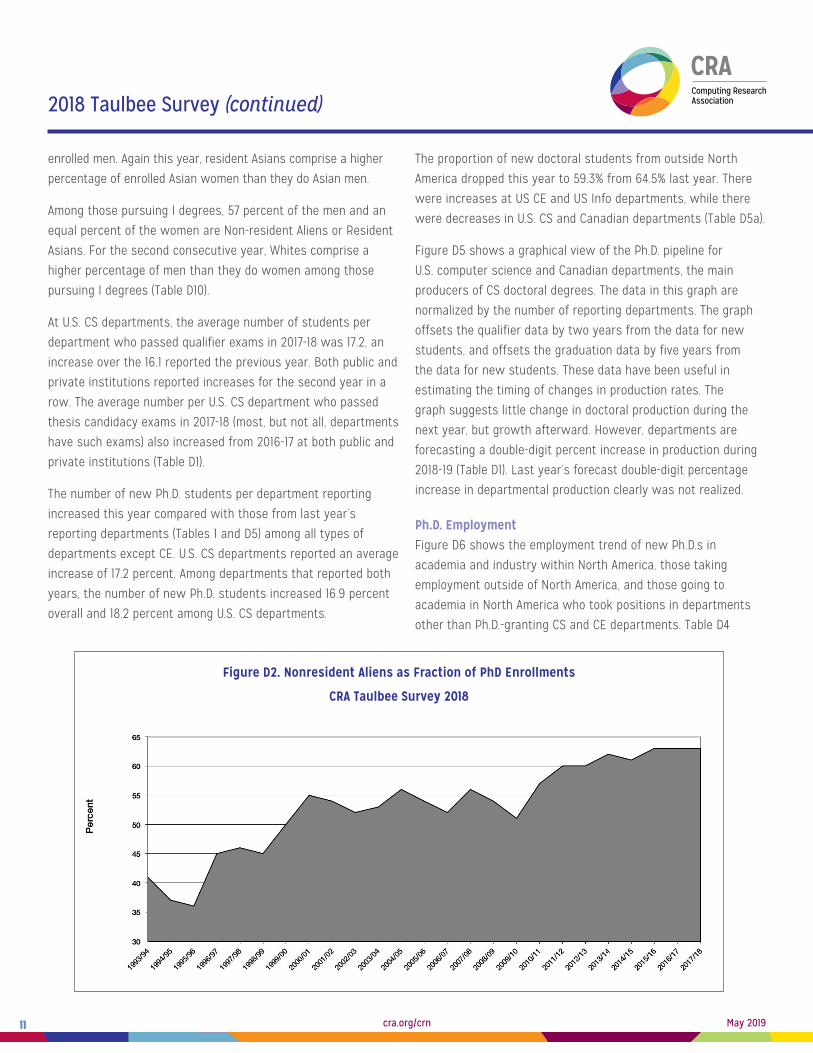
As has been true in previous years, Non-resident Aliens comprise
a higher percentage of the enrolled women than they do the
enrolled men, although only by one percentage point. Whites
continue to comprise a lower percentage of enrolled women than
cra.org/crn11 May 2019
2018 Taulbee Survey (continued)
enrolled men. Again this year, resident Asians comprise a higher
percentage of enrolled Asian women than they do Asian men.
Among those pursuing I degrees, 57 percent of the men and an
equal percent of the women are Non-resident Aliens or Resident
Asians. For the second consecutive year, Whites comprise a
higher percentage of men than they do women among those
pursuing I degrees (Table D10).
At U.S. CS departments, the average number of students per
department who passed qualifier exams in 2017-18 was 17.2, an
increase over the 16.1 reported the previous year. Both public and
private institutions reported increases for the second year in a
row. The average number per U.S. CS department who passed
thesis candidacy exams in 2017-18 (most, but not all, departments
have such exams) also increased from 2016-17 at both public and
private institutions (Table D1).
The number of new Ph.D. students per department reporting
increased this year compared with those from last year’s
reporting departments (Tables 1 and D5) among all types of
departments except CE. U.S. CS departments reported an average
increase of 17.2 percent. Among departments that reported both
years, the number of new Ph.D. students increased 16.9 percent
overall and 18.2 percent among U.S. CS departments.
The proportion of new doctoral students from outside North
America dropped this year to 59.3% from 64.5% last year. There
were increases at US CE and US Info departments, while there
were decreases in U.S. CS and Canadian departments (Table D5a).
Figure D5 shows a graphical view of the Ph.D. pipeline for
U.S. computer science and Canadian departments, the main
producers of CS doctoral degrees. The data in this graph are
normalized by the number of reporting departments. The graph
offsets the qualifier data by two years from the data for new
students, and offsets the graduation data by five years from
the data for new students. These data have been useful in
estimating the timing of changes in production rates. The
graph suggests little change in doctoral production during the
next year, but growth afterward. However, departments are
forecasting a double-digit percent increase in production during
2018-19 (Table D1). Last year’s forecast double-digit percentage
increase in departmental production clearly was not realized.
Ph.D. EmploymentFigure D6 shows the employment trend of new Ph.D.s in
academia and industry within North America, those taking
employment outside of North America, and those going to
academia in North America who took positions in departments
other than Ph.D.-granting CS and CE departments. Table D4
Figure D2. Nonresident Aliens as Fraction of PhD Enrollments
CRA Taulbee Survey 2018

cra.org/crn12 May 2019
2018 Taulbee Survey (continued)
Figure D3. PhD Degrees Granted by Tenure-Track Size
CRA Taulbee Survey 2018
Figure D4. PhD Enrollment Normalized by Tenure-Track Size
CRA Taulbee Survey 2018

cra.org/crn13 May 2019
2018 Taulbee Survey (continued)
shows a more detailed breakdown of the employment data for
new Ph.D.s. The percentage of new Ph.D.s who took positions
in North American industry was 57.0 percent, down from the
59.4 percent reported last year but similar to the level of two
years ago. Among those doctoral graduates who went to North
American industry and for whom the type of industry position
was known, about 63 percent took research positions (Table
D4a). This is higher than the 57 percent reported in 2017. This
year, definitive data was provided for over 92 percent of the
graduates who went to North American industry, an increase
over the 89 percent last year.
After a dip reported last year, the percentage of Ph.D. graduates who
took North American academic jobs rose in 2017-18 to 31.2 from 28.2 in
2016-17. The percentage of graduates taking tenure-track positions in
North American doctoral-granting computing departments rose from
to 9.8 in 2016-17 to 10.7 in 2017-18. The percentage taking positions in
North American non-Ph.D.-granting computing departments dropped
from 2.8 percent in last year’s report to 1.8 percent, while the
percentage taking North American academic postdoctoral positions
rose from 10.7 percent to 11.9 percent.
Among those whose employment is known, the proportion of Ph.D.
graduates who were reported taking positions outside of North
America was 7.4 percent, similar to last year’s reported value. In
2017-18, 26 percent of those employed outside of North America
went to industry. This is similar to the percentage reported in
each of the past two years. Twenty-seven percent went to tenure-
track academic positions, lower than last year’s 30 percent, while
14 percent went to academic postdoctoral positions, lower than
the 18 percent reported last year but near the level of two years
ago. Most of the doctoral graduates who went to non-North
American industry positions take non-research positions. Definitive
data was provided for 96 percent of the graduates who went to
non-North American industry positions.
When academic and industry postdocs are combined, the
result is that 14.8 percent of 2017-18 doctoral graduates whose
employment was known took some type of postdoctoral
position. This is slightly higher than the 13.8 percent reported
last year. As was the case in 2016-17, thirteen percent of these
were industry postdocs.
Figure D5. CS Pipeline corrected for year of entry
CRA Taulbee Survey 2018

cra.org/crn14 May 2019
2018 Taulbee Survey (continued)
Figure D6. Employment Trends for New Ph.D.s
CRA Taulbee Survey 2018
Table 1. Degree Production and Enrollment Change From Previous Year
Total Only Departments Responding Both Years
US CS Only All Departments US CS Only All Departments
PhDs 2017 2018 % chg 2017 2018 % chg 2017 2018 % chg 2017 2018 % chg
PhD Awarded 1,557 1,521 -2.3% 1,834 1,787 -2.6% 1,450 1,409 -2.8% 1,674 1,644 -1.8%
#Units PhD Awd 119 121 1.7% 148 148 0.0% 107 107 131 131
PhD Enrollment 13,856 14,992 8.2% 15,951 17,110 7.3% 13,645 14,696 7.7% 15,312 16,516 7.9%
#Units PhD Enr 135 139 3.0% 166 169 1.8% 132 132 160 160
New PhD Enroll 2,875 3,395 18.1% 3,264 3,769 15.5% 2,828 3,344 18.2% 3,175 3,713 16.9%
#Units New PhD 132 133 0.8% 164 162 -1.2% 126 126 154 154
Bachelor’s 2017 2018 % chg 2017 2018 % chg 2017 2018 % chg 2017 2018 % chg
BS Awarded 24,291 28,698 18.1% 29,587 33,853 14.4% 23,413 28,125 20.1% 28,061 33,162 18.2%
#Units BS Awd 131 130 -0.8% 157 155 -1.3% 125 125 147 147
BS Enrollment 127,739 141,259 10.6% 153,610 163,735 6.6% 117,966 138,359 17.3% 139,168 160,249 15.1%
#Units BS Enr 131 131 0.0% 160 156 -2.5% 126 126 150 150
New BS Majors 30,734 35,245 14.7% 35,902 40,774 13.6% 27,003 33,990 25.9% 31,149 39,141 25.7%
#Units New BS 113 112 -0.9% 138 133 -3.6% 102 102 121 121
BS Enroll/Dept 975.1 1,078.3 10.6% 960 1,050 9.3% 936 1098.1 17.3% 927.8 1068.3 15.1%

cra.org/crn15 May 2019
2018 Taulbee Survey (continued)
Table M3. Master’s Degrees Awarded by Ethnicity
CS CE I Total
Nonresident Alien 8,349 70.0% 476 70.8% 1,240 44.4% 10,065 65.4%
Amer Indian or Alaska Native 7 0.1% 2 0.3% 2 0.1% 11 0.1%
Asian 1,199 10.1% 47 7.0% 300 10.7% 1,546 10.0%
Black or African-American 112 0.9% 9 1.3% 133 4.8% 254 1.6%
Native Hawaiian/Pac Island 2 0.0% 0 0.0% 2 0.1% 4 0.0%
White 1,949 16.3% 100 14.9% 944 33.8% 2,993 19.4%
Multiracial, not Hispanic 72 0.6% 4 0.6% 57 2.0% 133 0.9%
Hispanic, any race 239 2.0% 34 5.1% 116 4.2% 389 2.5%
Total Residency & Ethnicity Known 11,929 672 2,794 15,395
Resident, ethnicity unknown 426 233 184 843
Residency unknown 1,022 9 49 1,080
Grand Total 13,357 914 3,027 17,298
Table M1. Master’s Degrees Awarded by Department Type
Department Type # Depts CS CE I Total
US CS Public 102 7,537 56.4% 419 45.8% 850 28.1% 8,806 50.9%
US CS Private 34 5,283 39.6% 119 13.0% 341 11.3% 5,743 33.2%
Total US CS 136 12,820 96.0% 538 58.9% 1,191 39.3% 14,549 84.1%
US CE 3 0.0% 176 19.3% 0.0% 176 1.0%
US Info 12 55 0.4% 0.0% 1,814 59.9% 1,869 10.8%
Canadian 11 482 3.6% 200 21.9% 22 0.7% 704 4.1%
Grand Total 162 13,357 914 3,027 17,298
Table M2. Master’s Degrees Awarded by Gender
CS CE I Total
Male 9,179 73.5% 658 72.5% 1,538 51.2% 11,375 69.4%
Female 3,312 26.5% 249 27.5% 1,466 48.8% 5,027 30.6%
Total Known Gender 12,491 907 3,004 16,402
Gender Unknown 866 7 23 896
Grand Total 13,357 914 3,027 17,298
Table M4. Master’s Degrees Expected Next Year by Department Type
Department Type
# Depts CS CE I Total
US CS Public 93 7,082 56.1% 382 60.0% 669 21.9% 8,133 49.8%
US CS Private 30 4,993 39.5% 129 20.3% 364 11.9% 5,486 33.6%
US CS Total 123 12,075 95.6% 511 80.2% 1,033 33.8% 13,619 83.4%
US CE 3 0.0% 120 18.8% 0.0% 120 0.7%
US Info 12 38 0.3% 0 0.0% 2,022 66.2% 2,060 12.6%
Canadian 10 522 4.1% 6 0.9% 0 0.0% 528 3.2%
Grand Total 148 12,635 637 3,055 16,327

cra.org/crn16 May 2019
2018 Taulbee Survey (continued)
The unemployment rate for new Ph.D.s again this year
was below 1 percent. However, 24.8 percent of new Ph.D.s’
employment status was unknown; in 2016-17 it was 22.7 percent.
The lack of information about the employment of nearly one in
four graduates may skew the real overall percentages for certain
employment categories.
Table D4 also indicates the areas of specialty of new Ph.D.s.
Artificial intelligence/machine learning, software engineering,
networks, and security/information assurance are the most
popular areas of specialization for doctoral graduates, in
that order. These four areas comprise 37 percent of all the
doctoral degrees produced in 2017-18. There are many Ph.D.s
categorized as “other,” and some whose specialty area is
reported as “unknown”.
Master’s and Bachelor’s Degree Production and Enrollments This section reports data about enrollment and degree production
for master’s and bachelor’s programs in the doctoral-granting
departments. Although the absolute number of degrees and enrolled
students reported herein only reflect departments that offer the
doctoral degree, the trends observed in the master’s and bachelor’s
data from these departments tend to strongly reflect trends in the
larger population of programs that offer such degrees.
Master’s (Tables M1-M8; Figures M1-M2)
On a per department basis, CS master’s degree production in
U.S. CS departments was about 2.5 percent less than in 2016-
17; however, this follows three consecutive years of double-
Table M5. New Master’s Students by Department Type
Department Type
CS CE I Total Outside North America
Total # Depts
Avg. per
Dept.Total #
DeptsAvg. per
Dept.Total #
DeptsAvg. per
Dept.Total #
DeptsAvg. per
Dept.Total %
US CS Public 9,870 98 100.7 412 22 18.7 604 16 37.8 10,886 98 111.1 6,309 58.0%
US CS Private 4,832 32 151.0 21 4 5.3 320 4 80.0 5,173 32 161.7 3,322 64.2%
US CS Total 14,702 130 113.1 433 26 16.7 924 20 46.2 16,059 130 123.5 9,631 60.0%
US CE 0 118 3 39.3 0 118 3 39.3 95 80.5%
US Information 54 2 27.0 0 0 1,782 12 148.5 1,836 12 153.0 738 40.2%
Canadian 776 11 70.5 11 1 11.0 0 0 787 11 71.5 576 73.2%
Grand Total 15,532 143 108.6 562 30 18.7 2,706 32 84.6 18,800 156 120.5 11,040 58.7%
Table M6. Total Master’s Students by Department Type
Department Type
CS CE I Total
Total # Depts
Avg. per
Dept.Total #
DeptsAvg. per
Dept.Total #
DeptsAvg. per
Dept.Total #
DeptsAvg. per
Dept.
US CS Public 22,487 103 218.3 1,236 24 51.5 1,976 18 109.8 25,699 103 249.5
US CS Private 10945 33 331.7 858 6 143.0 1149 4 287.3 12952 34 380.9
US CS Total 33,432 136 245.8 2,094 30 69.8 3,125 22 142.0 38,651 137 282.1
US CE 0 341 3 113.7 0 341 3 113.7
US Information 91 2 45.5 0 4979 12 414.9 5070 12 422.5
Canadian 1569 11 142.6 293 2 146.5 0 1862 11 169.3
Grand Total 35,092 149 235.5 2,728 35 77.9 8,358 32 261.2 45,924 163 281.7

cra.org/crn17 May 2019
2018 Taulbee Survey (continued)
Table M7. Masters Degrees Awarded by Gender and Ethnicity, From 163 Departments
CS CE I Ethnicity Totals
Male Fem N/R % of M*
% of F*
Male Fem N/R % of M*
% of F*
Male Fem N/R % of M*
% of F*
Total %
Nonresident Alien 5,845 2,459 31 68 78 338 136 2 68 80 695 545 0 49 40 10,065 65.4
Amer Indian or Alaska Native
6 0 1 0 0 1 1 0 0 1 0 2 0 0 0 11 0.1
Asian 824 356 19 10 11 34 13 0 7 8 168 132 0 12 10 1546 10.0
Black or African-American
87 19 6 1 1 6 2 1 1 1 60 73 0 4 5 254 1.6
Native Hawaiian/ Pac Islander
2 0 0 0 0 0 0 0 0 0 0 2 0 0 0 4 0.0
White 1,621 286 37 19 9 87 10 3 18 6 418 525 1 29 38 2,993 19.4
Multiracial, not Hispanic
66 4 2 1 0 3 1 0 1 1 25 32 0 2 2 133 0.9
Hispanic, any race 186 32 20 2 1 27 7 0 5 4 59 56 1 4 4 389 2.5
Total Res & Ethnicity Known
8,637 3,156 116 496 170 6 1,425 1,367 2 15,395
Resident, ethnicity unknown
299 78 49 156 77 0 94 90 0 843
Not Reported (N/R) 229 72 701 6 2 1 19 9 21 1080
Gender Totals 9,179 3,312 866 658 249 7 1,538 1,466 23 17,298
% 73.5% 26.5% 72.5% 27.5% 51.2% 48.8%
* % of M and % of F columns are the percent of that gender who are of the specified ethnicity, of those whose ethnicity is known
digit percent increases. There was a 4.5 percent drop among
departments at public institutions and a 3.5 percent increase
among those at private institutions.
Overall master’s degree production per department in the
Information area rose 3.7 percent in 2017-18, while Canadian
production showed a 34 percent increase. Only three CE
departments reported master’s production, so no comparison is
made for this area (Table M1).
The proportion of female graduates among CS master’s degree
recipients rose slightly, from 26.1 percent to 26.5 percent. The CE
and I areas also showed increases in gender diversity, with the I
area now close to parity between men and women. Aggregating
all areas, the percentage of master’s degrees to women
increased from 29.6 to 30.6 percent (Table M2).
In CS, 70.0 percent of master’s degrees went to Non-resident
Aliens, a decrease from the 73.8 percent in 2016-17 and 75.6
percent in 2015-16. Drops in the percentage of Non-resident
Aliens also occurred in the CE and I areas, with the aggregate
percentage over all three areas declining from 69.2 to 65.4
percent. As was the case in last year’s report, the CS decline
in non-resident Alien percentage was countered by gains
among Whites and resident Asians. The percentage of master’s
recipients among American Indian/Alaska Native, Black/African-
American, Native Hawaiian/Pacific Islander, Hispanic, and
Multiracial in CS was approximately 3.6 percent in 2017-18 versus
3.0 percent in 2016-17; the increase occurred largely among
Hispanics. (Table M3).
As has been the case in recent years, Non-resident Aliens
again comprised a much larger proportion of female CS and
CE degree recipients than male CS and CE degree recipients,
while Whites comprised a larger percentage of male CS and CE
degree recipients than female CS and CE degree recipients (Table
M7). In the I area, Non-resident Aliens again comprised a larger
percentage of male master’s graduates than female master’s

cra.org/crn18 May 2019
2018 Taulbee Survey (continued)
Table M8. Masters Enrollment by Gender and Ethnicity, From 163 Departments
CS CE I Ethnicity Totals
Male Fem N/R % of M*
% of F* Male Fem N/R % of
M*% of F* Male Fem N/R % of
M*% of F* Total %
Nonresident Alien 13,774 5,672 213 59 73 815 320 6 67 78 1,770 1,397 0 47 37 23,967 58.8
Amer Indian or Alaska Native
22 4 1 0 0 0 0 0 0 0 3 7 0 0 0 37 0.1
Asian 2708 920 76 12 12 88 24 1 7 6 337 304 0 9 8 4,458 10.9
Black or African-American
453 118 3 2 2 25 4 0 2 1 195 220 0 5 6 1018 2.5
Native Hawaiian/ Pac Islander
12 2 0 0 0 2 0 0 0 0 1 3 0 0 0 20 0.0
White 5,420 872 118 23 11 188 37 5 15 9 1,218 1,559 3 32 42 9,420 23.1
Multiracial, not Hispanic
255 66 10 1 1 15 5 0 1 1 63 106 0 2 3 520 1.3
Hispanic, any race 745 129 9 3 2 86 21 0 7 5 196 165 1 5 4 1352 3.3
Total Res & Ethnicity Known
23,389 7,783 430 1,219 411 12 3,783 3,761 4 40,792
Resident, ethnicity unknown
1407 421 26 283 153 1 217 182 1 2691
Not Reported (N/R) 1,024 385 227 21 8 620 3 3 150 2,441
Gender Totals 25,820 8,589 683 1,523 572 633 4,003 3,946 155 45,924
% 75.0% 25.0% 72.7% 27.3% 50.4% 49.6%
* % of M and % of F columns are the percent of that gender who are of the specified ethnicity, of those whose ethnicity is known
graduates, and Whites comprised a smaller percentage of male
master’s graduates than female master’s graduates. This trend
is likely to continue into the near future based on the current
enrollment breakdown by gender and ethnicity (Table M8).
The average number of new master’s students enrolled in U.S.
CS departments rose from 106.5 to 123.5. As was the case last
year, U.S. CS departments at both public and private institutions
experienced increases (Table M5). This suggests that this year’s
observed master’s production decline is likely to be short-lived.
The fraction of new master’s students in U.S. CS departments
that is reported to be from outside North America in 2018-19 was
60.0 percent, compared with 63.6 percent in 2017-18 from 67.5
percent in 2016-17 (Table M5). This year there was a sharp decline
among departments at public institutions, from 70.6 to 58.0
percent; private institutions showed only a slight decline, from
65.0 percent to 64.2 percent. At U.S. Information departments,
the fraction of new master’s students from outside North
America declined from 42.8 percent to 40.2 percent, the second
straight year of decline.
This year, we asked for information about the types of master’s
programs offered by our departments; specifically, we asked
if the department offered only professional master’s, only
“academic” master’s, or both types. Of the 167 departments
that responded to this year’s Taulbee Survey, all but one
reported having master’s programs. Of the 159 departments
who responded to the question about the breakdown of these
programs into professional and academic, 36 (23 percent) had
only professional master’s, and 55 (35 percent) had both. Of
the 123 total professional master’s programs, 23 percent were
offered totally online and another seven percent were offered
in hybrid format. Of the 148 total academic master’s programs,
11 percent were offered online and six percent were offered
in hybrid form. About 78 percent of the online programs are
reported to the Taulbee survey and so are included in the
master’s statistics reported earlier in this section.

cra.org/crn19 May 2019
2018 Taulbee Survey (continued)
Figure M1. Master’s Degrees Granted by Tenure-Track Size
CRA Taulbee Survey 2018
Figure M2. Master’s Enrollment Normalized by Tenure-Track Size
CRA Taulbee Survey 2018

cra.org/crn20 May 2019
2018 Taulbee Survey (continued)
Bachelor’s (Tables 1, B1-B8; Figures B1-B4)
The 2017-18 academic year marked the fifth consecutive year
of double-digit percentage increases in bachelor’s degree
production. Overall degree production, aggregated across all
three areas of computing, is 14.4 percent higher at this year’s
reporting departments than it was at last year’s reporting
departments. In U.S. CS departments, the increase is 18.1 percent.
When considering only those departments that reported both
years, the increase was 18.2 percent among all departments
and 20.1 percent among U.S. CS departments (Table 1). When only
the CS area is considered, bachelor’s degree production per
department increased 21.4 percent at U.S. CS departments, and it
increased 21.1 percent among all reporting departments (Table B1).
Figure B1 shows the trend in total computing bachelor’s degree
production since 1995 for all departments reporting to the
Table B1. Bachelor’s Degrees Awarded by Department Type
Department Type # Depts CS CE I Total
US CS Public 97 18,675 69.9% 2,156 74.8% 2,021 47.4% 22,852 67.5%
US CS Private 33 5,313 19.9% 301 10.4% 232 5.4% 5,846 17.3%
US CS Total 130 23,988 89.8% 2,457 85.3% 2,253 52.9% 28,698 84.8%
US CE 3 0.0% 279 9.7% 0.0% 279 0.8%
US Info 12 278 1.0% 0.0% 1,893 44.4% 2,171 6.4%
Canadian 10 2,443 9.1% 146 5.1% 116 2.7% 2,705 8.0%
Grand Total 155 26,709 2,882 4,262 33,853
Table B2. Bachelor’s Degrees Awarded by Gender
CS CE I Total
Male 19,488 79.1% 2,379 84.4% 3,034 73.2% 24,901 78.8%
Female 5,162 20.9% 440 15.6% 1,111 26.8% 6,713 21.2%
Total Known Gender 24,650 2,819 4,145 31,614
Gender Unknown 2,059 63 117 2,239
Grand Total 26,709 2,882 4,262 33,853
Table B3. Bachelor’s Degrees Awarded by Ethnicity
CS CE I Total
Nonresident Alien 3,086 13.9% 342 13.0% 336 8.4% 3,764 13.0%
Amer Indian or Alaska Native 47 0.2% 13 0.5% 10 0.3% 70 0.2%
Asian 5,899 26.5% 631 24.1% 820 20.5% 7,350 25.4%
Black or African-American 692 3.1% 128 4.9% 283 7.1% 1,103 3.8%
Native Hawaiian/Pac Islander 63 0.3% 3 0.1% 19 0.5% 85 0.3%
White 10,117 45.4% 1,150 43.9% 1,941 48.6% 13,208 45.7%
Multiracial, not Hispanic 637 2.9% 72 2.7% 182 4.6% 891 3.1%
Hispanic, any race 1,725 7.7% 282 10.8% 406 10.2% 2,413 8.4%
Total Residency & Ethnicity Known 22,266 2,621 3,997 28,884
Resident, ethnicity unknown 941 184 113 1,238
Residency unknown 3,557 77 152 3,786
Grand Total 26,709 2,882 4,262 33,853

cra.org/crn21 May 2019
2018 Taulbee Survey (continued)
Table B5. New Bachelor’s Students by Department Type
CS CE I Total
Department Type Major Pre-
Major#
DeptsAvg.
Major /Dept
Total Pre-Major
# Depts
Avg. Major /Dept
Total Pre-Major
# Depts
Avg. Major /Dept
Total Major
Avg. Major /Dept
US CS Public 23,835 8,786 87 274.0 2,992 1,272 30 99.7 1,767 273 17 103.9 28,594 328.7
US CS Private 6,035 1,726 25 241.4 213 175 8 26.6 403 30 4 100.8 6,651 266.0
US CS Total 29,870 10,512 112 266.7 3,205 1,447 38 84.3 2,170 303 21 103.3 35,245 314.7
US CE 0 0 0 22 130 2 11.0 0 0 0 22 11.0
US Information 513 0 2 256.5 0 0 1,276 180 10 127.6 1,789 178.9
Canadian 3,496 1,343 9 388.4 222 0 3 74.0 0 0 0 3,718 413.1
Grand Total 33,879 11,855 123 275.4 3,449 1,577 43 80.2 3,446 483 31 111.2 40,774 306.6
Table B6. Total Bachelor’s Enrollment by Department Type
CS CE I Total
Department Type Major Pre-
Major#
DeptsAvg.
Major /Dept
Total Pre-Major
# Depts
Avg. Major /Dept
Total Pre-Major
# Dept
Avg. Major /Dept
Total Major
Avg. Major /Dept
US CS Public 95,100 20,433 98 970.4 12,829 2,253 36 356.4 9,594 919 26 369.0 117,523 1199.2
US CS Private 21,339 3,984 33 646.6 1,006 565 11 91.5 1,391 33 4 347.8 23,736 719.3
US CS Total 116,439 24,417 131 888.8 13,835 2,818 47 294.4 10,985 952 30 366.2 141,259 1078.3
US CE 0 0 1,131 694 3 377.0 0 0 1,131 377.0
US Information 1,346 403 2 673.0 0 0 6,021 962 12 501.8 7,367 613.9
Canadian 13,218 3,893 10 1321.8 760 188 3 253.3 0 0 13,978 1397.8
Grand Total 131,003 28,713 143 916.1 15,726 3,700 53 296.7 17,006 1,914 42 404.9 163,735 1049.6
Table B4. Bachelor’s Degrees Expected Next Year by Department Type
Department Type # Depts CS CE I Total
US CS Public 92 18,611 66.0% 2,442 73.8% 1,638 43.3% 22,691 64.3%
US CS Private 28 5,340 18.9% 278 8.4% 224 5.9% 5,842 16.6%
US CS Total 120 23,951 85.0% 2,720 82.2% 1,862 49.2% 28,533 80.9%
US CE 3 0 0.0% 368 11.1% 0 0.0% 368 1.0%
US Info 11 385 1.4% 0.0% 1,919 50.8% 2,304 6.5%
Canadian 10 3,845 13.6% 219 6.6% 0 0.0% 4,064 11.5%
Grand Total 144 28,181 3,307 3,781 35,269
Taulbee Survey. Based on current and recent enrollments,
continued increases in CS bachelor’s degree production are likely
to continue for the next few years.
The upward trajectory in bachelor’s enrollment continues;
there was an increase in the number of new undergraduate
computing majors for the eleventh consecutive year. This year’s
respondents reported 13.6 percent more new majors than did
last year’s respondents, with an average of 17.8 percent more
per department (Tables 1 and B5). The increase in new majors is
25.7 percent when considering only those departments reporting
both this year and last year. Among U.S. computer science
departments, the increase in overall new majors was 14.7
percent overall (15.7 percent per department), and 25.9 percent
among departments reporting both this year and last year. If
only increases in new CS majors at U.S. CS departments are

cra.org/crn22 May 2019
2018 Taulbee Survey (continued)
Table B7. Bachelors Degrees Awarded by Gender and Ethnicity, From 155 Departments
CS CE I Ethnicity Totals
Male Fem N/R % of M*
% of F* Male Fem N/R % of
M*% of F* Male Fem N/R % of
M*% of F* Total %
Nonresident Alien 2,203 783 62 13 20 273 66 3 13 16 222 114 0 8 11 3,764 13.0
Amer Indian or Alaska Native
39 6 1 0 0 10 3 0 1 1 9 1 0 0 0 70 0.2
Asian 4,223 1,357 279 25 34 493 136 2 23 34 552 268 0 19 25 7,350 25.4
Black or African-American
483 144 60 3 4 105 23 0 5 6 195 88 0 7 8 1,103 3.8
Native Hawaiian/ Pac Islander
35 26 1 0 1 2 1 0 0 0 14 5 0 1 1 85 0.3
White 7,912 1,303 710 48 33 999 126 25 46 31 1,487 454 0 51 42 13,208 45.7
Multiracial, not Hispanic
465 119 43 3 3 67 5 0 3 1 120 62 0 4 6 891 3.1
Hispanic, any race
1,264 249 174 8 6 230 45 7 11 11 324 81 1 11 8 2,413 8.4
Total Res & Ethnicity Known
16,624 3,987 1,330 2,179 405 37 2,923 1,073 1 28,884
Resident, ethnicity unknown
668 139 127 155 29 0 78 35 0 1,238
Not Reported (N/R)
1,849 985 599 45 6 26 33 3 116 3,786
Gender Totals 19,488 5,162 2,059 2,379 440 63 3,034 1,111 117 33,853
% 79.1% 20.9% 84.4% 15.6% 73.2% 26.8%
* % of M and % of F columns are the percent of that gender who are of the specified ethnicity, of those whose ethnicity is known
Table B8. Bachelors Enrollment by Gender and Ethnicity, From 156 Departments
CS CE I Ethnicity Totals
Male Fem N/R % of M*
% of F* Male Fem N/R % of
M*% of F* Male Fem N/R % of
M*% of F* Total %
Nonresident Alien 9,878 2,944 220 12 15 1,054 221 19 9 10 946 434 0 8 12 15,716 11.6
Amer Indian or Alaska Native
227 56 27 0 0 54 15 0 1 1 26 11 0 0 0 416 0.3
Asian 18,429 6,257 405 22 32 2,555 642 17 22 30 2,115 940 0 19 25 31,428 23.1
Black or African-American
3,649 1,027 75 4 5 685 158 7 6 7 875 361 0 8 10 6,874 5.1
Native Hawaiian/ Pac Islander
133 42 6 0 0 24 7 0 0 0 15 8 0 0 0 235 0.2
White 39,891 6,522 1,155 47 33 5,207 708 80 45 33 5,611 1,461 1 49 39 60,958 44.8
Multiracial, not Hispanic
3,270 854 58 4 4 460 74 5 4 3 387 152 0 3 4 5,260 3.9
Hispanic, any race 9,189 1,921 173 11 10 1,672 321 14 14 15 1,440 384 0 13 10 15,136 11.1
Total Res & Ethnicity Known
84,666 19,623 2,119 11,711 2,146 142 11,415 3,751 1 136,023
Resident, ethnicity unknown
3,323 865 219 690 168 2 290 98 1 5,656
Not Reported (N/R) 13,101 4,002 2,629 474 87 306 203 49 1,198 22,056
Gender Totals 102,026 24,709 4,268 12,875 2,401 450 11,908 3,898 1,200 163,735
% 80.5% 19.5% 84.3% 15.7% 75.3% 24.7%
* % of M and % of F columns are the percent of that gender who are of the specified ethnicity, of those whose ethnicity is known

cra.org/crn23 May 2019
2018 Taulbee Survey (continued)
Table B9. Undergraduate Representative Course Enrollments 2015-2018, Department-Level Percentiles
Number of Students In Course % of Students Who Are Majors % of Students Who Are Female % of Students Who Are URM
Intro for Non-Majors
(N=44) 2015 2016 2017 2018 (N=25) 2015 2016 2017 2018 (N=23) 2015 2016 2017 2018 (N=17) 2015 2016 2017 2018
25 71.8 70.3 72.3 76.3 25 0.6 0.0 0.7 0.2 25 26.2 28.6 35.1 29.0 25 11.2 10.2 11.2 10.7
50 174.0 199.5 154.0 200.0 50 2.9 3.1 2.8 3.6 50 40.8 38.9 40.7 38.5 50 15.9 12.5 15.8 13.8
75 352.3 374.5 356.3 402.5 75 12.2 10.9 12.8 14.3 75 48.8 51.4 50.0 51.3 75 21.4 22.3 28.5 25.6
Intro for Majors
(N=50) 2015 2016 2017 2018 (N=32) 2015 2016 2017 2018 (N=28) 2015 2016 2017 2018 (N=29) 2015 2016 2017 2018
25 182.0 192.5 235.5 187.8 25 20.5 21.4 22.6 21.5 25 16.9 17.1 18.1 16.2 25 8.4 8.3 9.1 9.1
50 310.0 291.0 319.5 350.5 50 42.0 43.2 36.6 48.4 50 20.6 20.6 23.0 21.6 50 12.2 14.2 14.0 15.2
75 455.0 437.8 478.5 629.0 75 64.1 63.7 70.9 67.5 75 31.5 33.2 35.2 35.5 75 17.7 18.4 21.9 26.9
Mid-Level
(N=52) 2015 2016 2017 2018 (N=36) 2015 2016 2017 2018 (N=31) 2015 2016 2017 2018 (N=20) 2015 2016 2017 2018
25 85.3 107.0 110.5 93.5 25 45.2 43.5 39.0 48.6 25 12.7 14.3 14.6 18.0 25 7.2 8.1 9.3 9.3
50 134.5 151.5 176.5 196.0 50 61.5 60.8 55.5 58.8 50 18.4 20.0 19.2 23.3 50 12.0 11.2 12.9 14.1
75 249.3 289.5 359.3 327.5 75 80.0 86.1 83.2 81.9 75 26.0 28.3 29.7 30.2 75 16.7 16.8 19.7 20.6
Upper-Level
(N=49) 2015 2016 2017 2018 (N=34) 2015 2016 2017 2018 (N=28) 2015 2016 2017 2018 (N=18) 2015 2016 2017 2018
25 54.0 56.0 69.5 74.0 25 64.5 75.7 66.0 68.4 25 8.3 11.0 11.6 13.4 25 3.4 4.3 6.2 6.0
50 101.0 123.0 133.0 124.0 50 83.3 83.8 88.5 86.8 50 15.6 16.0 19.0 17.6 50 9.4 7.9 10.3 12.2
75 186.0 190.0 191.0 253.5 75 95.4 97.6 96.3 97.2 75 23.4 23.0 29.5 27.4 75 15.9 15.3 16.5 26.9
Figure B1. BS Production (CS & CE)
CRA Taulbee Survey 2018
cra.org/crn24 May 2019
2018 Taulbee Survey (continued)
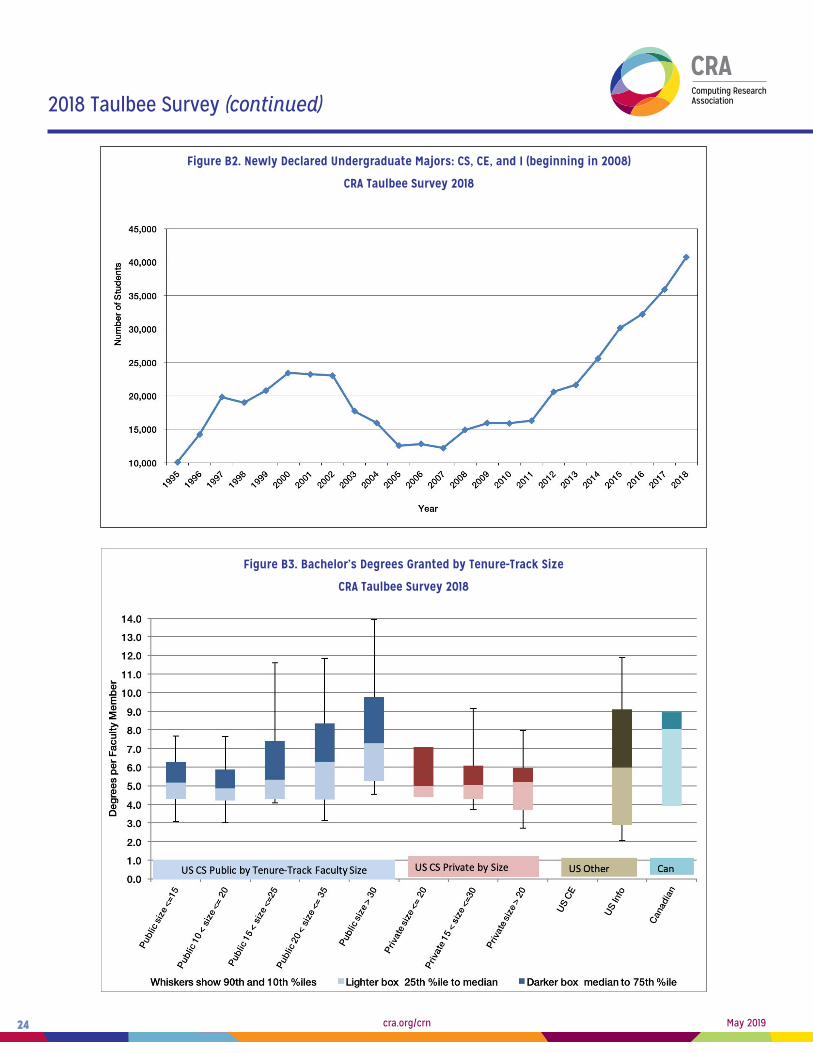
Figure B3. Bachelor’s Degrees Granted by Tenure-Track Size
CRA Taulbee Survey 2018
Figure B2. Newly Declared Undergraduate Majors: CS, CE, and I (beginning in 2008)
CRA Taulbee Survey 2018

cra.org/crn25 May 2019
2018 Taulbee Survey (continued)
Figure B4. Bachelor’s Enrollment Normalized by Tenure-Track Size
CRA Taulbee Survey 2018
considered, the average increase is 13.9 percent per department.
Figure B2 illustrates the trend in the total number of newly declared
computing undergraduate majors as reported in the Taulbee Survey.
Total undergraduate enrollment in computing majors among U.S.
CS departments (i.e., the sum of the number of new and continuing
majors in CS, CE, and I at these departments) increased 6.6 percent
(also 9.3 percent per department) when all respondents are
compared, and increased 10.6 percent among U.S. CS departments
reporting both this year and last year (Tables 1 and B6).
Per-department averages smooth out comparisons from year
to year when there are differences in the number of reporting
departments, but the averages include both very large and very
small departments. Figures B3 and B4 show the distribution of
number of degrees awarded (Figure B3) and total enrollment
(Figure B4) per tenured or tenure-track faculty member, in
department size groupings for the U.S. CS departments. Among
public institutions, larger departments produce more bachelor’s
degrees per tenure-track faculty member than do smaller
departments; for private institutions, there is little difference by
department size. Departments from private institutions enroll
fewer bachelor’s students per tenure-track faculty than do
departments from public institutions. Neither public nor private
institutions show a clear relationship between faculty size and
enrollment per tenure-track faculty member.
The enrollment increases in CS continue to be of particular
interest to our community. This year’s Taulbee Survey data
shows that the per-department enrollment of CS bachelor’s
majors in U.S. CS departments increased by 8.7 percent over last
year. While lower than the 13.3 percent increase reported last
year and the 24.8 percent increase reported two years ago, this
increase is still considerable given the sustained growth surge
of more than decade and the capacity barriers that have caused
several departments to limit entrance into the major. Figure B5
shows the enrollment trend from Taulbee Survey data since this
surge began. The average enrollment per U.S. CS department
has increased over 360 percent during this period; that is, it has
more than quadrupled. For the past five years, it has exceeded
the previous peak reached during the dot-com enrollment surge.
As noted in the introduction, we asked various questions this
year about how departments are responding to the enrollment

cra.org/crn26 May 2019
2018 Taulbee Survey (continued)
Figure B5. Average New and Continuing CS Majors per Academic Unit (U.S. CS Programs Only)
CRA Taulbee Survey 2018
surge, so that we may compare the situation today with that of
three years ago when CRA issued its “Generation CS” report. A
separate report on the results of this year’s questions is expected
to be distributed in the June 2019 issue of Computing Research
News, However, we can report here the results of one basic
question comparing the difficulty in managing the bachelor’s level
enrollment situation now versus three years ago. As might be
expected from the enrollment data we have reported above, most
departments find it harder to manage now than they did three
years ago. Among the 141 total departments responding to this
question, 44 percent said that it is much more difficult to manage
now, and an additional 29 percent said it was somewhat more
difficult to manage now. Only four percent said it was somewhat
easier, and the rest said it was about the same. These statistics are
similar when only U.S. CS departments (122 of the 141) are considered.
Another view of bachelor’s enrollments can be gleaned from
CS course-level data. Such data was first reported in CRA’s
Generation-CS report for the fall terms in 2005, 2010 and 2015.
The Taulbee Survey began collecting follow-up data in the 2016
survey, and now does so annually. Table B9 shows four-year
enrollment trends for the four types of courses for which data
is collected (representative introductory course for non-majors,
introductory course for majors, mid-level course, and upper-
level course). For each type of course, only those departments
are included that reported data for each of the four years and
reported on the same course in each of the four years. The
data indicate that median enrollment in the introductory course
for non-majors, the introductory course for CS majors, and the
mid-level course each is at its highest level in 2018 among the
four years 2015-18. However, only the mid-level course shows a
steadily increasing median over the four-year period. The table
further shows that the median percent of non-majors in the
introductory course for majors is at its highest level in 2018.
In last year’s survey, we observed that the median percent
of non-majors in the introductory course for majors had been
declining over a three-year period. This year’s observation about
the percent of non-majors in the introductory course for majors
may reflect differences in what is happening at the seven
departments that did not report in 2018 but reported in 2015-17,
relative to the 32 departments that reported all four years.
Gender diversity among bachelor’s graduates, both overall and
in CS, improved again in 2017-18. Women comprised 21.2 percent

cra.org/crn27 May 2019
2018 Taulbee Survey (continued)
Table F1. Actual and Anticipated Faculty Size by Position and Department Type
Actual ProjectedExpected 2-Yr Growth
2018-2019 2019-2020 2020-2021
US CS Public Total Average Total Average Total Average # %
TenureTrack 3,117 30.9 3,326 32.9 3,487 34.5 370 11.9%
Teaching Prof 441 7.6 499 8.3 535 8.9 94 21.3%
Other Instruc 401 7.9 428 8.2 439 9.0 38 9.5%
Research 257 5.1 277 5.2 294 5.8 37 14.4%
Postdoc 280 5.4 312 5.7 334 6.1 54 19.3%
Total 4,496 44.5 4,842 47.9 5,089 50.4 593 13.2%
US CS Private
TenureTrack 1,249 34.7 1,320 36.7 1,368 38.0 119 9.5%
Teaching Prof 230 9.2 252 10.1 268 10.7 38 16.5%
Other Instruc 35 3.2 39 3.9 42 4.2 7 20.0%
Research 169 9.9 175 10.3 183 10.8 14 8.3%
Postdoc 251 10.9 272 11.8 292 12.7 41 16.3%
Total 1,934 53.7 2,058 57.2 2,153 59.8 219 11.3%
All US CS
TenureTrack 4,366 31.9 4,646 33.9 4,855 35.4 489 11.2%
Teaching Prof 671 8.1 751 8.8 803 9.4 132 19.7%
Other Instruc 436 7.0 467 7.5 481 8.2 45 10.3%
Research 426 6.4 452 6.5 477 7.0 51 12.0%
Postdoc 531 7.1 584 7.5 626 8.0 95 17.9%
Total 6,430 46.9 6,900 50.4 7,242 52.9 812 12.6%
US CE
TenureTrack 73 18.3 76 19.0 78 19.5 5 6.8%
Teaching Prof 6 3.0 6 3.0 6 3.0 0 0.0%
Other Instruc 2 2.0 2 2.0 2 2.0 0 0.0%
Research 19 19.0 19 19.0 19 19.0 0 0.0%
Postdoc 9 3.0 10 3.3 11 3.7 2 22.2%
Total 109 27.3 113 28.3 116 29.0 7 6.4%
US I
TenureTrack 379 27.1 414 29.6 443 31.6 64 16.9%
Teaching Prof 100 10.0 119 11.9 134 13.4 34 34.0%
Other Instruc 42 5.3 46 5.8 49 6.1 7 16.7%
Research 11 1.9 11 2.3 12 2.4 1 9.1%
Postdoc 27 2.7 38 3.4 36 3.6 9 33.3%
Total 559 39.9 628 44.8 673 48.1 114 20.4%
Canadian
TenureTrack 396 39.6 411 41.1 424 42.4 28 7.1%
Teaching Prof 54 7.7 56 8.0 55 9.2 1 1.9%
Other Instruc 14 3.5 9 2.3 9 2.3 -5 -35.7%
Research 9 3.0 9 3.0 10 3.3 1 11.1%
Postdoc 86 10.8 89 11.1 88 11.0 2 2.3%
Total 559 55.9 574 57.4 586 58.6 27 4.8%
Grand Total
TenureTrack 5,214 31.6 5,547 33.6 5,799 35.1 585 11.2%
Teaching Prof 831 8.2 932 9.0 998 9.7 167 20.1%
Other Instruc 494 6.6 524 7.0 541 7.5 47 9.5%
Research 465 6.0 492 6.2 518 6.7 53 11.4%
Postdoc 653 6.8 720 7.2 761 7.7 108 16.5%
Total 7,657 46.4 8,214 49.8 8,616 52.2 959 12.5%

cra.org/crn28 May 2019
2018 Taulbee Survey (continued)
of all graduates and 20.9 percent of CS graduates in 2017-18. In
CE, the percentage of women among bachelor’s graduates was
15.6 percent compared with the 12.6 percent reported last year,
and the percentage of women among I graduates increased
from 25.0 percent to 26.8 percent (Table B2). The percentage of
CS bachelor’s degrees awarded to Whites continued to decline,
from 47.6 percent in 2016-17 to 45.4 percent in 2017-18, while the
percentage awarded to Asians rose from 25.9 percent to 26.5
percent and the percentage awarded to Non-resident Aliens rose
from 12.5 percent to 13.9 percent. As was the case in last year’s
report, changes in other ethnicity categories were less than 1
percent in CS. In aggregate across the three areas of computing,
45.7 percent of the graduates were White, 25.4 percent Asian,
13.0 percent Non-resident Aliens, and 15.8 percent all other
ethnicity categories combined. However, in I programs, the other
ethnicity categories accounted for approximately 23 percent of
the graduates (Table B3).Gender and ethnicity distributions of
enrolled students (Table B8) suggest that improvements in the
diversity of computing graduates are not likely to happen any
time soon.
In all three computing areas (CS, CE, and I), Resident Asians and
Non-resident Aliens continue comprise a larger fraction of female
enrollment than male enrollment, while Whites comprise a larger
fraction of male enrollment than female enrollment (Table B8).
Table B7 indicates that the same comparisons continue to hold
true for degree awardees.
Faculty Demographics (Tables F1-F9; Figure F1)4
Table F1 shows the current and anticipated sizes, in FTE, for
tenure-track, teaching, and research faculty, and postdocs. The
total tenure-track faculty count in U.S. CS departments increased
by 4.5 percent over last year, and the average tenure-track faculty
size increased by 3.2 percent. In U.S. CS departments, the total
teaching faculty count increased from 947 to 1107 (16.9 percent).
This year, we asked departments to report their teaching faculty
in two categories, based on results of last year’s Teaching
Positions survey conducted by a CRA special committee. Because
position titles vary widely across institutions, the survey
instructions gave guidance on categorizing faculty based on
Table F2. Vacant Positions 2016-2017 by Position and Department Type
Tried to fill Filled
US CS Public
TenureTrack 315 250
Teaching Prof 95 82
Other Instruc 107 99
Research 41 38
Postdoc 81 93
Total 638 562
US CS Private
TenureTrack 125 91
Teaching Prof 45 34
Other Instruc 15 11
Research 26 24
Postdoc 45 45
Total 256 205
All US CS
TenureTrack 440 341
Teaching Prof 140 116
Other Instruc 122 110
Research 67 62
Postdoc 126 138
Total 894 767
US CE
TenureTrack 4 5
Teaching Prof 1 1
Other Instruc 0 0
Research 18 18
Postdoc 4 4
Total 27 28
US I
TenureTrack 35 29
Teaching Prof 21 20
Other Instruc 5 5
Research 1 1
Postdoc 7 9
Total 69 64
Canadian
TenureTrack 41 27
Teaching Prof 5 5
Other Instruc 5 5
Research 2 2
Postdoc 18 41
Total 71 80
Grand Total
TenureTrack 520 402
Teaching Prof 167 142
Other Instruc 132 120
Research 88 83
Postdoc 155 192
Total 1,061 939
cra.org/crn29 May 2019
2018 Taulbee Survey (continued)
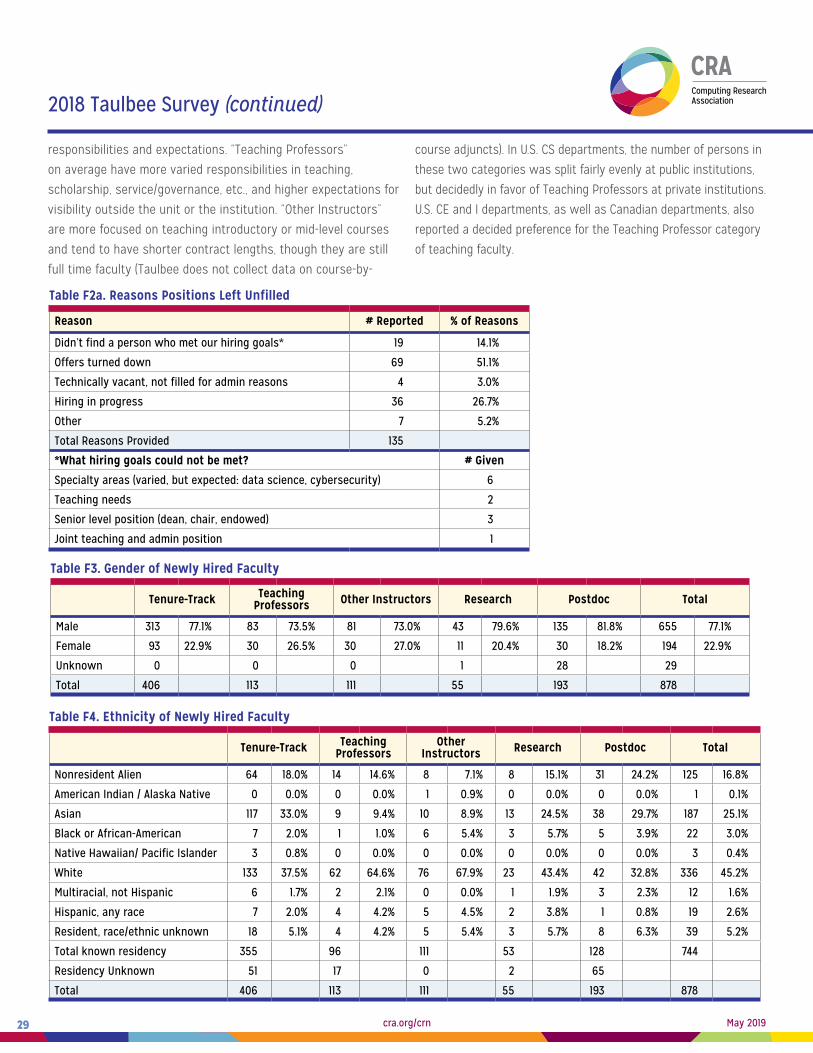
Table F2a. Reasons Positions Left Unfilled
Reason # Reported % of Reasons
Didn’t find a person who met our hiring goals* 19 14.1%
Offers turned down 69 51.1%
Technically vacant, not filled for admin reasons 4 3.0%
Hiring in progress 36 26.7%
Other 7 5.2%
Total Reasons Provided 135
*What hiring goals could not be met? # Given
Specialty areas (varied, but expected: data science, cybersecurity) 6
Teaching needs 2
Senior level position (dean, chair, endowed) 3
Joint teaching and admin position 1
Table F3. Gender of Newly Hired Faculty
Tenure-Track Teaching Professors Other Instructors Research Postdoc Total
Male 313 77.1% 83 73.5% 81 73.0% 43 79.6% 135 81.8% 655 77.1%
Female 93 22.9% 30 26.5% 30 27.0% 11 20.4% 30 18.2% 194 22.9%
Unknown 0 0 0 1 28 29
Total 406 113 111 55 193 878
Table F4. Ethnicity of Newly Hired Faculty
Tenure-Track Teaching Professors
Other Instructors Research Postdoc Total
Nonresident Alien 64 18.0% 14 14.6% 8 7.1% 8 15.1% 31 24.2% 125 16.8%
American Indian / Alaska Native 0 0.0% 0 0.0% 1 0.9% 0 0.0% 0 0.0% 1 0.1%
Asian 117 33.0% 9 9.4% 10 8.9% 13 24.5% 38 29.7% 187 25.1%
Black or African-American 7 2.0% 1 1.0% 6 5.4% 3 5.7% 5 3.9% 22 3.0%
Native Hawaiian/ Pacific Islander 3 0.8% 0 0.0% 0 0.0% 0 0.0% 0 0.0% 3 0.4%
White 133 37.5% 62 64.6% 76 67.9% 23 43.4% 42 32.8% 336 45.2%
Multiracial, not Hispanic 6 1.7% 2 2.1% 0 0.0% 1 1.9% 3 2.3% 12 1.6%
Hispanic, any race 7 2.0% 4 4.2% 5 4.5% 2 3.8% 1 0.8% 19 2.6%
Resident, race/ethnic unknown 18 5.1% 4 4.2% 5 5.4% 3 5.7% 8 6.3% 39 5.2%
Total known residency 355 96 111 53 128 744
Residency Unknown 51 17 0 2 65
Total 406 113 111 55 193 878
responsibilities and expectations. “Teaching Professors”
on average have more varied responsibilities in teaching,
scholarship, service/governance, etc., and higher expectations for
visibility outside the unit or the institution. “Other Instructors”
are more focused on teaching introductory or mid-level courses
and tend to have shorter contract lengths, though they are still
full time faculty (Taulbee does not collect data on course-by-
course adjuncts). In U.S. CS departments, the number of persons in
these two categories was split fairly evenly at public institutions,
but decidedly in favor of Teaching Professors at private institutions.
U.S. CE and I departments, as well as Canadian departments, also
reported a decided preference for the Teaching Professor category
of teaching faculty.

cra.org/crn30 May 2019
2018 Taulbee Survey (continued)
Table F5. Faculty Losses
Died 7
Retired 94
Took Academic Position Elsewhere 126
Took Nonacademic Position 34
Remained, but Changed to Part Time 23
Other 11
Unknown 8
Total 303
Table F6. Gender of Current Faculty
Full Associate Assistant Teaching Professors
Other Instructors Research Postdoc Total
Male 2,131 85.1% 993 76.8% 1,081 77.3% 659 71.9% 426 72.9% 343 79.2% 529 81.0% 6,162 79.2%
Female 374 14.9% 300 23.2% 318 22.7% 258 28.1% 158 27.1% 90 20.8% 124 19.0% 1,622 20.8%
Unknown 70 13 22 18 18 2 25 168
Total 2,575 1,306 1,421 935 602 435 678 7,952
Table F7. Ethnicity of Current Faculty
Full Associate Assistant Teaching Professors
Other Instructors Research Postdoc Total
Nonresident Alien 6 0.3% 8 0.7% 179 13.9% 35 4.2% 21 3.8% 33 8.3% 158 28.2% 440 6.2%
American Indian / Alaska Native
20 0.9% 2 0.2% 4 0.3% 0 0.0% 2 0.4% 0 0.0% 0 0.0% 28 0.4%
Asian 643 28.3% 369 32.1% 458 35.5% 111 13.3% 46 8.4% 88 22.2% 173 30.8% 1,888 26.7%
Black or African-American 19 0.8% 27 2.3% 29 2.2% 14 1.7% 24 4.4% 5 1.3% 10 1.8% 128 1.8%
Native Hawaiian/ Pacific Islander
5 0.2% 0 0.0% 2 0.2% 0 0.0% 0 0.0% 0 0.0% 0 0.0% 7 0.1%
White 1,455 63.9% 667 57.9% 537 41.7% 623 74.6% 406 74.0% 237 59.7% 187 33.3% 4,112 58.3%
Multiracial, not Hispanic 11 0.5% 4 0.3% 5 0.4% 7 0.8% 3 0.5% 0 0.0% 1 0.2% 31 0.4%
Hispanic, any race 47 2.1% 33 2.9% 28 2.2% 23 2.8% 29 5.3% 13 3.3% 12 2.1% 185 2.6%
Resident, race/ethnic unknown
70 3.1% 41 3.6% 47 3.6% 22 2.6% 659 71.9% 21 5.3% 20 3.6% 239 3.4%
Total known residency 2,276 1,151 1,289 835 549 397 561 7,058
Residency Unknown 299 155 132 100 53 38 117 894
Total 2,575 1,306 1,421 935 602 435 678 7,952
The total number of research faculty reported at U.S. CS
departments rose to 426 from the 408 reported last year, while the
total number of postdocs dropped from 567 to 531. About half of
the U.S. CS departments providing faculty data to this year’s survey
reported having any research faculty, and this was true among
both public and private universities. About half of public and two-
thirds of private U.S. CS departments reported having any postdocs.
Figure F1 illustrates the comparative changes at U.S. CS
departments in undergraduate enrollment, tenure-track faculty
and teaching faculty since 2006, when the current enrollment
surge began. This figure updates with recent years’ data a
figure from the Generation-CS report. It illustrates the continuing
challenge to obtain sufficient instructional resources to deal
effectively with the increased enrollments.
Canadian departments, on average, are larger than U.S. CS
departments, in terms of both tenure-track and total faculty,
while U.S. I and CE departments, on average, are smaller than
U.S. CS departments on both counts. This follows the pattern of
previous years. The observations about U.S. CE and I departments
may reflect the fact that we ask departments to report only
computing-related faculty, so departments with Library Science or
EE programs may report only part of their faculty.
Among U.S. CS departments, those at private universities are on
average larger than those at public universities in both tenure-

cra.org/crn31 May 2019
2018 Taulbee Survey (continued)
Table F8. Current Tenured and Tenure-Track Faculty by Gender and Ethnicity, From 164 Departments
Full Professor Associate Professor Assistant Professor Ethnicity Totals
Male Fem N/R % of M*
% of F* Male Fem N/R % of
M*% of F* Male Fem N/R % of
M* % of F* Total %
Nonresident Alien 6 0 0 0 0 8 0 0 1 0 137 42 0 14 15 193 4
Amer Indian or Alaska Native
19 1 0 1 0 2 0 0 0 0 1 3 0 0 1 26 1
Asian 563 80 0 30 25 271 98 0 32 37 371 87 0 39 31 1,470 32
Black or African-American
15 4 0 1 1 16 11 0 2 4 16 13 0 2 5 75 2
Native Hawaiian/ Pac Islander
4 1 0 0 0 0 0 0 0 0 1 1 0 0 0 7 0
White 1,219 220 16 65 69 522 145 0 62 55 403 134 0 42 47 2,659 58
Multiracial, not Hispanic
10 1 0 1 0 4 0 0 1 0 4 1 0 0 0 20 0
Hispanic, any race 35 12 0 2 4 25 8 0 3 3 25 3 0 3 1 108 2
Total Res & Ethnicity Known
1,871 319 16 848 262 0 958 284 0 4,558
Resident, ethnicity unknown
59 9 2 30 11 0 37 9 1 158
Not Reported (N/R) 201 46 52 115 27 13 86 25 21 586
Gender Totals 2,131 374 70 993 300 13 1,081 318 22 5,302
% 85.1% 14.9% 76.8% 23.2% 77.3% 22.7%
* %M and %F columns are the percent of that gender who are of the specified ethnicity, of those whose ethnicity is known
Table F9a. Current Non-Tenure-Track Teaching by Gender and Ethnicity, From 154 Departments
Teaching Professors Other Instructors Ethnicity Totals
Male Fem N/R % of M* % of F* Male Fem N/R % of M* % of F* Total %
Nonresident Alien 27 8 0 5 3 15 6 0 4 4 56 4
Amer Indian or Alaska Native 0 0 0 0 0 2 0 0 1 0 2 0
Asian 65 46 0 11 20 30 16 0 8 11 157 12
Black or African-American 12 2 0 2 1 12 12 0 3 9 38 3
Native Hawaiian/ Pac Islander 0 0 0 0 0 0 0 0 0 0 0 0
White 454 169 0 78 73 304 102 0 78 72 1,029 77
Multiracial, not Hispanic 6 1 0 1 0 1 2 0 0 1 10 1
Hispanic, any race 17 6 0 3 3 25 4 0 6 3 52 4
Total Res & Ethnicity Known 581 232 0 0 0 389 142 0 0 0 1,344 0
Resident, ethnicity unknown 16 6 0 14 4 0 40
Not Reported (N/R) 62 20 18 23 12 18 153
Gender Totals 659 258 18 426 158 18 1,537
% 71.9% 28.1% 72.9% 27.1%
* %M and %F columns are the percent of that gender who are of the specified ethnicity, of those whose ethnicity is known

cra.org/crn32 May 2019
2018 Taulbee Survey (continued)
Table F9b. Current Non-Tenure-Track Research Faculty and Postdoctorates by Gender and Ethnicity, From 132 Departments
Non-Tenure-Track Research Postdocs Ethnicity Totals
Male Fem N/R % of M* % of F* Male Fem N/R % of M* % of F* Total %
Nonresident Alien 27 6 0 9 8 140 16 2 31 18 191 21
Amer Indian or Alaska Native 0 0 0 0 0 0 0 0 0 0 0 0
Asian 69 19 0 23 24 148 25 0 33 28 261 29
Black or African-American 3 2 0 1 3 5 5 0 1 6 15 2
Native Hawaiian/ Pac Islander 0 0 0 0 0 0 0 0 0 0 0 0
White 188 49 0 64 61 146 41 0 32 46 424 46
Multiracial, not Hispanic 0 0 0 0 0 0 1 0 0 1 1 0
Hispanic, any race 9 4 0 3 5 11 1 0 2 1 25 3
Total Res & Ethnicity Known 296 80 0 450 89 2 917
Resident, ethnicity unknown 18 3 0 14 6 0 41
Not Reported (N/R) 29 7 2 65 29 23 155
Gender Totals 343 90 2 529 124 25 1,113
% 79.2% 20.8% 81.0% 19.0%
* %M and %F columns are the percent of that gender who are of the specified ethnicity, of those whose ethnicity is known
track and total faculty size. This also follows the pattern of
previous years.
Table F2 summarizes faculty hiring this past year. The success
rate for hiring tenure-track faculty at U.S. CS departments was
77.5 percent this year. The success rate among departments
at public universities was again higher than that at private
universities (79.4 percent vs 72.8 percent). Again this year,
Canadian departments had lower success rates, on average,
than did other types of departments. In aggregate across all
types of departments, the tenure-track hiring success rate
decreased from 82.7 percent to 77.3 percent.
Among those hired into all categories of academic positions
(tenure-track, teaching faculty, research faculty, and postdoc)
for 2018-19, 22.9 percent were women, down from last year’s
24.9 percentage (Table F3). However, among those newly hired
into tenure-track positions, the proportion of women rose from
20.8 percent last year to 22.9 percent this year. The percentage
of women among new tenure-track faculty hires and the
percentage of women among newly hired faculty overall both
are once again higher than the percentage of new female Ph.D.s
produced during the past year.
Among new tenure-track faculty, the fraction who are White again
declined, from 41.8 percent to 37.5 percent, while the fraction
who are Non-resident Alien or Asian new hires increased from
47.7 percent to 51.0 percent. Whites dominated both categories of
newly hired teaching faculty, with Asians and Non-resident Aliens
accounting for much of the remainder. Among research faculty,
Whites comprised 43.4 percent of new hires, while Non-resident
Aliens or resident Asians in aggregate comprised 39.6 percent
of new hires. Both figures are lower than those reported last
year. Among postdoc new hires, Whites comprised 32.8 percent,
compared to 28.7 percent last year, while Non-resident Aliens and
resident Asians collectively comprised 53.9 percent, similar to last
year’s percentage (Table F4).
Since 2015, the Taulbee Survey has been collecting information
on the number of new faculty hires who had been postdocs
in the previous year. For newly hired assistant professors, the
fraction who had been postdocs ranged from 21 to 31 percent
over the three years of prior data collection. We expanded the
question on sources of new faculty this year to learn more about
faculty movement between industry and academia, and between
academic institutions. Table F10 summaries the results. Of the

cra.org/crn33 May 2019
2018 Taulbee Survey (continued)
288 assistant professors hired for the 2018-2019 academic year
for whom the source was known, 39 percent were new PhDs, 26
percent had postdocs the previous year (this is within the range
of the previous three years), 29 percent came from other academic
institutions, and 6 percent came from industry. We don’t know
the previous academic rank of the new assistant professors who
came from other institutions; they might have been teaching
faculty or research faculty as a transitional position, or they might
have come from other tenure-track positions. Of the 67 full and
associate professors whose source was reported, 78 percent
came from other academic institutions and 13 percent from
industry. We also asked about faculty hired without PhDs; in the
two teaching faculty categories, 25 percent of Teaching Professors
and 74 percent of Other Instructors were hired without PhDs.
Another new feature of this year’s survey was the collection
of certain information about startup packages, exclusive of
equipment costs, for new assistant professors. Among the 107
U.S. CS departments that responded to our question about the
size of the startup package, the median of the average offered
package was $250K. The median among departments at public
institutions was slightly lower ($240K), while the median for
Table F10. Source of New Faculty
Full Associate Assistant Teaching Prof
Other Instruc Research Postdoc Total
% Total from
Source
New PhD 1 5 111 19 17 7 99 259 38%
From Postdoc 0 0 75 5 1 5 18 104 15%
From Other Academic 27 25 84 25 28 10 34 233 34%
From Industry 4 5 18 10 28 19 5 89 13%
Total With Hire Source 32 35 288 59 74 41 156 685
Hired Without PhD 0 0 0 15 55 14 0 84
% Hired Without PhD 25% 74% 34%
Figure F1. Comparative Change in Majors and Instructional Resources per Unit
CRA Taulbee Survey 2018

cra.org/crn34 May 2019
2018 Taulbee Survey (continued)
those at private institutions was slightly over $350K. Packages
at I-departments had a median of $220K, while those at
Canadian institutions has a median of $97.5K in Canadian dollars.
We also asked the departments if there were limits to how
long this startup funding was available for use. Of the 140 total
departments that responded, only 18 percent had no set limit.
The typical maximum number of years was three.
There was a 29.5 percent increase in faculty losses reported this
year as compared with last year (Table F5). The biggest increase
was in persons taking academic positions elsewhere; not only did
the raw number increase (from 85 to 126), but also this category’s
fraction of the total losses increased (from 36.3 percent to 41.6
percent). This is consistent with what we learned about the
source of new hires. A greater percentage of the faculty losses
this year also were due to persons who changed to part time
(from 5.1 percent to 7.6 percent of the total). While retirements
were up from 80 to 94, this category’s percent of the total dropped
from 34.2 to 31.0. The number of persons taking nonacademic
positions elsewhere went from 26 to 34, but this was the same
fraction of the total losses as was reported last year.
The proportion of women currently at each of the three tenure-
track faculty ranks stayed within one-half of a percentage
point of the corresponding value reported last year, with slight
drops at the assistant and full professor level and a slight
increase at the associate professor level. There was a slight
increase in the proportion of women among teaching faculty,
with only a one percentage point difference in the proportion
of women between the two teaching faculty categories. The
proportion of women among research faculty and postdocs
each were within one percentage point of their respective
values reported last year (Table F6).
Among the 164 departments who report gender by ethnicity
breakdowns (which represents the vast majority of departments),
Whites comprise a slightly greater percentage of female full
professors than they do male full professors; a similar situation
is present at the assistant professor level, while the reverse is
true at the associate professor level. Asians comprise a greater
percentage of males than they do females at both the full
and assistant professor levels while the reverse is true at the
associate professor level (Table F8). Among teaching and research
faculty, Whites comprise over three-fourths of those for whom
ethnicity was known, while they comprise only slightly over one-
third of the postdocs (Tables F9a and F9b). Non-resident Aliens and
Asians account for 50 percent of the postdocs.
For next year, U.S. CS departments forecast an average 6.4
percent growth in tenure-track faculty and 7.3 percent growth
in teaching faculty (Table F1). The tenure-track forecast is
lower than that made last year, while the teaching faculty
forecast is the same as that last year. Departments also
forecast an average 10.0 percent growth in postdocs, higher
than that forecast last year. Actual hiring exceeded last year’s
expectations for teaching faculty hiring, while falling short in
their expected hiring for both tenure-track faculty and postdocs.
Research Expenditures (Table R1; Figures R1-R2)
Table R1 shows the distribution of departments’ total research
expenditure (including indirect costs or “overhead” as stated
on project budgets) from external sources of support. Figures
R1 and R2 show the per capita expenditure, where capitation is
computed two ways. The first (Figure R1) is relative only to the
number of tenure-track faculty members. The second (Figure R2)
Table R1. Total Expenditure from External Sources for Computing Research
Percentile of Department Averages
Department Type # Depts 10th 25th 50th 75th 90th
US CS Public 71 $1,246,262 $2,572,994 $5,296,966 $9,861,560 $19,188,028
US CS Private 24 $2,707,554 $3,986,388 $9,394,133 $13,227,435 $21,234,887
US CE 1 * * * * *
US Information 12 $1,242,574 $2,022,869 $4,194,343 $4,649,739 $4,706,532
Canadian 5 * * $2,051,893 * *

cra.org/crn35 May 2019
2018 Taulbee Survey (continued)
Figure R2. Research Expenditures Normalized by Tenure-Track + Research Faculty + Postdoctorates
CRA Taulbee Survey 2018
Figure R1. Research Expenditures Normalized by Tenure-Track Size
CRA Taulbee Survey 2018

cra.org/crn36 May 2019
2018 Taulbee Survey (continued)
is relative to research faculty and postdocs as well as tenure-
track faculty. Canadian levels are shown in Canadian dollars.
Overall median research expenditures for 2017-18 at U.S. CS public
departments increased 30.7 percent in comparison with 2016-17.
Last year’s reported increase was just 8.7 percent. At U.S. CS
departments in private institutions, median expenditures rose
25.8 percent compared with a 19.6 percent increase last year.
The median research expenditure at U.S. CS departments in
private institutions remains considerably higher that of public
institutions. Median expenditures at U.S. I departments rose
49.4 percent over last year’s figure, after being relatively flat in
last year’s report. Canadian departments showed a 9.7 percent
increase in median expenditure over last year, versus a one
percent increase last year. The sample size for I departments
and Canadian departments is small, which makes these
comparisons subject to more volatility.
The U.S. CS data show a tendency for larger departments to
have more external funding per capita than smaller departments
among the public institutions. There is not a clear pattern for
size among the private institutions, but data for smaller private
institutions is limited.
Table G1a. Master's Students Supported as Full-Time Students by Department Type
On Institutional Funds On External Funds Total
Department Type
# Dept
Teaching Assistants
Research Assistants
Full-Support Fellows
Teaching Assistants
Research Assistants
Full-Support Fellows
US CS Public 80 1,759.5 73.0% 133.5 5.5% 16.0 0.7% 0.0 0.0% 491.0 20.4% 9.0 0.4% 2,408.9
US CS Private 17 119.0 69.8% 14.0 8.2% 12.0 7.0% 1.5 0.9% 13.0 7.6% 11.0 6.5% 170.5
US CS Total 97 1,878.4 72.8% 147.5 5.7% 28.0 1.1% 1.5 0.1% 504.0 19.5% 20.0 0.8% 2,579.4
US CE 3 47.0 39.2% 0.0 0.0% 0.0 0.0% 0.0 0.0% 73.0 60.8% 0.0 0.0% 120.0
US I 9 79.2 40.0% 31.6 16.0% 33.8 17.1% 1.8 0.9% 49.2 24.9% 2.2 1.1% 197.8
Canadian 9 417.5 57.0% 82.0 11.2% 38.0 5.2% 0.0 0.0% 195.0 26.6% 0.0 0.0% 732.5
Grand Total 118 2,422 66.7% 261 7.2% 100 2.7% 3 0.1% 821 22.6% 22 0.6% 3,630
Table G1. Doctoral Students Supported as Full-Time Students by Department Type
On Institutional Funds On External Funds Total
Department Type
# Dept
Teaching Assistants
Research Assistants
Full-Support Fellows
Teaching Assistants
Research Assistants
Full-Support Fellows
US CS Public 92 3,395.0 38.3% 867.8 9.8% 476.0 5.4% 22.7 0.3% 3,845.0 43.4% 251.5 2.8% 8,858.1
US CS Private 31 763.3 19.2% 1,144.0 28.8% 373.0 9.4% 2.0 0.1% 1,591.5 40.1% 94.8 2.4% 3,968.5
US CS Total 123 4,158.3 32.4% 2,011.8 15.7% 849.0 6.6% 24.7 0.2% 5,436.5 42.4% 346.3 2.7% 12,826.6
US CE 3 55.0 30.6% 32.0 17.8% 0.0 0.0% 0.0 0.0% 93.0 51.7% 0.0 0.0% 180.0
US I 14 302.8 38.2% 77.0 9.7% 67.0 8.4% 2.0 0.3% 324.0 40.9% 20.2 2.5% 793.0
Canadian 10 332.5 50.9% 117.0 17.9% 6.0 0.9% 0.0 0.0% 198.0 30.3% 0.0 0.0% 653.5
Grand Total 150 4,848.6 33.5% 2,237.8 15.5% 922.0 6.4% 26.7 0.2% 6,051.5 41.9% 366.4 2.5% 14,453.1

cra.org/crn37 May 2019
2018 Taulbee Survey (continued)
Table G1b. Master's Students Eligibility for Assistantship Support
# Depts % of Depts
All master’s students are eligible for assistantships 84 61.8%
No master’s students are eligible for assistantships 16 11.8%
Students in some master’s programs but not others are eligible for assistantships 24 17.6%
Other (combination of individual qualifications, research needs, and funds available) 12 8.8%
No Response 31
Valid Total 136 100.0%
Overall Total 167
Table G2. Fall 2018 Academic-Year Graduate Stipends by Department Type and Support Type
Teaching AssistantshipsPercentiles of Department Averages
Department Type # Depts 10th 25th 50th 75th 90th
US CS Public 99 $13,451 $16,457 $19,000 $21,212 $24,126US CS Private 27 $20,070 $23,108 $25,713 $29,436 $32,450US CE 4 * * $15,437 * *US Info 12 $17,568 $19,815 $21,825 $25,204 $26,001Canadian 9 * $8,185 $15,000 $17,788 *
Research AssistantshipsPercentiles of Department Averages
Department Type # Depts 10th 25th 50th 75th 90thUS CS Public 100 $14,011 $17,811 $19,910 $22,556 $26,050US CS Private 34 $21,719 $23,123 $25,757 $30,729 $31,864US CE 4 * * $18,475 * *US Info 13 $18,733 $20,177 $21,230 $24,649 $25,788Canadian 8 * $9,879 $11,500 $16,675 *
Full-Support FellowsPercentiles of Department Averages
Department Type # Depts 10th 25th 50th 75th 90thUS CS Public 63 $15,244 $19,750 $24,300 $30,000 $34,000US CS Private 32 $23,037 $24,744 $27,099 $31,659 $33,999US CE 2 * * * * *US Info 6 * * $25,000 * *Canadian 3 * * * * *

cra.org/crn38 May 2019
2018 Taulbee Survey (continued)
Graduate Student Support (Tables G1-G2; Figures G1-G3)
Table G1 shows the number of doctoral students supported as
full-time students as of fall 2017, further categorized as teaching
assistants (TAs), research assistants (RAs), and full-support
fellows. The table also shows the split between those on
institutional vs. external funds. Table G1a shows similar data for
supported master’s students.
The average number of TAs on institutional funds among doctoral
students in U.S. CS departments dropped slightly from last year’s
value, from 34.5 to 33.8. A similar decline was reported last year.
Public universities reported a slight increase, while the average
at private universities dropped considerably, from 35.2 to 24.6.
The reported values at private universities have been somewhat
volatile in recent years. Since there are fewer of them, compared
with public universities, they are more sensitive to the specific
units reporting in a given year. The small number of CE, I, and
Canadian departments also make these comparative averages
subject to volatility.
Among doctoral students, the average number of RAs on external
funding was higher in U.S. CS departments at public universities
and lower in those at private universities compared with last
year’s report, while the average number of RAs supported on
institutional funds increased sharply at private universities
and declined at publics. In both cases, these were the reverse
situations from what was reported last year. The average
number of full-support fellows on internal funds increased in
U.S. CS departments at both public and private universities.
The average number of full-support fellows on external funds
increased at U.S. CS departments in public universities but fell in
those at private universities.
Among master’s students, 66.8 percent of support is for
TAs, an increase over the 64.2 percent reported last year.
Conversely, 29.8 percent of support is for RAs, lower than last
year’s 32.0 percent. Among the 97 U.S. CS departments that
provided master’s support data, the average number of TAs
per department on institutional funds is 19.4, compared to the
16.7 average reported in last year’s survey (Table G1a). This
suggests that the use of master’s students is increasing to help
Figure G1. Teaching Assistantship Stipends
CRA Taulbee Survey 2018

cra.org/crn39 May 2019
2018 Taulbee Survey (continued)
Figure G3. Full Support Fellows Stipends
CRA Taulbee Survey 2018
Figure G2. Research Assistantship Stipends
CRA Taulbee Survey 2018

cra.org/crn40 May 2019
2018 Taulbee Survey (continued)
departments cope with the CS enrollment surge. Note, however,
that master’s students are not eligible for assistantships in
several departments (Table G1b).
Table G2 shows the distribution of stipends for TAs, RAs, and
full-support fellows. U.S. CS data are further broken down in
this table by public and private institution. Figures G1-G3 further
break down the U.S. CS data by size of department and by
geographic location of the university.
The median TA salaries at U.S. CS departments increased 2.7
percent at public universities and increased 6.1 percent at
private universities. Median salaries of RAs rose 4.3 percent at
public universities and 2.9 percent at private universities. For
full-support fellows, median salaries rose 5.7 percent at U.S.
public universities and 4.2 percent at U.S. private universities.
The TA change at public universities is slightly below the change
reported last year; each of the other increases at both public
and private institutions is larger than the corresponding change
reported last year.
Compared with public U.S. CS departments, median stipends
are higher at private U.S. CS departments in each of the three
stipend categories. Median stipends for TAs and RAs at U.S.
I schools fall in between those at public and private U.S. CS
departments. These relationships are unchanged from previous
years. Median stipends for full-support fellows at I schools fell in
between the public and private U.S. CS medians, as in previous
years. However, there only were six U.S. I schools reporting full-
support fellow stipends this year, versus nine last year.
At U.S. CS departments in public institutions, larger
departments have higher salaries than do smaller departments
for both TAs and RAs, except that the smallest public
departments (those of size 15 or less) have higher TA (but
not RA) stipends than those of size 16-25. Stipends in U.S.
CS departments at private institutions do not exhibit a clear
relationship based on department size for TAs, but for RAs,
stipends are slightly higher at larger departments.
Table S1. Nine-month Salaries, 138 Responses of 195 US CS Departments, Percentiles from Department Averages
Full Professor Associate Assistant Non-Tenure Track
In rank 16+ yrs
In rank 8-15 yrs
In rank 0-7 years
All years in rank
In rank 8+ years
In rank 0-7 years
All years in rank
Teach Research Postdoc
N Depts 121 121 123 138 114 126 136 136 104 46 42
N Indiv 730 561 721 2,086 422 569 1,020 1,182 927 275 347
10 %tile $134,550 $130,305 $125,483 $129,873 $99,437 $105,705 $102,998 $93,292 $63,464 $62,361 $44,219
25 %tile $148,927 $147,364 $139,837 $145,563 $106,847 $113,170 $110,023 $98,266 $73,063 $66,841 $49,031
50 %tile $172,929 $167,877 $153,056 $164,541 $114,288 $123,557 $119,484 $105,449 $83,657 $90,000 $56,016
75 %tile $199,936 $195,279 $176,150 $186,517 $128,378 $133,802 $132,919 $114,529 $96,511 $122,661 $66,742
90 %tile $223,616 $214,288 $194,443 $198,425 $140,267 $144,675 $145,257 $122,253 $117,765 $153,459 $72,004
Table S2. Nine-month Salaries, 102 Responses of 142 US CS Public (All Public), Percentiles from Department Averages
Full Professor Associate Assistant Non-Tenure Track
In rank 16+ yrs
In rank 8-15 yrs
In rank 0-7 years
All years in rank
In rank 8+ years
In rank 0-7 years
All years in rank
Teach Research Postdoc
N Depts 86 88 91 102 88 91 100 100 79 30 28
N Indiv 512 400 509 1,482 313 381 721 873 671 179 173
10 %tile $134,183 $126,371 $124,630 $128,760 $99,189 $102,389 $102,165 $92,437 $61,786 $60,116 $43,598
25 %tile $144,980 $145,329 $132,726 $142,409 $105,112 $108,959 $108,050 $96,165 $69,797 $65,655 $47,470
50 %tile $163,739 $160,230 $149,663 $156,251 $113,088 $121,331 $116,519 $101,174 $79,155 $77,065 $52,679
75 %tile $184,562 $183,754 $166,830 $177,710 $124,584 $128,358 $127,648 $109,777 $88,353 $117,960 $60,978
90 %tile $203,165 $202,797 $184,672 $189,358 $138,826 $137,557 $137,676 $116,384 $102,221 $136,254 $65,337

cra.org/crn41 May 2019
2018 Taulbee Survey (continued)
Table S3. Nine-month Salaries, 36 Responses of 53 US CS Private (All Private), Percentiles from Department Averages
Full Professor Associate Assistant Non-Tenure Track
In rank 16+ yrs
In rank 8-15 yrs
In rank 0-7 years
All years in rank
In rank 8+ years
In rank 0-7 years
All years in rank
Teach Research Postdoc
N Depts 35 33 32 36 26 35 36 36 25 16 14
N Indiv 218 161 212 604 109 188 299 309 256 96 174
10 %tile $142,006 $142,498 $145,874 $147,796 $108,789 $113,629 $112,911 $101,146 $82,555 $72,468 $55,425
25 %tile $171,489 $169,438 $150,841 $167,283 $111,882 $118,735 $117,241 $106,907 $88,625 $89,688 $58,850
50 %tile $202,589 $196,636 $168,896 $189,693 $117,007 $135,345 $132,865 $114,855 $97,896 $109,711 $67,281
75 %tile $231,583 $214,288 $188,278 $206,146 $132,752 $144,723 $144,236 $123,033 $114,526 $157,235 $70,976
90 %tile $257,133 $228,611 $209,352 $229,134 $150,349 $161,998 $153,593 $130,793 $122,055 $192,747 $74,125
Table S4. Nine-month Salaries, 22 Responses of US CS Public With <=15 Tenure-Track Faculty, Percentiles from Department Averages
Full Professor Associate Assistant Non-Tenure Track
In rank 16+ yrs
In rank 8-15 yrs
In rank 0-7 years
All years in rank
In rank 8+ years
In rank 0-7 years
All years in rank
Teach Research Postdoc
N Depts 14 16 15 21 17 17 20 20 16 2 1
N Indiv 30 29 39 98 46 41 87 73 69
10 %tile $116,368 $114,520 $111,229 $117,387 $95,054 $99,283 $96,436 $85,005 $59,259
25 %tile $123,243 $124,983 $113,852 $124,788 $98,863 $101,139 $99,673 $87,471 $62,438
50 %tile $134,382 $146,160 $132,537 $139,841 $99,707 $106,999 $103,004 $96,351 $66,447
75 %tile $146,397 $157,980 $151,475 $155,953 $116,744 $118,717 $111,883 $99,131 $73,007
90 %tile $160,224 $181,440 $179,011 $160,073 $124,782 $124,339 $124,315 $100,024 $81,689
Table S5. Nine-month Salaries, 29 Responses of US CS Public With 10 < Tenure-Track Faculty <=20, Percentiles from Department Averages
Full Professor Associate Assistant Non-Tenure Track
In rank 16+ yrs
In rank 8-15 yrs
In rank 0-7 years
All years in rank
In rank 8+ years
In rank 0-7 years
All years in rank
Teach Research Postdoc
N Depts 20 21 25 29 23 26 27 27 20 5 1
N Indiv 46 54 73 182 62 65 135 114 88 37
10 %tile $116,792 $109,172 $111,229 $119,288 $95,407 $100,501 $99,518 $87,060 $58,069
25 %tile $134,198 $126,387 $116,554 $128,376 $98,988 $104,323 $102,287 $91,328 $60,103
50 %tile $142,861 $136,634 $129,054 $139,841 $104,000 $109,512 $108,000 $96,438 $66,233 $60,210
75 %tile $158,336 $160,104 $144,115 $156,289 $114,484 $119,347 $114,396 $99,616 $77,486
90 %tile $166,242 $178,690 $165,997 $167,382 $125,873 $124,960 $126,119 $100,701 $84,078

cra.org/crn42 May 2019
2018 Taulbee Survey (continued)
Faculty Salaries (Tables S1-S21 and S1a-S19a; Figures S1-S9)
Each department was asked to report individual (but anonymous)
faculty salaries if possible; otherwise, the department was
requested to provide the mean salary for each rank (full,
associate, and assistant professors and non-tenure-track
teaching faculty, research faculty, and post-doctorates) and the
number of persons at each rank. The salaries are those in effect
on January 1, 2019 for U.S. departments; nine-month salaries are
reported in U.S. dollars. For Canadian departments, twelve-month
salaries are reported in Canadian dollars. Respondents were
asked to include salary supplements such as salary monies from
endowed positions.
U.S. CS data are reported in Tables S1-S16 and in the box and
whiskers diagrams. Data for CE, I, Canadian, and new Ph.D.s are
reported in Tables S17-S20. The tables and diagrams contain
distributional data (first decile, quartiles, and ninth decile) computed
from the department averages only. Thus, for example, a table row
labeled “50” or the median line in a diagram is the median of the
averages for the departments that reported within the stratum
(the number of such departments reporting is shown in the “depts”
row). Therefore, it is not a true median of all of the salaries.
Table S6. Nine-month Salaries, 28 Responses of US CS Public With 15 < Tenure-Track Faculty <=25, Percentiles from Department Averages
Full Professor Associate Assistant Non-Tenure Track
In rank 16+ yrs
In rank 8-15 yrs
In rank 0-7 years
All years in rank
In rank 8+ years
In rank 0-7 years
All years in rank
Teach Research Postdoc
N Depts 24 23 26 28 26 25 27 27 17 6 2
N Indiv 83 71 98 261 64 63 136 167 90 30
10 %tile $135,472 $121,016 $122,649 $128,851 $97,056 $103,035 $102,617 $93,326 $59,393
25 %tile $144,107 $128,374 $127,940 $137,587 $104,345 $107,102 $106,813 $94,892 $62,045
50 %tile $153,934 $150,782 $140,097 $146,748 $110,559 $113,928 $111,200 $97,874 $72,762 $95,301
75 %tile $166,471 $162,343 $148,400 $157,752 $114,638 $122,221 $117,159 $102,989 $79,155
90 %tile $186,421 $181,054 $165,609 $174,606 $123,451 $126,071 $125,586 $107,835 $83,351
Table S7. Nine-month Salaries, 33 Responses of US CS Public With 20 < Tenure-Track Faculty <=35, Percentiles from Department Averages
Full Professor Associate Assistant Non-Tenure Track
In rank 16+ yrs
In rank 8-15 yrs
In rank 0-7 years
All years in rank
In rank 8+ years
In rank 0-7 years
All years in rank
Teach Research Postdoc
N Depts 29 30 32 33 30 30 33 33 25 9 9
N Indiv 160 109 138 416 103 97 209 270 202 22 27
10 %tile $142,787 $137,553 $128,967 $138,481 $103,503 $106,319 $105,727 $94,491 $68,138
25 %tile $152,375 $145,888 $134,756 $146,127 $107,030 $110,705 $109,579 $96,705 $72,762 $66,398 $47,484
50 %tile $169,297 $159,989 $149,292 $155,663 $112,595 $120,652 $116,737 $101,863 $78,739 $72,639 $50,152
75 %tile $183,051 $186,530 $170,176 $180,386 $119,209 $126,179 $123,978 $107,696 $90,210 $88,935 $61,911
90 %tile $194,371 $207,820 $181,199 $193,819 $132,206 $137,629 $135,369 $113,553 $109,981

cra.org/crn43 May 2019
2018 Taulbee Survey (continued)
Table S8. Nine-month Salaries, 44 Responses of US CS Public With Tenure-Track Faculty >30, Percentiles from Department Averages
Full Professor Associate Assistant Non-Tenure Track
In rank 16+ yrs
In rank 8-15 yrs
In rank 0-7 years
All years in rank
In rank 8+ years
In rank 0-7 years
All years in rank
Teach Research Postdoc
N Depts 41 41 43 44 37 43 44 44 39 19 22
N Indiv 354 277 346 1020 169 257 436 568 458 130 159
10 %tile $154,464 $151,150 $136,176 $150,291 $108,336 $115,439 $112,276 $100,933 $74,416 $64,925 $42,794
25 %tile $167,605 $161,906 $150,176 $160,090 $111,206 $122,762 $118,219 $103,914 $79,049 $67,200 $46,916
50 %tile $182,621 $180,118 $162,327 $177,077 $122,107 $127,880 $125,737 $109,909 $87,640 $88,935 $53,167
75 %tile $199,197 $193,338 $173,236 $189,165 $134,177 $134,244 $136,092 $115,685 $96,555 $117,221 $60,660
90 %tile $211,529 $210,832 $194,544 $194,805 $140,845 $144,573 $144,134 $119,486 $120,994 $129,280 $65,479
Table S9. Nine-month Salaries, 12 Responses of US CS Private With <=20 Tenure-Track Faculty, Percentiles from Department Averages
Full Professor Associate Assistant Non-Tenure Track
In rank 16+ yrs
In rank 8-15 yrs
In rank 0-7 years
All years in rank
In rank 8+ years
In rank 0-7 years
All years in rank n
Teach Research Postdoc
N Depts 11 10 8 12 8 12 12 12 7 4 4
N Indiv 43 26 21 90 19 31 51 44 36 22 13
10 %tile $130,076 $135,773 $132,375 $112,619 $107,385 $100,404
25 %tile $146,192 $143,217 $151,010 $158,155 $108,795 $114,093 $113,789 $104,268 $87,738
50 %tile $178,000 $174,473 $174,000 $184,346 $111,922 $130,210 $123,372 $116,833 $97,896 $77,403 $65,901
75 %tile $208,017 $198,169 $184,387 $191,548 $125,664 $136,701 $133,109 $121,261 $111,668
90 %tile $230,832 $221,691 $202,999 $138,850 $140,029 $127,580
Table S10. Nine-month Salaries, 17 Responses of US CS Private With 15 < Tenure-Track Faculty <=30, Percentiles from Department Averages
Full Professor Associate Assistant Non-Tenure Track
In rank 16+ yrs
In rank 8-15 yrs
In rank 0-7 years
All years in rank
In rank 8+ years
In rank 0-7 years
All years in rank
Teach Research Postdoc
N Depts 17 17 15 17 12 16 17 17 13 6 6
N Indiv 76 59 66 203 24 57 82 116 66 20 44
10 %tile $152,479 $158,077 $147,277 $159,857 $108,325 $114,149 $113,117 $104,671 $85,341
25 %tile $169,125 $169,125 $150,556 $175,061 $110,660 $125,233 $117,360 $107,023 $86,851
50 %tile $201,011 $194,022 $161,523 $188,398 $115,178 $134,383 $131,057 $112,742 $103,335 $94,405 $63,942
75 %tile $223,616 $207,367 $180,464 $192,595 $126,748 $138,670 $140,429 $120,333 $120,000
90 %tile $234,489 $211,130 $191,909 $215,938 $135,351 $156,720 $150,418 $130,339 $122,365
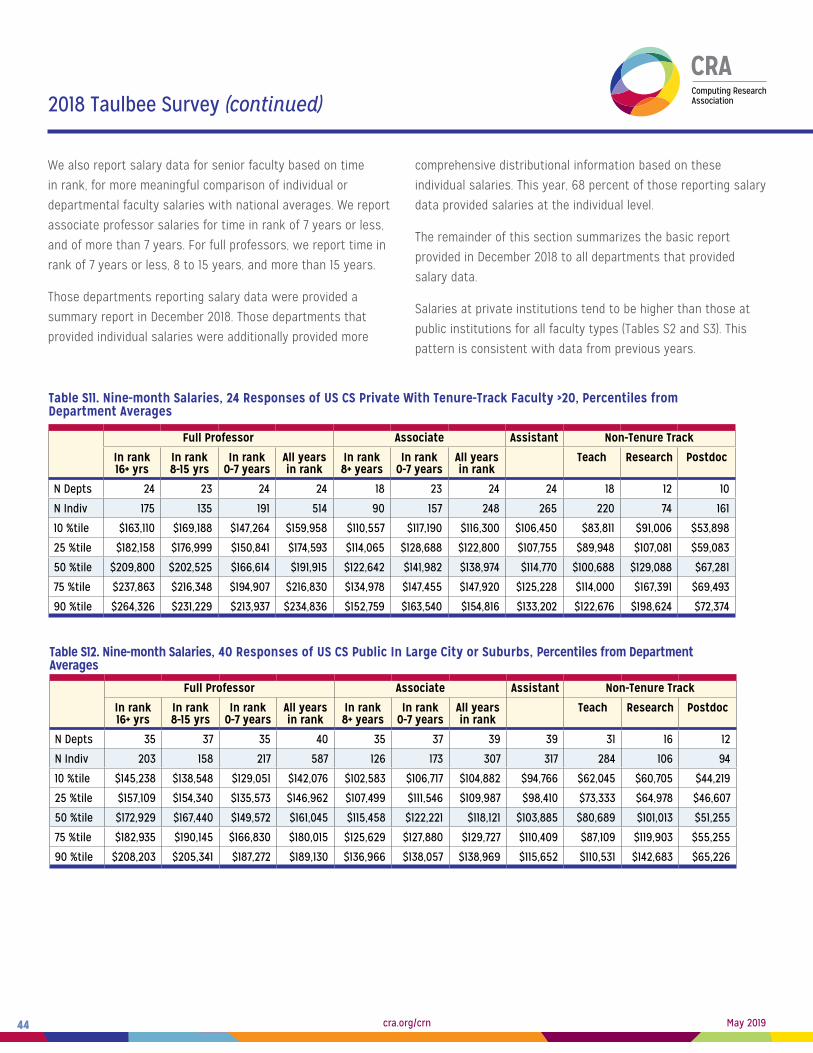
cra.org/crn44 May 2019
2018 Taulbee Survey (continued)
We also report salary data for senior faculty based on time
in rank, for more meaningful comparison of individual or
departmental faculty salaries with national averages. We report
associate professor salaries for time in rank of 7 years or less,
and of more than 7 years. For full professors, we report time in
rank of 7 years or less, 8 to 15 years, and more than 15 years.
Those departments reporting salary data were provided a
summary report in December 2018. Those departments that
provided individual salaries were additionally provided more
comprehensive distributional information based on these
individual salaries. This year, 68 percent of those reporting salary
data provided salaries at the individual level.
The remainder of this section summarizes the basic report
provided in December 2018 to all departments that provided
salary data.
Salaries at private institutions tend to be higher than those at
public institutions for all faculty types (Tables S2 and S3). This
pattern is consistent with data from previous years.
Table S11. Nine-month Salaries, 24 Responses of US CS Private With Tenure-Track Faculty >20, Percentiles from Department Averages
Full Professor Associate Assistant Non-Tenure Track
In rank 16+ yrs
In rank 8-15 yrs
In rank 0-7 years
All years in rank
In rank 8+ years
In rank 0-7 years
All years in rank
Teach Research Postdoc
N Depts 24 23 24 24 18 23 24 24 18 12 10
N Indiv 175 135 191 514 90 157 248 265 220 74 161
10 %tile $163,110 $169,188 $147,264 $159,958 $110,557 $117,190 $116,300 $106,450 $83,811 $91,006 $53,898
25 %tile $182,158 $176,999 $150,841 $174,593 $114,065 $128,688 $122,800 $107,755 $89,948 $107,081 $59,083
50 %tile $209,800 $202,525 $166,614 $191,915 $122,642 $141,982 $138,974 $114,770 $100,688 $129,088 $67,281
75 %tile $237,863 $216,348 $194,907 $216,830 $134,978 $147,455 $147,920 $125,228 $114,000 $167,391 $69,493
90 %tile $264,326 $231,229 $213,937 $234,836 $152,759 $163,540 $154,816 $133,202 $122,676 $198,624 $72,374
Table S12. Nine-month Salaries, 40 Responses of US CS Public In Large City or Suburbs, Percentiles from Department Averages
Full Professor Associate Assistant Non-Tenure Track
In rank 16+ yrs
In rank 8-15 yrs
In rank 0-7 years
All years in rank
In rank 8+ years
In rank 0-7 years
All years in rank
Teach Research Postdoc
N Depts 35 37 35 40 35 37 39 39 31 16 12
N Indiv 203 158 217 587 126 173 307 317 284 106 94
10 %tile $145,238 $138,548 $129,051 $142,076 $102,583 $106,717 $104,882 $94,766 $62,045 $60,705 $44,219
25 %tile $157,109 $154,340 $135,573 $146,962 $107,499 $111,546 $109,987 $98,410 $73,333 $64,978 $46,607
50 %tile $172,929 $167,440 $149,572 $161,045 $115,458 $122,221 $118,121 $103,885 $80,689 $101,013 $51,255
75 %tile $182,935 $190,145 $166,830 $180,015 $125,629 $127,880 $129,727 $110,409 $87,109 $119,903 $55,255
90 %tile $208,203 $205,341 $187,272 $189,130 $136,966 $138,057 $138,969 $115,652 $110,531 $142,683 $65,226

cra.org/crn45 May 2019
2018 Taulbee Survey (continued)
Table S13. Nine-month Salaries, 25 Responses of US CS Public In Midsize City or Suburbs, Percentiles from Department Averages
Full Professor Associate Assistant Non-Tenure Track
In rank 16+ yrs
In rank 8-15 yrs
In rank 0-7 years
All years in rank
In rank 8+ years
In rank 0-7 years
All years in rank
Teach Research Postdoc
Depts N Depts 20 19 23 22 23 25 24 17 6 5
Indiv N Indiv 145 99 142 70 94 173 219 148 44 31
10 10 %tile $143,543 $119,399 $126,692 $104,996 $106,886 $104,447 $93,677 $59,393
25 25 %tile $152,744 $143,082 $143,172 $107,030 $111,964 $111,728 $96,638 $65,979
50 50 %tile $166,452 $155,124 $153,731 $114,370 $123,552 $118,445 $103,880 $82,261 $92,122 $53,333
75 75 %tile $192,332 $181,283 $170,744 $128,027 $131,897 $132,649 $113,291 $91,257
90 90 %tile $203,406 $197,327 $195,309 $140,314 $137,074 $140,745 $122,732 $112,117
Table S14. Nine-month Salaries, 37 Responses of US CS Public in Small City, Town, or Rural, Percentiles from Department Averages
Full Professor Associate Assistant Non-Tenure Track
In rank 16+ yrs
In rank 8-15 yrs
In rank 0-7 years
All years in rank
In rank 8+ years
In rank 0-7 years
All years in rank
Teach Research Postdoc
N Depts 31 32 33 37 31 31 36 37 31 8 11
N Indiv 164 143 150 500 117 114 241 337 239 29 48
10 %tile $123,666 $126,338 $117,377 $123,833 $99,112 $102,112 $99,585 $86,693 $64,548 $40,875
25 %tile $134,573 $139,999 $127,598 $133,321 $99,934 $106,939 $103,612 $94,184 $69,459 $65,991 $47,455
50 %tile $146,266 $154,023 $143,268 $149,333 $109,519 $119,199 $112,667 $99,623 $76,685 $70,405 $55,000
75 %tile $181,701 $172,740 $164,457 $170,928 $122,263 $125,723 $123,245 $106,236 $87,401 $78,129 $62,556
90 %tile $189,575 $195,153 $175,733 $183,519 $137,320 $130,600 $133,355 $113,004 $96,643 $65,167
Table S15. Nine-month Salaries, 24 Responses of US CS Private in Large City or Suburbs, Percentiles from Department Averages
Full Professor Associate Assistant Non-Tenure Track
In rank 16+ yrs
In rank 8-15 yrs
In rank 0-7 years
All years in rank
In rank 8+ years
In rank 0-7 years
All years in rank
Teach Research Postdoc
N Depts 24 21 22 24 20 24 24 24 16 11 8
N Indiv 132 110 158 411 90 135 226 222 215 80 116
10 %tile $139,259 $136,160 $146,188 $134,887 $108,063 $113,875 $111,196 $98,951 $85,959 $88,750
25 %tile $167,001 $169,125 $153,946 $166,139 $111,648 $125,810 $119,971 $107,472 $92,771 $90,000 $65,434
50 %tile $202,240 $194,022 $170,070 $188,729 $120,587 $135,890 $132,865 $115,267 $103,413 $109,421 $67,576
75 %tile $229,346 $218,407 $184,647 $197,232 $133,734 $143,672 $142,403 $123,647 $112,949 $138,577 $70,325
90 %tile $251,053 $225,675 $204,758 $227,502 $148,890 $162,769 $154,537 $133,202 $120,563 $161,388
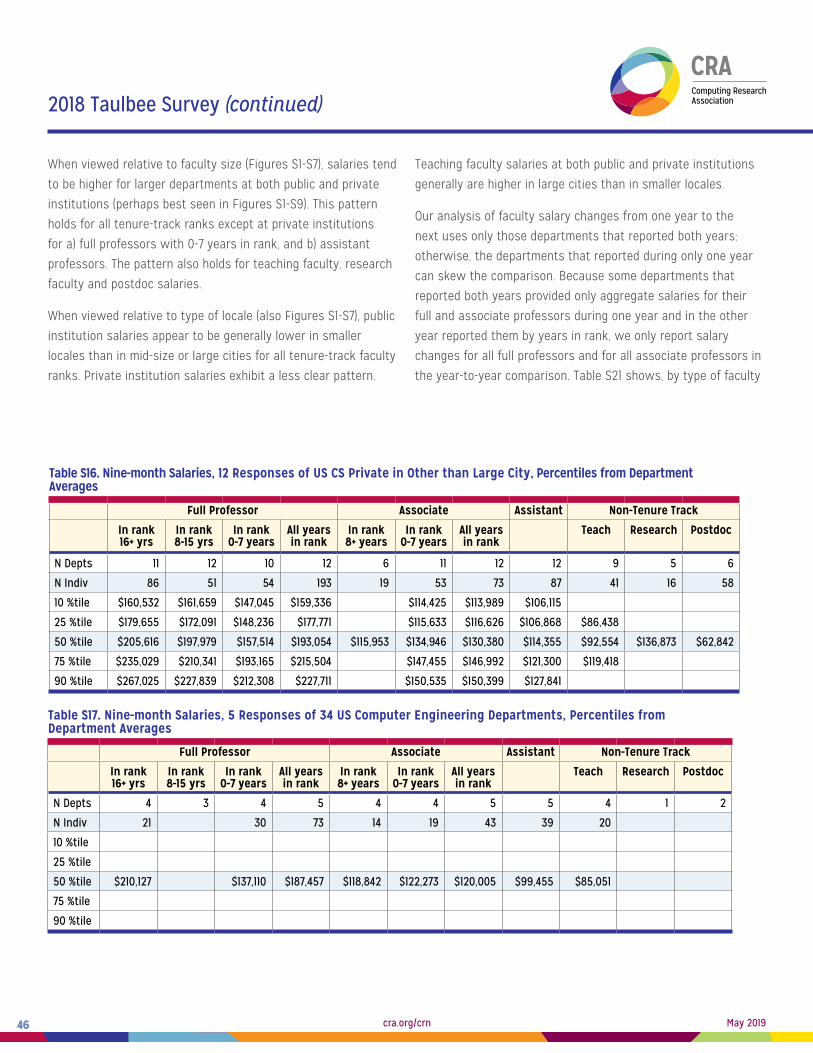
cra.org/crn46 May 2019
2018 Taulbee Survey (continued)
When viewed relative to faculty size (Figures S1-S7), salaries tend
to be higher for larger departments at both public and private
institutions (perhaps best seen in Figures S1-S9). This pattern
holds for all tenure-track ranks except at private institutions
for a) full professors with 0-7 years in rank, and b) assistant
professors. The pattern also holds for teaching faculty, research
faculty and postdoc salaries.
When viewed relative to type of locale (also Figures S1-S7), public
institution salaries appear to be generally lower in smaller
locales than in mid-size or large cities for all tenure-track faculty
ranks. Private institution salaries exhibit a less clear pattern.
Teaching faculty salaries at both public and private institutions
generally are higher in large cities than in smaller locales.
Our analysis of faculty salary changes from one year to the
next uses only those departments that reported both years;
otherwise, the departments that reported during only one year
can skew the comparison. Because some departments that
reported both years provided only aggregate salaries for their
full and associate professors during one year and in the other
year reported them by years in rank, we only report salary
changes for all full professors and for all associate professors in
the year-to-year comparison. Table S21 shows, by type of faculty
Table S16. Nine-month Salaries, 12 Responses of US CS Private in Other than Large City, Percentiles from Department Averages
Full Professor Associate Assistant Non-Tenure Track
In rank 16+ yrs
In rank 8-15 yrs
In rank 0-7 years
All years in rank
In rank 8+ years
In rank 0-7 years
All years in rank
Teach Research Postdoc
N Depts 11 12 10 12 6 11 12 12 9 5 6
N Indiv 86 51 54 193 19 53 73 87 41 16 58
10 %tile $160,532 $161,659 $147,045 $159,336 $114,425 $113,989 $106,115
25 %tile $179,655 $172,091 $148,236 $177,771 $115,633 $116,626 $106,868 $86,438
50 %tile $205,616 $197,979 $157,514 $193,054 $115,953 $134,946 $130,380 $114,355 $92,554 $136,873 $62,842
75 %tile $235,029 $210,341 $193,165 $215,504 $147,455 $146,992 $121,300 $119,418
90 %tile $267,025 $227,839 $212,308 $227,711 $150,535 $150,399 $127,841
Table S17. Nine-month Salaries, 5 Responses of 34 US Computer Engineering Departments, Percentiles from Department Averages
Full Professor Associate Assistant Non-Tenure Track
In rank 16+ yrs
In rank 8-15 yrs
In rank 0-7 years
All years in rank
In rank 8+ years
In rank 0-7 years
All years in rank
Teach Research Postdoc
N Depts 4 3 4 5 4 4 5 5 4 1 2
N Indiv 21 30 73 14 19 43 39 20
10 %tile
25 %tile
50 %tile $210,127 $137,110 $187,457 $118,842 $122,273 $120,005 $99,455 $85,051
75 %tile
90 %tile

cra.org/crn47 May 2019
2018 Taulbee Survey (continued)
Table S18. Nine-month Salaries, 14 Responses of 24 US Information Departments, Percentiles from Department Averages
Full Professor Associate Assistant Non-Tenure Track
In rank 16+ yrs
In rank 8-15 yrs
In rank 0-7 years
All years in rank
In rank 8+ years
In rank 0-7 years
All years in rank
Teach Research Postdoc
N Depts 12 13 13 15 11 15 15 15 14 6 4
N Indiv 39 67 74 180 46 95 141 152 136 17 21
10 %tile $165,441 $139,701 $127,227 $143,920 $98,686 $110,052 $104,163 $92,103 $74,280
25 %tile $170,298 $150,468 $143,268 $151,474 $108,568 $111,458 $113,355 $96,135 $84,284
50 %tile $179,881 $164,693 $154,346 $167,021 $114,357 $121,865 $121,865 $102,068 $86,740 $75,766 $49,327
75 %tile $191,765 $177,900 $159,591 $171,907 $129,690 $131,817 $132,926 $108,064 $93,695
90 %tile $250,665 $193,010 $168,203 $186,626 $135,911 $142,995 $143,421 $120,062 $109,287
Table S19. Twelve-month Salaries, 8 Responses of 30 Canadian Departments, Percentiles from Department Averages
Full Professor Associate Assistant Non-Tenure Track
In rank 16+ yrs
In rank 8-15 yrs
In rank 0-7 years
All years in rank
In rank 8+ years
In rank 0-7 years
All years in rank
Teach Research Postdoc
N Depts 8 8 8 8 7 7 8 8 7 3 5
N Indiv 56 46 56 158 58 32 90 64 91 52
10 %tile
25 %tile $181,064 $178,746 $152,696 $179,134 $142,086 $120,472 $134,124 $105,388 $89,926
50 %tile $205,021 $193,693 $167,590 $183,085 $154,037 $134,534 $145,892 $122,762 $113,048 $58,790
75 %tile $221,656 $206,743 $197,396 $206,835 $162,342 $158,567 $157,724 $131,620 $127,862
90 %tile
Table S20. Nine-month Salaries for New PhDs (Twelve-month for Canadian)
US (CS, CE, and Info Combined) Canadian
Tenure-Track Non-ten Teaching
Non-ten Research
Postdoc Tenure-Track Non-ten Teaching
Non-ten Research
Postdoc
Depts 84 22 4 24 3 1 0 2
Indiv 200 37 7 102 22 2 19
10 $92,145 $62,434 $44,858
25 $98,000 $65,000 $45,625
50 $106,672 $75,000 $90,000 $52,140
75 $112,995 $94,000 $64,500
90 $120,400 $107,000 $73,205

cra.org/crn48 May 2019
2018 Taulbee Survey (continued)
Table S21. Change in Salary Median for Departments that Reported in Both 2017 and 2018
US CS (130) US CE (5) US IN (13) Canadian (8)
Full Profs 3.1% 4.9% 2.8% 2.7%
Assoc. Profs. 2.0% 5.8% 2.8% -3.5%
Asst. Profs. 2.5% 2.5% 1.8% -1.7%
Non-ten-track teaching faculty 2.2% -8.4% -2.7%
Research faculty -2.4% 11.1% 8.3% 10.4%
Post doctorates -1.6% 6.8% -10.8% 5.9%
and type of department, the change in the median of the average
salaries from departments that reported both years (the number
of departments being compared is indicated in parentheses in
each column heading). Using the cell showing full professors at
U.S. CS departments as an example, the table indicates that the
median of the 130 average salaries for full professors was 3.1
percent higher in 2018 than was the median of the average full
professor salaries in 2017 from these same 130 departments.
When interpreting these changes, it is important to remember
the effect that promotions have on the departmental data from
one year to the next, since a promotion causes an individual
faculty member to move from one rank to another. Thus, a
department with a small number of faculty members in a
particular rank can have its average salary in that rank change
appreciably (in either direction) by a single promotion to or from
that rank. Departures via resignation or retirement also impact
Table S1a. Nine-Month Salaries for Teaching Faculty, 138 Responses of 195 US CS Departments, Percentiles from Department Averages
Teaching Professor Other Instructor
Teaching 9+ Years
Teaching 6-8 Years
Teaching 3-5 Years
Teaching <3 Years
All Years Teaching 9+ Years
Teaching 6-8 Years
Teaching 3-5 Years
Teaching <3 Years
All Years
N Depts 33 25 41 50 73 31 15 26 33 60
N Indiv 86 43 96 142 506 83 32 77 90 421
10 %tile $65,790 $71,406 $72,578 $61,813 $67,013 $60,220 $59,806 $60,594 $60,200 $60,725
25 %tile $84,556 $81,125 $78,000 $74,621 $78,480 $69,494 $61,214 $63,423 $66,667 $67,144
50 %tile $95,645 $92,002 $82,629 $83,762 $86,578 $81,568 $68,161 $68,213 $74,880 $74,297
75 %tile $118,857 $107,438 $102,540 $97,715 $100,144 $92,139 $92,446 $82,491 $85,170 $84,721
90 %tile $138,330 $119,483 $112,653 $115,018 $120,900 $118,140 $115,357 $95,750 $99,629 $103,686
Table S2a. Nine-Month Salaries for Teaching Faculty, 102 Responses of 142 US CS Public (All Public), Percentiles from Department Averages
Teaching Professor Other Instructor
Teaching 9+ Years
Teaching 6-8 Years
Teaching 3-5 Years
Teaching <3 Years
All Years Teaching 9+ Years
Teaching 6-8 Years
Teaching 3-5 Years
Teaching <3 Years
All Years
N Depts 24 15 29 37 53 27 12 21 26 49
N Indiv 50 22 65 98 344 76 28 60 74 327
10 %tile $62,174 $63,849 $71,769 $60,840 $64,547 $59,724 $60,043 $60,000 $59,655 $60,063
25 %tile $79,053 $77,260 $78,000 $69,576 $76,898 $68,448 $61,609 $63,018 $63,046 $66,486
50 %tile $86,324 $82,446 $79,866 $77,000 $83,378 $79,940 $65,911 $67,097 $69,280 $71,793
75 %tile $100,061 $94,501 $98,623 $89,044 $94,082 $91,608 $85,001 $77,417 $82,035 $80,852
90 %tile $120,089 $105,652 $114,414 $101,650 $114,531 $97,290 $97,529 $83,586 $88,206 $91,046

cra.org/crn49 May 2019
2018 Taulbee Survey (continued)
Table S3a. Nine-Month Salaries for Teaching Faculty, 36 Responses of 53 US CS Private (All Private), Percentiles from Department Averages
Teaching Professor Other Instructor
Teaching 9+ Years
Teaching 6-8 Years
Teaching 3-5 Years
Teaching <3 Years
All Years Teaching 9+ Years
Teaching 6-8 Years
Teaching 3-5 Years
Teaching <3 Years
All Years
N Depts 9 10 12 13 20 4 3 5 7 11
N Indiv 36 21 31 44 162 7 17 16 94
10 %tile $83,545 $72,987 $84,508 $83,877 $67,600
25 %tile $102,157 $93,668 $83,429 $87,539 $89,512 $83,185 $81,132
50 %tile $125,881 $103,719 $99,341 $96,444 $100,905 $104,474 $95,495 $89,053 $91,440
75 %tile $146,369 $111,370 $108,535 $113,388 $120,281 $98,804 $100,688
90 %tile $125,895 $111,252 $116,480 $133,575 $108,523
Table S4a. Nine-Month Salaries for Teaching Faculty, 22 Responses of US CS Public With <=15 Tenure-Track Faculty, Percentiles from Department Averages
Teaching Professor Other Instructor
Teaching 9+ Years
Teaching 6-8 Years
Teaching 3-5 Years
Teaching <3 Years
All Years Teaching 9+ Years
Teaching 6-8 Years
Teaching 3-5 Years
Teaching <3 Years
All Years
N Depts 2 3 2 9 10 5 1 5 7 10
N Indiv 21 30 8 8 14 39
10 %tile $56,900 $56,581
25 %tile $63,000 $63,307 $59,000 $61,062
50 %tile $65,813 $66,114 $70,468 $65,943 $62,000 $66,233
75 %tile $70,000 $77,394 $65,000 $70,222
90 %tile $83,438 $72,278
Table S5a. Nine-Month Salaries for Teaching Faculty, 29 Responses of US CS Public With 10 < Tenure-Track Faculty <=20, Percentiles from Department Averages
Teaching Professor Other Instructor
Teaching 9+ Years
Teaching 6-8 Years
Teaching 3-5 Years
Teaching <3 Years
All Years Teaching 9+ Years
Teaching 6-8 Years
Teaching 3-5 Years
Teaching <3 Years
All Years
N Depts 6 3 4 10 11 7 1 8 8 12
N Indiv 6 5 21 35 13 13 18 53
10 %tile $52,400 $56,207 $57,128
25 %tile $60,150 $60,069 $58,795 $62,780 $60,000 $60,131
50 %tile $83,429 $74,016 $63,858 $65,822 $60,220 $67,427 $62,667 $64,022
75 %tile $77,500 $81,988 $90,267 $69,218 $67,842 $70,060
90 %tile $84,633 $84,986 $76,163

cra.org/crn50 May 2019
2018 Taulbee Survey (continued)
these figures, particularly in the non-tenure-track categories.
Because of the small number of Canadian, CE, and I departments
reporting, the values in those columns are considerably more
volatile; this is evident in several of the entries in Table S21.
For new Ph.D.s in tenure-track positions at U.S. CS, CE, and I
school departments (Table S20) the median of the averages was
$106,672, an increase of 4.1 percent vs. last year. There was an
insufficient response from Canadian institutions to report any
results regarding Canadian salaries for new Ph.Ds.
This year, for the first time, we requested salaries for non-
tenure-track teaching faculty separated into two classifications:
Teaching Professors and Other Instructors, as described above.
The salary data was further divided by years teaching at their
current institution. The data for both classifications and all year
ranges have been merged into a single “Teaching Faculty” entry
in the main salary tables for comparability with previous years.
This report adds figures showing box and whisker plots for all
years combined for Teaching Professors (Figure S7a) and Other
Table S6a. Nine-Month Salaries for Teaching Faculty, 28 Responses of US CS Public With 15 < Tenure-Track Faculty <=25, Percentiles from Department Average
Teaching Professor Other Instructor
Teaching 9+ Years
Teaching 6-8 Years
Teaching 3-5 Years
Teaching <3 Years
All Years Teaching 9+ Years
Teaching 6-8 Years
Teaching 3-5 Years
Teaching <3 Years
All Years
N Depts 7 2 6 8 9 7 2 5 5 9
N Indiv 9 10 22 43 16 8 12 47
10 %tile
25 %tile $77,064 $60,900 $69,435 $62,788 $62,046
50 %tile $81,853 $75,929 $68,199 $74,700 $65,657 $67,514 $75,000 $67,372
75 %tile $92,483 $78,421 $78,739 $70,119 $79,155
90 %tile
Table S7a. Nine-Month Salaries for Teaching Faculty, 33 Responses of US CS Public With 20 < Tenure-Track Faculty <=35, Percentiles from Department Averages
Teaching Professor Other Instructor
Teaching 9+ Years
Teaching 6-8 Years
Teaching 3-5 Years
Teaching <3 Years
All Years Teaching 9+ Years
Teaching 6-8 Years
Teaching 3-5 Years
Teaching <3 Years
All Years
N Depts 7 4 8 10 16 11 5 8 8 17
N Indiv 11 6 18 36 120 24 9 17 17 82
10 %tile $73,145 $75,590 $65,657 $59,405
25 %tile $81,760 $75,536 $75,267 $77,215 $70,119 $60,891 $67,157 $67,372
50 %tile $86,640 $91,276 $78,179 $77,875 $79,448 $81,000 $63,660 $63,679 $72,500 $75,000
75 %tile $105,260 $79,119 $81,050 $96,813 $90,094 $69,990 $85,353 $81,034
90 %tile $87,697 $109,258 $99,920 $92,087

cra.org/crn51 May 2019
2018 Taulbee Survey (continued)
Table S8a. Nine-Month Salaries for Teaching Faculty, 44 Responses of US CS Public With Tenure-Track Faculty >30, Percentiles from Department Averages
Teaching Professor Other Instructor
Teaching 9+ Years
Teaching 6-8 Years
Teaching 3-5 Years
Teaching <3 Years
All Years Teaching 9+ Years
Teaching 6-8 Years
Teaching 3-5 Years
Teaching <3 Years
All Years
N Depts 13 8 17 16 29 11 8 7 12 25
N Indiv 36 12 45 41 238 44 22 38 43 220
10 %tile $61,937 $77,913 $76,000 $81,451 $70,781 $63,480 $63,247
25 %tile $84,556 $82,511 $79,250 $83,238 $84,929 $76,761 $66,622 $64,834 $68,357 $68,519
50 %tile $88,233 $94,501 $91,787 $89,542 $93,348 $86,320 $78,180 $67,097 $74,440 $74,593
75 %tile $118,857 $103,813 $112,624 $101,504 $100,869 $94,258 $89,269 $80,718 $84,850 $85,816
90 %tile $133,263 $126,232 $116,953 $120,292 $156,639 $89,500 $100,472
Table S9a. Nine-Month Salaries for Teaching Faculty, 12 Responses of US CS Private With <=20 Tenure-Track Faculty, Percentiles from Department Averages
Teaching Professor Other Instructor
Teaching 9+ Years
Teaching 6-8 Years
Teaching 3-5 Years
Teaching <3 Years
All Years Teaching 9+ Years
Teaching 6-8 Years
Teaching 3-5 Years
Teaching <3 Years
All Years
N Depts 2 3 4 3 6 1 1 0 1 1
N Indiv 10 32
10 %tile
25 %tile
50 %tile $92,382 $93,261
75 %tile
90 %tile
Table S10a. Nine-Month Salaries for Teaching Faculty, 17 Responses of US CS Private With 15 < Tenure-Track Faculty <=30, Percentiles from Department Averages
Teaching Professor Other Instructor
Teaching 9+ Years
Teaching 6-8 Years
Teaching 3-5 Years
Teaching <3 Years
All Years Teaching 9+ Years
Teaching 6-8 Years
Teaching 3-5 Years
Teaching <3 Years
All Years
N Depts 6 5 7 7 11 3 2 2 3 5
N Indiv 11 9 11 14 51 15
10 %tile $85,067
25 %tile $79,909 $86,040 $88,329
50 %tile $110,267 $100,000 $93,017 $88,203 $103,335 $81,384
75 %tile $103,144 $109,194 $120,563
90 %tile $137,557

cra.org/crn52 May 2019
2018 Taulbee Survey (continued)
Table S11a. Nine-Month Salaries for Teaching Faculty, 24 Responses of US CS Private With Tenure-Track Faculty >20, Percentiles from Department Averages
Teaching Professor Other Instructor
Teaching 9+ Years
Teaching 6-8 Years
Teaching 3-5 Years
Teaching <3 Years
All Years Teaching 9+ Years
Teaching 6-8 Years
Teaching 3-5 Years
Teaching <3 Years
All Years
N Depts 7 7 8 10 14 3 2 5 6 10
N Indiv 31 16 21 37 130 17 15 90
10 %tile $84,260 $86,489 $67,340
25 %tile $122,129 $98,212 $88,005 $87,705 $92,916 $81,006
50 %tile $127,265 $107,438 $101,655 $93,946 $108,471 $95,495 $90,247 $90,260
75 %tile $148,185 $118,199 $108,535 $103,250 $123,467 $97,625
90 %tile $118,319 $136,230 $103,994
Table S12a. Nine-Month Salaries for Teaching Faculty, 40 Responses of US CS Public In Large City or Suburbs, Percentiles from Department Averages
Teaching Professor Other Instructor
Teaching 9+ Years
Teaching 6-8 Years
Teaching 3-5 Years
Teaching <3 Years
All Years Teaching 9+ Years
Teaching 6-8 Years
Teaching 3-5 Years
Teaching <3 Years
All Years
N Depts 13 9 12 17 21 11 6 8 7 17
N Indiv 28 14 35 42 156 25 10 20 18 128
10 %tile $80,214 $76,168 $68,040 $76,479 $68,376 $60,901
25 %tile $84,693 $81,125 $78,363 $75,000 $78,739 $70,191 $61,847 $60,500 $67,372
50 %tile $99,515 $90,520 $81,248 $80,200 $83,572 $89,290 $65,450 $63,093 $62,950 $73,865
75 %tile $110,559 $97,000 $89,322 $90,040 $88,365 $93,754 $70,437 $81,150 $83,188
90 %tile $120,265 $110,540 $116,599 $110,531 $156,639 $116,242
Table S13a. Nine-Month Salaries for Teaching Faculty, 25 Responses of US CS Public In Midsize City or Suburbs, Percentiles from Department Averages
Teaching Professor Other Instructor
Teaching 9+ Years
Teaching 6-8 Years
Teaching 3-5 Years
Teaching <3 Years
All Years Teaching 9+ Years
Teaching 6-8 Years
Teaching 3-5 Years
Teaching <3 Years
All Years
N Depts 4 2 5 4 9 5 2 3 8 11
N Indiv 12 10 14 64 19 23 84
10 %tile $58,276
25 %tile $72,762 $68,333 $63,244
50 %tile $82,867 $78,357 $58,000 $84,929 $65,657 $74,500 $75,000
75 %tile $100,144 $84,263 $83,308
90 %tile $90,993

cra.org/crn53 May 2019
2018 Taulbee Survey (continued)
Instructors (Figure S7b). In addition, there are supplemental
salary tables S1a – S19a that show the year-band breakdowns for
each group. The salaries for the two categories show expected
patterns: In general, salaries are higher for Teaching Professors
than for Other Instructors (more so at private and large public
institutions than at smaller public institutions), higher at private
than at public institutions, and higher with increased years of
teaching at the institution.
We may adjust the “years teaching” bands to broader year
groupings for next year’s data collection to reduce the number of
cells with insufficient data to report.
Table S14a. Nine-Month Salaries for Teaching Faculty, 37 Responses of US CS Public in Small City, Town, or Rural, Percentiles from Department Averages
Teaching Professor Other Instructor
Teaching 9+ Years
Teaching 6-8 Years
Teaching 3-5 Years
Teaching <3 Years
All Years Teaching 9+ Years
Teaching 6-8 Years
Teaching 3-5 Years
Teaching <3 Years
All Years
N Depts 7 4 12 16 23 11 4 10 11 21
N Indiv 10 6 20 42 124 32 9 22 33 115
10 %tile $73,950 $64,161 $65,939 $58,609 $63,772 $62,000 $62,000
25 %tile $68,472 $78,928 $68,635 $72,138 $70,625 $66,083 $67,459 $66,616
50 %tile $81,853 $72,249 $82,048 $78,034 $82,000 $76,040 $67,692 $68,004 $68,483 $70,500
75 %tile $85,823 $101,354 $90,998 $91,912 $82,826 $75,307 $73,124 $76,648
90 %tile $130,651 $100,868 $100,654 $92,307 $82,664 $101,676 $81,034
Table S15a. Nine-Month Salaries for Teaching Faculty, 24 Responses of US CS Private in Large City or Suburbs, Percentiles from Department Averages
Teaching Professor Other Instructor
Teaching 9+ Years
Teaching 6-8 Years
Teaching 3-5 Years
Teaching <3 Years
All Years Teaching 9+ Years
Teaching 6-8 Years
Teaching 3-5 Years
Teaching <3 Years
All Years
N Depts 8 7 8 9 12 2 2 4 4 6
N Indiv 34 14 23 36 130 16 13 85
10 %tile $87,566
25 %tile $100,529 $101,931 $95,148 $96,444 $96,923
50 %tile $122,129 $110,147 $101,655 $105,000 $108,471 $95,750 $97,610 $97,366
75 %tile $132,041 $118,199 $109,156 $115,000 $120,281
90 %tile $123,936
Table S16a. Nine-Month Salaries for Teaching Faculty, 12 Responses of US CS Private in Other than Large City, Percentiles from Department Averages
Teaching Professor Other Instructor
Teaching 9+ Years
Teaching 6-8 Years
Teaching 3-5 Years
Teaching <3 Years
All Years Teaching 9+ Years
Teaching 6-8 Years
Teaching 3-5 Years
Teaching <3 Years
All Years
N Depts 1 3 4 4 8 2 1 1 3 5
N Indiv 8 8 32 9
10 %tile
25 %tile $84,760
50 %tile $83,090 $86,372 $91,181 $81,384
75 %tile $108,245
90 %tile

cra.org/crn54 May 2019
2018 Taulbee Survey (continued)
Table S17a. Nine-Month Salaries for Teaching Faculty, 5 Responses of 34 US Computer Engineering Departments, Percentiles from Department Average
Teaching Professor Other Instructor
Teaching 9+ Years
Teaching 6-8 Years
Teaching 3-5 Years
Teaching <3 Years
All Years Teaching 9+ Years
Teaching 6-8 Years
Teaching 3-5 Years
Teaching <3 Years
All Years
N Depts 2 1 2 3 4 1 0 1 1 2
N Indiv 16
10 %tile
25 %tile
50 %tile $86,500
75 %tile
90 %tile
Table S18a. Nine-Month Salaries for Teaching Faculty, 14 Responses of 24 US Information Departments, Percentiles from Department Averages
Teaching Professor Other Instructor
Teaching 9+ Years
Teaching 6-8 Years
Teaching 3-5 Years
Teaching <3 Years
All Years Teaching 9+ Years
Teaching 6-8 Years
Teaching 3-5 Years
Teaching <3 Years
All Years
N Depts 6 1 5 6 10 4 4 4 7 8
N Indiv 15 15 15 73 12 8 19 24 63
10 %tile $73,015
25 %tile $83,965 $81,045 $84,970
50 %tile $99,702 $98,322 $84,604 $90,904 $94,418 $75,010 $91,759 $84,975 $87,837
75 %tile $98,952 $91,334 $94,410
90 %tile $115,124
Table S19a. Twelve-month Salaries for Teaching Faculty, 8 Responses of 30 Canadian Departments, Percentiles from Department Averages
Teaching Professor Other Instructor
Teaching 9+ Years
Teaching 6-8 Years
Teaching 3-5 Years
Teaching <3 Years
All Years Teaching 9+ Years
Teaching 6-8 Years
Teaching 3-5 Years
Teaching <3 Years
All Years
N Depts 5 1 3 2 6 1 1 2 1 5
N Indiv 25 54 37
10 %tile
25 %tile
50 %tile $138,453 $125,779 $84,780
75 %tile
90 %tile

cra.org/crn55 May 2019
2018 Taulbee Survey (continued)
Figure S1. US CS Department Average Salary, Full Professor in Rank 16+ Years
CRA Taulbee Survey 2018
Figure S2. US CS Department Average Salary, Full Professor in Rank 8-15 Years
CRA Taulbee Survey 2018

cra.org/crn56 May 2019
2018 Taulbee Survey (continued)
Figure S3. US CS Department Average Salary, Full Professor in Rank 0-7 Years
CRA Taulbee Survey 2018
Figure S4. US CS Department Average Salary, Associate Professor in Rank 8+ Years
CRA Taulbee Survey 2018

cra.org/crn57 May 2019
2018 Taulbee Survey (continued)
Figure S5. US CS Department Average Salary, Associate Professor in Rank 0-7 Years
CRA Taulbee Survey 2018
Figure S6. US CS Department Average Salary, Assistant Professor
CRA Taulbee Survey 2018

cra.org/crn58 May 2019
2018 Taulbee Survey (continued)
Figure S7. US CS Department Average Salary, Non-Tenure Track Teaching Faculty
CRA Taulbee Survey 2018
Figure S7a. US CS Department Average Salary, Teaching Professors
CRA Taulbee Survey 2018

cra.org/crn59 May 2019
2018 Taulbee Survey (continued)
Figure S8. US CS Department Average Salary, Non-Tenure Track Research Faculty
CRA Taulbee Survey 2018
Figure S7b. US CS Department Average Salary, Other Instructors
CRA Taulbee Survey 2018

cra.org/crn60 May 2019
2018 Taulbee Survey (continued)
Figure S9. US CS Department Average Salary, Postdoctorates
CRA Taulbee Survey 2018
Department ProfilesEvery three years, the Taulbee Survey collects data about
elements of departmental activities that are not expected
to change much from year to year. Included are data about
teaching loads, sources of external funding, methods of
recruiting graduate students, space, and department support
staff. The most recent prior data about these activities were
reported in the 2015 Taulbee Survey. The results of that survey
are available on the CRA web site at https://cra.org/wp-content/uploads/2016/05/2015-Taulbee-Survey.pdf.
Teaching Loads (Tables Prof1-Prof4)
Across all departments, the median teaching load for tenure-
track faculty, as measured in semester courses per year, is 3.0.
This median has not changed in a long time. The median load at
public U.S. CS departments and at Canadian departments also is
3.0, and that for U.S. I departments is 3.5; each of these values is
unchanged from three years ago. The median load at private U.S.
CS departments is 2.0; it was 3.0 three years ago but was 2.0 six
years ago (Table Prof1a).
Teaching loads for Teaching Professors are contained in Table
Prof1b and for Other Instructors in Table Prof1c. At U.S. CS
departments at public institutions, the median load is 6.0 for
both categories of teaching faculty, while the median load in U.S.
CS departments at private institutions is between 5 and 6 for
each category. U.S. I departments have a median of 6.0 for the
Teaching Professors and 5.0 for Other Instructors.
Changes from the standard teaching load are possible for all
types of departments and both tenure-track and teaching
faculty. Reductions in load are possible in a greater percentage

cra.org/crn61 May 2019
2018 Taulbee Survey (continued)
Table Prof1a. Official Teaching Load of Tenured and Tenure-Track Faculty
Official Teaching Load* Academic Calendar
Department Type # Dept Minimum Mean Median Maximum # Dept Semester Quarter Other
US CS Public 92 1 3.2 3 8 94 83 11 0
US CS Private 28 0.7 2.5 2 4.1 30 24 5 1
US CE 3 3 3 0 0
US I 14 2 3.3 3.5 4 14 12 2 0
Canadian 8 2 3.1 3 4 9 8 0 1
Grand Total 145 0.7 3.1 3 8 150 130 18 2
* Teaching load is given for a semester calendar. Loads for a quarter system were multiplied by 2/3. To convert back to quarter-system equivalent, multiply these values by 1.5.
Table Prof1b. Official Teaching Load of Teaching Professors
Official Teaching Load* Academic Calendar
Department Type # Dept Minimum Mean Median Maximum # Dept Semester Quarter Other
US CS Public 64 1 5.5 6 12 94 83 11 0
US CS Private 22 2 5 5.7 8 30 24 5 1
US CE 2 3 3 0 0
US I 10 4 6.5 6 9 14 12 2 0
Canadian 4 9 8 0 1
Grand Total 102 1 5.4 6 12 150 130 18 2
* Teaching load is given for a semester calendar. Loads for a quarter system were multiplied by 2/3. To convert back to quarter-system equivalent, multiply these values by 1.5.
Table Prof1c. Official Teaching Load of Other Instructors
Official Teaching Load* Academic Calendar
Department Type # Dept Minimum Mean Median Maximum # Dept Semester Quarter Other
US CS Public 49 2 5.7 6 12 94 83 11 0
US CS Private 12 1 4.5 5.2 6 30 24 5 1
US CE 1 3 3 0 0
US I 9 1 4.8 5 8 14 12 2 0
Canadian 4 9 8 0 1
Grand Total 75 1 5.4 6 12 150 130 18 2
* Teaching load is given for a semester calendar. Loads for a quarter system were multiplied by 2/3. To convert back to quarter-system equivalent, multiply these values by 1.5.

cra.org/crn62 May 2019
2018 Taulbee Survey (continued)
Table Prof2. Faculty Load Reductions and Increases
% of Respondents Where Faculty Load Reduction Possible
% of Respondents Where Faculty Load Increase Possible
Department Type # Dept
Tenured/Tenure-Track
Teaching Professor
Other Instructor # Dept
Tenured/Tenure-Track
Teaching Professor
Other Instructor
US CS Public 95 98.9% 68.8% 50.0% 92 78.0% 53.6% 42.2%
US CS Private 31 93.5% 64.3% 30.0% 29 78.6% 28.0% 30.0%
US CE 3 100.0% 100.0% 0.0% 3 100.0% 50.0% 100.0%
US I 14 100.0% 100.0% 75.0% 12 58.3% 54.5% 22.2%
Canadian 9 100.0% 100.0% 66.7% 9 88.9% 28.6% 20.0%
Grand Total 152 98.0% 73.2% 48.6% 145 77.6% 46.5% 37.4%
Table Prof3a. Types of Load Reductions Possible in Departments Offering Reductions - Tenured/Tenure Track
Department Type # Dept
Special Package for New Faculty
Administrative Duties
Type or Size of Class Taught
Buy-out by % of salary
Buy-out by dollar amount
Strong Research
Involvement
Strong Course of
Curriculum Involvement
Other
US CS Public 102 79.4% 82.4% 42.2% 68.6% 13.7% 65.7% 44.1% 6.9%
US CS Private 34 67.6% 58.8% 17.6% 41.2% 2.9% 29.4% 23.5% 20.6%
US CE 3 100.0% 100.0% 66.7% 100.0% 0.0% 33.3% 33.3% 0.0%
US I 14 78.6% 85.7% 64.3% 42.9% 14.3% 35.7% 57.1% 14.3%
Canadian 10 90.0% 90.0% 10.0% 20.0% 10.0% 40.0% 40.0% 20.0%
Grand Total 163 77.9% 78.5% 37.4% 58.3% 11.0% 53.4% 40.5% 11.0%
Table Prof3b. Types of Load Reductions Possible in Departments Offering Reductions - Teaching Professors
Department Type # Dept
Special Package for New Faculty
Administrative Duties
Type or Size of Class Taught
Buy-out by % of salary
Buy-out by dollar amount
Strong Research
Involvement
Strong Course of
Curriculum Involvement
Other
US CS Public 102 30.4% 43.1% 33.3% 14.7% 2.% 16.7% 34.3% 2.%
US CS Private 34 23.5% 38.2% 11.8% 5.9% 0.% 2.9% 26.5% 8.8%
US CE 3 33.3% 33.3% 33.3% 33.3% 0.% 0.% 66.7% 0.%
US I 14 50.0% 71.4% 57.1% 35.7% 0.% 21.4% 57.1% 7.1%
Canadian 10 20.0% 70.0% 10.0% 0.% 0.% 0.% 30.% 10.%
Grand Total 163 30.1% 46.0% 29.4% 14.1% 1.2% 12.9% 35.% 4.3%

cra.org/crn63 May 2019
2018 Taulbee Survey (continued)
Table Prof3c. Types of Load Reductions Possible in Departments Offering Reductions - Other Instructors
Department Type # Dept
Special Package for New Faculty
Administrative Duties
Type or Size of Class Taught
Buy-out by % of salary
Buy-out by dollar amount
Strong Research
Involvement
Strong Course of
Curriculum Involvement
Other
US CS Public 102 12.7% 24.5% 21.6% 5.9% 0.0% 8.8% 20.6% 3.9%
US CS Private 34 0.0% 2.9% 2.9% 0.0% 0.0% 0.0% 8.8% 11.8%
US CE 3 0.0% 0.0% 0.0% 0.0% 0.0% 0.0% 0.0% 0.0%
US I 14 14.3% 42.9% 28.6% 7.1% 7.1% 14.3% 50.0% 0.0%
Canadian 10 10.0% 30.0% 10.0% 0.0% 0.0% 0.0% 30.0% 10.0%
Grand Total 163 9.8% 21.5% 17.2% 4.3% 0.6% 6.7% 20.9% 5.5%
Table Prof4a. Reasons for Increase in Teaching Load in Departments Where Increase is Possible - Tenured or Tenure-Track Faculty
Department Type # Dept
Yes - Shifting Primary
Resopnsibilities to Teaching
Yes - Other
US CS Public 71 66.2% 33.8%
US CS Private 22 68.2% 31.8%
US CE 3 33.3% 66.7%
US I 7 42.9% 57.1%
Canadian 8 62.5% 37.5%
Grand Total 111 64.0% 36.0%
Table Prof4b. Reasons for Increase in Teaching Load in Departments Where Increase is Possible - Teaching Professors
Department Type # Dept
Yes - Shifting Primary
Resopnsibilities to Teaching
Yes - Other
US CS Public 37 43.2% 56.8%
US CS Private 7 42.9% 57.1%
US CE 1 0.0% 100.0%
US I 6 50.0% 50.0%
Canadian 2 50.0% 50.0%
Grand Total 53 43.4% 56.6%
Table Prof4c. Reasons for Increase in Teaching Load in Departments Where Increase is Possible - Other Instructors
Department Type # Dept
Yes - Shifting Primary
Resopnsibilities to Teaching
Yes - Other
US CS Public 27 44.4% 55.6%
US CS Private 6 16.7% 83.3%
US CE 1 0.0% 100.0%
US I 2 50.0% 50.0%
Canadian 1 0.0% 100.0%
Grand Total 37 37.8% 62.2%

cra.org/crn64 May 2019
2018 Taulbee Survey (continued)
of departments than are increases in load; however, load
changes (in either direction) are less likely for teaching faculty
than for tenure-track faculty in U.S. CS departments, and tend to
be less likely for Other Instructors than for Teaching Professors
(Table Prof2). Tables Prof3a, b, and c provide, for tenure-track,
Teaching Professor, and Other Instructor faculty respectively,
statistics on the percentage of departments that afford
teaching load reductions for different types of activities. Tables
Prof4a, b, and c give statistics about possible increases in the
teaching load above the standard level.
Sources of External Funding (Table R2)
Table R2 shows a history of the sources of CS research funding,
as reported every three years since 2003. Fewer departments
provided this data in 2018, but the distribution is similar to
previous years. NSF is by far the biggest funder of CS research,
though its share of the total fell from 42.9 percent in 2015 to 38.3
percent in 2018. The share of CS funding from defense agencies
including DARPA also fell in 2018, while industry funding and
funding from unidentified other sources increased in percentage.
Table R2. Comparison of US CS External Funding 2003-2015.
2003(126 departments)
2006 (123 departments)
2009 (117 departments)
2012(123 departments)
2015(108 departments)
2018(95 departments)
Total % Fund Total %
Fund Total % Fund Total %
Fund Total % Fund Total %
Fund
NSF $354,451,309 40.7% $255,089,816 43.0% $281,076,341 43.1% $368,922,448 42.2% $342,335,280 42.93% $347,041,991 38.26%
DARPA $85,401,891 9.8% $64,191,150 10.8% $38,393,018 5.9% $52,526,824 6.0% $62,512,155 7.8% $64,237,216 7.08%
NIH $15,864,76 1.8% $24,880,112 4.2% $33,128,578 5.1% $46,533,387 5.3% $35,716,475 4.5% $45,333,000 5.00%
DOE $20,471,676 2.4% $24,391,329 4.1% $17,225,839 2.6% $30,149,692 3.4% $24,482,764 3.1% $24,806,054 2.73%
State agencies
$24,438,483 2.8% $16,875,578 2.8% $17,861,292 2.7% $17,725,647 2.0% $17,648,938 2.2% $14,326,866 1.58%
Industrial sources
$70,813,388 8.1% $50,333,039 8.5% $76,464,763 11.7% $89,149,734 10.2% $80,716,010 10.1% $104,998,246 11.58%
Other defense
$50,555,980 20.4% $97,512,961 16.4% $109,510,806 16.8% $173,606,289 19.8% $148,555,418 18.6% $154,468,063 17.03%
Other federal
$38,722,661 5.8% $32,388,664 5.5% $27,695,790 4.2% $37,088,925 4.2% $27,492,424 3.4% $39,739,067 4.38%
Private foundation
$32,977,093 3.8% $10,826,656 1.8% $18,297,020 2.8% $23,600,989 2.7% $33,488,855 4.2% $38,722,661 4.27%
IMLS $288,059 0.0% $79,692 0.0% $315,218 0.03%
Other $37,995,002 4.4% $16,996,108 2.9% $32,763,366 5.0% $35,190,510 4.0% $24,440,153 3.1% $60,230,992 6.64%
Unallocated $1,429,893 0.16%
Total $870,327,187 $593,485,413 $652,416,813 $874,782,504 $797,468,164 $907,063,060
Average/Dept
$6,907,359 $4,825,085 $5,576,212 $7,112,053 $7,383,964 $9,548,032

cra.org/crn65 May 2019
2018 Taulbee Survey (continued)
Table Prof5. Factors Affecting the Amount of a Graduate Student’s Stipend
Department Type # Dept
Advance to Next Stage of Program
Years of Service GPA Recruitment
EnhancementsDifferent Stipend Sources
Other
US CS Public 102 54.9% 22.5% 9.8% 25.5% 28.4% 18.6%
US CS Private 34 20.6% 14.7% 5.9% 8.8% 11.8% 14.7%
US CE 3 0.0% 0.0% 33.3% 33.3% 0.0% 33.3%
US I 14 35.7% 7.1% 7.1% 0.0% 28.6% 21.4%
Canadian 11 36.4% 18.2% 18.2% 27.3% 54.5% 0.0%
Grand Total 164 43.9% 18.9% 9.8% 20.1% 26.2% 17.1%
Table Prof6. Departments Using Selected Graduate Student Recruitment Incentives
Department Type # Dept
Upfront One-Time Signing Bonus
Stipend Enhancements
Guaranteed Multi-Year Support
Guaranteed Summer Support
Paid Visits to Campus
Other
US CS Public 102 15.7% 17.6% 44.1% 13.7% 40.2% 6.9%
US CS Private 34 8.8% 8.8% 41.2% 23.5% 55.9% 14.7%
US CE 3 0.0% 66.7% 66.7% 33.3% 66.7% 0.0%
US I 14 14.3% 14.3% 50.0% 7.1% 42.9% 14.3%
Canadian 11 9.1% 18.2% 72.7% 36.4% 9.1% 18.2%
Grand Total 164 13.4% 16.5% 46.3% 17.1% 42.1% 9.8%
Table Prof7. Median Amounts and Years of Selected Graduate Student Recruitment Incentives
Department Type # Dept
Upfront One-Time Signing Bonus
Stipend Enhancements
Guaranteed Multi-Year Support
Guaranteed Summer Support
Paid Visits to Campus
US CS Public 60 2,000.00 5,000.00 4 6,859.00 500
US CS Private 21 5 8,425.00 800
US CE 2
US I 9 4 425
Total US 92 2,000.00 5,000.00 4 7,175.00 725
Canadian 7 4
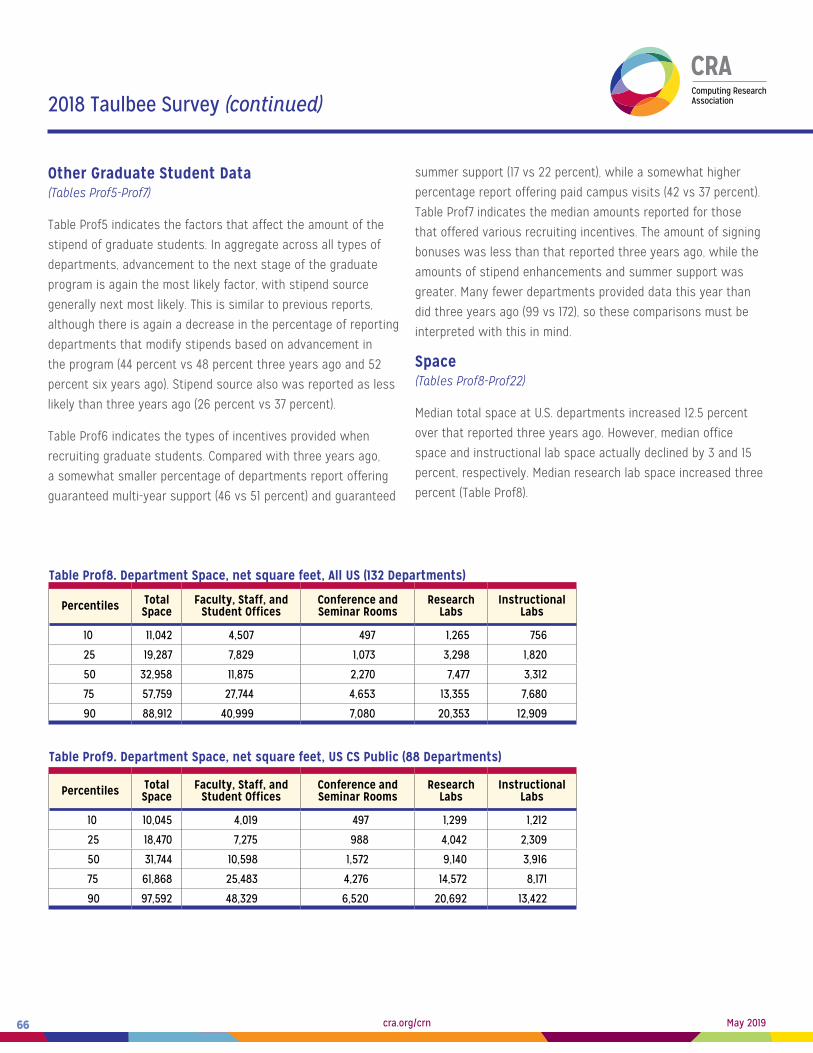
cra.org/crn66 May 2019
2018 Taulbee Survey (continued)
Other Graduate Student Data (Tables Prof5-Prof7)
Table Prof5 indicates the factors that affect the amount of the
stipend of graduate students. In aggregate across all types of
departments, advancement to the next stage of the graduate
program is again the most likely factor, with stipend source
generally next most likely. This is similar to previous reports,
although there is again a decrease in the percentage of reporting
departments that modify stipends based on advancement in
the program (44 percent vs 48 percent three years ago and 52
percent six years ago). Stipend source also was reported as less
likely than three years ago (26 percent vs 37 percent).
Table Prof6 indicates the types of incentives provided when
recruiting graduate students. Compared with three years ago,
a somewhat smaller percentage of departments report offering
guaranteed multi-year support (46 vs 51 percent) and guaranteed
summer support (17 vs 22 percent), while a somewhat higher
percentage report offering paid campus visits (42 vs 37 percent).
Table Prof7 indicates the median amounts reported for those
that offered various recruiting incentives. The amount of signing
bonuses was less than that reported three years ago, while the
amounts of stipend enhancements and summer support was
greater. Many fewer departments provided data this year than
did three years ago (99 vs 172), so these comparisons must be
interpreted with this in mind.
Space (Tables Prof8-Prof22)
Median total space at U.S. departments increased 12.5 percent
over that reported three years ago. However, median office
space and instructional lab space actually declined by 3 and 15
percent, respectively. Median research lab space increased three
percent (Table Prof8).
Table Prof8. Department Space, net square feet, All US (132 Departments)
Percentiles Total Space
Faculty, Staff, and Student Offices
Conference and Seminar Rooms
Research Labs
Instructional Labs
10 11,042 4,507 497 1,265 756
25 19,287 7,829 1,073 3,298 1,820
50 32,958 11,875 2,270 7,477 3,312
75 57,759 27,744 4,653 13,355 7,680
90 88,912 40,999 7,080 20,353 12,909
Table Prof9. Department Space, net square feet, US CS Public (88 Departments)
Percentiles Total Space
Faculty, Staff, and Student Offices
Conference and Seminar Rooms
Research Labs
Instructional Labs
10 10,045 4,019 497 1,299 1,212
25 18,470 7,275 988 4,042 2,309
50 31,744 10,598 1,572 9,140 3,916
75 61,868 25,483 4,276 14,572 8,171
90 97,592 48,329 6,520 20,692 13,422
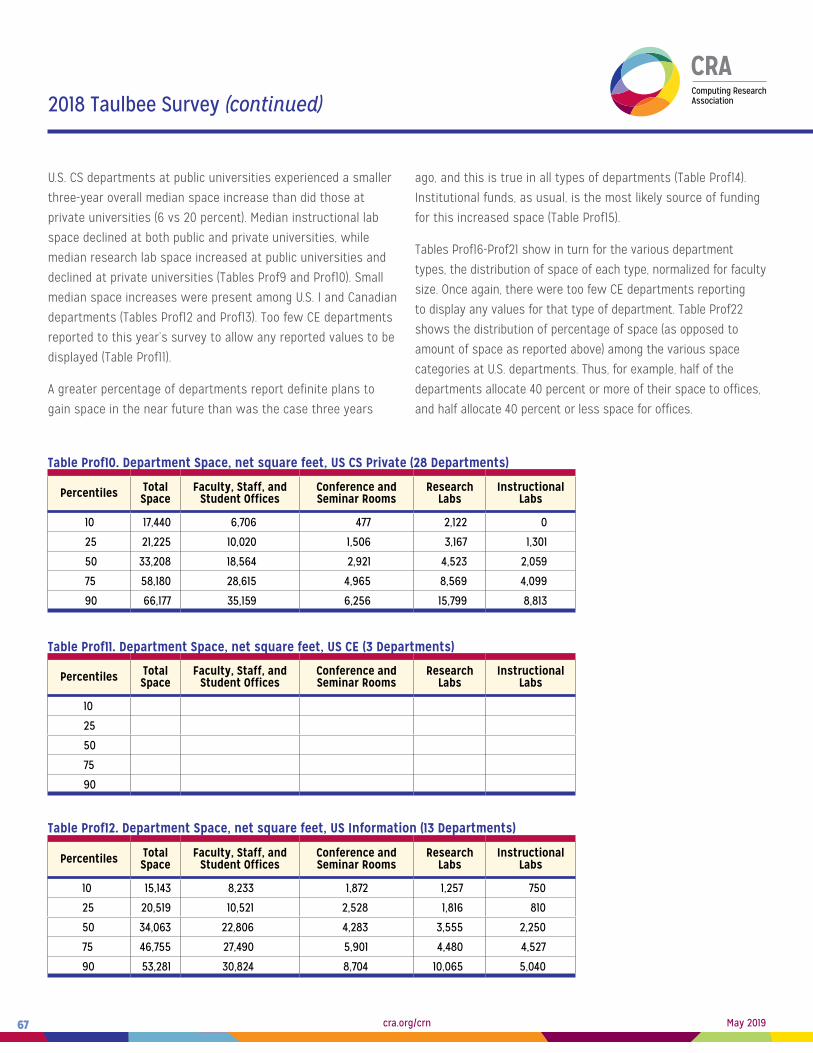
cra.org/crn67 May 2019
2018 Taulbee Survey (continued)
U.S. CS departments at public universities experienced a smaller
three-year overall median space increase than did those at
private universities (6 vs 20 percent). Median instructional lab
space declined at both public and private universities, while
median research lab space increased at public universities and
declined at private universities (Tables Prof9 and Prof10). Small
median space increases were present among U.S. I and Canadian
departments (Tables Prof12 and Prof13). Too few CE departments
reported to this year’s survey to allow any reported values to be
displayed (Table Prof11).
A greater percentage of departments report definite plans to
gain space in the near future than was the case three years
ago, and this is true in all types of departments (Table Prof14).
Institutional funds, as usual, is the most likely source of funding
for this increased space (Table Prof15).
Tables Prof16-Prof21 show in turn for the various department
types, the distribution of space of each type, normalized for faculty
size. Once again, there were too few CE departments reporting
to display any values for that type of department. Table Prof22
shows the distribution of percentage of space (as opposed to
amount of space as reported above) among the various space
categories at U.S. departments. Thus, for example, half of the
departments allocate 40 percent or more of their space to offices,
and half allocate 40 percent or less space for offices.
Table Prof10. Department Space, net square feet, US CS Private (28 Departments)
Percentiles Total Space
Faculty, Staff, and Student Offices
Conference and Seminar Rooms
Research Labs
Instructional Labs
10 17,440 6,706 477 2,122 0
25 21,225 10,020 1,506 3,167 1,301
50 33,208 18,564 2,921 4,523 2,059
75 58,180 28,615 4,965 8,569 4,099
90 66,177 35,159 6,256 15,799 8,813
Table Prof11. Department Space, net square feet, US CE (3 Departments)
Percentiles Total Space
Faculty, Staff, and Student Offices
Conference and Seminar Rooms
Research Labs
Instructional Labs
10
25
50
75
90
Table Prof12. Department Space, net square feet, US Information (13 Departments)
Percentiles Total Space
Faculty, Staff, and Student Offices
Conference and Seminar Rooms
Research Labs
Instructional Labs
10 15,143 8,233 1,872 1,257 750
25 20,519 10,521 2,528 1,816 810
50 34,063 22,806 4,283 3,555 2,250
75 46,755 27,490 5,901 4,480 4,527
90 53,281 30,824 8,704 10,065 5,040

cra.org/crn68 May 2019
2018 Taulbee Survey (continued)
Table Prof13. Department Space, net square meters, Canadian (10 Departments)
Percentiles Total Space
Faculty, Staff, and Student Offices
Conference and Seminar Rooms
Research Labs
Instructional Labs
10 2,265
25 3,345
50 6,019 1,998 300 1,207 1,145
75 7,405
90 8,126
Table Prof14. Definite Plans to Gain or Lose
Department Type # Dept Gain Space No Change Lose Space
US CS Public 92 35% 64% 1%
US CS Private 30 50% 50% 0%
US CE 3 33% 67% 0%
US I 13 62% 39% 0%
Canadian 10 40% 60% 0%
Grand Total 148 41% 59% 1%
Table Prof15. Sources of Funding for Additional Space
Department Type # Dept
% Departments Adding Space Using Funds from Source
Institutional Federal State / Provincial Industry Private
US CS Public 102 25.50% 0.00% 10.80% 3.90% 10.80%
US CS Private 34 38.20% 0.00% 2.90% 0.00% 11.80%
US CE 3 33.30% 0.00% 0.00% 0.00% 0.00%
US I 14 50.00% 0.00% 0.00% 0.00% 0.00%
Canadian 10 30.00% 20.00% 20.00% 10.00% 20.00%
Grand Total 163 30.70% 1.20% 8.60% 3.10% 10.40%
Table Prof16. Department Space, net square feet per faculty member, All US Public CS (132 Departments)
PercentilesTotal Space Faculty, Staff, and
Student OfficesConference and Seminar Rooms Research Labs Instructional Labs
Ten-Track Tot-Fac Ten-Track Tot-Fac Ten-Track Tot-Fac Ten-Track TT+Rsrch Ten-Track TT+Teach
10 708 577 217 185 14 13 13 12 0 0
25 893 713 317 261 41 33 108 86 53 44
50 1,123 980 455 383 74 66 250 207 118 97
75 1,535 1,347 747 604 115 102 400 330 241 172
90 2,285 2,045 1,036 822 186 156 568 478 398 357

cra.org/crn69 May 2019
2018 Taulbee Survey (continued)
Table Prof17. Department Space, net square feet per faculty member, US Public CS (88 Departments)
PercentilesTotal Space Faculty, Staff, and
Student OfficesConference and Seminar Rooms Research Labs Instructional Labs
Ten-Track Tot-Fac Ten-Track Tot-Fac Ten-Track Tot-Fac Ten-Track TT+Rsrch Ten-Track TT+Teach
10 696 619 219 197 21 19 31 29 8 7
25 902 752 288 254 40 33 148 134 85 62
50 1,228 996 414 351 67 58 303 274 145 117
75 1,574 1,384 701 576 101 92 427 402 275 205
90 2,160 1,918 979 781 147 111 589 481 401 360
Table Prof18. Department Space, net square feet per faculty member, US Private CS (28 Departments)
PercentilesTotal Space Faculty, Staff, and
Student OfficesConference and Seminar Rooms Research Labs Instructional Labs
Ten-Track Tot-Fac Ten-Track Tot-Fac Ten-Track Tot-Fac Ten-Track TT+Rsrch Ten-Track TT+Teach
10 708 522 270 233 6 4 57 36 0 0
25 797 589 368 278 35 31 99 63 19 18
50 1,012 784 514 383 89 68 139 122 76 63
75 1,258 1,009 674 498 134 105 270 211 120 105
90 2,449 1,983 1,086 867 188 135 365 269 266 211
Table Prof19. Department Space, net square feet per faculty member, US CE (3 Departments)
PercentilesTotal Space Faculty, Staff, and
Student OfficesConference and Seminar Rooms Research Labs Instructional Labs
Ten-Track Tot-Fac Ten-Track Tot-Fac Ten-Track Tot-Fac Ten-Track TT+Rsrch Ten-Track TT+Teach
10
25
50
75
90
Table Prof20. Department Space, net square feet per faculty member, US Information (13 Departments)
PercentilesTotal Space Faculty, Staff, and
Student OfficesConference and Seminar Rooms Research Labs Instructional Labs
Ten-Track Tot-Fac Ten-Track Tot-Fac Ten-Track Tot-Fac Ten-Track TT+Rsrch Ten-Track TT+Teach
10 879 835 343 329 66 63 6 5 0 0
25 1,064 992 449 410 77 74 40 36 22 16
50 1,231 1,090 760 603 125 116 131 116 33 26
75 1,363 1,296 852 800 222 176 203 195 157 116
90 1,532 1,459 878 863 269 253 310 294 201 141

cra.org/crn70 May 2019
2018 Taulbee Survey (continued)
Departmental Support Staff (Tables Prof23-Prof28)
Tables Prof23-Prof28 show the distribution of department staff
for the different department types. Across all institutions, there
was an increase in the median number of administrative staff,
from six reported in 2015 to seven reported in 2018, and an
increase in the median number of research staff from one to
two. The latter is a function of additional research support that
is funding such staff. U.S. CS departments at private universities
showed an increase in median staffing for all three types of
staff (administrative, computing, and research), while U.S. CS
departments at public universities had a median staff decrease
in computing support and little change in the other two staff
categories. U.S. I departments, which mainly are I-schools, had
much larger median staffing than did U.S. CS departments, and
had an increase in the median administrative staff size from
19 to 27.5 over the past three years. There are two more such I
departments reporting this year, and since the total number of
such departments is 12 this year, these two departments can
have a larger influence on medians than likely would be the case
for CS departments.
Table Prof21. Department Space, net square meters per faculty member, Canadian (9 Departments)
PercentilesTotal Space Faculty, Staff, and
Student OfficesConference and Seminar Rooms Research Labs Instructional Labs
Ten-Track Tot-Fac Ten-Track Tot-Fac Ten-Track Tot-Fac Ten-Track TT+Rsrch Ten-Track TT+Teach
10 71
25 82
50 136 115 49 36 8 6 29 26 20 17
75 158
90 200
Table Prof22. Department Space, All US (132 Departments)
Percentiles
Percent of Total Space Allocated To
Faculty, Staff, and Student Offices
Conference and
Seminar Rooms
Research Labs
Instructional Labs
10 21 1 2 0
25 30 4 8 4
50 40 6 22 11
75 55 8 35 18
90 66 14 43 28

cra.org/crn71 May 2019
2018 Taulbee Survey (continued)
Table Prof23. Full Time Staff by Type of Support – All Institutions
PercentilesSecretarial / Administrative Computer Support Research
Institutional External Support Total Institutional External
Support Total Institutional External Support Total
10 2 0 2 1 0 1 0 0 0
25 3 0 3.8 1 0 1 0 0 0
50 7 0.9 7 3 0 3 0 1.3 2
75 13 2 14 5 0.5 5.6 2 4 4.8
90 32.3 4 33.1 7 3.8 8.5 5 10.9 12.5
# Dept 149 70 149 130 53 131 67 70 86
Table Prof24. Full Time Staff by Type of Support – US CS Public
PercentilesSecretarial / Administrative Computer Support Research
Institutional External Support Total Institutional External
Support Total Institutional External Support Total
10 2 0 2 1 0 1 0 0 0
25 3 0 3 1 0 1 0 0 0
50 5 1 5 2 0 2 0 1.1 1.5
75 11 2 11.8 4.9 0 5 1 3 3
90 20.2 4 21.2 7 1 7 3.7 7.8 9
# Dept 95 41 95 82 32 82 44 42 54
Table Prof25. Full Time Staff by Type of Support – US CS Private
PercentilesSecretarial / Administrative Computer Support Research
Institutional External Support Total Institutional External
Support Total Institutional External Support Total
10 3 0 3.2 1 0 1 0 0 0
25 5 0 5.5 1.4 0 2 0 2 1.8
50 9 0.5 10 4 0.8 4 1 3 4.5
75 15 2.5 15.7 5.4 3 6 5 9 11.5
90 34 4.3 42.4 10 6.8 13 9.8 20.1 19.4
# Dept 31 18 31 26 13 27 13 17 20

cra.org/crn72 May 2019
2018 Taulbee Survey (continued)
Table Prof26. Full Time Staff by Type of Support – US CE
PercentilesSecretarial / Administrative Computer Support Research
Institutional External Support Total Institutional External
Support Total Institutional External Support Total
10
25
50
75
90
# Dept 3 1 3 3 1 3 1 1 1
Table Prof27. Full Time Staff by Type of Support – US Information
PercentilesSecretarial / Administrative Computer Support Research
Institutional External Support Total Institutional External
Support Total Institutional External Support Total
10 4.3 4.3 1 1 0
25 14.1 14.1 2.5 2.5 0.3
50 27.5 0 27.5 5 0 5 0.1 1 1
75 33.5 34.3 6 6 1.6
90 41 41.4 7 7 5.6
# Dept 12 7 12 11 6 11 8 9 10
Table Prof28. Full Time Staff by Type of Support – Canadian
PercentilesSecretarial / Administrative Computer Support Research
Institutional External Support Total Institutional External
Support Total Institutional External Support Total
10
25
50 6.5 6.5 3.5 3.5
75
90
# Dept 8 3 8 8 1 8 1 1 1

cra.org/crn73 May 2019
2018 Taulbee Survey (continued)
Concluding ObservationsThere still is no let-up in the undergraduate enrollment surge,
which has resulted in more than a decade of sustained growth.
Departments were successful in increasing teaching faculty
above the level of enrollment increase this year; they also
increased their average tenure-track faculty size and slightly
increased the average number of TAs per department. While
welcome, the overall growth in teaching capacity woefully
lags the growth in students during the past eleven years, and
the vast majority of departments report increased difficulty in
managing the situation. There is no evidence that the enrollment
growth has resulted in changes in teaching loads during the
past three years. However, the number of students has been
increasing in the typical introductory and mid-level course.
The median course size of the typical mid-level course is 50
percent higher today than it was just three years ago. On top of
the undergraduate enrollment growth, departmental research
productivity has continued to increase and there has been
another year of strong growth in the number of new students
in doctoral programs. Departmental space has increased
somewhat, but appears to have been directed mainly to support
research growth rather than enrollment growth,
Gender diversity of degree recipients improved at all degree
levels. However, in CS the representation of women would
have to more than double in order to approach parity of
representation with men among all U.S. students receiving
bachelor’s degrees. There is little change in ethnic diversity from
year to year, where resident Asians are vastly over-represented
and basically every other resident ethnic group (including Whites)
is under-represented among CS bachelor’s graduates relative to
the population of U.S. bachelor’s graduates.
It is remarkable how departments have been able to keep up
their productivity. However, this year showed a marked increase
in both the number of faculty who left for other faculty positions
and the fraction of total faculty losses that were to faculty
taking other academic positions. Whether this will become a
trend is not clear, but it bears watching.
Participating CS, CE, I and Canadian Departments (Departments marked with * have participated in all 5 of the most recent Taulbee surveys)
U.S. CS Public (104): Arizona State*, Auburn*, Binghamton, Boise
State, Clemson*, College of William & Mary*, Colorado School of
Mines*, Colorado State*, Florida International*, George Mason*,
Georgia Tech*, Georgia State*, Indiana*, Indiana University
Purdue University Indianapolis, Iowa State*, Kansas State*,
Kent State*, Michigan State*, Michigan Technological University,
Missouri University of Science and Technology, Montana
State*, Naval Postgraduate School*, New Jersey Institute of
Technology*, New Mexico State, North Carolina State*, North
Dakota State*, Ohio State*, Ohio*, Oklahoma State*, Old Dominion,
Oregon State, Pennsylvania State*, Portland State*, Purdue*,
Rutgers*, Southern Illinois (Carbondale), Stony Brook (SUNY)*,
Texas A&M*, Texas Tech, University at Buffalo, Universities
of: Alabama (Birmingham*), Arizona, Arkansas*, Arkansas at
Little Rock*, California (Berkeley*, Davis*, Irvine*, Los Angeles,
Riverside*, San Diego, Santa Barbara*, and Santa Cruz*), Central
Florida*, Colorado (Boulder)*, Connecticut*, Delaware*, Florida*,
Georgia*, Hawaii, Houston*, Idaho, Illinois (Chicago and Urbana-
Champaign), Iowa*, Kansas*, Kentucky, Louisiana at Lafayette*,
Maryland (College Park* and Baltimore County*), Massachusetts
(Amherst*, Boston*, and Lowell), Memphis, Michigan*, Minnesota*,
Nebraska (Omaha* and Lincoln*), Nevada (Las Vegas and Reno*),
New Hampshire*, New Mexico, North Carolina (Chapel Hill* and
Charlotte*), North Dakota, North Texas*, Oklahoma*, Oregon*,
Rhode Island*, South Carolina*, South Florida*, Tennessee
(Knoxville)*, Texas (Arlington, Austin*, Dallas*, and El Paso*),
Utah*, Vermont, Virginia*, Washington*, Wisconsin (Madison* and
Milwaukee), and Wyoming; Virginia Tech*, Washington State*,
Wayne State*, and Wright State.
U.S. CS Private (39): Boston University*, Brandeis, Brown*,
Carnegie Mellon*, Case Western Reserve*, Clarkson, Columbia,
Cornell*, DePaul*, Drexel*, Duke*, Emory*, George Washington,
Harvard, Illinois Institute of Technology, Johns Hopkins, Lehigh*,
MIT*, New York University*, Northeastern*, Northwestern, NYU

cra.org/crn74 May 2019
2018 Taulbee Survey (continued)
Tandon School of Engineering, Princeton*, Rensselaer*, Rice,
Rochester Institute of Technology*, Stanford*, Stevens Institute
of Technology, Toyota Technological Institute at Chicago*, Tufts*,
Universities of: Chicago*, Notre Dame, Pennsylvania*, Rochester*,
Southern California*, and Tulsa*, Washington in St. Louis*,
Worcester Polytechnic Institute*, and Yale.
U.S. CE (6): North Carolina State*, Northeastern*, Universities of:
Central Florida*, Illinois (Urbana-Champaign), New Mexico*, and
Southern California.
U.S. Information (15): Cornell*, Drexel*, Florida State, Indiana*,
Penn State*, Syracuse, Universities of: California (Berkeley)*,
Colorado (Boulder), Illinois (Urbana-Champaign), Maryland (College
Park ISchool and Baltimore County*), Michigan*, North Carolina
(Chapel Hill)*, Pittsburgh*, and Washington*.
Canadian (12): Concordia*, McGill, Simon Fraser*, Universities of:
British Columbia*, Calgary*, Manitoba*, New Brunswick, Toronto*,
Victoria*, Waterloo, Western Ontario*, and York*.
1The title of the survey honors Orrin E. Taulbee of the University of Pittsburgh, who conducted these surveys for the Computer Science Board until 1984, with retrospective annual data going back to 1970.
2Information (I) programs included here are Information Science, Information Systems, Information Technology, Informatics, and related disciplines with a strong computing component. Surveys were sent to CRA members, the CRA Deans group members, and participants in the iSchools Caucus (www.ischools.org) who met the criteria of granting Ph.D.s and being located in North America. Other I programs who meet these criteria and would like to participate in the survey in future years are invited to contact [email protected] for inclusion.
3Classification of the population of an institution’s locale is in accordance with the Carnegie Classification database. Large cities are those with population >= 250,000. Mid-size cities have population between 100,000 and 250,000. Town/rural populations are less than 100,000.
4All faculty tables: The survey makes no distinction between faculty specializing in CS vs. CE programs. Every effort is made to minimize the inclusion of faculty in electrical engineering who are not computer engineers.