2018.annual information form - imperial metals corp · 2019-03-29 · peter ogryzlo, m.sc., p.geo...
TRANSCRIPT

Imperial Metals Corporation
Annual Information Form
For the Year Ended December 31, 2018
Filing Date: March 29, 2019

Table of Contents Page
Content Information 1
Company Business & Corporate Structure 5
Risk Factors 6
General Development & Outlook 7
Mineral Property | Red Chris Mine 13
Mineral Property | Mount Polley Mine 24
Mineral Property | Huckleberry Mine 33
Other Properties 39
Dividends and Distributions 39
Capital Structure 39
Market for Securities 39
Ratings 40
Directors & Executive Officers 41
Corporate Cease Trade Orders or Bankruptcies 44
Conflicts of Interest 44
Interest of Management & Others in Material Transactions 44
Material Contracts 45
Legal Proceedings 47
Transfer Agent & Registrar 48
Interests of Experts 48
Additional Information 48

Imperial Metals Corporation | 2018 Annual Information Form
Content Information
All references in this Annual Information Form (“AIF”) to “Imperial”, “Company”, “we” and “our” apply collectively to Imperial Metals Corporation and its subsidiaries.
Date of Information
Unless otherwise stated, the information within this AIF is for Imperial’s financial year ended December 31, 2018.
Currency
The reporting currency of the Company is the Canadian (“CDN”) Dollar and all financial information presented in this AIF is in CDN dollars, unless otherwise indicated.
Incorporated Information by Reference
Information from documents incorporated by reference include the Company’s 2018 Annual Report and Technical Reports (noted below). These documents are available on imperialmetals.com and at sedar.com.
National Instrument 43‐101 Technical Reports
2016 Mount Polley Report Mount Polley Mine 2016 Technical Report dated May 20, 2016 by Ryan Brown, P.Eng., Gary Roste, P.Geo., Janice Baron, P.Eng., and Chris Rees, Ph.D., P.Geo
2012 Red Chris Report 2012 Technical Report on the Red Chris Copper‐Gold Project dated February 14, 2012, amended and restated September 30, 2015 by Greg Gillstrom, P.Eng., Raj Anand, M.Eng, P.Eng., Steve Robertson, P.Geo., and Paul Sterling, P.Eng
2011 Huckleberry Report Technical Report on the Main Zone Optimization Huckleberry Mine, Omineca Mining Division, British Columbia, Canada dated November 22, 2011; amended May 11, 2016 by Kent Christensen, P.Eng., Gerald R. Connaughton, P.Eng. and Peter Ogryzlo, M.Sc., P.Geo
Reference for Abbreviations
The following abbreviations may be used in this document:
mm = millimetre oz = ounces
m = metre lbs = pounds
masl = metres above sea level kg = kilogram
m3 = cubic metre g = gram
km = kilometre g/t = grams per tonne
ha = hectare t/d = tonnes per day
M = million kV = kilovolt
MT = million tonnes kW = kilowatt
ppm = parts per million hp = horse power
NAG = non acid generating SAG = semi autogenous
PAG = potentially acid generating QA/QC = Quality Assurance/Quality Control
Reference for Conversions
Imperial Measure Conversion to Metric Unit Metric Unit Conversion to Imperial Measure
2.470 acres = 1 hectare 0.4047 hectare = 1 acre
3.280 feet = 1 metre 0.3048 m = 1 foot
0.620 miles = 1 kilometre 1.6093 kilometre = 1 mile
2.205 pounds = 1 kilogram 0.454 0 kilograms = 1 pound
1.102 (short) tons = 1 tonne 0.9072 tonnes = 1 ton

‐ 2 ‐
Imperial Metals Corporation | 2018 Annual Information Form
Definitions for Mineral Resource & Mineral Reserve Estimates
Resource and Reserve Classifications
This AIF adheres to the resource/reserve definitions and classification criteria developed by the Canadian Institute of Mining and Metallurgy (“CIM”). The CIM Definition Standards on Mineral Resources and Reserves (“CIM Definition Standards”) establish definitions and guidance on the definitions for mineral resources, mineral reserves, and mining studies used in Canada. The Mineral Resource, Mineral Reserve, and Mining Study definitions are incorporated by reference into National Instrument 43‐101–Standards of Disclosure for Mineral Projects (“NI 43‐101”). The CIM Definition Standards are summarized below. For additional information refer to cim.org.
Mineral Resource
Mineral Resources are sub‐divided, in order of increasing geological confidence, into Inferred, Indicated and Measured categories. An Inferred Mineral Resource has a lower level of confidence than that applied to an Indicated Mineral Resource. An Indicated Mineral Resource has a higher level of confidence than an Inferred Mineral Resource but has a lower level of confidence than a Measured Mineral Resource.
A Mineral Resource is a concentration or occurrence of solid material of economic interest in or on the Earth’s crust in such form, grade or quality and quantity that there are reasonable prospects for eventual economic extraction. The location, quantity, grade or quality, continuity and other geological characteristics of a Mineral Resource are known, estimated or interpreted from specific geological evidence and knowledge, including sampling.
Inferred Mineral Resource
An Inferred Mineral Resource is that part of a Mineral Resource for which quantity and grade or quality are estimated on the basis of limited geological evidence and sampling. Geological evidence is sufficient to imply but not verify geological and grade or quality continuity. An Inferred Mineral Resource has a lower level of confidence than that applying to an Indicated Mineral Resource and must not be converted to a Mineral Reserve. It is reasonably expected that the majority of Inferred Mineral Resources could be upgraded to Indicated Mineral Resources with continued exploration.
Indicated Mineral Resource
An Indicated Mineral Resource is that part of a Mineral Resource for which quantity, grade or quality, densities, shape and physical characteristics are estimated with sufficient confidence to allow the application of modifying factors in sufficient detail to support mine planning and evaluation of the economic viability of the deposit. Geological evidence is derived from adequately detailed and reliable exploration, sampling and testing and is sufficient to assume geological and grade or quality continuity between points of observation. An Indicated Mineral Resource has a lower level of confidence than that applying to a Measured Mineral Resource and may only be converted to a Probable Mineral Reserve.
Measured Mineral Resource
A Measured Mineral Resource is that part of a Mineral Resource for which quantity, grade or quality, densities, shape, and physical characteristics are estimated with confidence sufficient to allow the application of modifying factors to support detailed mine planning and final evaluation of the economic viability of the deposit. Geological evidence is derived from detailed and reliable exploration, sampling and testing and is sufficient to confirm geological and grade or quality continuity between points of observation.
A Measured Mineral Resource has a higher level of confidence than that applying to either an Indicated Mineral Resource or an Inferred Mineral Resource. It may be converted to a Proven Mineral Reserve or to a Probable Mineral Reserve.
Mineral Reserve
Mineral Reserves are sub‐divided in order of increasing confidence into Probable Mineral Reserves and Proven Mineral Reserves. A Probable Mineral Reserve has a lower level of confidence than a Proven Mineral Reserve.
A Mineral Reserve is the economically mineable part of a Measured and/or Indicated Mineral Resource. It includes diluting materials and allowances for losses, which may occur when the material is mined or extracted and is defined by studies at Pre‐Feasibility or Feasibility level as appropriate that include application of modifying factors. Such studies demonstrate that, at the time of reporting, extraction could reasonably be justified.

‐ 3 ‐
Imperial Metals Corporation | 2018 Annual Information Form
The reference point at which Mineral Reserves are defined, usually the point where the ore is delivered to the processing plant, must be stated. It is important that, in all situations where the reference point is different, such as for a saleable product, a clarifying statement is included to ensure that the reader is fully informed as to what is being reported. The public disclosure of a Mineral Reserve must be demonstrated by a Pre‐Feasibility Study or Feasibility Study.
Probable Mineral Reserve
A Probable Mineral Reserve is the economically mineable part of an Indicated Mineral Reserve, and in some circumstances, a Measured Mineral Resource. The confidence in the modifying factors applying to a Probable Mineral Reserve is lower than that applying to a Proven Mineral Reserve.
The Qualified Person (as defined in NI 43‐101) may elect, to convert Measured Mineral Resources to Probable Mineral Reserves if the confidence in the modifying factors is lower than that applied to a Proven Mineral Reserve. Probable Mineral Reserve estimates must be demonstrated to be economic, at the time of reporting, by at least a Pre‐Feasibility Study.
Proven Mineral Reserve
A Proven Mineral Reserve is the economically mineable part of a Measured Mineral Resource. A Proven Mineral Reserve implies a high degree of confidence in the modifying factors.
Application of the Proven Mineral Reserve category implies the Qualified Person (as defined in NI 43‐101) has the highest degree of confidence in the estimate with the consequent expectation in the minds of the readers of the report. The term should be restricted to that part of the deposit where production planning is taking place and for which any variation in the estimate would not significantly affect the potential economic viability of the deposit. Proven Mineral Reserve estimates must be demonstrated to be economic, at the time of reporting, by at least a Pre‐Feasibility Study. Within the CIM Definition standards the term Proved Mineral Reserve is an equivalent term to a Proven Mineral Reserve.
Mineral Resource & Mineral Reserve Classification
The CIM Definition Standards provide for a direct relationship between Indicated Mineral Resources and Probable Mineral Reserves and between Measured Mineral Resources and Proven Mineral Reserves. In other words, the level of geoscientific confidence for Probable Mineral Reserves is the same as that required for the in situ determination of Indicated Mineral Resources and for Proven Mineral Reserves is the same as that required for the in situ determination of Measured Mineral Resources.
Cautionary Note Regarding Forward‐Looking Information
This AIF provides material information about Imperial Metals Corporation and its business, operations and developments for the year ended December 31, 2018, and plans for the future based on facts and circumstances as at March 29, 2019.
Except for statements of historical fact relating to the Company, certain information contained herein constitutes forward‐looking information which are prospective in nature and reflect the current views and/or expectations of Imperial. Often, but not always, forward‐looking information can be identified by the use of statements such as "plans", "expects" or "does not expect", "is expected", "scheduled", "estimates", "forecasts", "projects", "intends", "anticipates" or "does not anticipate", or "believes", or variations of such words and phrases or statements that certain actions, events or results "may", "could", "should", "would", "might" or "will" be taken, occur or be achieved. Such information includes, without limitation, statements regarding: mine plans; costs and timing of current and proposed exploration and development; production and marketing; capital expenditures; future expenses and scope relating to timing of ongoing rehabilitation activities at the Mount Polley mine; use of proceeds from financings and credit facilities; timing of closing of the Joint Venture Partnership; anticipated benefits and proceeds of the Joint Venture Partnership, including expectations that it will enable the Company to unlock significant value at Red Chris by leveraging Newcrest’s unique technical expertise in black caving operations thereby putting the Company in a much stronger position to create value and opportunities for its shareholders, stakeholders and the Tahltan Nation; expectations relating to the milling of low grade stockpiles at the Mount Polley mine until May 2019, after which the mine will be placed in care and maintenance until the economics of mining improve; expectations that operations are expected to return to normal as run‐off water volumes increase at the Red Chris mine due to the warmer early Spring temperatures; development of a preliminary plan to restart the Huckleberry mine and expectations that it

‐ 4 ‐
Imperial Metals Corporation | 2018 Annual Information Form
will be considered for implementation at such time as the economics of mining improve; plans to develop exploration programs at the Huckleberry mine designed to expand the resource, including further exploration of the western edge; adequacy of funds for projects and liabilities; expectations relating to the receipt of necessary regulatory permits, approvals or other consents; outcome and impact of litigation; cash flow; working capital requirements; expectations relating to the requirement for additional capital; expectations relating to results of operations, production, revenue, margins and earnings; future prices of copper and gold; future foreign currency exchange rates and impact; future accounting changes; and future prices for marketable securities.
Forward‐looking information is not based on historical facts, but rather on then current expectations, beliefs, assumptions, estimates and forecasts about the business and the industry and markets in which the Company operates, including, but not limited to, assumptions that: the Company will be able to advance and complete remaining planned rehabilitation activities within expected time frames; there will be no significant delay or other material impact on the expected timeframes or costs for completion of rehabilitation activities at the Mount Polley mine; all required permits, approvals and arrangements to proceed with planned rehabilitation will be granted; there will be no interruptions that will materially delay the Company’s progress with its rehabilitation plans; the Company’s initial rehabilitation activities will be successful in the long term; there will be no material operational delays at the Mount Polley mine or Red Chris mine; equipment will operate as expected; the Mount Polley mine and Red Chris mine will achieve expected production outcomes (including with respect to mined grades and mill recoveries); the Company’s use of derivative instruments will enable the Company to achieve expected pricing protection; there will be no material adverse change in the market price of commodities and exchange rates; all required approvals and consents for the Joint Venture Partnership will be obtained in a timely manner; the satisfaction of all conditions to consummate the Joint Venture Partnership; and Imperial will have access to capital as required. Such statements are qualified in their entirety by the inherent risks and uncertainties surrounding future expectations. We can give no assurance that the forward‐looking information will prove to be accurate.
Forward‐looking information involves known and unknown risks, uncertainties and other factors which may cause Imperial’s actual results, revenues, performance or achievements to be materially different from any future results, performance or achievements expressed or implied by the statements constituting forward‐looking information. Important risks that could cause Imperial’s actual results, revenues, performance or achievements to differ materially from Imperial’s expectations include, among other things: that additional financing may be required may not be available to Imperial on terms acceptable to Imperial or at all; uncertainty regarding the outcome of sample testing and analysis being conducted on the area affected by the Mount Polley Breach; risks relating to the timely receipt of necessary approvals and consents to proceed with the rehabilitation plan; risks relating to the remaining costs and liabilities relating to the Mount Polley Breach; uncertainty as to actual timing of completion of the Mount Polley Breach related rehabilitation activities; risks relating to the impact of the Mount Polley Breach on Imperial’s reputation; the quantum of claims, fines and penalties that may become payable by Imperial and the risk that current sources of funds are insufficient to fund liabilities; risks that Imperial will be unsuccessful in defending against any legal claims or potential litigation; risk of costs arising from any unforeseen longer‐term environmental consequences of the Mount Polley Breach; risks of protesting activity and other civil disobedience restricting access to the Company’s properties; failure of plant, equipment or processes to operate in accordance with specifications or expectations; cost escalation, unavailability of materials and equipment, labour unrest, power shortages, and natural phenomena such as weather conditions negatively impacting the operation of the Mount Polley mine (until it suspends operations during its expected care and maintenance period during the 2019 second quarter) or the Red Chris mine; the Joint Venture Partnership not closing in a timely manner or at all, with the potential to materially impede the Company’s ability to satisfy its debt obligations as they become due and continue as a going concern; the potential benefits of the Joint Venture Partnership not being realized; conditions precedent or approvals required for the Joint Venture Partnership not being obtained; changes in commodity and power prices; changes in market demand for our concentrate; inaccurate geological and metallurgical assumptions (including with respect to the size, grade and recoverability of mineral reserves and resources); and other hazards and risks disclosed within the Management’s Discussion & Analysis for the year ended December 31, 2018 and other public filings which are available under the Company’s profile on the System for Electronic Document Analysis and Retrieval (“SEDAR”) website at sedar.com. For the reasons set forth above, investors should not place undue reliance on forward‐looking information. Imperial does not undertake to update any forward looking information, except in accordance with applicable securities laws.
‐ 5 ‐
Imperial Metals Corporation | 2018 Annual Information Form
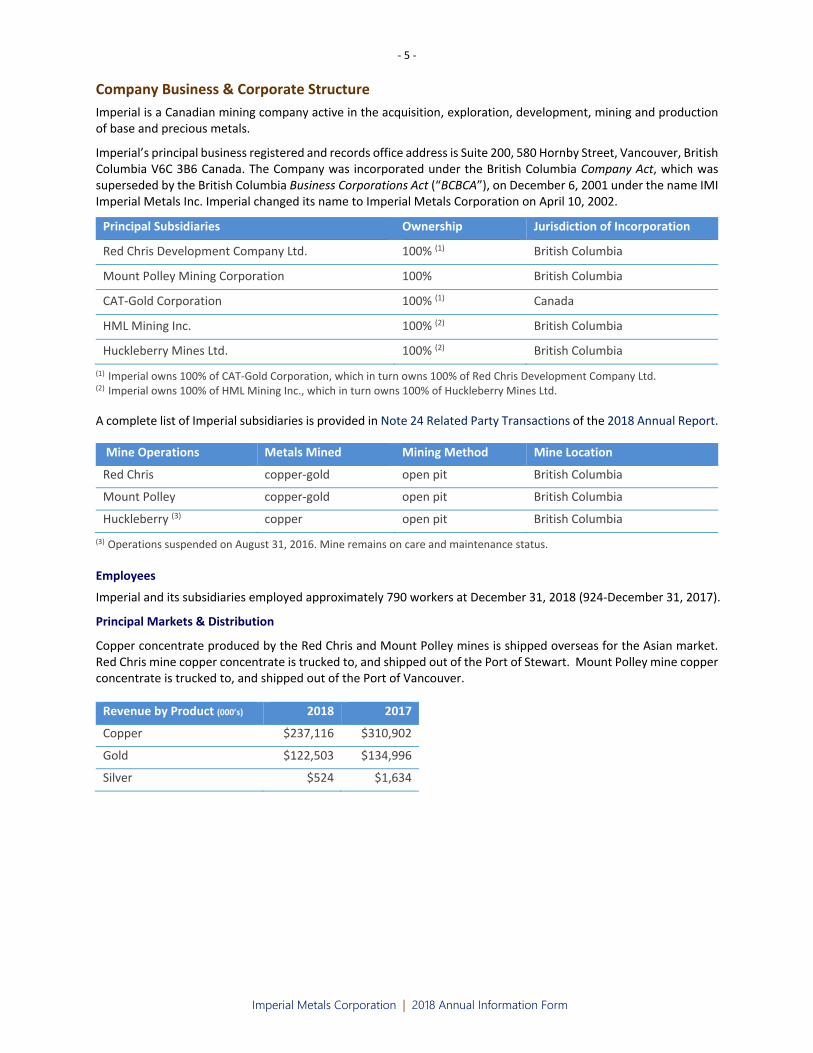
Company Business & Corporate Structure
Imperial is a Canadian mining company active in the acquisition, exploration, development, mining and production of base and precious metals.
Imperial’s principal business registered and records office address is Suite 200, 580 Hornby Street, Vancouver, British Columbia V6C 3B6 Canada. The Company was incorporated under the British Columbia Company Act, which was superseded by the British Columbia Business Corporations Act (“BCBCA”), on December 6, 2001 under the name IMI Imperial Metals Inc. Imperial changed its name to Imperial Metals Corporation on April 10, 2002.
Principal Subsidiaries Ownership Jurisdiction of Incorporation
Red Chris Development Company Ltd. 100% (1) British Columbia
Mount Polley Mining Corporation 100% British Columbia
CAT‐Gold Corporation 100% (1) Canada
HML Mining Inc. 100% (2) British Columbia
Huckleberry Mines Ltd. 100% (2) British Columbia
(1) Imperial owns 100% of CAT‐Gold Corporation, which in turn owns 100% of Red Chris Development Company Ltd. (2) Imperial owns 100% of HML Mining Inc., which in turn owns 100% of Huckleberry Mines Ltd.
A complete list of Imperial subsidiaries is provided in Note 24 Related Party Transactions of the 2018 Annual Report.
Mine Operations Metals Mined Mining Method Mine Location
Red Chris copper‐gold open pit British Columbia
Mount Polley copper‐gold open pit British Columbia
Huckleberry (3) copper open pit British Columbia
(3) Operations suspended on August 31, 2016. Mine remains on care and maintenance status.
Employees
Imperial and its subsidiaries employed approximately 790 workers at December 31, 2018 (924‐December 31, 2017).
Principal Markets & Distribution
Copper concentrate produced by the Red Chris and Mount Polley mines is shipped overseas for the Asian market. Red Chris mine copper concentrate is trucked to, and shipped out of the Port of Stewart. Mount Polley mine copper concentrate is trucked to, and shipped out of the Port of Vancouver.
Revenue by Product (000’s) 2018 2017
Copper $237,116 $310,902
Gold $122,503 $134,996
Silver $524 $1,634

‐ 6 ‐
Imperial Metals Corporation | 2018 Annual Information Form
Competitive Conditions and Cycles
The Company’s business is to produce and sell metal concentrates at prices determined by world markets over which we have no influence or control. These markets are cyclical. Our competitive position is determined by our costs compared to those of other producers throughout the world, and by our ability to maintain our financial capacity through metal price cycles and currency fluctuations. Costs are governed principally by the location, grade and nature of mineral deposits, labour, costs of equipment, fuel, power and other inputs, as well as by operating and management skill. Over the long term, our competitive position will be determined by our ability to locate, acquire and develop economic mineral deposits and replace current production, as well as by our ability to hire and retain skilled employees. In this regard, we also compete with other mining companies for employees, mineral properties, joint venture agreements, capital and the acquisition of investments in other mining companies.
Environmental Protection
Our current and future operations, including development activities and production on our properties or areas in which we have an interest, are subject to laws and regulations governing protection and remediation of the environment, site reclamation, management of toxic substances and similar matters. Compliance with these laws and regulations can affect the planning, designing, operating, closing and remediating of our mines.
We work to apply technically proven and economically feasible measures to protect the environment throughout exploration, construction, mining, processing and closure. Although we believe that our operations and facilities are currently in substantial compliance in all material respects with all existing laws, regulations and permits, there can be no assurance that additional significant costs will not be incurred to comply with current or future regulations or that liabilities associated with non‐compliance will not be incurred.
The total liability for reclamation and closure cost obligations, which represent the Company’s estimate of the present value of future cash outflows required to settle estimated reclamation obligations at the end of a mine’s life associated with the Mount Polley, Red Chris, Huckleberry and Ruddock Creek properties, as calculated for financial disclosure purposes at December 31, 2018 was $97.7 million (2017‐$98.2 million). This amount incorporates estimated future costs, inflation, and risks associated with the future cash outflows, assuming a pre‐tax discount rate of 3.15%. Changes in any of these factors can result in a change to future site reclamation liabilities and the related accretion of future site reclamation provisions. At December 31, 2018 the Company had a provision of $3.3 million (2017‐$5.3 million) for future rehabilitation activities related to the Mount Polley Breach (ref: page 11).
Specialized Skill and Knowledge
The nature of the Company’s business requires specialized skills and knowledge. Such skills and knowledge include the areas of permitting, geology, implementation of exploration programs, operations, treasury and accounting. To date, Imperial has been successful in locating and retaining employees and consultants with such skills and knowledge and believes it will continue to be able to do so.
Risk Factors
There are material risks that could cause actual results to differ materially from our current expectations. The risks associated with our business, include those related to, but are not limited to: risks inherent in the mining and metals business; commodity price fluctuations and the effects of hedging; competition for mining properties; sale of products and future market access; mineral reserves and resource estimates; currency fluctuations; interest rate risks; financing risks; the risk that further advances may not be available under credit facilities; risks associated with maintaining substantial levels of indebtedness, including potential financial constraints on operations; regulatory and permitting risks; environmental risks; joint venture risks; foreign activity risks; legal proceedings; and other risks and uncertainties. Additional risks and uncertainties not presently known to us or that we currently consider immaterial may also impair our business operations. If any of these events actually occur, our business, prospects, financial condition, cash flows and operating results could be materially harmed. Full disclosure is provided in the Company’s Management’s Discussion & Analysis for the year ended December 31, 2018 under Risk Factors filed on sedar.com.

‐ 7 ‐
Imperial Metals Corporation | 2018 Annual Information Form
General Development & Outlook
Corporate
In January 2015, the Company completed a $50 million revolving second lien secured credit facility with the Bank of Montreal maturing on April 1, 2017 ("Second Lien Credit Facility"). The terms and conditions of the credit facility were modelled after the $200 million senior secured credit facility completed by the Company on March 12, 2014 ("Senior Credit Facility"), adjusted to reflect the second lien. Edco Capital Corporation (“Edco”), a company controlled by N. Murray Edwards (“Edwards”), a significant shareholder of the Company, guaranteed the Second Lien Credit Facility in consideration for which Edco received an annual fee of 2% of the loan amount payable monthly. The Second Lien Credit Facility provided additional liquidity for the commissioning and start‐up of the Red Chris mine and for general working capital purposes.
In May 2015, the Company entered into a $30 million short term facility to provide interim funding for the Company while it completed three financings aggregating gross proceeds of $80 million: (1) a rights offering (the “2015 Rights Offering”) to raise $44 million backstopped by the Company’s two largest shareholders; (2) a private placement of common shares (“2015 Common Share Private Placement”) to raise $6 million; and (3) a private placement of convertible debentures (“2015 Convertible Debenture Private Placement”) to raise $30 million (collectively the “2015 Financings”).
The non‐brokered 2015 Convertible Debenture Private Placement closed on August 24, 2015 for gross proceeds of $30 million.
The proceeds from the 2015 Financings were used to provide additional liquidity to the Company as it ramped up production at the Red Chris mine, continued to work towards a restart of full operations at the Mount Polley mine, for general working capital, and to repay the $30 million short term loan facility.
Edwards and The Fairholme Partnership, LP (“Fairholme”) (together, the “Guarantors”) committed to backstopping the 2015 Financings. In exchange for backstopping the 2015 Financings, the Company paid the Guarantors a fee of 3% of the gross proceeds of the 2015 Financings, excluding proceeds from (i) the exercise of rights pursuant to the 2015 Rights Offering issued in respect of common shares owned or over which the Guarantors or their affiliates have control and (ii) the sale of common shares and convertible debentures the Guarantors or their affiliates had committed to purchase pursuant to the 2015 Common Share Private Placement and the 2015 Convertible Debenture Private Placement.
In May 2016, Imperial extended the maturity date of the Senior Credit Facility from October 1, 2016 to March 15, 2018 and amended certain terms and conditions, including financial covenants. The amount of the facility did not change and remained at $200 million. Concurrently, the Company extended the maturity date of the Second Lien Credit Facility from April 1, 2017 to August 15, 2018 and amended certain terms and conditions, including financial covenants. The amount for the Second Lien Credit Facility did not change and remained at $50 million. Effective January 1, 2016 the financial covenants under both facilities were amended to reflect the impact of reduced commodity prices. The interest rate charged under the amended Senior Credit Facility fluctuates with the financial leverage of the Company. The interest rate in the prior agreement was not linked to the Company’s financial leverage. There was no change in the interest rate charged under the amended Second Lien Credit Facility however the guarantee fee paid to a related party for guaranteeing this facility was amended to fluctuate with the financial leverage of the Company on the same basis as the interest rate will fluctuate under the amended Senior Credit Facility. The guarantee fee was previously a fixed rate and not linked to the Company’s financial leverage.
On December 30, 2016 Imperial closed a $65 million private placement of common shares. The Company issued 11,818,182 common shares at a price of $5.50 per share for gross proceeds of $65 million. Edwards and Fairholme purchased $30 million (5,454,545 common shares) and $13.1 million (2,379,093 common shares) of the financing, respectively. In addition, a director of the Company purchased $1.5 million (272,727 common shares) of the financing. The proceeds of the financing were used to improve working capital and for general corporate purposes.
In February 2017, the Company amended certain financial covenants under the Second Credit Facility for March 31, June 30 and September 30, 2017 reporting periods, as follows:
a minimum EBITDA test to replace the fixed charge coverage ratio
an increase to the maximum total debt to EBITDA ratio
an increase to the maximum secured debt to EBITDA ratio

‐ 8 ‐
Imperial Metals Corporation | 2018 Annual Information Form
a reduction to the minimum liquidity test for the period April 1, 2017 to December 1, 2017
The interest rate charged under the Senior Credit Facility varies with the Company’s financial leverage. A new interest rate bracket was added to reflect the revised maximum leverage.
On July 31, 2017, the Company closed a $20 million bridge loan financing (the “Bridge Loan”) with Edco and Fairholme, each of which provided $10 million of the Bridge Loan. Proceeds were used for general working capital purposes and to support ongoing operations. The Bridge Loan is secured by all assets of the Company, and is subordinated to the Senior Credit Facility and Second Lien Credit Facility lenders. Interest on the Bridge Loan is payable monthly commencing on August 31, 2017 at 8% per annum. The September 30, 2017 maturity date was extended to October 13, 2017 to allow Senior Credit Facility Lenders additional time to review and obtain approvals for the financing plan provided on August 14, 2017.
On October 27, 2017, the Company announced a financing plan update as follows:
Senior Credit Facility and Second Lien Credit Facility lenders agreed to permanently waive the breach of EBITDA covenant related to the quarter ended June 30, 2017. And the Senior Credit Facility and Second Lien Credit Facility was extended to October 1, 2018 and December 1, 2018, respectively. A fee of $500,000 was paid in respect of the amendments. Two of the four financial covenants will be removed leaving only a Senior Debt to EBITDA covenant of 3.75:1 and a minimum liquidity covenant of $5 million.
A non‐brokered private placement consisting of units of the Company raising gross proceeds of $5 million. The proceeds were used for general corporate purposes. Under the private placement, the Company issued 1,818,182 units at a price of $2.75 per unit. Each unit consisted of one common share and one‐half of one transferable common share purchase warrant. Each whole warrant entitles the holder to purchase, for a period of 24 months from the date of issue, one additional common share of the Company at a price of $3.25 per share. Edwards purchased approximately $4.6 million (1,686,082 units), and directors and officers of the Company purchased approximately $0.4 million (132,100 Units).
A $10 million unsecured debt facility (“2017 LOC Loan Facility”) provided by an affiliate of Edwards. The 2017 LOC Loan Facility became available on November 1, 2017, bearing interest at 12% per annum, and maturing on January 5, 2019. An arrangement fee of $50,000 was paid on closing. The 2017 LOC Loan Facility was used for general working capital purposes, including capital expenditures.
The Company confirmed that from the respective next interest payment dates until January 1, 2019, the interest on its existing $75 million Junior Credit Facility, all of the $115 million 2014 Convertible Debentures and $27.9 million of the $30 million 2015 Convertible Debenture Private Placement.
The Bridge Loan was confirmed to increase by $6 million to $26 million effective October 31, 2017, with half the increase to be provided by an affiliate of Fairholme. and the maturity date was extended to January 5, 2019. A fee of $65,000 was paid in respect of the extension/increase. The interest rate remained at 8% per annum.
On December 22, 2017, the Company completed a rights offering (the "2017 Rights Offering") pursuant to which it issued a total of 19,080,978 common shares at a price of $2.25 per common share for gross proceeds of $42.9 million. The Company issued a total of 16,119,049 common shares under basic subscription privileges in the 2017 Rights Offering and a total of 2,961,929 common shares under additional subscription privileges, resulting in a fully subscribed rights offering. As a result of the 2017 Rights Offering, the conversion price of the convertible debentures issued in 2014 was reduced from $11.91 to $11.69 per common share and the conversion price of the convertible debentures issued in 2015 was reduced from $12.00 to 11.77 per common share.
Edwards and East Lane LLC (“2017 Guarantors”) committed to backstopping the 2017 Rights Offering. In exchange, the Company paid the 2017 Guarantors a cash fee equal to 3% of the gross proceeds of the portion of the 2017 Rights Offering they each guaranteed, which excluded proceeds from the exercise of rights issued in respect of common shares owned by the 2017 Guarantors, and certain other parties.
In January 2018, the Company issued 2,353,274 common shares at an ascribed value of $2.64 per share for a total of $6.2 million in payment of the interest due on December 31, 2017 on the Junior Credit Facility, the 2014 Convertible Debentures and $27.9 million of the $30 million 2015 Convertible Debentures Private Placement. Included in these amounts are 1,387,447 common shares for a total of $3.7 million issued to related parties.
In April 2018, the Company issued 816,414 common shares at an ascribed value of $2.24 per share for a total of $1.83 million in payment of the interest due on March 31, 2018 on the Junior Credit Facility.

‐ 9 ‐
Imperial Metals Corporation | 2018 Annual Information Form
In July 2018, the Company issued 3,107,425 common shares at an ascribed value of $1.97 per share for a total of $6.12 million in payment of the interest due on June 30, 2018 on the Junior Credit Facility, the 2014 Convertible Debentures and $27.9 million of the $30.0 million face value of the 2015 Convertible Debentures. Included in these amounts are 1,834,220 common shares at an ascribed value of $1.97 per share for a total of $3.61 million issued to related parties.
On September 17, 2018, the Company provided a financial and business restructuring process update as follows.
• The due date of the Senior Credit Facility of $200 million was extended from October 1, 2018 to February 15, 2019. The Senior Credit Facility is supported by a guarantee from Edco for an annual fee of 225 basis points. The annual guarantee fee is less than the reduction in the interest rate charged on the extended Senior Credit Facility, and results in reduced interest expense to the Company. All the financial covenants that were in place on the Senior Credit Facility were removed from the extended credit facility.
• The due date of the Second Lien Credit Facility of $50 million was extended from December 1, 2018 to February 15, 2019, with a reduction in the annual fee for the guarantee of this facility by Edco from 387.5 basis points to 225 basis points.
• The due date of the Bridge Loan of $26 million was extended from January 5, 2019 to February 28, 2019.
• The sale of 0.5% net smelter return royalty interest on the Red Chris project for US$17 million to Prairie Birch Royalties Ltd., a company of which a significant shareholder of the Company is a minority equity shareholder. This royalty is subject to a 100% buyback option granted to Imperial for four years at the sum of US$17 million plus simple interest thereon at 11% per annum (6% per annum in the event the buyback option were exercised prior to January 31, 2019) less the aggregate amount of royalty payments paid.
• Steps were initiated to rationalize and improve operations at both of the Company’s operating mines.
• A Special Committee was established by the Board of Directors, is authorized to identify, consider, negotiate and potentially implement all strategic alternatives including sales of some of the Company’s assets, joint ventures, a recapitalization, and a sale or merger of the Company.
On November 27, 2018, the Company announced that an action for damages arising out of the August 4, 2014 failure of the perimeter embankment at the Mount Polley mine was settled among all the parties to the action in consideration of net payments to the Company totaling approximately $108 million. The Company exercised the existing early buyback option to repurchase the 0.5% net smelter return royalty interest in the Red Chris project sold in September 2018. The buyback option provided for the repurchase of this royalty by the Company for US$17 million plus simple interest at 6% per annum.
In January 2019, the Company issued common shares in payment of interest on debt:
3,542,814 common shares at an ascribed value of $1.22 per share for a total of $4.32 million in payment of the interest due on December 31, 2018 on $27.9 million of the $30.0 million face value of the 2015 Convertible Debentures. Included in these amounts are 1,428,035 common shares at an ascribed value of $1.22 per share for a total of $1.74 million issued to related parties.
1,549,517 common shares at an ascribed value of $1.22 per share for a total of $1.89 million in payment of the interest due on December 31, 2018 on the Junior Credit Facility. These shares were all issued to a related party.
1,235,563 common shares at an ascribed value of $1.53 per share for a total of $1.89 million in payment of the interest due on September 30, 2018 on the Junior Credit Facility. These shares were all issued to a related party.
On January 7, 2019, the Company announced that, due to declining copper prices, the operations at the Mount Polley mine will be suspended at the end of May 2019.
On March 10, 2019, the Company announced that it had entered into an agreement to sell a 70% interest in its Red Chris copper and gold asset to Newcrest Mining Limited (“Newcrest”) (ASX: NCM) for US$806.5 million in cash (the “Joint Venture Partnership”), while retaining a 30% interest in the mine. The Company and Newcrest will form a joint venture for the operation of the Red Chris asset going forward, with Newcrest acting as operator. The consideration payable will be subject to customary adjustments for certain assumed equipment loans, working capital and non‐financial debt at closing. The sale is subject to customary conditions precedent including all required regulatory approvals and the assignment or transfer of material permits and contracts. Closing is expected to occur in the third quarter of 2019, with an outside date for closing of August 15, 2019.
‐ 10 ‐
Imperial Metals Corporation | 2018 Annual Information Form
Subsequent to December 31, 2018, the Company extended the maturity date of a number of its credit facilities on February 15, March 7 and March 14, to provide additional time to complete the transaction with Newcrest.
As at the filing date of this AIF:
the Senior Credit Facility maturity date had been extended from March 15, 2019 to September 5, 2019;
the Second Lien Credit Facility maturity date had been extended from March 15, 2019 to September 9, 2019;
the Bridge Loan maturity date had been extended from March 15, 2019 to September 11, 2019; and
the Junior Credit Facility maturity date had been extended from March 15, 2019 to September 12, 2019.
On March 15, 2019, the Company refinanced US$98,445,000 of its 7% US$325 million Senior Unsecured Notes due March 15, 2019 (the “Senior Notes”). Edco subscribed for US$98,445,000 of additional Senior Notes (principal amount of US$1,000 each) on the same terms and conditions as the existing Senior Notes. Such funding enabled the Company to repay an equal dollar amount of the principal of the Senior Notes that were payable in full Friday March 15, 2019, being US$98,445,000. The remaining existing holders of Senior Notes in the principal amount of US$226,555,000 agreed, as did Edco in respect to the additional Senior Notes, to extend the maturity date of the Senior Notes until September 15, 2019.
Red Chris Mine
Red Chris Development Company Ltd. (“RCDC”) is current owner/operator of the Red Chris copper/gold mine in northwest British Columbia.
The first full year of commercial production for Red Chris mine was 2016, during which the mill achieved 87.9% of design capacity, averaging 26,371 tonnes per calendar day. The focus was on optimizing operations to improve copper recovery. Recovery improved with an increase in ore mined from the Main zone pit lower benches. A revised reagent scheme was implemented in late 2016. An additional flotation cell was installed and a comprehensive off‐site program of metallurgical test‐work was completed on drill core samples of ore, milled later that year, to further investigate possible improvements to the metallurgical response of Main zone ores.
For the year 2017, the Red Chris mill achieved 95% of design capacity, averaging 28,433 tonnes per calendar day. Mining equipment, including five 150 tonne haul trucks from the Huckleberry mine and a new electric‐powered hydraulic excavator, were mobilized to increase the mining rate to about 130,000 tonnes per day, providing quicker access to the deeper higher grade portions of the Main and East zones.
Preliminary engineering studies were conducted to determine the optimum method to mine the deep resource below the current designed pits. Based on this work, the block cave method was selected for advancement with respect to both the East and Main pits. A drill program was conceptualized to provide information required to further advance the block cave studies.
In 2018, the Red Chris mill achieved 97.4% of design capacity averaging 29,228 tonnes per calendar day. The five haul trucks from Huckleberry mine were fully operational within the first quarter of 2018. The newly procured electric hydraulic shovel was operational in the third quarter of 2018.
Work advanced on the underground resource conceptualization in conjunction with Golder Associates. In the second quarter of 2018, a geotechnical hole was completed to gather geotechnical information regarding the proposed block cave; notably, this hole also intersected significant copper and gold mineralization below the East zone pit. Work on a preliminary economic assessment of the block cave potential, incorporating the information from the geotechnical drill hole, was initiated in 2018 by Golder Associates.
MillSlicer was installed on the SAG mill in July 2018 to improve overall control of the mill. This vibration‐based signal is in addition to the electronic ear, bearing pressure and mill power used in controlling mill fill level. Expectations from the increased response time of these new signals is improved production and mill liner life.
During 2018, work was initiated on the diagnosing of the high clay ore in the mineralized faults present in the Main zone and East zone, with results integrated into operational recovery models in advance of the 2019 production plan. Segregation of faulted material for plant‐scale batch processing of fault material commenced in the fourth quarter of 2018, with the first planned plant‐scale ‘baseline’ run in January 2019.
The 2019 production plan was developed following an in‐depth review of historic data, with key assumptions being identified and validated against past performance. The plan reflects a lower mining rate as compared to 2018 (105,000 tonnes per day vs. 130,000 tonnes per day). The metal production for 2019 was estimated by a similar

‐ 11 ‐
Imperial Metals Corporation | 2018 Annual Information Form
application of historic data for incorporation of mill availability, throughput (tonnes per operating hour) and recovery.
In the third and fourth quarters of 2018, the Company used its own resources for construction of the tailings impoundment (“TIA”) area because the independent contractors constructing the TIA were redirected to respond to the wildfires in the local region. This diversion of primary mine operation hauling units to the TIA resulted in a lower productivity in mining operations during those periods.
The management structure at Red Chris mine was reorganized in the third quarter of 2018. Randall Thompson, Imperial Vice President Operations, was appointed as Red Chris Mine General Manager, with a mandate to direct improvements of the mine operations.
The Joint Venture Partnership announced on March 10, 2019, with Newcrest as operator, will enable the Company to unlock significant value at Red Chris by leveraging Newcrest’s unique technical expertise in block caving operations.
Mount Polley Mine
Mount Polley Mining Corporation (“MPMC”) is owner/operator of the Mount Polley copper‐gold mine in south‐central British Columbia.
Legal proceedings were initiated by the Company in 2016 for the recovery of losses related to the August 4, 2014 tailings dam breach at the Mount Polley mine (“Mount Polley Breach”).
Rehabilitation of terrestrial and aquatic zones, affected by the Mount Polley Breach, progressed throughout 2016, informed by an ongoing detailed site investigation, risk assessments and environmental monitoring. Work is ongoing and in cooperation with the regulatory authorities, First Nations and the local communities.
During 2017, mining occurred mainly in the Cariboo pit, and was supplemented at times from low grade stockpiles. Mine operations were temporarily suspended July 15‐31, 2017 as a result of an Evacuation Order, issued by the Cariboo Regional District for the City of Williams Lake and surrounding areas, due to forest fires. The mine resumed activities July 31, 2017 and was fully operational by August 2, 2017.
Dredging of tailings, deposited in the Springer pit in 2015‐2016 to allow for restart of milling operations prior to repair of the tailings storage facility (“TSF”), commenced in early 2018. Mining operations in the Cariboo pit were completed in late 2018, and the mill relied on feed from the low grade stockpiles since that time. Dredging work in the Springer pit was suspended for the winter.
In early 2018, MPMC was in mediation with USW Local 1‐2017 to renew a collective agreement which had terminated December 31, 2017. Mediation efforts proved unsuccessful, and on May 23, 2018 MPMC initiated a lock out of its employees, following which unionized employees began strike action. Following further negotiations, in August 2018 unionized employees voted 79% to accept a new three year contract, effective as at January 1, 2018.
In November 2018, the legal action for damages arising from the Mount Polley Breach were settled among all parties to the action, in consideration of net payments to the Company totaling approximately $108 million. This settlement represents compromises of disputed claims and does not constitute an admission of liability on the part of any party to the action.
On January 7, 2019, the Company announced operations at the Mount Polley mine would be suspended due to declining copper prices. Milling of low grade stockpiles are targeted to continue until May 2019, at which time the mine will be placed on care and maintenance until the economics of mining improve.
Huckleberry Mine
Huckleberry Mines Ltd. (“HML”) is owner/operator of the Huckleberry copper mine in west‐central British Columbia. Prior to April 28, 2017 Imperial held a 50% interest in HML. On April 7, 2017, HML exercised its right of first refusal to purchase for cancellation all the shares of HML held by a syndicate of Japanese companies which held the other 50% interest, in exchange for cash consideration of $2.0 million. The transaction closed on April 28, 2017 and Imperial now holds 100% of the shares of HML through HML Mining Inc., a wholly owned subsidiary of Imperial.
Huckleberry ceased mine operations in August 2016. The mine remains on care and maintenance.
During 2017, a core group of mine personnel focused on site maintenance, mine permit compliance, updating the life of mine plan, and exploration to define the existing resource and further evaluate the Whiting Creek property.
‐ 12 ‐
Imperial Metals Corporation | 2018 Annual Information Form
A preliminary plan to restart the mine has been developed, and will be under consideration for implementation, at such time when the economics of mining improve. In the interim, the Company will develop exploration programs designed to expand the resource.
Ruddock Creek Project
The Ruddock Creek lead‐zinc project is operated by way of a joint venture with Imperial, Mitsui Mining and Smelting Co. Ltd. and Itochu Corporation. Imperial operates the project through its wholly owned subsidiary Ruddock Creek Mining Corporation. Japan Oil, Gas and Metals National Corporation agreed to fund Imperial’s share of the 2018 drill program and upon the completion of the program has the assignable right to be vested in an approximate 1.57% Participating Interest in the joint venture. At that time Imperial’s interest will reduce to approximately 48.43%.
In 2018, a planned three hole diamond drill program targeting the deep extension of the V‐Zone at the Ruddock Creek Project was completed. Drill results from the first surface diamond drill hole RD‐18‐V41 at the Ruddock Creek Project were reported in September 2018 (of a planned three hole program targeting the deep extension of the V‐Zone). Results from the first surface diamond drill hole RD‐18‐V41, included 21.7 m grading 16.99% zinc, 3.44% lead and 2.41 g/t silver, which included 10.4 m grading 25.70% zinc, 5.41% lead and 3.44 g/t silver. The drill hole targeted the V‐Zone mineralization 425 m below surface and about 300 m below the deepest previous mineralized intercept in the zone. Drill hole RD‐18‐V41 was collared near the valley floor of Oliver Creek at an elevation of approximately 1,191 m above sea level and drilled to a final depth of 828.8 m.
The V‐Zone is located near the western edge of the Ruddock Creek massive sulphide horizons, which have an indicated strike length of about five km, and is approximately two km west of the Creek Zone, the nearest zone of detailed drilling. Little or no exploration drilling has been conducted along the intervening section of the horizon. The V‐Zone strikes east‐west and dips at about 70° to the north. The zone had been traced with surface showings and by shallow drilling for a horizontal distance of about 700 m, and with this recent intersection, to a depth of approximately 425 m. Due to the steep terrain, long nearly flat drill holes from near the valley bottom were designed to test the zone at depth. Hole RD‐18‐V41 was drilled using an underground diamond drill rig bolted to a road accessible cliff face at an azimuth of 27° and a dip of plus 10°. Core size was HQ to a depth of 450 m. When the core size was reduced to NQ size, the hole was drilled to a final depth of 828.8 m.
The decision to drill test the V‐Zone at such a depth beneath the nearest intercept was supported by the highly predictable nature of the zinc‐lead mineralization intercepted in the shallower helicopter supported surface diamond drill holes, electromagnetic and magnetic geophysical anomalies, and a re‐interpretation of the geology. The V‐Zone in hole RD‐18‐V41, which was projected to be intersected at a depth of 750 m, was intercepted at 751.5 m, confirming the anticipated predictability of the zone at depth. The highest grades previously intersected in the V‐Zone were in holes RD‐12‐V38, which intercepted 17.77% zinc and 3.72% lead over a true width of approximately 7.6 m, and RD‐12‐V40, which intercepted 10.00% zinc and 1.80% lead over a true width of approximately 10.9 m.
Drill hole RD‐18‐42, drilled at ‐10° below RD‐18‐41 to a final depth of 1,003.9 m, targeted the mineralization 300 m below the intersection in hole RD‐18‐41, at an estimated in hole depth of 834 m. Unfortunately, the hole intersected a late stage pegmatite dyke or sill from a depth of 805‐956 m with no significant base metal mineralization intersected. Drill hole RD‐18‐43, drilled at 0° (flat) in between RD‐18‐41 and 42 to a final depth of 831.5 m, targeted the mineralization 120 m below the intersection in hole RD‐18‐41 at an estimated in hole depth of 790‐800 m. The favorable calc‐silicate host rock was intersected from 747‐775 m with narrow 2‐10 cm, stringer semi‐massive sphalerite‐galena mineralized bands intersected but not comparable to the intersection in hole RD‐18‐41. The best two intervals intersected were 6.31% zinc, 0.5% lead and 11.0 g/t silver over 0.5 m from 751.44 m to 751.94 m, grading 5.89% zinc and 0.04% lead over 0.5 m from 767.18 m to 767.68 m. The intervals are approximately true thickness.
SJ Geophysics completed an in‐hole EM and Magnetic survey in hole RD‐18‐43 but holes RD‐18‐41 and 42 were not able to be surveyed due to hole conditions. The survey outlined a significant off‐hole EM and Magnetic response for such a zinc rich system in the area of the favorable calc‐silicate host and stringer style zinc‐lead mineralization.
Jim Miller‐Tait, P.Geo., VP Exploration is the designated Qualified Person as defined by National Instrument 43‐101 for the exploration program, and has reviewed and approved disclosure relating to drill hole RD‐18‐V41. Ruddock Creek samples for the 2018 drilling reported were analyzed at Bureau Veritas Mineral Laboratories in Vancouver, British Columbia. A full QA/QC program using blanks, standards and duplicates was completed.
Plans for further exploration of the western edge of the massive sulphide horizons have been developed and are being discussed with our joint venture partners.

‐ 13 ‐
Imperial Metals Corporation | 2018 Annual Information Form
MINERAL PROPERTY: RED CHRIS MINE
Current Technical Report
The 2012 Red Chris Report dated February 14, 2012, was amended and restated on September 30, 2015.
Description, Location & Access
The Red Chris mine is located in northwest British Columbia, 18 km southeast of Iskut, 80 km south of Dease Lake, and 12 km east of Highway 37. Road access to the property from Highway 37 is via an 18 km gravel road, providing all‐weather access to the site and a year‐round working season. Power is accessed via a 16 km 287 kV power line from the Tatogga substation. Elevations range from 1,100 masl to 1,550 masl. Mining and milling operations proceed year round.
The Town of Smithers and the City of Terrace are the closest supply centres. Commercial aircraft service the Dease Lake airport located 118 km north by road from the mine site along Highway 37. Stewart is the nearest port with ship loading facilities, a distance of 320 km (by road) from the Red Chris property.
The Red Chris mine employs approximately 492 workers. The mine operates as a fly‐in/fly‐out site with the majority of employees on a two week rotation. Chartered aircraft fly employees to the Dease Lake airstrip from where they are transported by bus to the mine site.

‐ 14 ‐
Imperial Metals Corporation | 2018 Annual Information Form
The Red Chris property comprises the Red Chris Main claim group and the Red Chris South group, and consists of 77 mineral tenures that cover a total area of 23,142 ha. All mineral tenures are issued in accordance with the Mineral Tenure Act of British Columbia and are 100% owned by RCDC. The Red Chris Main claim group consists of 50 mineral tenures covering 17,046 ha, five of which are 30 year mining leases valid until June 20, 2042 that cover 5,141 ha in addition to 45 mineral claims (eight valid until October 31, 2021, 35 to October 31, 2026, one valid to April 8, 2019 and one valid to July 18, 2019) encompassing 11,905 ha.
The five mining leases and 31 mineral claims at the property are subject to a net smelter return royalty held by the Tahltan Central Government. Annual advance royalty payments commenced in October 2016 but will be deducted
‐ 15 ‐
Imperial Metals Corporation | 2018 Annual Information Form
from the production royalty payments when they are initiated. All or portions of four of the mining leases and 19 mineral claims are also subject to a 1.0% net smelter return royalty held by Glencore Canada Corporation. A right of first refusal is retained by RCDC on any disposition of the net smelter royalty by Glencore Canada Corporation. The Red Chris South claim group comprises 27 mineral tenures (one valid to March 12, 2027 and 26 valid until November 11, 2027) covering 6,097 ha. It is subject to a 1.5% net smelter return royalty held by Canada Carbon Inc., however the royalty may be reduced to 0.5% by payment to Canada Carbon Inc. of $1 million.
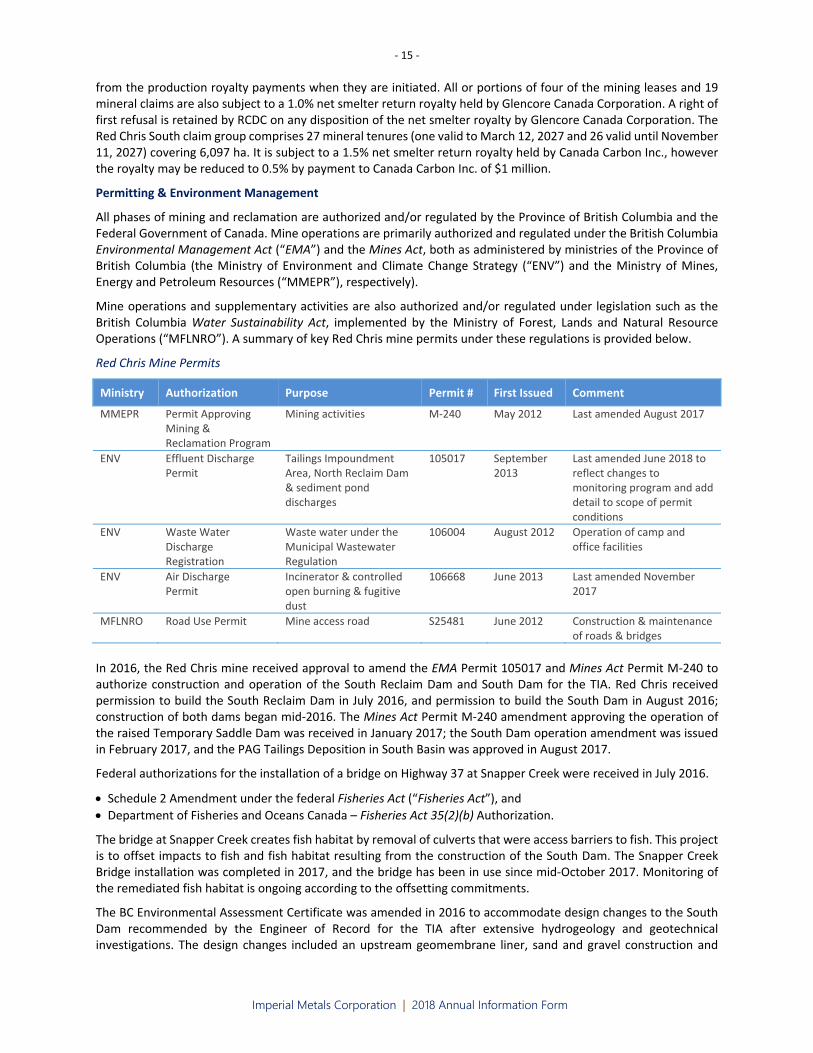
Permitting & Environment Management
All phases of mining and reclamation are authorized and/or regulated by the Province of British Columbia and the Federal Government of Canada. Mine operations are primarily authorized and regulated under the British Columbia Environmental Management Act (“EMA”) and the Mines Act, both as administered by ministries of the Province of British Columbia (the Ministry of Environment and Climate Change Strategy (“ENV”) and the Ministry of Mines, Energy and Petroleum Resources (“MMEPR”), respectively).
Mine operations and supplementary activities are also authorized and/or regulated under legislation such as the British Columbia Water Sustainability Act, implemented by the Ministry of Forest, Lands and Natural Resource Operations (“MFLNRO”). A summary of key Red Chris mine permits under these regulations is provided below.
Red Chris Mine Permits
Ministry Authorization Purpose Permit # First Issued Comment
MMEPR Permit Approving Mining & Reclamation Program
Mining activities M‐240 May 2012 Last amended August 2017
ENV Effluent Discharge Permit
Tailings Impoundment Area, North Reclaim Dam & sediment pond discharges
105017 September 2013
Last amended June 2018 to reflect changes to monitoring program and add detail to scope of permit conditions
ENV Waste Water Discharge Registration
Waste water under the Municipal Wastewater Regulation
106004 August 2012 Operation of camp and office facilities
ENV Air Discharge Permit
Incinerator & controlled open burning & fugitive dust
106668 June 2013 Last amended November 2017
MFLNRO Road Use Permit Mine access road S25481 June 2012 Construction & maintenance of roads & bridges
In 2016, the Red Chris mine received approval to amend the EMA Permit 105017 and Mines Act Permit M‐240 to authorize construction and operation of the South Reclaim Dam and South Dam for the TIA. Red Chris received permission to build the South Reclaim Dam in July 2016, and permission to build the South Dam in August 2016; construction of both dams began mid‐2016. The Mines Act Permit M‐240 amendment approving the operation of the raised Temporary Saddle Dam was received in January 2017; the South Dam operation amendment was issued in February 2017, and the PAG Tailings Deposition in South Basin was approved in August 2017.
Federal authorizations for the installation of a bridge on Highway 37 at Snapper Creek were received in July 2016.
Schedule 2 Amendment under the federal Fisheries Act (“Fisheries Act”), and
Department of Fisheries and Oceans Canada – Fisheries Act 35(2)(b) Authorization.
The bridge at Snapper Creek creates fish habitat by removal of culverts that were access barriers to fish. This project is to offset impacts to fish and fish habitat resulting from the construction of the South Dam. The Snapper Creek Bridge installation was completed in 2017, and the bridge has been in use since mid‐October 2017. Monitoring of the remediated fish habitat is ongoing according to the offsetting commitments.
The BC Environmental Assessment Certificate was amended in 2016 to accommodate design changes to the South Dam recommended by the Engineer of Record for the TIA after extensive hydrogeology and geotechnical investigations. The design changes included an upstream geomembrane liner, sand and gravel construction and

‐ 16 ‐
Imperial Metals Corporation | 2018 Annual Information Form
downstream buttress. This BC Environmental Assessment Certificate process is aligned with the regulatory permitting through the Mine Development Review Committee.
Environmental monitoring programs at the Red Chris mine continue as required under authorizations from the ENV and the MMEPR. Such programs include monitoring of surface water (streams, lakes, and diversions), groundwater, seepage and hydrometric data. RCDC is committed to the future reclamation of the site and has been stockpiling soil recovered from the plant site, mine, rock storage areas and TIA.
The Red Chris Monitoring Committee (“RCMC”) is a requirement of Mines Act Permit M‐240. The RCMC is chaired by representatives from RCDC and the Tahltan Nation. The committee includes members from the ENV, MMEPR and the MFLNRO.
In conjunction with the RCMC, the Environmental Oversight Committee has been established under the Red Chris Impact Benefit and Co‐Management Agreement. The Environmental Oversight Committee is a forum for dialogue between RCDC, the Tahltan Central Government and Tahltan Nation representatives, and the committee’s terms of reference lay out environmental management mechanisms for the committee relating to:
the Environmental Management System,
Red Chris project’s environmental compliance, monitoring and performance,
all Red Chris project‐related environmental information and recommendations concerning environmental matters,
Federal and Provincial Permit applications, and
environmental monitoring programs.
Red Chris History
The first recorded exploration on the property now known as Red Chris was in 1956 when Conwest Exploration Limited examined copper showings on the Todagin plateau. In 1968 Great Plains Development Co. of Canada staked the Chris and Money claims and subsequently completed geological, geochemical and geophysical surveys. In 1970 Silver Standard Mines Ltd. staked the Red and Sus claims to the north and east of the Chris claim group, and followed up in 1971 with mapping, soil surveys and trenching. In 1973 Ecstall Mining Limited (which later became Texasgulf Canada Limited) optioned the Silver Standard claims and drilled 14 percussion holes, intersecting low grade copper mineralization. In 1974 Texasgulf acquired an option on 60% of the combined Red and Chris groups of claims, and initiated a major program from 1974‐1976 comprising 67 diamond drill holes and 30 percussion holes. From 1978 to 1980, Texasgulf drilled seven holes and completed property‐wide geological, geochemical and geophysical surveys, resulting in the delineation of the Red stock and within it the Main and East zones of quartz‐stockwork hosted mineralization.
No exploration was conducted from 1981 to 1994.
In 1994, a series of corporate takeovers and reorganizations resulted in the ownership of the property divided amongst Falconbridge (60%), Norcen Energy (20%), and Teck Corporation (20%). American Bullion Minerals Ltd. (ABML) acquired an 80% interest in early 1994, with Teck Corporation retaining their 20%. In 1994 and 1995, ABML completed mineral claim staking, comprehensive geochemical and geophysical surveys, and diamond drilling totaling 58,187 m over 170 holes. Significant near‐surface copper‐gold mineralization was also discovered in the Gully and Far West zones.
In 2003, Red Chris was under the control of bcMetals Corporation (“bcMetals”). bcMetals drilled 49 holes over 16,591 m and updated the measured, indicated, and inferred resources early in 2004 (ref: NI 43‐101 Technical Report on the Red Chris Copper‐Gold Project, filed by bcMetals December 16, 2004). Subsequent infill drilling of 25 holes over 6,927 m resulted in the re‐modelling of the Main and East zones as a single unit, incorporated into the feasibility study completed by AMEC Americas Ltd. Exploration in 2006 consisted of 14 drill holes (4,679 m) over the reserve and in the Gully zone, and additional drilling required under the terms of a joint venture agreement between bcMetals and Global International Jiangxi Copper Company Ltd., which had previously been announced for the development of Red Chris.
In mid‐2006, Imperial launched a takeover bid for bcMetals. Imperial’s successful acquisition of bcMetals was completed in April 2007 at a cost of $68.6 million, which was funded from cash on hand and a $40 million short term loan facility.

‐ 17 ‐
Imperial Metals Corporation | 2018 Annual Information Form
Historical exploration at Red Chris by previous operators focused on establishing open‐pit mineable reserves above a depth of approximately 400 m. Following the acquisition of Red Chris in 2007, the Company’s strategy was to explore for mineral potential below the planned pit for longer term mine planning.
The first hole (RC07‐335) drilled in the East zone revealed the vertical extent and strength of the system, intersecting 1.01% copper, 1.26 g/t gold and 3.92 g/t silver over its entire 1,024 m vertical length, and ending in strong mineralization. Deep drilling continued in relatively small programs in 2008 (three holes; 2,220 m) and 2009 (nine holes; 11,528 m) while camp and road infrastructure were upgraded. At this time, geophysical surveys were undertaken, including a Titan‐24 deep imaging IP‐MT survey; a property‐wide aeromagnetic survey; and extensive proton ground magnetometer surveys.
A program of deep diamond drilling to over 1,500 m depth over the projected open‐pit footprint intensified in 2010 (47 holes; 52,811 m) and was completed in 2011 (9 holes; 11,650 m), resulting in much refinement of the block model. Deep drilling was also initiated in the Gully zone, intersecting long intervals of mineralization, with improving grade with depth.
An important aspect of the exploration team’s strategy was to use detailed core logging, petrography, and multi‐element geochemistry to determine the porphyry sequence and hydrothermal evolution, and hence a geologic model for the deposit. Thus, the main controls on copper‐gold grade patterns in the East and Main zones are provisionally understood, and provide a working template for future exploration.
Exploration in 2012 was limited to infill drilling early in the year over the projected open‐pit before finalizing the reserve calculation in the 2012 Red Chris Report, and drilling two more holes in the Gully zone. Exploration was suspended in May 2012 to allow for mine construction.
Mapping and rock sampling was conducted in 2013 over the corridor of claims acquired by RCDC to cover the H37P Transmission Line between Bob Quinn and Tatogga, which was completed in November 2014.
In late 2016, three short exploration holes were diamond drilled in the Main zone pit for mine and metallurgical planning.
During 2017, preliminary engineering studies were conducted to determine the optimum method to mine the deep resource below the current designed pits. Based on this work, the block cave method was selected for advancement with respect to both the East and Main pits. A drill program was conceptualized to provide information required to further advance the block cave studies.
Geological Setting, Mineralization & Deposit Types
Red Chris is a porphyry copper deposit in the northern Intermontane Belt of the Canadian Cordillera. It is situated in the accreted geological terrane of Stikinia, which is dominated by island arc volcanic, sedimentary, and plutonic rocks of the Middle to Late Triassic Stuhini Group, and the Early to Middle Jurassic Hazelton Group. Stikinia hosts many important mineral deposits in the region, known as the Golden Triangle, several of which are in the process of mine development or are at an advanced exploration stage.
Red Chris is in the Iskut district, on the northern edge of the Skeena Mountains. Most of the property is situated on the Todagin Upland plateau. The Red Chris deposit on the southern edge of the plateau is hosted by the Red stock, which was emplaced in the very Late Triassic into deformed Stuhini Group sedimentary and volcanic rocks. Lower Hazelton Group volcanic and sub‐volcanic rocks, possibly comagmatic with the Red stock, dominate the western part of the Todagin plateau, unconformably overlying tilted Stuhini Group. Erosion during the Early Jurassic was followed by deposition of mainly sedimentary upper Hazelton Group rocks, and the succeeding Bowser Lake Group in the Middle Jurassic; these units originally covered the partly eroded Red stock and Stuhini Group, but they are now preserved only along the southern margin of the plateau due to southeastward tilting in the Late Cretaceous.
The Red stock is an ENE‐elongate intrusion up to 8 km long by 1.5 km wide at surface. It is a composite intrusion, consisting of a series of porphyries beginning with leucodiorite, which forms the bulk of the stock. This was intruded in the centre by quartz monzonite porphyries, which were coincident with potassic alteration and quartz vein‐hosted copper‐gold mineralization. Finally, late to post‐mineralization monzonite dikes were intruded. The current Red Chris reserve, where open pit mining is ongoing, is divided into the East zone and the Main zone. The East zone is centered on a cupola of quartz monzonite, from where copper‐gold quartz veins emanate for several hundred metres upwards and outwards into leucodiorite wallrock. The Main zone, about 650 m to the west within the open
‐ 18 ‐
Imperial Metals Corporation | 2018 Annual Information Form
pit, is a subordinate but lower grade sub‐centre. Several hundred metres below the surface, the East and Main zones merge into a contiguous body of mineralization. At surface, combined East zone and Main zone mineralization extends about 2,000 m along the stock’s east‐northeast axis; in width, it ranges from at least 100 m in the East zone to 650 m in the Main zone. The depth of significant mineralization is over 1,200 m in the East zone and about 1,000 m in the centre of the Main zone. A further 1.5 km to the west of the open pit are the Gully and Far West exploration zones, which have similar geological characteristics to the East and Main zones. The Gully zone footprint is approximately 400‐500 m across, east‐west. The Far West zone has a smaller footprint and has seen less drilling than the other zones.
Mineralization consists of thin wavy or thicker planar quartz veins and stockworks containing chalcopyrite, bornite and magnetite; these minerals are also disseminated outside the veins. In the upper part of the deposit, where the present open pit reserve lies, the bornite‐rich mineralization was overprinted by sericite and clay alteration and associated sulfidation; here, chalcopyrite and pyrite are the dominant sulfides, with bornite best preserved in the core of the East zone. Gold occurs as microscopic inclusions in the copper sulfides. Molybdenite occurs locally in quartz veins, especially deeper and outside the high‐grade core. The East and Main zones have been affected by syn‐to post‐mineralization faulting, indicated mainly by offsets in the sulfide mineral zonation.
The Red Chris porphyry copper deposit is characterized by the composition of its host rocks, its alteration, and its copper‐gold signature, with only minor molybdenum. It is classified as belonging to the high‐potassium calc‐alkalic type of porphyry system, which includes several world‐class deposits such as Bingham (Utah). The nature of the quartz‐vein hosted mineralization, its correlation with copper‐gold grade, and its close association with a particular porphyry phase (quartz monzonite), all support further classification of Red Chris as an ‘A vein’ type of deposit.
Exploration
A 2016 review by Golder Associates of the potential for utilizing block cave methods to mine the deeper mineralization recommended five long geotechnical drill holes to gather information on rock quality and geomechanical strength. In 2018, one diamond drill hole (RC18‐588) was completed using a triple tube core set‐up and proprietary orientation system. The hole was designed to pass through an area of significant copper and gold mineralization, and ultimately reach where the proposed block cave infrastructure may be constructed and detailed rock quality information was needed. In addition, a selected section of core was taken after logging for metallurgical test work.
Hole RC18‐588 (1,057 m total depth) was collared from the ramp near the bottom of the current East zone pit, and directed to the northeast at ‐65°. As expected, the hole intersected a long interval of nearly continuous chalcopyrite‐pyrite mineralization including 167 m grading 0.7% copper and 0.84 g/t gold. Preliminary results indicate the rock quality and strength in this area is very positive for potential underground development.
The remaining four geotechnical holes can be done at a later date as their collar locations are not expected to interfere with future mining operations.
Sampling, Analysis & Data Verification
Drill core is delivered directly from the drill to the core shack where geological and geotechnical logging is undertaken. Sample intervals are marked at 2.5 m (maximum) intervals starting from zero, or less if required by important geological contacts. Sample tags are filled out and inserted into the core box by a geologist. QA/QC is maintained throughout this process with placement of one standard, one duplicate and one blank sample within every batch of 20 samples, at irregular positions. The marked and tagged core is photographed and then cut axially with a rock saw (or unusually with a hydraulic splitter). One half of the cut core is placed in a clear poly‐ore bag with a sample tag and zap‐strapped. The other half remains in the core box for storage on site in sturdy wooden racks. During the 2007‐2012 exploration programs, samples for analysis were put into rice sacks and zap‐strapped with uniquely numbered ties for added security, ready for collection and shipment by truck either to Acme Analytical Laboratories Ltd. (now operating as Bureau Veritas Mineral Laboratories) or to the Mount Polley mine laboratory, depending on the type of analysis required. After 2012, drill programs have utilized the mine’s own certified assay laboratory for most sample analysis.
Geotechnical or rock quality designation data collected includes core recovery, fracture counts, and core strength, with special attention paid to fault features. Magnetic susceptibility is usually measured over every sample interval. Geological data is recorded into a customized computer database program which serves also to track all analyses as

‐ 19 ‐
Imperial Metals Corporation | 2018 Annual Information Form
they come in, and can be integrated with other computer software for comprehensive deposit modelling. The core recovery experienced by RCDC at Red Chris is close to 100% and the sample quality is considered to be excellent. The sampling is not expected to result in any biases and is expected to be representative of the areas drilled.
Mineral Resource Estimate
The AMEC Americas Ltd. Feasibility Study Report prepared for bcMetals in 2005, was used to guide development of the project within the Provincial and Federal Approval framework.
Total Red Chris Mineral Resource
[Effective Date: February 2, 2012; Amended and Restated Report September 30, 2015]
The original resource estimate, published February 2012, was constrained by a series of Copper Equivalent grade shells, within a wire frame digital solid constructed around the three mineralized deposit domains. The resource was amended and restated in September 2015 with the re‐release of the 2012 Red Chris Report. The amended and restated Resource is based on a combination of an Open Pit and Block Cave constrained Resource used to demonstrate “reasonable prospects of economic extraction” as referred to in NI 43‐101. The 2012 Technical Report also includes a full description of the exploration drilling data used, modeling and estimation method, and the sampling, assaying and QA/QC procedures.
Resource estimates provided in the following Red Chris 2012 tables are as of February 2, 2012 (pre‐start up) and do not take into account any mining since start‐up of operations at the Red Chris mine.
Red Chris 2012 Total Open Pit/Block Cave Resource Estimate
Ore Millions
Mill Head Value
In situ Grades
Material Copper Equiv. Copper Gold Silver Class Tonnes $/tonne (%) (%) (g/t) (g/t)
MEASURED 830.7 $25.13 0.57 0.36 0.36 1.17
INDICATED 203.0 $18.55 0.47 0.30 0.29 1.01
M&I 1,033.7 $23.84 0.56 0.35 0.35 1.14
INFERRED 787.1 $18.65 0.48 0.29 0.32 1.04
Open Pit Mineral Resource [Effective Date: February 2, 2012; Amended and Restated Report September 30, 2015]
The open pit part of the Resource was defined utilizing MineSight Computer Software Lerch‐Grossman pit optimization routine. MineSight computer programs and the Lerch‐Grossman algorithm are acknowledged within the mining industry as creditable tools for this purpose. Key pit specific inputs into the Lerch‐Grossman program were:
Pit slope angle = 42 degrees ‐ which is the average pit slope of the currently approved pit. Mining costs of $1.872 per tonne for the 1470 elevation (starting) bench.
An additional cost of $.052 per tonne was added for each 15 metre bench below the 1470 elevation for increased haulage costs.
Ore Mining Costs of $1.787 per tonne for the 1470 elevation bench.
An additional cost of $.044 per tonne was added for each 15 metre bench below the 1470 (starting) elevation for increased haulage costs.
No capital costs were included for replacement or additional mine equipment fleet purchases.
A portion of the East side of the pit was constrained by approximately 100 m to preserve the current crusher installation.

‐ 20 ‐
Imperial Metals Corporation | 2018 Annual Information Form
Red Chris 2012 Upper Resource Estimate from Open Pit
*Cut‐Off Mill Head
Ore Millions
*Mill Head Value
In situ Grades
Material Material **Copper Copper Gold Silver
Class Type Value ($) Tonnes $/tonne Equivalent (%) (%) (g/t) (g/t)
Measured Stockpile $0.00 6.0 $0.95 0.15 0.11 0.07 0.48
Mill Feed $1.50 676.4 $19.10 0.48 0.32 0.27 1.04
Sub‐total> 682.4 $18.94 0.48 0.31 0.27 1.04
Indicated Stockpile $0.00 0.8 $0.93 0.15 0.11 0.07 0.46
Mill Feed $1.50 164.7 $14.91 0.42 0.27 0.24 0.91
Sub‐total> 165.5 $14.84 0.41 0.27 0.24 0.90
Inferred Stockpile $0.00 20.1 $0.65 0.16 0.08 0.14 1.06
Mill Feed $1.50 377.2 $14.23 0.41 0.25 0.26 0.92
Sub‐total> 397.3 $13.54 0.40 0.24 0.26 0.93
MEASURED 682.4 $18.94 0.48 0.31 0.27 1.04
INDICATED 165.5 $14.84 0.41 0.27 0.24 0.90
M&I 847.9 $18.14 0.47 0.31 0.27 1.01
INFERRED 397.3 $13.54 0.40 0.24 0.26 0.93
Barren Rock 2,407.3
Over Burden 121.0
Strip ratio 2.0
Underground Mineral Resource [Effective Date: February 2, 2012; Amended and Restated Report September 30, 2015]
The vertical orientation of the Red Chris Deposit, coupled with its very large size makes the Deep Red Chris Mineralization attractive to mining by underground block caving methods. The Underground Mineral Resource includes three blocks economically favorable to underground mining by block caving. The three blocks are clipped to the bottom of the open pit discussed above. The key mining parameters used to define those underground mineral resource blocks which have a reasonable prospect of economic extraction are:
All‐in mine development capital cost of $7.94 per tonne.
Operating cost of $8.96 per tonne.
Therefore the targeted mineralization was required to have:
Mill Head Value greater than $16.90 per tonne for the chosen block cave volumes.
Mill Head Value greater than $8.96 per tonne operating cut‐off grade at the draw points.
Average Mill Head Value of all Block Cave Measured & Indicated tonnes is $49.86 per tonne, and Block Cave Inferred tonnes is $23.85 per tonne.

‐ 21 ‐
Imperial Metals Corporation | 2018 Annual Information Form
Red Chris 2012 Lower‐Resource Estimate from Block Cave Including Planned Dilution
Cut‐Off
Mill Head Value ($)
Ore Millions Tonnes
*Mill Head Value
$/tonne
In situ Grades
Material Class
**Copper Copper Gold Silver
Material Type Equivalent (%) (%) (g/t) (g/t)
Measured Mineralized Dilution $0.00 2.9 $6.83 0.28 0.17 0.17 0.82
Draw Point Cut Off $8.96 20.6 $13.60 0.40 0.25 0.25 1.10
Targeted Ore $16.90 124.8 $61.33 1.12 0.61 0.85 1.91
Sub‐total 148.4 $53.62 1.00 0.55 0.75 1.78
Indicated Mineralized Dilution $0.00 0.6 $7.50 0.29 0.19 0.17 0.84
Draw Point Cut Off $8.96 7.3 $13.94 0.41 0.25 0.26 1.17
Targeted Ore $16.90 29.6 $40.73 0.83 0.48 0.57 1.59
Sub‐total 37.5 $34.98 0.74 0.43 0.50 1.50
Inferred Dilution ‐$6.40 64.6 ‐$4.81 0.04 0.02 0.03 0.22
Mineralized Dilution $0.00 18.7 $6.15 0.27 0.16 0.17 0.73
Draw Point Cut Off $8.96 63.2 $13.38 0.40 0.25 0.25 0.98
Targeted Ore $16.90 243.4 $35.52 0.76 0.45 0.52 1.47
Sub‐total 389.8 $23.85 0.56 0.33 0.38 1.15
MEASURED 148.4 $53.62 1.00 0.55 0.75 1.78
INDICATED 37.5 $34.98 0.74 0.43 0.50 1.50
M&I 185.8 $49.86 0.95 0.53 0.70 1.72
INFERRED 389.8 $23.85 0.56 0.33 0.38 1.15
*Mill Head Value is a calculation of the value of material mined, in CDN dollars per metric tonne, once it reaches the Crusher Pocket. This includes all downstream costs from the crusher forward, including: Milling / Concentrate handling and transportation / Treatment and refining / Royalties / Sustaining capital / Administration and head office overhead costs. Large capital costs associated with expansions, such as mining fleet additions, or replacements are not included. See table 17.24 in the Technical report available on this site for metal recovery formulas, costs and parameters used to calculate this value.
**Copper Equivalent % = [Copper Grade (%) + (0.60415 * Gold Grade (g/t))]; based copper/ gold price ratio at Copper ‐ $3.50 /lb, Gold $1,450/oz.
Greg Gillstrom, P.Eng, Senior Geological Engineer, Imperial Metals Corporation, designated the Qualified Person (as defined in NI 43‐101) for the reserve/resource estimates.
Mining and Mineral Processing
The Red Chris mine is a 30,000 t/d open pit conventional milling operation with mining rates of approximately 130,000 t/d. The mining fleet includes an Atlas Copco 351 Pit Viper rotary drill, a Komatsu PC 7000 electric hydraulic excavator, a P&H 2800 electric shovel, a Hitachi 3600 diesel hydraulic shovel, a Komatsu PC2000 diesel hydraulic excavator, a Caterpillar 994 wheel loader, ten Caterpillar 793 haul trucks, five Caterpillar 785 haul trucks, five Caterpillar 777 haul trucks, and associated support equipment. Other mining fleet equipment includes five Caterpillar D10 dozers, three Atlas Copco 780 DTH drills, one Caterpillar 988 wheel loader and one 40 tonne capacity articulated truck.
Mining is currently occurring in the Phase 4 pushback and the Phase 5 pushback, both of which are located in the Main zone portion of the ore body. Mining of NAG material (required for PAG dump foundation blanket, road and project requirements) is also being supplemented by targeted development within the Phase 6 pushback footprint.
‐ 22 ‐
Imperial Metals Corporation | 2018 Annual Information Form
Pits are mined using 12 m high benches and combinations of single and double‐benching at various slope angles. Run‐of‐mine barren rock from the open pit is placed north of the East zone in a rock disposal site where topography allows any runoff to be collected and directed to the processing plant for use and treatment, prior to reporting to the TIA. Low grade material is stockpiled to the north of the primary crusher for easy reclaim and processing later in the mine life. Ore from the open pit and stockpiles is delivered to a 1.4 m x 2.0 m gyratory crusher for crushing to a nominal 150 mm product size. This material is conveyed over a 1.2 m x 2.4 km overland conveyor where it can be held in a 120,000 tonne capacity stockpile before being reclaimed through a tunnel to the plant.
Plant design is based on a standard porphyry copper flow sheet employing SAG and ball milling, flotation, regrinding, thickening and filtering to produce a copper concentrate at a moisture content of 8% for export. The grinding circuit includes a 10.4 m x 4.7 m SAG mill feeding one 7.3 m x 12.8 m ball mill providing a primary grind of approximately 80% passing 150 microns. Coarse rejects from the SAG mill are crushed in a 600 kW pebble crusher. In December 2017, a SAG Recycle Bypass System was installed to allow the coarse rejects to be diverted outside and later trucked to the stockpile. This has allowed maintenance on the conveyor belts downstream of the of the SAG mill without shutting down the grinding circuit. Ball mill product feeds a bank of six 200 m³ rougher flotation cells followed by a 180 m3 scavenger/sulphide tank cell. The cleaning circuit includes one 183 m3 and one 61 m3 cleaner flotation columns and a bank of five 100 m³ cleaner scavenger flotation cells. Regrind cyclone underflow is fed to a 2,200 kW primary regrind ball mill and a 1,120 kW secondary regrind vertical mill to provide a grind of approximately 80% passing 24 microns. The primary and regrind product sizes were determined by the AMEC Americas Ltd. feasibility study to provide the optimum conditions for copper recovery and concentrate grade. Concentrate is thickened and filtered, and then loaded on trucks of nominal 40 tonne capacity for hauling to the Port of Stewart, for subsequent shipment to Asian smelters.
Mill tailings are gravity fed; rougher or NAG tailings to the NAG trench and cleaner scavenger or PAG tailings and sulphide concentrate to the PAG trench. Both tailing streams then flow by gravity in separate HDPE DR11 pipelines; NAG in a 26” pipeline and PAG in a 14” pipeline to the TIA (located 5 km downstream from the mill). Both tailings lines are equipped with choke stations to reduce tailings line wear during the 400 m elevation drop to the TIA. The TIA is located in a valley to the northeast of the processing plant and at present consists of a North Dam and a South Dam.
In 2016, construction was completed on the North Dam to crest elevation of 1122.5 masl, including the downstream buttress. Permits for the construction of the South Dam were received in August 2016. Construction to the 1122.5 masl elevation was completed on this structure, including the installation of a geo‐membrane liner, in November 2016. The Temporary Saddle Dam elevation was also increased to 1120 masl to provide additional storage capacity in the North TIA pending the approval to operate the South Dam.
In 2017, the North Dam crest was raised from elevation of 1122.5 masl to 1128 masl, including advance construction of a portion of the underdrain at the left (west) abutment required for the next crest raise. The South Dam crest was also raised from elevation of 1122.5 masl to 1128.5 masl, including construction of the upstream shell to elevation 1118 masl and completion of the downstream buttress to elevation 1102 masl.
In 2018, construction was completed on the North Dam to crest elevation of 1130.7 masl and the downstream shell (buttress) to median elevation of 1093.7 masl. The South Dam crest was raised to elevation 1131.3 masl and the downstream shell to elevation of 1106.0 masl. The Temporary Saddle Dam is decommissioned and removed from RCDC’s registry of dams as per BGC Engineering Inc. recommendation (LT‐0866007‐0156).
Information on Mining, Milling, Infrastructure, Permitting and Compliance Activities, Environmental, Permitting, Social or Community factors, and Capital and Operating Costs can be viewed in the 2012 Red Chris Report.
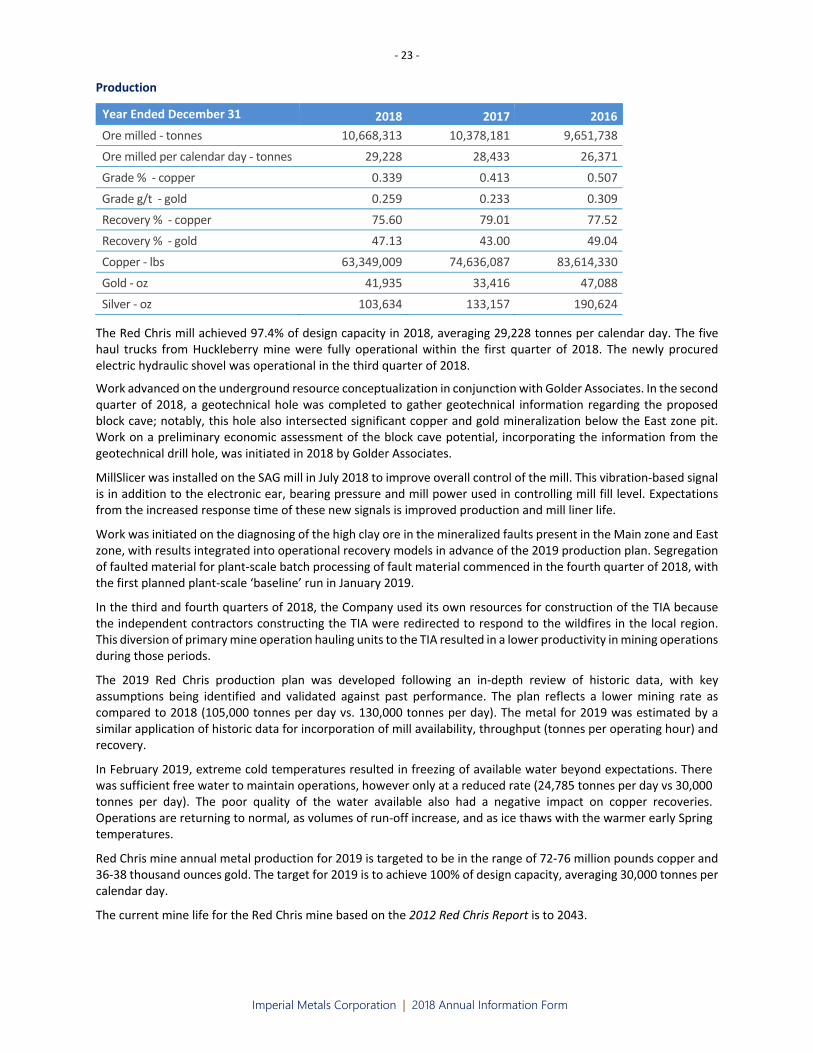
‐ 23 ‐
Imperial Metals Corporation | 2018 Annual Information Form
Production
Year Ended December 31 2018 2017 2016
Ore milled ‐ tonnes 10,668,313 10,378,181 9,651,738
Ore milled per calendar day ‐ tonnes 29,228 28,433 26,371
Grade % ‐ copper 0.339 0.413 0.507
Grade g/t ‐ gold 0.259 0.233 0.309
Recovery % ‐ copper 75.60 79.01 77.52
Recovery % ‐ gold 47.13 43.00 49.04
Copper ‐ lbs 63,349,009 74,636,087 83,614,330
Gold ‐ oz 41,935 33,416 47,088
Silver ‐ oz 103,634 133,157 190,624
The Red Chris mill achieved 97.4% of design capacity in 2018, averaging 29,228 tonnes per calendar day. The five haul trucks from Huckleberry mine were fully operational within the first quarter of 2018. The newly procured electric hydraulic shovel was operational in the third quarter of 2018.
Work advanced on the underground resource conceptualization in conjunction with Golder Associates. In the second quarter of 2018, a geotechnical hole was completed to gather geotechnical information regarding the proposed block cave; notably, this hole also intersected significant copper and gold mineralization below the East zone pit. Work on a preliminary economic assessment of the block cave potential, incorporating the information from the geotechnical drill hole, was initiated in 2018 by Golder Associates.
MillSlicer was installed on the SAG mill in July 2018 to improve overall control of the mill. This vibration‐based signal is in addition to the electronic ear, bearing pressure and mill power used in controlling mill fill level. Expectations from the increased response time of these new signals is improved production and mill liner life.
Work was initiated on the diagnosing of the high clay ore in the mineralized faults present in the Main zone and East zone, with results integrated into operational recovery models in advance of the 2019 production plan. Segregation of faulted material for plant‐scale batch processing of fault material commenced in the fourth quarter of 2018, with the first planned plant‐scale ‘baseline’ run in January 2019.
In the third and fourth quarters of 2018, the Company used its own resources for construction of the TIA because the independent contractors constructing the TIA were redirected to respond to the wildfires in the local region. This diversion of primary mine operation hauling units to the TIA resulted in a lower productivity in mining operations during those periods.
The 2019 Red Chris production plan was developed following an in‐depth review of historic data, with key assumptions being identified and validated against past performance. The plan reflects a lower mining rate as compared to 2018 (105,000 tonnes per day vs. 130,000 tonnes per day). The metal for 2019 was estimated by a similar application of historic data for incorporation of mill availability, throughput (tonnes per operating hour) and recovery.
In February 2019, extreme cold temperatures resulted in freezing of available water beyond expectations. There was sufficient free water to maintain operations, however only at a reduced rate (24,785 tonnes per day vs 30,000 tonnes per day). The poor quality of the water available also had a negative impact on copper recoveries. Operations are returning to normal, as volumes of run‐off increase, and as ice thaws with the warmer early Spring temperatures.
Red Chris mine annual metal production for 2019 is targeted to be in the range of 72‐76 million pounds copper and 36‐38 thousand ounces gold. The target for 2019 is to achieve 100% of design capacity, averaging 30,000 tonnes per calendar day.
The current mine life for the Red Chris mine based on the 2012 Red Chris Report is to 2043.
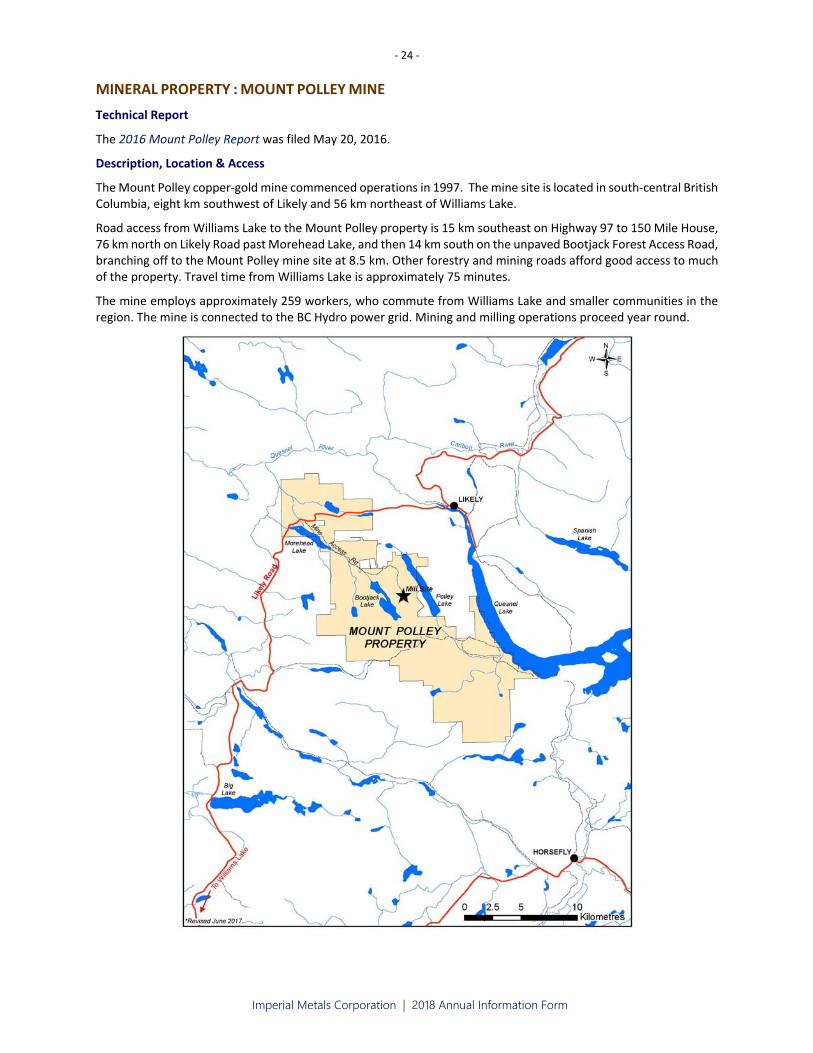
‐ 24 ‐
Imperial Metals Corporation | 2018 Annual Information Form
MINERAL PROPERTY : MOUNT POLLEY MINE
Technical Report
The 2016 Mount Polley Report was filed May 20, 2016.
Description, Location & Access
The Mount Polley copper‐gold mine commenced operations in 1997. The mine site is located in south‐central British Columbia, eight km southwest of Likely and 56 km northeast of Williams Lake.
Road access from Williams Lake to the Mount Polley property is 15 km southeast on Highway 97 to 150 Mile House, 76 km north on Likely Road past Morehead Lake, and then 14 km south on the unpaved Bootjack Forest Access Road, branching off to the Mount Polley mine site at 8.5 km. Other forestry and mining roads afford good access to much of the property. Travel time from Williams Lake is approximately 75 minutes.
The mine employs approximately 259 workers, who commute from Williams Lake and smaller communities in the region. The mine is connected to the BC Hydro power grid. Mining and milling operations proceed year round.
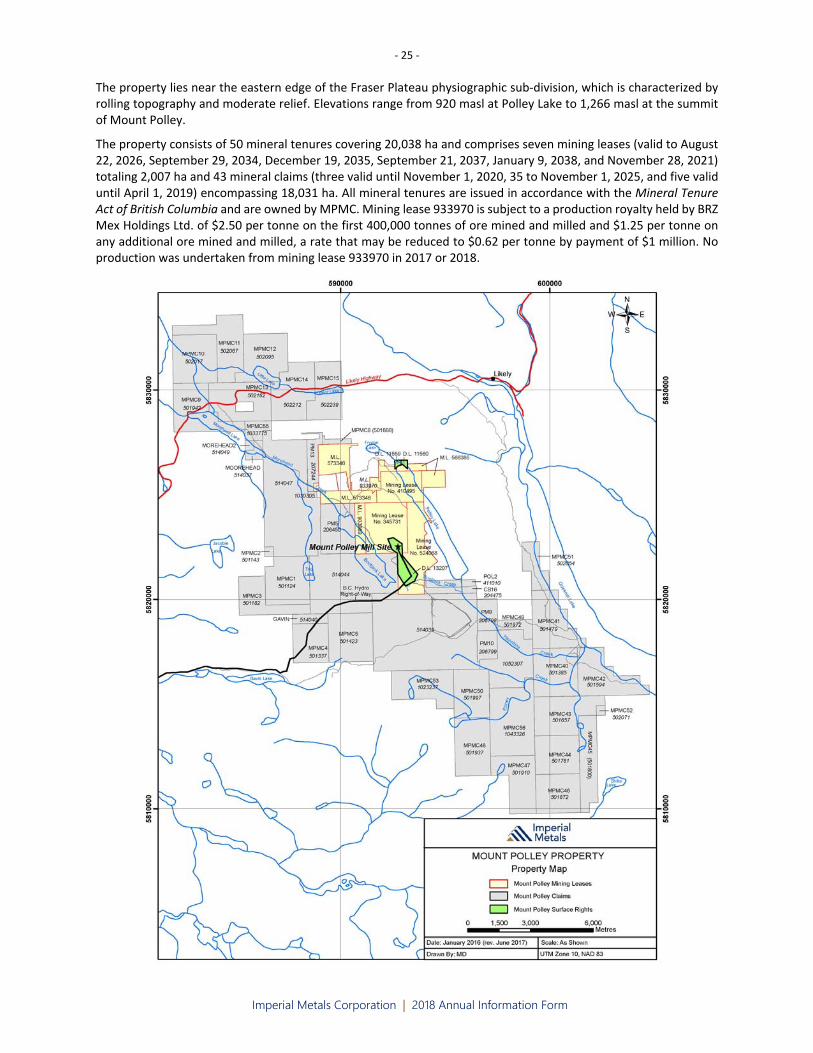
‐ 25 ‐
Imperial Metals Corporation | 2018 Annual Information Form
The property lies near the eastern edge of the Fraser Plateau physiographic sub‐division, which is characterized by rolling topography and moderate relief. Elevations range from 920 masl at Polley Lake to 1,266 masl at the summit of Mount Polley.
The property consists of 50 mineral tenures covering 20,038 ha and comprises seven mining leases (valid to August 22, 2026, September 29, 2034, December 19, 2035, September 21, 2037, January 9, 2038, and November 28, 2021) totaling 2,007 ha and 43 mineral claims (three valid until November 1, 2020, 35 to November 1, 2025, and five valid until April 1, 2019) encompassing 18,031 ha. All mineral tenures are issued in accordance with the Mineral Tenure Act of British Columbia and are owned by MPMC. Mining lease 933970 is subject to a production royalty held by BRZ Mex Holdings Ltd. of $2.50 per tonne on the first 400,000 tonnes of ore mined and milled and $1.25 per tonne on any additional ore mined and milled, a rate that may be reduced to $0.62 per tonne by payment of $1 million. No production was undertaken from mining lease 933970 in 2017 or 2018.

‐ 26 ‐
Imperial Metals Corporation | 2018 Annual Information Form
Permitting & Environmental Management
All phases of mining and reclamation are authorized and/or regulated by the Province of British Columbia and the Federal Government of Canada. Mine operations are primarily authorized and regulated under the EMA and the Mines Act, both as administered by respective ministries of the Province of British Columbia. Mine operations and supplementary activities are also authorized and/or regulated under legislation such as the Water Act and that implemented by the MFLNRO. A summary of existing Mount Polley mine permits under these regulations is provided below.
Mount Polley Mine Permits
Ministry Authorization Purpose Permit # Date Issued Comment
EMPR Permit Approving Mining and Reclamation Program
Mining activities
M‐200 August 1995 many amendments; most recent 2017
ENV Effluent Discharge Permit
Effluent discharge for tailings and site contact water
11678 May 1997 many amendments; most recent 2018
ENV Conditional Water License
use of water for dust suppression and industrial processes.
111741 December 1996
ENV Conditional Water License
diversion of water from Polley Lake for use in processing
101763 December 1996
amended 1997, 2002
ENV Waste Discharge Permit
Landfill 14590 March 1997 amended 2007
ENV Waste Generator Registration
Special Waste Regulation
01559 July 1997 amended 2012
ENV Effluent Discharge (Biosolids) Permit
Store and apply biosolids for use in reclamation
15968 December 1999
amended 2007, 2014
ENV Air Discharge Permit air contaminants from mill and crusher
15087 August 1997 amended 2007
MFLNRO Road Use Permit Mine access 01‐5654‐96 June 1996 Morehead – Bootjack FSR
MFLNRO Conditional Water License
Storage of water in Polley Lake
C132360 August 2015 for rehabilitation purposes below Polley Lake
Federal regulation of the activities at the Mount Polley mine is primarily through the Fisheries Act, which aims to protect fish habitat by prohibiting the entry of deleterious substances into fish‐bearing waters, as well as the disruption or disturbance of fish habitat without the necessary approvals. Protection of fish habitat also includes the Metal Mining Effluent Regulations (annexed under the Fisheries Act) which regulate deposition of mining effluent into fish‐bearing waters.
The Mount Polley Breach resulted in the release of tailings and TSF supernatant into the adjacent environment. As a result, MPMC has been issued a Pollution Abatement Order pursuant to the EMA and an Order pursuant to the Water Act (the “Orders”). Both Orders set out a number of requirements for environmental investigation and remediation of the affected area. MPMC is carrying out the requirements of these Orders. In doing so, MPMC is working with local First Nations and with the applicable government agencies to ensure that it complies with the Orders. Investigation of the Mount Polley Breach by Fisheries and Oceans Canada, Environment and Climate Change Canada, and the BC Conservation Officer Service is ongoing.

‐ 27 ‐
Imperial Metals Corporation | 2018 Annual Information Form
Environmental monitoring programs at the Mount Polley mine continue as required under authorizations from the ENV and the EMPR. Such programs include monitoring of groundwater, surface water (streams, lakes, and mine contact water collection sites), weather, and hydrological conditions. MPMC submits an annual Environmental and Reclamation Report to the ENV and EMPR. That report outlines all current and planned mining and reclamation activities, as well as environmental monitoring activities and results.
MPMC is committed to the progressive reclamation of disturbed areas during the mine‐life cycle, and has been actively completing such work since 2009. Reclamation work since 2014 has been limited, as efforts have been focused on remediation and rehabilitation activities in the areas affected by the Mount Polley Breach. For on‐site reclamation in 2017, the following work was completed: recontouring (resloping) of 0.90 ha; till/soil placement on 2.89 ha; seeding of 2.89 ha; and tree/shrub planting on 22.0 ha. The total area reclaimed to date is 72.15 ha.
MPMC is actively engaged in research projects with academic partners to refine site reclamation and closure methods, as well as to contribute to improving industry best practices. In 2016, MPMC completed a second three‐year term of partnership with Genome BC. The major component completed under this partnership, the Anaerobic Biological Reactor (“ABR”), continued operation until 2014, but was put into care and maintenance on account of the Mount Polley Breach, and has since been decommissioned as part of the buttressing works around the TSF. The ABR was a fully contained passive water treatment pilot project that was developed in conjunction with Genome BC and a research group consisting of mining industry partners and the University of British Columbia. Additionally, at the time of the Mount Polley Breach, MPMC was in the first year of a partnership with Thompson Rivers University to develop a wetland passive treatment research project at the ABR outflow. After the Mount Polley Breach, MPMC and Thompson Rivers University leveraged existing grants from the Natural Sciences and Engineering Research Council of Canada and non‐profit, national research organization, Mitacs, to obtain additional funding from Genome BC and Genome Canada in order to adapt the research project and use metagenomics to study passive remediation of disturbed areas and tailings material downstream of the Mount Polley Breach. The initial phase of this project will be completed in 2017, although longer‐term research potential exists using the baseline data that were collected and the bio‐augmentation plots that were installed. In 2016, a new partnership was initiated with the University of British Columbia, with support from the Natural Sciences and Engineering Research Council of Canada, to support Mount Polley Breach rehabilitation works. Specifically, PhD research is being conducted into methods for rehabilitating soil biological communities in order to improve nutrient cycling and build soil, with the objective of improving revegetation success.
In addition, in 2017 a separate research project was initiated at the University of British Columbia, with support from the Natural Sciences and Engineering Research Council Engage program to investigate progressive remediation in Mount Polley’s waste rock piles and implications for water quality on site. MPMC is also pursuing lab and field research on passive water treatment approaches through consultants.
History
Ownership history and early exploration of the Mount Polley property is provided in the 43‐101 Technical Report for Mount Polley Mine Feasibility Study filed August 5, 2004 on SEDAR. That report contains information on the period from Mount Polley’s formal discovery in 1964, through to the formation of MPMC and subsequent mine construction in 1996. Mount Polley mine operated from 1997 through to the fall of 2001, at which time operations were suspended, and the mine placed on care and maintenance, due to a sustained period of low commodity prices. At that time, the originally designed Cariboo pit had been completed, while the Bell pit was in process of being mined.
In late 2003, following discovery of the high grade Northeast zone, exploration resumed at Mount Polley and preparations for the restart of mining and milling began. In 2004, Imperial conducted a new feasibility study which incorporated the Northeast zone, as well as the Springer and Bell zones. In March 2005, mining began in the new Wight pit (Northeast zone) and resumed in the Bell pit. In subsequent years, drilling exploration was carried out in a number of other areas focused on expanding or deepening known deposits or testing new targets revealed by trenching, mapping and sampling programs, or by geophysical anomalies. As a result, significant copper‐gold resources were delineated in the Southeast zone (mined 2008‐2010), the Pond zone (mined 2009‐2010), the C2 zone (now incorporated in the Cariboo zone), the WX zone, and the Boundary zone. Mining was completed in the Bell pit in 2008, and in the Wight pit in 2009. Mining in the Springer zone, which contains the majority of the remaining reserves at Mount Polley, began in 2008. Deep drilling since late 2003 has resulted in a substantial increase in Springer resources.

‐ 28 ‐
Imperial Metals Corporation | 2018 Annual Information Form
The first underground exploration development at Mount Polley began in 2010 in the deep Boundary zone. The zone was mined between 2013 and early 2017, the first underground production at Mount Polley. Substantial resources also exist in the deep Northeast zone beneath the Wight pit, known as the Martel zone. The underground workings were extended from the Boundary zone for a program of delineation drilling in the Martel in winter 2016‐2017 (see below).
Operations were suspended on August 4, 2014 following the Mount Polley Breach. Rehabilitation work was immediately initiated at the TSF and the affected areas downstream.
An Independent Expert Engineering and Investigation Review Panel, commissioned by the MMEPR, investigated the Mount Polley Breach and released its report on January 30, 2015. The report concluded that the breach was sudden and without warning, and was due to the fact that the independent engineering firms retained by MPMC to design the TSF did not take into account the strength of the glaciolacustrine layer approximately 8 m below the foundation of the embankment in the area of the breach.
On July 9, 2015 MPMC received regulatory approvals authorizing restart of mine operations under a modified operating plan. With the TSF not authorized for continued mill process tailings deposition at the time, the modified operating plan included use of the Springer pit for tailings deposition. Operations resumed on August 5, 2015, with mill processing on a one‐week‐on/one‐week‐off schedule, and ore feed sourced from the Cariboo pit and the Boundary zone underground operation. In late November 2015, due to the complexity of operating the mill under winter conditions and considering weakened commodity prices, the mill transitioned into operating on a continuous basis.
On December 17, 2015, the Chief Inspector of Mines for the Province of British Columbia released his report on the Mount Polley Breach. The report concluded, as had the Independent Expert Engineering and Investigation Review Panel report, that the root cause of the Mount Polley Breach was associated with an engineering design that had not properly characterized the strength of a clay (glaciolacustrine) unit in the native soil foundation.
In Spring 2016, a 1,829 m diamond drilling program was completed in the Cariboo zone (six holes, 819 m) and WX zone (five holes, 1,010 m) to assist in mine planning. On June 23, 2016 MPMC received regulatory approvals authorizing the mine to return to full operations and for use of the repaired TSF for tailings deposition.
In late 2016 and into early 2017, exploration of the deep Northeast zone known as the Martel zone, continued with an underground drilling program. The Martel zone is about 400 m east of the Boundary zone and vertically below the Wight pit. Wide spaced drilling from surface, mainly in 2004, had defined a measured and indicated below‐pit resource of approximately 6.27 MT grading approximately 1.12% copper, 0.40 g/t gold and 7.38 g/t silver. The objective of the 2016‐2017 drilling was to define a high‐grade portion within the Martel zone for future underground mining. Access for the drilling was by a ramp and drift driven in 2016 to within about 100 m of the Martel mineralization. Holes were drilled on azimuths ranging from 070° to 090° at shallow to moderate angles from four drill stations at 25‐m intervals along the drift. Four holes (1,421 m) were completed before yearend 2016 and the remaining 21 holes in the 6,680 m program were completed in February 2017.
Drill results and geological details were given in news releases dated February 28, 2017 and April 10, 2017. The Martel zone consists of strongly mineralized breccia and measures approximately 130 m long, 170 m high, and 140 m wide; the southernmost hole in the program indicates the zone is thinning in this direction but is still open. Along its northeastern fringe, the Martel breccia gives way to monzonitic wall rock and dikes, in between which are discontinuous lenses of distinct and very high‐grade, bornite‐rich mineralization collectively termed the Green zone. The Green zone was intercepted in several holes over various but mainly narrow widths, and displays a roughly vertical disposition; it may be more structurally controlled than the main body of the Martel.
A new resource for the Martel zone was announced August 14, 2017. The zone as presently delineated consists of 6.8 MT in the measured and indicated category, grading 0.91% copper, 0.28 g/t gold, and 5.79 g/t silver. In addition, there is an inferred resource of 635,600 tonnes grading 1.29% copper, 0.59 g/t gold, and 8.32 g/t silver. These underground resources will be incorporated into the future open pit and underground mine planning.
Historic production from all zones at Mount Polley since start‐up in 1997 through December 31, 2018 is approximately 589 M pounds copper and 928,000 ounces gold from about 116 MT mill throughput. At December 31, 2018 a total of 2,777 exploration holes (surface and underground combined) have been drilled.

‐ 29 ‐
Imperial Metals Corporation | 2018 Annual Information Form
The current authorized mine plan includes mining of the Phase 4 Cariboo‐Springer pit over a period of approximately five years (i.e. completion in 2021). In 2018, all open pit production came from the Cariboo, supplemented by previously stockpiled ore. Rehabilitation work at the TSF and areas affected by the Mount Polley Breach continues through all phases of operations.
On January 7, 2019, Imperial announced that due to declining copper prices, Mount Polley operations would be suspended. Milling of low grade stockpiles are expected to continue until May 2019, at which time the mine will be placed on care and maintenance until there is a sustained improvement in the price of copper. There will be no impact to the mine’s ongoing environmental monitoring and remediation program.
Geological Setting, Mineralization & Deposit Types
Mount Polley is an alkalic porphyry copper‐gold deposit. It lies in the tectono‐stratigraphic Quesnel terrane or Quesnellia, which is characterized by a Middle Triassic to Early Jurassic assemblage of volcanic, sedimentary and plutonic rocks which formed in an island arc tectonic setting outboard of the ancestral North American continental margin. Quesnellia hosts several major porphyry copper deposits such as Highland Valley, Copper Mountain, Afton‐Ajax, Gibraltar and Mount Milligan, all generated by early Mesozoic, calc‐alkalic or alkalic arc magmatism.
In the Mount Polley region, the Triassic arc rocks are assigned to the Nicola Group and comprise alkalic basaltic to andesitic volcanics and sedimentary rocks, which are intruded by sub‐volcanic stocks; all are overlain by post‐Nicola, Early Jurassic clastic rocks and rare volcanics. Mount Polley itself is a complex of alkalic intermediate porphyritic intrusions and related magmatic‐hydrothermal breccias. It was emplaced into the Nicola Group in the Late Triassic around 205 million years ago. The intrusive complex is about 6 km long (north‐northwest) and 3 km wide, lying between Polley Lake in the east and Bootjack Lake in the west. The intrusions range from diorite (oldest) to monzonite (youngest), and are marginally undersaturated in silica. The Mount Polley Intrusive Complex is in the centre of the Mount Polley property; the remainder of the property is underlain mainly by Nicola Group volcanics and post‐Nicola conglomerate, and small intrusions in which no economic mineralization has been found to date.
Mineralization in the Mount Polley Intrusive Complex (“MPIC”) is primarily hosted by irregular zones of hydrothermal breccia, which are closely related to the porphyry intrusions and were formed by magmatic devolatization processes. Mineralization and brecciation were accompanied by potassic or calc‐potassic, albite, and magnetite alteration; the MPIC is bounded on most sides by propylitic country rocks. As in many alkalic porphyry systems, there is no single or simple zoned mineralization pattern, but instead a number of copper‐gold zones of various size, shape and grade characteristics, distributed around the MPIC from the far north to the south. There is no clear structural control on the location of these mineralized breccia zones, although the greatest continuity and the bulk of the past and present resources occur in the centre of the MPIC (e.g. Springer, Cariboo, Bell zones) between two pre‐mineral diorite intrusions. Dimensions of mineralized breccias in the MPIC range up to many hundred metres in length and width, such as in the Springer zone. Elsewhere, smaller zones (generally less than 100 m across) may form mineable bodies if grades and other factors are favourable. Post‐mineral faulting probably did not disrupt the continuity of mineralized zones very significantly, except in the Northeast zone where deeper mineralization was offset along a fault a few hundred metres laterally, and dropped vertically slightly.
In the deposits, the degree of brecciation and associated hydrothermal alteration is usually a reliable guide as to grade. There is relatively little post‐mineralization dike dilution. Chalcopyrite is the dominant copper mineral, typically accompanied by pyrite; bornite is relatively uncommon in the centre of the MPIC. Here, copper sulfides occur as disseminations or veins and fracture coatings in brecciated intrusion, or they are disseminated in the matrix of breccias, in both cases precipitated along with alteration minerals. Mineralization has been traced by deep drilling in the Springer zone to a depth of around 900 m (from pre‐mining surface).
In the north of the MPIC are much higher grade orebodies, namely the Northeast (mined in the Wight pit, 2005‐2009) and Boundary zones, where copper grades can reach several percent per tonne. Chalcopyrite and significant bornite form coarse‐grained infill in breccias, and intense vein and microvein stockworks. As in the zones in the centre of the MPIC, gold and silver occur mainly as microscopic inclusions in the copper sulfides and in pyrite.
Exploration has always proceeded alongside mining at Mount Polley, leading to the expansion and deepening of known deposits, or to the discovery of new zones, or raising the status or resource category of marginal prospects, potentially towards feasibility for profitable mining. Geological and geotechnical logging of drill core is integrated with down‐hole assay data and used with software for computation of the resource block model and mine design. In addition, exploration and research since the restart of operations in 2004‐2005 have considerably advanced

‐ 30 ‐
Imperial Metals Corporation | 2018 Annual Information Form
understanding of geology, structure and deposit genesis at Mount Polley, improving interpretation of mineralization geometry and the design of drill programs. New underground development is followed where appropriate by wall mapping and rib sampling to further characterize the mineralization, fill gaps in the resource model, and help guide stope design.
Airborne and ground magnetic signature is regarded as the most important geophysical tool for identifying new mineralization, although tellingly it was not effective in the Northeast zone, possibly delaying discovery of that high‐grade but magnetite‐poor orebody until 2003. An 11‐line Titan‐24 deep Induced Polarization‐Magnetotelluric survey was completed by Quantec Geoscience Ltd. in Fall 2009 to potentially locate blind sulfide targets and guide exploration drilling where appropriate. Outlying parts of the Mount Polley property, away from the mine site, have been explored by geological mapping, sampling and trenching and by soil surveys over intrusive bodies, with no significant results to date. Mineral potential remains most promising within the MPIC itself, or possibly buried beneath the unconformity with cover rocks (conglomerate, breccia) immediately to its north.
Exploration
During the spring of 2018 a four hole diamond drill program was completed totalling 953.12 m. The holes were drilled in the Saddle area between the Springer and Cariboo pits to confirm mineralization in this area for future mining plans. This information has been incorporated into the mine’s block model.
Future additional diamond drilling is planned in the vicinity of the Springer pit to infill areas where information is lacking and additional mineralization may be present. There have been exploration targets identified on the property by a combination of soil and geophysical methods that are recommended to be explored, either by diamond or percussion drilling.
A program of ground magnetometer surveying which started in 2018 will continue in 2019 in conjunction with targeted areas of soil sampling, prospecting and geological mapping.
Sampling, Analysis & Data Verification
Most of the early drill core from 1966 to 1980 was lost due to vandalism. All core samples from 1981 onwards were collected in wooden core boxes at the drill. The average core size was NQ2, but HQ diameter drill core has become more common with deep drilling in recent years. Each core box holds approximately 4 m of core. Presently, Mount Polley drill core is sampled in its entirety, in most cases. The usual sample length is 1.0‐2.5 m. The standard maximum length of a 2.5 m sample may be broken into smaller intervals where required by significant changes in geology, faults, or mineralization intensity. The core is first logged geotechnically and geologically photographed and then sample lengths are cut axially with a rock saw. One half of the core is sent for analysis and the other half stored on the property in covered core racks for future reference as a geological record, or for any necessary test work at a later date. The core library and core logging facility are located on the Mount Polley mine site near the administration building, securely inside the mine perimeter. Pulps and rejects are stored in the same facility.
All drill core from recent programs (post‐1980) was assayed for gold, total copper, and iron while non‐sulphide copper, silver and some other analyses were completed on core from certain areas of the property where the additional data was considered to be important. Much of the pre‐1980 core was assayed only for total copper. Over the life of the mine, exploration samples have been assayed at a number of British Columbia labs. Since 2006 approximately 80% of core samples were analyzed by the on‐site mine laboratory, and the remainder were analyzed by Bureau Veritas Mineral Laboratories (formerly Acme Analytical Laboratories Ltd.) based in Vancouver, British Columbia. The industry standard methodology of using standards, duplicates and blank samples was applied in all recent drilling programs for QA/QC purposes.
Mineral Reserve and Mineral Resource Estimates: Effective date January 1, 2019
Mineral Reserve and Mineral Resource estimates were updated effective January 1, 2016 and are provided in the 2016 Mount Polley Report dated May 26, 2016.
The Mineral Reserves and Mineral Resources stated in the following tables have been updated to account for mining undertaken from January 1, 2018 to December 31, 2018. Ore grade cutoffs have are based on the same cost assumptions used January 1, 2018. Mineral Resources are inclusive of Mineral Reserves.

‐ 31 ‐
Imperial Metals Corporation | 2018 Annual Information Form
Mount Polley Mineral Reserves at January 1, 2019
Grade Contained Metal
Zone/Pit Tonnes Ore Copper % Gold g/t Silver g/t Copper lbs Gold oz Silver oz Stripping Ratio
Springer 42,500,000 0.303 0.258 0.577 284,000,000 353,000 788,000 2.44
Cariboo depleted
WX 8,400,000 0.270 0.484 0.576 50,000,000 131,000 155,000 5.65
Boundary OP 600,000 0.647 0.579 4.392 9,000,000 11,000 85,000 8.67
Martel UG 2,272,000 1.145 0.299 7.205 57,000,000 22,000 526,000 n/a
Total Reserve 53,772,000 0.337 0.299 0.899 400,000,000 517,000 1,554,000 3.12
Mount Polley Mineral Resources at January 1, 2019
Grade Contained Metal
Tonnes Ore Copper % Gold g/t Silver g/t Copper lbs Gold oz Silver oz
Measured 103,193,000 0.319 0.300 0.823 725,000,000 996,000 2,730,000
Indicated 91,127,000 0.266 0.269 0.619 534,000,000 787,000 1,814,000
Total Measured & Indicated 194,320,000 0.294 0.285 0.727 1,259,000,000 1,783,000 4,544,000
Total Inferred 5,619,000 0.374 0.276 2.187 46,000,000 50,000 395,000
The 2019 Mineral Reserve estimate includes open pit mining of the Springer, Boundary, and WX zones, and underground mining of the Martel zone. The Cariboo reserve was mined to completion in 2018. The Mineral Reserve estimate was calculated using a detailed mine schedule based upon open pit and underground mine designs created using the following metal price assumptions: US$3.00/lb copper, US$1,250/oz gold, US$18.00/oz silver and a $0.80 US/CDN exchange rate. The Mineral Reserve for the Martel zone was generated using detailed stope designs. Ore cut‐off grades were calculated using a mill head value (“MHV”) calculation which is similar to a net‐smelter return calculation with unit site operating costs included to provide an estimation of ore value after all costs except direct mining costs. For open pit mining, a $1 per tonne MHV cut‐off is employed, while a $40 MHV reserve cutoff was used for the Martel zone.
The 2019 Mineral Resource estimate includes both open pit and underground Mineral Resources. All Mineral Resources were calculated using the following metal price assumptions: US$3.40/lb copper, US$1,300/oz gold, US$21.00/oz silver and a $0.80 US/CDN exchange rate. Open Pit Mineral Resources were calculated using a Lerchs‐Grossman algorithm to define the largest incrementally profitable pit pushback using the stated metal price assumptions and current pit wall angles. This pushback was restricted from encroaching within 100 m of the mill facility. Open Pit Mineral Reserves are contained within this Open Pit Mineral Resource shape, with ore cut‐offs utilizing a $1 per tonne MHV cutoff using Mineral Resource metal prices. Underground Mineral Resources were calculating by applying a MHV cutoff of either $30 or $40 per tonne depending on zone and potential mining costs. A manual removal of isolated or small areas of modelled mineralization was also undertaken to ensure that the Underground Mineral Resource has reasonable prospects for economic extraction.
The Mineral Resource and Mineral Reserve estimates for the Mount Polley property were prepared by Art Frye, Mine Operations Manager, MPMC, under the supervision of Greg Gillstrom, P.Eng.. Refer to the 2016 Mount Polley Report for detailed information.
Mining and Mineral Processing
The Mount Polley mine is a 20,000 t/d open pit conventional milling operation. In the Mount Polley mine mill, run‐of‐mine ore from the open pits and underground is hauled to the crusher. The crusher has three stages of crushing involving five crushers, twenty conveyors and four sets of screens. Ore is deposited by rock trucks into the feed pocket of the primary gyratory crusher, and is then crushed in three stages to produce a product for the grinding circuit. Pebbles obtained from the triple deck screen in the crushing plant are used as grinding media in the pebble mills. Periodically, the crusher is also used for the production of aggregates used in TSF construction and other tasks.

‐ 32 ‐
Imperial Metals Corporation | 2018 Annual Information Form
The grinding circuit consists of two parallel rod mill/ball mill circuits and a pebble mill circuit. Crusher product is first split between two rod mills where water is added, and a slurry is formed to grind the product down to a sand like texture. The rod mill discharge is pumped to the primary hydrocyclones that classify the particles by size. The larger particles flow to feed the ball mills while the fine particles report to two flash flotation cells. The ball and pebble mills are in “closed circuit”, meaning that the discharge is pumped to the classifying units (primary hydrocyclones) and the particles will not pass to the next stage until the particle sizes are fine enough. The flash flotation product can report directly to the dewatering circuit or to the cleaner circuit for further upgrading. The overflow from the pebble mill hydrocyclones reports to the flotation circuit.
The flotation circuit separates the valuable minerals from the rest of the ground particles. With the addition of reagents, the valuable minerals, mostly in the form of sulphides, are separated by flotation and are collected and upgraded to produce a concentrate. Initial separation is completed in a rougher/scavenger circuit, where the remaining minerals are discarded as tailings (which flow by gravity to the TSF). Rougher concentrate is reground in a regrind mill and further upgraded in a cleaner circuit to produce the final concentrate product. Cleaner tailings reports to the cleaner scavenger circuit, and the tailings from the cleaner scavenger circuit are recycled to the rougher scavenger circuit to maximize recovery.
The concentrate from the flotation circuit is dewatered in two stages. In the first stage the thickener settles particles and decants water so that the settled particles form a sludge that has a reduced water content of roughly 25%‐30%. In the second stage, pressure filtration further reduces water content to approximately 8%. The water removed is utilized as process water. The filtered concentrate is stored in the load‐out building and loaded onto 40‐tonne trucks for shipping. Tailings materials generated by mill operations are piped via gravity to the TSF.
Information on Mining, Milling, Infrastructure, Permitting and Compliance Activities, Environmental, Permitting, Social or Community factors, and Capital and Operating Costs can be viewed in the 2016 Mount Polley Report.
Production
On January 7, 2019 the Company announced operations at the Mount Polley mine would be suspended due to declining copper prices. Milling of low grade stockpiles are targeted to continue until May 2019, at which time the mine will be placed on care and maintenance until the economics of mining at Mount Polley improve.
Years Ended December 31 2018 2017 2016
Ore milled ‐ tonnes 6,195,760 6,723,188 6,684,824
Ore milled per calendar day ‐ tonnes 16,975 18,420 18,265
Grade % ‐ copper 0.207 0.199 0.247
Grade g/t ‐ gold 0.277 0.322 0.310
Recovery % ‐ copper 52.89 64.53 69.66
Recovery % ‐ gold 67.25 68.93 69.78
Copper – lbs 14,973,631 19,070,932 25,338,857
Gold ‐ oz 37,120 48,009 46,444
Silver – oz 33,458 36,626 90,125
During the latter part of January and all of February 2019, extreme cold winter temperatures impacted mill throughput. Freezing ore in chutes and stockpiles limited the milling rates. During February 2019, only 9,764 dry metric tonnes were treated per calendar day milled (versus 17,531 dry metric tonnes during February 2018). Since then, warmer Spring temperatures have helped to improve mill throughput, however, to achieve the production targets, throughput during April and May will need to increase.
Production in 2019 through to suspension of operations at the end of May is targeted to be in the range of 4‐5 million pounds copper and 13‐14 thousand ounces gold.

‐ 33 ‐
Imperial Metals Corporation | 2018 Annual Information Form
MINERAL PROPERTY: HUCKLEBERRY MINE
Technical Report
The 2011 Huckleberry Report dated November 22, 2011 was amended and restated on May 11, 2016.
Description, Location & Access
HML is owner/operator of the Huckleberry copper mine in west‐central British Columbia. Prior to April 28, 2017 Imperial had held a 50% interest in HML. On April 7, 2017, HML exercised its right of first refusal to purchase for cancellation all the shares of HML held by a syndicate of Japanese companies which held the other 50% interest, in exchange for cash consideration of $2.0 million. The transaction closed on April 28, 2017 and Imperial now holds 100% of the shares of HML through HML Mining Inc., a wholly owned subsidiary of Imperial.
Huckleberry mine operations were suspended on August 31, 2016. The mine remains on care and maintenance status pending a sustained improvement in the price of copper.
The Huckleberry mine lies on the southern flank of Huckleberry Mountain, the highest point at 1,542 masl and north of Tahtsa Reach, the lowest point at 860 masl on the Nechako Reservoir. The deposits have an average surface elevation of 1,036 masl. Access to the property is along 121 km of gravel forest service roads and a private access road. A 138 kV power line supplies hydro power to the site. The District of Houston is 307 km west of Prince George, 411 km east of Prince Rupert and served by Highway 16 and the Canadian National Railway. When in operation, the mine employs approximately 260 people from the local surrounding communities.
The Huckleberry property covers 24,387 ha and consists of the main property comprised of two mining leases having terms to June 25, 2027 and April 26, 2022 respectively and totaling 2,422 ha and 38 mineral claims (one valid until May 18, 2019; five to August 31, 2019; 25 valid until August 23, 2022; five valid until August 23, 2023; and two valid to February 1, 2024) encompassing 16,498 ha. The Huckleberry property also includes the contiguous Whiting Creek property located north of the mine, which consists of six minerals claims covering 5,467 ha, (three valid to August 31, 2019; two valid until July 17, 2021 and one valid to July 17, 2026).

‐ 34 ‐
Imperial Metals Corporation | 2018 Annual Information Form
Permitting & Environmental Management
When in operation, Huckleberry mine operates under Mines Act Permit M‐203 (amended 2011 when the Main Zone Optimization plan (“MZO plan”) was accepted by the MMEPR. Water quality is monitored per requirements outlined by the ENV Environmental Management Act Permit 14483, and Environment Canada. Site water discharge to Tahtsa Reach is primarily through two permitted discharge points (Tahtsa Reach Outflow and SC‐4), with discharge criteria outlined in the discharge permits.
History
Copper mineralization at Huckleberry was first discovered by Kennco Explorations (Western) Limited in 1962. Granby Mining Company Ltd. optioned the property in 1972. The property remained idle until 1975 when Noranda Exploration Company Limited exercised an option. Noranda’s option was dropped, and in 1992 New Canamin Resources Ltd. optioned the property from Kennecott Canada. In May 1994 Kennecott elected not to exercise its re‐acquisition rights and New Canamin became sole owner of this property.
In July 1995 Princeton Mining Corporation (“Princeton”) acquired all the shares of New Canamin. A strategic alliance with Mitsubishi Materials Corporation, Marubeni Corporation, Dowa Mining Co. Ltd. and Furukawa Co. Ltd. (the “Japan Group”) was established to assist in financing the project. A feasibility study was commissioned by Princeton, and completed by H.A. Simons in August 1995. In June 1996 the Japan Group purchased a 40% equity position in HML and entered into an agreement to provide US$60 million in project loan financing based on the site's positive feasibility. Mitsubishi Materials Corporation, Dowa Mining Co. Ltd. and Furukawa Co. Ltd. also entered into a long term contract for the purchase of all copper concentrates from the Huckleberry mine. The British Columbia Government provided financial assistance in the form of a $15 million loan to HML for infrastructure including roads and power lines.
With financing in place the construction of the mine commenced in June 1996. The total cost to construct, install and commission the facilities was approximately $142 million. This included direct field costs of executing the Huckleberry project, plus the indirect costs associated with design, construction and commissioning. The Huckleberry mine started commissioning activities in September 1997 and achieved production in October 1997.
In 1998 Imperial acquired Princeton, which held a 60% interest in HML. Imperial held the 60% interest until June 1999 when 10% of HML was sold to the Japan Group. In July 1998 the major stakeholders of HML entered into an economic plan, sponsored by the British Columbia Job Protection Commission, for a period of two years from July 1998 to June 2000. All existing loans were restructured under the economic plan. During this time the copper price continued to deteriorate, and a second loan restructuring agreement was entered in March 1999. As part of the March 1999 loan restructuring agreement, a wholly owned subsidiary of Imperial provided a $2.5 million loan facility. HML repaid the $2.5 million of senior ranking debt owed to Imperial in December 2004. HML became debt free in 2006 after having repaid $120.9 million of long term debt. Since 2006 HML has declared and paid dividends totaling $45 million.
Operations at the Huckleberry mine were scheduled to wind down in 2007‐2008 but the mine life was extended to 2014 with the development of resources in the Main Zone Extension pit (“MZX”). The 2011 Huckleberry Report detailed new reserves and the extension of the mine life by mining an expanded Main zone pit and MZO pit, and developing a new TSF. Construction of the TSF commenced in May 2012 and TSF embankments are raised annually as required.
In February 2014, mine operations were temporarily suspended for about one month when a tooth failed on the SAG mill bull gear. A replacement bull gear and two pinion gears for the SAG mill were installed in December 2014. There have been no issues with the SAG mill through to suspension of operations in August 2016.
In 2015, HML reviewed its mining and milling plans. Cost control initiatives were implemented to reduce costs and optimize production in response to the low copper price. Significant efforts to reduce mine operating costs were made, however the realized savings were not sufficient to offset the decline of the copper price.
On January 6, 2016, HML suspended pit operations at the Huckleberry mine. Stockpiled ore continued to be processed until the end of August 2016 at which time the mine was placed on care and maintenance pending a sustained increase in the price of copper.

‐ 35 ‐
Imperial Metals Corporation | 2018 Annual Information Form
Historical Exploration & Drilling
In 2011, HML conducted a deep Induced Polarization ground geophysics (Titan 24) survey. A total of four lines, averaging 2.5 km in length each at 250 m spacing were tested. Geophysics lines extended from eastern portions of the mining claim to the west, encompassing an area that includes the mined out Main zone pit and portion of the MZX pit. A diamond drilling program designed to test the Titan 24 targets and the NAG quarry adjacent to the Main zone totaled 3,695 m. In 2012, HML followed up on the 2011 exploration drilling with additional drilling in the mine site area. Drilling was divided between deep and near‐surface targets located adjacent to the MZO pit. The near‐surface drilling added a significant low‐grade resource to the deposit. Deep drilling tested for the extension of ore‐grade material along the eastern portions of the Main zone deposit. Drilling of a coincident moderate chargeability/resistivity anomaly resulted in the discovery of the MZ Deep target, an extensive zone located at depth between the Main zone (“MZ”) and East zone (“EZ”). The correlation between this type of anomaly and copper mineralization led to an expanded Titan‐24 deep imaging IP‐MT survey, comprising 10 line km designed to build on survey data from 2011 and seek new targets.
In 2013, HML completed another diamond drilling program in the mine site area. The majority of this work was directed towards filling in gaps in historic drilling and expanding resources directly to the west, south, southwest and northeast of the planned MZO pit. Several holes were also drilled at the limits of the MZ Deep target to determine the extents of the zone and to determine its relationship to the other zones. This drilling, in conjunction with earlier drill results indicates the presence of a geological continuity of dominantly low‐grade mineralization at depth between Huckleberry’s major deposits. A geochemical soil sampling program on the adjacent Huckleberry North claims was also completed in 2013.
In 2014, a limited greenfield exploration program was completed on the Whiting Creek property, a copper‐molybdenum showing, located approximately 8 km from the Huckleberry processing plant. Work included geological mapping, and collection of 301 soil samples. While no new soil anomalies were discovered, several major structural features and intrusive contacts were refined by the mapping.
In 2015, HML completed three diamond drill holes for a total of 1,194 m at the Creek zone of the Whiting Creek property. These holes were directed towards testing the deposit at depths greater than 200 m, and to test continuity between historical drill hole intercepts. Results from this drilling provided needed information on the geometry and extent of the deposit and confirmed the presence of chalcopyrite mineralization to depths of greater than 400 m below surface. Results from 2015 support the interpretation of a steeply dipping mineralized zone surrounding a weakly mineralized core of the Creek zone deposit.
In 2016, a small drilling program was conducted at the Creek zone to meet the assessment requirement for these claims. Three diamond drill holes were drilled to test the edges of the Creek zone, one of three known zones of mineralization at Whiting Creek. All three holes intersected copper mineralization with WC16‐01 intersecting 70.1 m of 0.39% copper and 0.02% molybdenum from surface, WC‐16‐02 intersecting 222.5 m of 0.31% copper and 0.02% molybdenum both mineralized intervals starting from near surface and WC16‐03 intersecting 152.4 m of 0.25% copper and 0.02% molybdenum starting at a depth of approximately 185 m. The drilling shows that the Creek zone is open to the west, and has potential to have higher grades, as the intercept in WC16‐01 included a 36.6 m intercept of 0.57% copper. A soil and rock sampling program was completed in 2016, expanding on the Rusty zone copper‐gold by collecting 86 soil and 15 rock samples.
During 2017, it was decided to use soil sampling methods at the Whiting Creek property to expand on the known soil anomalies before the next phase of drilling. Two areas were selected to compare the conventional B‐horizon soil sampling method and analysis with the low‐level detection Mobile Metal Ion (MMI) method over where deep overburden was located. The first area selected was in the Creek zone centered over exploration drill hole WC16‐01 which recorded 0.565% Cu over an interval of approximately 37 m which starts at a depth of 53.34 m. Copper mineralization at this shallow depth was unexpected since historical soil sampling above this area recorded no anomalous copper values. Due to the lack of a soil anomaly above WC16‐01, the (MMI) soil sampling and analysis was implemented in addition to conventional geochemical methods on all soil samples collected from this area. The MMI soil samples highlight the buried copper mineralization very well compared to the limited response using conventional methods.
Additional soil sampling in the Creek zone was completed over another area with a high induced polarity chargeability response. This anomaly is located southeast of the WC16‐01 drill collar by approximately 1.5 km. The area containing the anomaly has an east‐west strike length of approximately 800 m and a width (north‐south) of 250

‐ 36 ‐
Imperial Metals Corporation | 2018 Annual Information Form
m. Previous soil sampling documented little to no copper in this area. The MMI soil sampling in this area was successful in outlining a strong copper in soil anomaly.
Conventional soil sampling was also implemented to further quantify the extent of an anomalous +200 ppm copper halo in the Rusty zone. Sampling was completed along two 1,000 m long East‐West lines. The lines are parallel to one another and are 100 m apart. Both lines traverse several large gaps within the geochemical coverage of the Rusty zone copper anomaly and were successful in expanding the copper anomaly.
Geological Setting, Mineralization & Deposit Types
The Huckleberry mine is a typical porphyry copper‐molybdenum deposit. It is characterized as a calc‐alkalic copper‐molybdenum type mineralization. These deposits are typically hosted in intrusive rocks, usually of granodioritic or quartz monzonitic composition, and in volcanic rocks surrounding intrusives. These deposits are often large, oval, inverted‐cone shaped deposits, and display multiple zones of hydrothermal alteration and sulphide mineralization. The hydrothermal alteration is usually extensive and consists of an inner potassic zone closely associated with the sulphide mineralization, surrounded by propylitic alteration associated with pyrite. Phyllic and argillic alteration can be either part of the zonal pattern between the potassic and propylitic zones or can be somewhat irregular or tabular younger zones superimposed on older alteration and sulphide assemblages. Chalcopyrite, bornite, chalcocite, enargite, other copper minerals, molybdenum and pyrite are typically the dominant sulphides. The mineralization is dominantly structurally controlled, mainly through stockworks, veins, vein sets, breccias, disseminations and replacements.
Mineralization is similar in both the MZ and EZ deposits and is contained within altered volcanic rocks. Copper mineralization is predominantly chalcopyrite, occurring as fine to medium grained aggregate filling veinlets and fractures, and as fine grained disseminations in the envelopes around the veinlets. Molybdenum occurs as molybdenite, which is found as disseminations and clusters within quartz/gypsum veins. Molybdenite is generally low in chalcopyrite and appears to have been deposited separately and later than the copper mineralization.
The Main zone was the first zone to be discovered and was well defined by drilling. The zone was a kidney bean shape, wrapping around the east side of the porphyry stock with an arc length of 500 m, a width of 150 m, and depths of up to 300 m below surface.
Mineralization in the EZ is easterly trending and about 200‐300 m wide and 900 m long. Mineralization occurs to depths of over 300 m and remains open, however, the surrounding hills and unfavourable surface topography make it unlikely the deeper resource can be mined economically (note: pit has been backfilled). Core recovery was a problem in the upper portion of both deposits because gypsum fracture fillings have been dissolved, leaving the rock in a friable condition. Core recovery in this material has been as low as 0% over 100 m. Comparison of grade versus core recovery showed that grade fell off in proportion to recovery. Following an analysis of these comparisons, it was decided to consider all samples with recoveries below 50%, which only comprise less than 2% of the database, as unsampled. Assay data was composited on 8 m vertical bench elevations. Specific gravity determinations were performed on 340 samples taken from eight holes within the EZ deposit. An average specific gravity of 2.69 was used for both deposits.
Gold, silver and molybdenum were not modeled in the Main zone due to incomplete data sets. Instead the block grades have been determined using correlations with copper assays, which are quite strong. For the EZ, molybdenum and silver grades were modeled using the Kriging parameters determined for the copper model. Due to the friable nature of the gypsum depletion zone, recognition of the overburden/bedrock face was difficult during the early drilling campaigns. The interface was established from drill data and the position of outcrops on the north slope and was used to estimate overburden thickness.
Exploration
A comprehensive review of exploration is being completed, and additional exploration consisting of MMI soil sampling, geological mapping and diamond drilling is being planned.
Sampling, Analysis & Data Verification
Since mid‐2012, sampling, sample security and QA/QC procedures for samples collected and transported to the Huckleberry laboratory and independent laboratories were under supervision of Justin Schroff, P.Geo., Huckleberry Geologist. For diamond drill programs undertaken between 2008 and 2012 sampling was under the supervision of Faisal Sayeed, Huckleberry Geologist. Independent verification of sampling, sample security and QA/QC procedures

‐ 37 ‐
Imperial Metals Corporation | 2018 Annual Information Form
from 2008‐2012 was under the supervision of Peter Ogryzlo M.Sc., P. Geo., an independent Qualified Person (as defined in NI 43‐101) and former Senior Geologist for the Huckleberry mine.
For all exploration programs, diamond drill core was removed from the core barrel, boxed and transported to the core facility at the Huckleberry mine. After logging, the core was sampled under professional supervision. The undisturbed core was first logged with a record made of lithology, mineralization, sulphide content and structure. Estimates were made of core recovery. After geological and geotechnical logging, the core was split using a hydraulic core splitter. The approach was to send half of the core for analysis, and to retain the reject half. The first split was bagged with an identifying sample tag, and the other half was returned to the core tray for future reference. The bags were closed, and the bagged samples were taken to the Huckleberry mine on‐site laboratory. The split core was returned to the box, and is stored at the Huckleberry mine site. Sample widths varied slightly, but in general a 3.0 m sample was processed. Minimum sample weight was approximately 3 kg with the average weight of samples submitted for analysis being approximately 7.5 kg. Core recovery was good, and provided sufficient sample for analysis.
Sample preparation and some analysis was performed in the Huckleberry mine laboratory. The laboratory has been in operation since the mine opened in 1997. As it is not a certified assay laboratory, the control on the quality of analysis is provided by submission of samples on a regular basis to ALS Minerals Laboratories, North Vancouver, British Columbia, a certified assay facility with an ISO9001:2008 certification. Further control was also provided by submission of samples from the diamond drill programs to Bureau Veritas Mineral Laboratories (formerly Acme Analytical Laboratories) based in Vancouver, British Columbia. Reference materials, consisting of prepared standards, blanks and duplicates were inserted into the sample stream prior to delivery to the laboratory. Reference materials were also placed in the sample stream at the laboratory. Upon receipt at the sample preparation facility at the Huckleberry mine, samples were dried, crushed, split, pulverized and delivered to the laboratory.
Analyses were performed for copper and molybdenum using an aqua regia digestion. The pulverized samples were split down to 2 g. The 2 g aliquots were attacked by an aqua regia (HCl‐HNO3–H20) digestion, and analyzed for copper and molybdenum using Atomic Absorption Spectrophotometry. In the laboratory, a suite of blanks, reference materials and duplicate samples were inserted into the sample stream, at a rate of approximately one in ten analyses represents a quality control check. The results reported were within the limits of instrumental and analytical accuracy. Prior to 2004 field duplicates were collected and analyzed from two separate samples from the same core interval. Every 20th core sample was quartered, with the two quarters sent for analysis. They were used to measure the reproducibility of sampling, which includes both laboratory variation and sample variation.
All sample collection, processing and analysis were done at the Huckleberry mine site. Samples sent for analysis to an outside lab were transported by a bonded carrier. Split core, coarse sample rejects and pulverized sample rejects are stored at the Huckleberry mine site for future reference. The Huckleberry mine site is not open to the general public, and as such may be considered secure. For diamond drill data collected before 2004, the database has been proofread and checked for accuracy against the original logs and assay sheets, kept on file at the Huckleberry mine. The database was constructed before the implementation of NI 43‐101 and its requirements for QA/QC, however, the database has been extensively tested by the collection of tens of thousands of blasthole assays in the MZ, EZ and MZX pits. These have been reconciled against the production of millions of pounds of copper and molybdenum metal.
Mineral Reserve Estimate
Huckleberry mine operations were suspended on August 31, 2016. The mine remains on care and maintenance status. The mineral reserve estimate provided below is for the year ended December 31, 2016.
Huckleberry Mine Probable Reserves*
Ore (tonnes) Copper %
MZO 34,960,000 0.324
*@ cut‐off grade 0.150% Copper (excluding stockpiles)
This reserve estimate was prepared under the supervision of Kent Christensen, P.Eng., General Manager, designated the Qualified Person (as defined in NI 43‐101) for the estimate. The 2011 Huckleberry Report provides discussion of the key assumptions, parameters, and methods used to estimate mineral reserves and risks that could materially affect the potential development of the mineral reserves.

‐ 38 ‐
Imperial Metals Corporation | 2018 Annual Information Form
Mining and Mineral Processing
Huckleberry is an open pit copper‐molybdenum mine. Operations began in September 1997, with initial mining in the EZ starter pit. Since initiation, mining has switched between the EZ and the MZ located 600 m to the west. Tailings and barren rock was placed in designated tailings management facilities (“TMF‐2” and “TMF‐3”), as well as backfilled into completed mine pits. TMF‐2 was used for tailings and PAG rock disposal in the initial years of mine development. When mining reverted back to the EZ in 2002, tailings and PAG rock were backfilled to the MZ pit area. This area is contiguous with the TMF‐2 impoundment, and is retained by three dams: the TMF‐2 Dam to the southwest, the East Dam to the east (between the MZ pit and the EZ pit), and the Orica Saddle Dam to the south. The TMF‐2 is full to its design capacity. The TMF‐3 was constructed in 2012 to store the additional tailings and barren rock.
In June 2007, a pit slope failure occurred in the north wall of the EZ pit. A causeway of rock was then constructed across the pit to create a buttress and stabilize the slope. The East Pit Plug Dam was also built at the low point along the mined‐out EZ pit perimeter. Mining continued back in the Main zone with the MZX and MZO pits, and tailings and PAG rock have been backfilled to the EZ pit impoundment. Before the current suspension of open pit mining operations, ore was being mined from the MZO pit and tailings deposited in TMF‐3.
Ore from the pit is delivered to a 42”x 65” gyratory crusher and after crushing is conveyed to a stockpile. Ore from the stockpile is ground in two stages prior to flotation, firstly in a single 10,000 hp SAG mill, and secondly in two 5,000 hp ball mills. A bulk copper concentrate is floated from the ball mill product. The bulk copper concentrate is then reground in a 1,500 hp regrind mill, and then floated again to produce a final copper concentrate grading approximately 27% copper.
The concentrate is thickened and dewatered prior to shipment. A SAG pebble circuit was completed in mid‐2000. This circuit consists of conveyors that transports this coarse SAG mill discharge to a pebble crusher where the materials are crushed and then returned to the SAG mill.
During 2015, HML reviewed mining and milling plans and subsequently implemented cost control initiatives to reduce costs and optimize production in response to the drop in copper prices. HML made significant efforts during 2015 to reduce Huckleberry mine operating costs however, the realized savings were not sufficient to offset the decline of the copper price.
On January 6, 2016, HML suspended pit mining operations. Stockpiles were then milled until the end of August 2016. Huckleberry mine remains on care and maintenance.
Information on Mining, Milling, Infrastructure, Permitting and Compliance Activities, Environmental, Permitting, Social or Community factors and Capital and Operating Costs can be viewed in the 2011 Huckleberry Report.
Production
Huckleberry mine operations were suspended on August 31, 2016. The mine remains on care and maintenance.
A preliminary plan to restart the mine has been developed, and will be under consideration for implementation, at such time when the economics of mining improve. In the interim, the Company will develop exploration programs designed to expand the resource.
Years Ended December 31 2018 2017 2016(1)(2) 2015(1)
Ore milled ‐ tonnes ‐ ‐ 4,621,709 6,763,061
Ore milled per calendar day ‐ tonnes ‐ ‐ 18,941 18,529
Grade % ‐ copper ‐ ‐ 0.229 0.325
Recovery % ‐ copper ‐ ‐ 87.62 89.25
Copper ‐ lbs ‐ ‐ 20,438,051 43,273,334
Gold ‐ oz ‐ ‐ 1,927 3,576
Silver ‐ oz ‐ ‐ 100,425 206,781
(1) production stated 100% ‐ Imperial’s allocation is 50% (2) production to August 31, 2016

‐ 39 ‐
Imperial Metals Corporation | 2018 Annual Information Form
Other Properties
Imperial has interests in various other early stage exploration properties, and sufficient work will be conducted to keep these properties in good standing.
Dividends and Distributions
Imperial has not declared, and does not intend to declare, cash dividends or distributions on its securities. Payment of dividends is within the discretion of the Company’s Board of Directors and will depend on Imperial’s future earnings, if any, its capital requirements and financial condition, and other relevant factors.
Capital Structure
Imperial’s Authorized Share Capital:
50,000,000 First Preferred shares without par value with special rights and restrictions to be determined by the directors, of which 3,100,000 have been designated as Series A First Preferred shares (issued & outstanding–nil).
50,000,000 Second Preferred shares without par value with rights and restrictions to be determined by the directors (issued & outstanding–nil).
An unlimited number of Common Shares without par value.
As at December 31, 2018 there were 120,782,585 Common Shares issued & outstanding.
Each Common Share entitles its holder to notice of all meetings of holders of Common Shares and to attend and vote at such meetings. All of the Common Shares rank equally as to participation in dividends as and when declared and in the distribution of Imperial’s remaining assets on a liquidation, dissolution or winding‐up.
The directors of Imperial are authorized to issue the First Preferred shares and the Second Preferred shares in one or more series, to set the number of shares in and determine the designation of each such series and to attach such rights and restrictions to each series as they may determine. No First Preferred shares or Second Preferred shares have been issued subject to call or assessment. Currently, there are no pre‐emptive or conversion or exchange rights attached to First Preferred shares or Second Preferred Shares and no provisions for redemption, retraction, or purchase for cancellation, surrender, or sinking or purchase funds.
Provisions as to the modification, amendment or variation of the authorized share structure of Imperial are contained in the BCBCA.
Market for Securities
Imperial’s common shares are listed on The Toronto Stock Exchange and trade under symbol III.
2018 High Low Volume Traded
Jan 3.40 2.26 2,896,822
Feb 2.86 2.20 1,445,161
Mar 2.44 1.89 735,597
Apr 2.49 1.85 862,141
May 2.06 1.80 956,991
Jun 2.30 1.81 864,443
Jul 1.94 1.26 1,017,204
Aug 1.40 0.93 2,820,547
Sep 2.31 0.99 3,053,568
Oct 1.99 1.13 1,511,119
Nov 1.65 0.99 1,145,803
Dec 1.62 1.05 661,645

‐ 40 ‐
Imperial Metals Corporation | 2018 Annual Information Form
Ratings
Standard & Poor's (“S&P”) rating services credit ratings are on a long term rating scale that ranges from AAA to D which represents the range from highest to lowest quality of securities rated. In 2014 the initial rating for Imperial was B‐ which was reduced to CCC+ as a result of the Mount Polley Breach. The decline in commodity prices late that year resulted in a downgrade to the corporate credit rating to CCC and the credit rating on the Senior Notes to CCC‐ on January 27, 2016. On March 3, 2017 S&P changed the outlook to Positive from Negative reflecting improved copper commodity prices and the December 2016 $65 million equity issuance which improved the Company’s liquidity. On July 7, 2017 S&P downgraded the ratings to CCC‐ and CC as a result of the covenant risks and liquidity concerns. According to S&P, the CCC‐ rating generally means the relevant issuer is currently vulnerable to non‐payment, and is dependent upon favorable business, financial and economic conditions for the obligor to meet its financial commitment on the obligation and that in the event of adverse business, financial, or economic conditions the obligor is not likely to have the capacity to meet its financial commitment on the obligation. According to S&P, the CC rating generally means that relevant issuer is highly vulnerable to nonpayment, and that while a default has not yet occurred, S&P expects default to be a virtual certainty, regardless of the anticipated time to default. On March 15, 2019 S&P downgraded the rating to D from CCC. A rating of D generally means the obligation is in default. The ranges from AAA to D may be modified by the addition of a plus (+) or (‐) sign to show relative standing within the major rating categories.
Moody’s rating services credit ratings are on a long term rating scale that ranges from Aaa to C which represents the range from highest to lowest quality of such securities rated. Following the Mount Polley Breach in August 2014, Moody’s downgraded Imperial’s corporate rating from B2 to Caa1 and the Senior Notes from B3 to Caa2. On July 7, 2017 Moody’s downgraded the corporate rating to Caa2 and the rating on the Senior Notes to Caa3 with a Negative outlook. According to Moody’s this rating generally means the obligations are judged to be of poor standing and subject to very high credit risk. Moody’s appends numerical modifiers 1, 2 and 3 to each generic rating classification for Aaa through C. The modifier 1 indicates that the security ranks in the higher end of this generic rating category, modifier 2 indicates a mid‐range ranking and the modifier 3 indicates a ranking in the lower end of generic category.
Current Ratings Standard & Poor’s Moody’s
Senior Notes D Caa3
Outlook Negative Negative
We understand the credit ratings accorded to the Senior Notes by S&P and Moody’s are not recommendations to purchase, hold or sell the Senior Notes as such ratings do not comment as to market price or suitability for a particular investor. There is no assurance that any rating will remain in effect for any given period of time or that any rating will not be revised or withdrawn entirely by a rating agency in the future, in its judgement, as circumstances so warrant.

‐ 41 ‐
Imperial Metals Corporation | 2018 Annual Information Form
Directors & Executive Officers
The term of office for each director will expire at Imperial’s 2019 Annual General Meeting, or when their successor is duly elected or appointed, unless their office is earlier vacated in accordance with the articles of the Company.
Name, Province and Country of Residence
Current Position with Imperial
Present Principal Occupation; Employment for Previous Five Years
Director Since
Pierre Lebel
British Columbia, Canada
Chairman
Director 1.3.4.6.
Chairman 2001 Dec 6
J. Brian Kynoch
British Columbia, Canada
President
Director 4.
President 2002 Mar 7
Larry G. Moeller
Alberta, Canada
Lead Director 1.2.3.6. President of Kimball Capital Corporation 2002 Mar 7
Theodore Muraro
British Columbia, Canada
Director 2.4.5. Geological Engineer 2009 Nov 4
Janine North
British Columbia, Canada
Director 1.2.5. Director of Conifex Timber Inc. and Maple Gold Mines; prior thereto was Director of British Columbia Hydro and Power Authority (2010‐2018); and retired founding CEO of Northern Development Initiative Trust (2016).
2018 May 22
JP Veitch
Alberta, Canada
Director 1.5.6. Director and Secretary/Treasurer of Partner Two Corp., a private consultancy company; prior thereto: Executive Advisor to CEO, Packers Plus Energy Services (2014‐2016).
2018 May 22
Edward Yurkowski
British Columbia, Canada
Director 1.2.3.4.5. Engineer and Consultant; prior thereto: Director, Procon Mining and Tunnelling Ltd. (2018) and Procon Chief Executive Officer (2014)
2005 May 20
Andre Deepwell
British Columbia, Canada
Chief Financial Officer
& Corporate Secretary
Chief Financial Officer & Corporate Secretary ‐
Don Parsons
British Columbia, Canada
Chief Operating Officer & Senior Vice President Operations
Chief Operating Officer & Senior Vice President Operations
‐
Sophie E. Hsia
British Columbia, Canada
General Counsel & Vice President Risk
Vice President Risk (2017) & General Counsel (2015); prior thereto: Corporate Legal Counsel (2014)
‐
Darb Dhillon
British Columbia, Canada
Vice President Finance
Vice President Finance (2017); prior thereto: Director of Finance for Newmarket Gold Inc. and Kirkland Lake Gold (2017); Vice President Finance for Jemi Fibre Corp. (2015); Assistant Controller, SNC Lavalin (2013)
‐
Randall Thompson
British Columbia, Canada
Vice President Operations & Red Chris Mine General Manager
Red Chris Mine General Manager (Nov 2018) and Vice President Operations (Jul 2018); prior thereto: Chief Operating Officer, JDS Silver Inc.(2017); President, Huckleberry Mines Ltd. (2016)
‐
Jim Miller‐Tait
British Columbia, Canada
Vice President Exploration
Vice President Exploration (2017); Exploration Manager (2009)
‐
Sheila Colwill
British Columbia, Canada
Vice President Marketing
Vice President Marketing (2017); Marketing Manager (2011)
‐
COMMITTEES: 1. Audit 2. Compensation 3. Corporate Governance & Nominating 4. Health & Safety 5. Special: Mount Polley Breach 6. Special: Strategic Initiatives
‐ 42 ‐
Imperial Metals Corporation | 2018 Annual Information Form
Shareholdings of Directors and Executive Officers
The directors and executive officers beneficially owned, or controlled, or directed, directly or indirectly, a total of 6,029,090 common shares of Imperial, representing approximately 4.99% of the total 120,782,585 issued and outstanding common shares of Imperial as at December 31, 2018.
Audit Committee
The Audit Committee is structured to comply with National Instrument 52‐110 (“NI 52‐110”), and is responsible for reviewing the Company's financial reporting procedures, internal controls and the performance of the Company's external auditors.
All members of the Audit Committee are independent, financially literate, and understand the breadth and level of complexity of the issues that may reasonably be expected to be raised by the Company's financial statements.
Larry Moeller, B. Comm., CPA, CA, CBV – Audit Committee Chair
Mr. Moeller is President of Kimball Capital Corporation, a private company based in Calgary, Alberta, and a Director of Magellan Aerospace Corporation and Orbus Pharma Inc.
Pierre Lebel, LL.B., MBA
Mr. Lebel is a Director of HomEquity Bank, Maple Gold Mines Ltd., Business Council of British Columbia, and a Director and Audit Committee member of West Kirkland Mining Inc.
Janine North, ICD.D.
Ms. North is a Director of Conifex Timber Inc. and Maple Gold Mines Ltd. She is a former Director of British Columbia Hydro and Power Authority, and the retired, founding, Chief Executive Officer of Northern Development Initiative Trust.
J.P Veitch
Mr. Veitch is a Director and Secretary/Treasurer of Partner Two Corp., a private consultancy company, and former Executive Advisor to CEO of Packers Plus Energy Services.
Edward Yurkowski, P.Eng.
Mr. Yurkowski is an Engineer and Consultant in the mining industry, and he was founder, Chief Executive Officer, and former director of Procon Mining and Tunnelling Ltd., a Vancouver based mining contractor company. Mr. Yurkowski is a Director and Audit Committee member of Fortune Minerals Ltd., and a Director of Copper Lake Resources Ltd.
Audit Committee Charter
The Audit Committee is responsible for reviewing the Company’s financial reporting procedures, internal controls and the performance of the Company’s external auditors. The Audit Committee Charter is available in the Corporate Governance section on imperialmetals.com and on sedar.com.
Reliance on Certain Exemptions
At no time since commencement of the Company’s most recently completed financial year has the Company relied on the exemptions in Sections 2.4, 3.2, 3.3(2), 3.4, 3.5, 3.6 or 3.8 of NI 52‐110, or an exemption from NI 52‐110, in whole or in part, granted under Part 8 of NI 52‐110.
Audit Committee Oversight
At no time since commencement of the Company’s most recently completed financial year has a recommendation of the Audit Committee to nominate or compensate an external auditor not adopted by the Board.
Pre‐Approval Policies and Procedures
The Audit Committee is authorized by the Board to review the performance of the Company’s external auditors and approve in advance provision of non‐audit services and to consider the independence of the external auditors. The Audit Committee has delegated to the Chair of the Audit Committee the authority to act on behalf of the Committee with respect to the pre‐approval of the audit and permitted non‐audit services provided by Deloitte LLP from time to time. The Chair reports on any such pre‐approval at each meeting of the Audit Committee.

‐ 43 ‐
Imperial Metals Corporation | 2018 Annual Information Form
External Auditor Service Fees |
Aggregate fees paid to Deloitte LLP:
Years Ended 2018 2017
Audit fees (1) $502,000 $478,500
Audit related fees (2) $30,000 ‐
All other fees (3) ‐ 15,000
Total $532,000 $493,500
(1) For professional services rendered for the audit and review of our financial statements or services provided in connection with statutory and regulatory filings or engagements.
(2) For assurance and related services that are reasonably related to the performance of the audit or review of the financial statements and are not reported under “Audit Fees” above.
(3) For professional services not related to audit and assurance.
Complaint Procedures
The Company has implemented detailed procedures for receipt, retention and treatment of complaints or submissions regarding accounting, internal accounting controls or auditing matters, and confidential and anonymous submission of concerns from employees of the Company or any of its subsidiaries about questionable accounting or auditing matters.
Imperial’s procedures for filing complaints relating to accounting and auditing matters is available in the Corporate Governance section on imperialmetals.com.
Compensation Committee
Larry Moeller, Chair; Ted Muraro; Janine North; Edward Yurkowski
The primary objective is to discharge the Board’s responsibilities relating to compensation and benefits of the executive officers and directors of the Company.
Corporate Governance & Nominating Committee
Pierre Lebel, Chair; Larry Moeller; Edward Yurkowski
The primary objective is to assist the Board in fulfilling its oversight responsibilities to identify and recommend qualified individuals for appointment or election to the Board, and to develop and recommend to the Board corporate governance guidelines and practices for the Company.
Health & Safety Committee
Ted Muraro, Chair; Brian Kynoch; Pierre Lebel; Edward Yurkowski
The primary objective is to oversee the development and implementation of appropriate policies and to review the performance of the Company with respect to industrial health and safety matters.
Special Committee: Mount Polley Breach
J.P. Veitch, Chair; Ted Muraro; Janine North; Edward Yurkowski
The primary objective is to provide oversight on the legal and technical work resulting from the Mount Polley Breach.
Special Committee: Strategic Initiatives
Larry Moeller, Chair; Pierre Lebel; J.P. Veitch
The primary objective is to identify, consider, negotiate and potentially implement all strategic alternatives including sales of some of the Company’s assets, joint ventures, a recapitalization, and a sale or merger of the Company.

‐ 44 ‐
Imperial Metals Corporation | 2018 Annual Information Form
Corporate Cease Trade Orders or Bankruptcies
Mr. Yurkowski was a Director of Chieftain Metals Corp. (“Chieftain”) from May 22, 2013 to September 1, 2016. On August 31, 2016, Chieftain and its wholly‐owned subsidiary (Chieftain Metals Inc.) was served with an application by West Face Capital Inc., as agent for West Face Long Term Opportunities Global Master L.P., seeking the appointment of Grant Thornton Limited as receiver of all of the assets, undertakings and properties of Chieftain. On September 6, 2016, the Ontario Superior Court of Justice issued an order appointing Grant Thornton Limited as the receiver and manager of all the assets, undertakings and properties of Chieftain. On June 2, 2017, the Ontario Superior Court of Justice issued an order authorizing Grant Thornton Limited to file a proposal under the Bankruptcy and Insolvency Act (Canada) in respect of Chieftain and its wholly‐owned subsidiary.
Mr. Moeller was a Director of Protective Products of America, Inc. when the corporation and its subsidiaries filed on January 13, 2010 voluntary petitions for relief under Chapter 11 of the United States Bankruptcy Code in the United States Bankruptcy Court for the Southern District of Florida, Fort Lauderdale Division. On January 14, 2010, the shares of the corporation were suspended from trading on the Toronto Stock Exchange, and were delisted on February 19, 2010 for failure to meet continued listing requirements. Mr. Moeller resigned as Director in February 2010.
Mr. Yurkowski was a Director of Cross Lake Minerals Ltd. (“Cross Lake”) from July 28, 2008 to September 18, 2008. Mr. Kynoch was a Director of Cross Lake from March 5, 2004 until October 23, 2008. Cross Lake applied to the British Columbia Supreme Court and obtained a court order dated October 14, 2008 granting Cross Lake creditor protection under the Companies' Creditors Arrangement Act (Canada) to allow it to develop a reorganization plan with its creditors. On June 1, 2009, Cross Lake changed its name to 0373849 B.C. Ltd. and completed the restructuring transactions provided for in the amended and restated plan of compromise and arrangement filed by it on May 21, 2009 pursuant to the Companies' Creditors Arrangement Act (Canada) and the BCBCA.
Conflicts of Interest
Certain of the Company's directors and officers also serve as directors or officers of other companies or have significant shareholdings in other companies, as a result of which they may find themselves in a position where their duty to another company conflicts with their duty to the Company. To the extent that such other companies may transact with the Company or participate in ventures in which the Company may participate, the directors or officers of the Company may have a conflict of interest in negotiating and concluding terms respecting the extent of such participation. In the event that such a conflict of interest arises, at a meeting of the Board, a director who has such a conflict will disclose the nature and extent of his interest to the meeting and abstain from voting in respect of the matter.
Interest of Management & Others in Material Transactions
During its three most recently completed financial years, the Company closed various financings that involved its significant shareholders and other insiders of the Company, details of which are provided above in the section entitled Development of the Company 2016‐2018 & Outlook for 2019 under the sub‐heading “Financings”.
In December 2016, Edco purchased certain trade accounts receivable from the Company totaling approximately $7.3 million. These amounts were repaid in December 2016 upon collection of the accounts receivable. Interest at a rate of 8% per annum was paid by the Company on the factored accounts receivable.
During the year ended December 31, 2017 Edco purchased certain trade accounts receivable from the Company. These amounts were repaid during 2017 upon collection of the accounts receivable. Interest at a rate of 8% per annum was paid by the Company on the factored accounts receivable. To assist with financing working capital during the year ended December 31, 2017 the Company also sold certain concentrate inventory to Edco, which it subsequently repurchased. Interest at a rate of 8% per annum was paid by the Company on these financing transactions.
In September 2018, the Company sold 0.5% net smelter return royalty interest on the Red Chris project for US$17 million to Prairie Birch Royalties Ltd., of which a significant shareholder of the Company is a minority equity shareholder. This royalty was subject to a 100% buyback option granted to Imperial for four years at the sum of US$17 million plus simple interest thereon at 11% per annum (6% per annum in the event the buyback option were exercised prior to January 31, 2019) less the aggregate amount of royalty payments paid.

‐ 45 ‐
Imperial Metals Corporation | 2018 Annual Information Form
On November 27, 2018, in accordance with the existing buyback option, the Directors of the Company approved the repurchase of the 0.5% net smelter return royalty interest in the Red Chris project sold in September 2018. The buyback option provided for the repurchase of this royalty by the Company for US$17 million, being equal to the proceeds received on the royalty, plus simple interest at 6% per annum.
Except as otherwise disclosed herein, no director, executive officer or principal shareholder of the Company, or any associate or affiliate of the foregoing, have had any material interest, direct or indirect, in any other transaction within the three most recently completed financial years or during the current financial year prior to the date of this AIF that has materially affected or is reasonably expected to materially affect the Company.
Material Contracts
Material contracts, other than contracts entered into in the ordinary course of business, that were entered into by the Company between January 1, 2018 and the date of this AIF, or before that time yet are still in effect, are:
Senior Credit Facility
On March 12, 2014, the Company entered into the five‐year Senior Credit Facility with a syndicate of lenders providing for a $200 million revolving credit facility comprised of two tranches: a $50.0 million revolving working capital tranche for general corporate purposes and a $150.0 million revolving construction tranche to fund Red Chris project costs. Interest is payable monthly under the Senior Credit Facility and the principal was payable in full upon the maturity date of October 1, 2016. The Company, and its wholly‐owned subsidiaries, MPMC and RCDC, are the borrowers under the Senior Credit Facility. The borrowers’ cross guarantee and their direct and indirect material subsidiaries guarantee all obligations under the Senior Credit Facility. The Senior Credit Facility is secured on a pari passu basis by a first lien of all of the guarantors under the Senior Credit Facility and the Company’s present and future property and assets, real and personal. The Senior Credit Facility includes various restrictive covenants that, subject to exceptions, limit the Company’s ability to, among other things, incur or assume indebtedness, grant or assume security, engage in affiliate transactions, engage in speculative trading, undertake material changes in the Company’s business or enter into acquisitions, mergers and consolidations. The Senior Credit Facility also requires compliance with financial covenants, additional details of which are provided within the Company’s March 12, 2014 material change report filed on SEDAR.
On May 12, 2016, the Company extended the maturity date of the Senior Credit Facility from October 1, 2016 to March 15, 2018 and amended certain terms and conditions, including financial covenants. The amount of the facility remained unchanged at $200 million. Additional details are provided within the Company’s May 13, 2016 material change report filed on SEDAR.
On February 10, 2017, the Company amended certain financial covenants under the Senior Credit Facility for the March 31, June 30, and September 30, 2017 reporting periods. Additional details are provided within the Company’s February 10, 2017 material change report filed on SEDAR.
On November 2, 2017, the Company extended the maturity date to October 1, 2018 and amended certain terms and conditions, including financial covenants. Additional details are provided within the Company’s November 3, 2017 material change report filed on SEDAR.
On September 14, 2018, the Company extended the maturity date of the Senior Credit Facility from October 1, 2018 to February 15, 2019 and the syndicate of lenders was replaced by one of the syndicate lenders such that the facility only has one lender effective September 14, 2018. The Senior Credit Facility is supported by a guarantee from Edco for an annual fee of 225 basis points. The annual guarantee fee is less than the reduction in the interest rate charged on the extended Senior Credit Facility, and results in reduced interest expense to the Company. All the financial
covenants that were in place on the Senior Credit Facility have been removed from the extended credit facility. The Senior Credit Facility maturity date has been extended to September 5, 2019.
Second Lien Credit Facility
On January 19, 2015, the Company completed the $50 million Second Lien Credit Facility with the Bank of Montreal maturing on April 1, 2017. The terms and conditions of the credit facility are modelled after the Senior Credit Facility, adjusted to reflect the second lien. Edco guaranteed the Second Lien Credit Facility, in consideration for which Edco received an annual fee of 2% of the loan amount payable monthly. The Second Lien Credit Facility was intended to

‐ 46 ‐
Imperial Metals Corporation | 2018 Annual Information Form
provide additional liquidity for the commissioning and start‐up of the Red Chris Mine and for general working capital purposes.
On May 12, 2016, the Company extended the maturity date of the Second Lien Credit Facility from April 1, 2017 to August 15, 2018 and amended certain terms and conditions, including financial covenants. The amount of the facility remained unchanged at $50 million. Additional details are provided within the Company’s May 13, 2016 material change report filed on SEDAR.
On November 2, 2017, the Company extended the maturity date to December 1, 2018 and amended certain terms and conditions, including financial covenants. Additional details are provided within the Company’s November 3, 2017 material change report filed on SEDAR. On May 12, 2016 the Company also amended the guarantee fee payable to Edco such that the annual fee ranges from 2% to 3.875% based on the consolidated total debt to EBITDA ratio of the Company.
On September 17, 2018, the Company extended the maturity date of the Second Lien Credit Facility from December 1, 2018 to February 15, 2019 and reduced the annual fee for the guarantee of this facility by Edco from 387.5 basis points to 225 basis points. The Second Lien Credit Facility maturity date has been extended to September 9, 2019.
Senior Notes
Indenture among the Company and certain guarantors and the Bank of New York Mellon, as trustee, dated as of March 12, 2014, in respect of US$325 million aggregate principal amount of 7% Senior Notes due 2019. Edco purchased US$50.0 million principal amount of Senior Notes in the offering. Directors and officers of the Company purchased US$3.3 million principal amount of Senior Notes in the offering. These purchases were made on the same terms and conditions as purchases of Senior Notes by other investors. For additional detail regarding the key provisions of the indenture providing for the issuance of the Senior Notes between the Company, the guarantors thereunder and The Bank of New York Mellon, as trustee (the “Indenture”), refer to the Company’s material change report and the Indenture, both filed on SEDAR on March 21, 2014.
On March 15, 2019, the Company refinanced US$98,445,000 of its 7% US$325 million Senior Notes due March 15, 2019. Edco subscribed for US$98,445,000 of additional Senior Notes (principal amount of US$1,000 each) on the same terms and conditions as the existing Senior Notes. Such funding enabled the Company to repay an equal dollar amount of the principal of the Senior Notes that were payable in full Friday March 15, 2019, being US$98,445,000. The remaining existing holders of Senior Notes in the principal amount of US$226,555,000 agreed, as did Edco in respect to the additional Senior Notes, to extend the maturity date of the Senior Notes until September 15, 2019.
Junior Credit Facility
In March 2014, the Company entered into a five year $75 million junior unsecured loan facility with Edco, bearing interest payable at 10% per annum on amounts borrowed under the facility (the “Junior Credit Facility”). The Junior Credit Facility maturity date has been extended to September 12, 2019.
Bridge Loan
On July 31, 2017, the Company closed a $20 million Bridge Loan with affiliates of its two significant shareholders, Edco and Fairholme, each of which provided $10 million of the Bridge Loan. The Bridge Loan is secured by all assets of the Company, and is subordinated to the Senior Credit Facility and Second Lien Credit Facility lenders. Interest on the Bridge Loan is payable monthly commencing on August 31, 2017 at the rate of 8% per annum. The Bridge Loan originally matured on the earlier of October 15, 2017 or the date the Company secured additional financing. The maturity date was later extended on October 13, 2017 to January 5, 2019 subject to various loan extension conditions, and the loan amount was increased by $6 million to $26 million effective October 31, 2017, with half the increase provided by an affiliate of Fairholme. For further details, refer to the Company’s material change report filed on SEDAR on November 3, 2017. The Bridge Loan maturity date has been extended to September 11, 2019.

‐ 47 ‐
Imperial Metals Corporation | 2018 Annual Information Form
Debenture Subscriptions
On September 3, 2014, subscription agreements were issued among the Company and various subscribers in respect of a non‐brokered private placement of $115.0 million face value of 6% six year senior unsecured 2014 convertible debentures (the “2014 Convertible Debentures). Edco and Fairholme each purchased $40.0 million or 34.8% each, of the 2014 Convertible Debentures. Subject to adjustment, each $11.691 of face value debenture is convertible into one common share of Imperial upon at least 61 days advance notice. The 2014 Convertible Debentures are not callable unless the closing price of the Company’s common shares exceeds 125% of the conversion price for at least 30 consecutive days. Interest will be payable semi‐annually, with the first payment due on June 30, 2015. At the option of the Company, subject to the separate approval of the Toronto Stock Exchange and compliance with all applicable securities laws, such interest may be paid through the issuance of additional convertible debentures or Imperial’s common shares.
Subscription agreements were entered into on August 19, 2015 among the Company and various subscribers in respect of a non‐brokered private placement of $30 million face value of 6% six year senior unsecured 2015 Convertible Debenture Private Placement. Edwards and Fairholme purchased $16.2 million and $8.1 million of the 2015 Convertible Debenture Private Placement, respectively. Interest is payable semi‐annually, with the first payment due on June 30, 2016. Each $11.772 of face value debenture, subject to adjustment, is convertible into one common share of Imperial upon at least 61 days’ advance notice; and the 2015 Convertible Debenture Private Placement is not callable unless the closing price of the Company’s common shares exceeds 125% of the conversion price for at least 30 consecutive days.
_________________________________________________________________________
1 As a result of the 2015 Rights Offering, the conversion price was reduced from $12.00 to $11.91 per common share. As a result of the 2017 Rights Offering, the conversion price was reduced from $11.91 to $11.69 per common share.
2 As a result of the 2017 Rights Offering, the conversion price was reduced from $12.00 to 11.77 per common share.
Legal Proceedings
The nature of the Company’s business may subject it to numerous regulatory investigations, claims, lawsuits and other proceedings. The results of these legal proceedings cannot be predicted with certainty. In the opinion of management, these matters, unless otherwise described herein, are not expected to have a material effect on the Company’s consolidated financial position, cash flow or results of operations.
On September 8, 2014, a securities class action was commenced by way of statement of claim against the Company and certain of its directors, officers and others in the Ontario Superior Court of Justice in Toronto (the “Claim”). The plaintiff seeks various declaratory relief and $150 million in general damages based on assertions of misrepresentation (both under the common law and various statutes) and negligence with respect to the Company’s prior corporate disclosure of the risks associated with the Mount Polley TSF. Due to the inherent uncertainties of litigation, at this time the Company cannot predict the outcome of the Claim or determine the amount of any potential losses, if any. The Company has engaged independent legal counsel to advise it on this matter, denies any wrongdoing, and intends to vigorously defend the Claim.
On July 4, 2016, an action was commenced by the Company by way of notice of civil claim in the British Columbia Supreme Court against two engineering firms, Knight Piésold Ltd. and AMEC Earth & Environmental (et.al.), for damages arising out of their alleged negligence and breach of contract in providing engineering services to the Company in regards to the tailings storage facility at the Mount Polley mine, which the Company claims resulted in the Mount Polley Breach. The action was contested. In response to the action, the defendants counterclaimed against the Company, seeking, among other things, orders that if either is liable to the Company, then the Company must indemnify that defendant for such liability in whole or in part. The defendants also filed third party claims against each other, BGC Engineering Inc. and the Province of British Columbia. On November 27, 2018 the Company announced the action had been settled among all parties in consideration of net payments to the Company totaling approximately $108 million. This settlement represents compromises of disputed claims and does not constitute an admission of liability on the part of any party to the action.

‐ 48 ‐
Imperial Metals Corporation | 2018 Annual Information Form
Transfer Agent & Registrar
Computershare Investor Services Inc. acts as the Company’s transfer agent and registrar, and has office locations in Vancouver and Toronto.
Interests of Experts
Deloitte LLP Chartered Professional Accountants, the Company’s auditors, have prepared an opinion with respect to the Company’s consolidated financial statements for the year ended December 31, 2018 which is contained within the 2018 Annual Report available on imperialmetals.com and sedar.com. Deloitte LLP confirm they are independent of Imperial in accordance with the Rules of Professional Conduct of the Institute of the Chartered Accountants of British Columbia.
The following persons prepared or certified a statement, report, opinion or valuation described or included in, or referred to in, a filing made under National Instrument 51‐102 by the Company, and whose profession or business gives authority to such statement, report, opinion or valuation. These persons were employees of the Company at the date of the stated reports, and may have had registered or beneficial interests, direct or indirect in the securities of the Company, however such securities would represent substantially less than one per cent of the Company’s outstanding securities.
2016 Mount Polley Report – dated May 20, 2016 Ryan Brown, P.Eng.; Gary Roste, P.Geo.; Janice Baron, P.Eng.; and Chris Rees, Ph.D., P.Geo.
2012 Red Chris Report – dated February 14, 2012, amended and restated September 30, 2015 Greg Gillstrom, P.Eng.; Raj Anand, M.Eng., P.Eng.; Stephen Robertson, P.Geo.; and Paul Sterling, P.Eng.
2011 Huckleberry Report – dated November 22, 2011, amended May 11, 2016 Kent Christensen, P.Eng.; Gerald R. Connaughton, P.Eng.; and Peter Ogryzlo, M.Sc., P.Geo.
Additional Information
Additional information, including details of director and officer remuneration and indebtedness, principal holders of
Imperial shares, securities authorized for issuance or equity compensation plans, options to purchase Imperial shares
and certain other matters, is contained in the Company’s Information Circular for its most recent annual general
meeting of shareholders that involved the election of directors and on SEDAR at sedar.com. Additional financial
information is provided in the Company’s 2018 Annual Report. Copies of these and other disclosure documents are
available at imperialmetals.com and sedar.com, or by contacting the Company’s Shareholder Communications at
604.488.2657.