2019-20 complaint statistics
TRANSCRIPT
Australian Human Rights Commission 2019-20 Complaint statistics
1
2019-20 COMPLAINT STATISTICS CONTENTS OVERVIEW .................................................................................................................................................... 2
ENQUIRIES - OVERVIEW ......................................................................................................................... 7
COMPLAINTS - OVERVIEW .................................................................................................................... 8
DISABILITY DISCRIMINATION ACT .................................................................................................. 13
SEX DISCRIMINATION ACT ................................................................................................................. 18
RACIAL DISCRIMINATION ACT ......................................................................................................... 22
AGE DISCRIMINATION ACT ................................................................................................................ 27
AUSTRALIAN HUMAN RIGHTS COMMISSION ACT (AHRCA) ............................................... 31
ATTACHMENT A Covid-19 related written enquiries and complaints

Australian Human Rights Commission 2019-20 Complaint statistics
2
OVERVIEW Enquiries and complaints received In 2019-20, the Commission received 12,554 enquiries. In contrast with previous years, a majority of enquiries were received in writing. The main issues raised by enquirers in this reporting year related to:
• disability discrimination (22%) • discrimination on grounds covered by the Sex Discrimination Act (10%) • general employment matters including harassment and bullying (9%) • racial discrimination including racial hatred (11%) • human rights related issues including immigration and immigration detention
(8%) • Covid-19 enquiries (3%)
In 2019-20 the Commission received 2,307 complaints. One complaint may raise a number of grounds and areas of discrimination and be against one or more respondents. If the Commission counted complaints by respondents, the number of complaints received in 2019-20 would increase to 2,989. If the Commission counted complaints received by grounds and areas of discrimination, the number of complaints received would increase to 4,941 and 3,030 respectively. Consistent with previous years, the main areas of public life raised by complaints were employment and the provision of goods, services and facilities. In 2019-20:
• 44% of complaints were lodged under the Disability Discrimination Act • 21% of complaints were lodged under the Sex Discrimination Act • 17% of complaints were lodged under the Racial Discrimination Act • 7% of complaints were lodged under the Age Discrimination Act • 11% of complaints were lodged under the Australian Human Rights
Commission Act In terms of employment, this made up:
• 30% of complaints under the Disability Discrimination Act • 71% of complaints under the Sex Discrimination Act • 27 % of complaints under the Racial Discrimination Act • 47% of complaints under the Age Discrimination Act
In terms of goods and services, this made up:
• 56% of complaints under the Disability Discrimination Act
Australian Human Rights Commission 2019-20 Complaint statistics
3
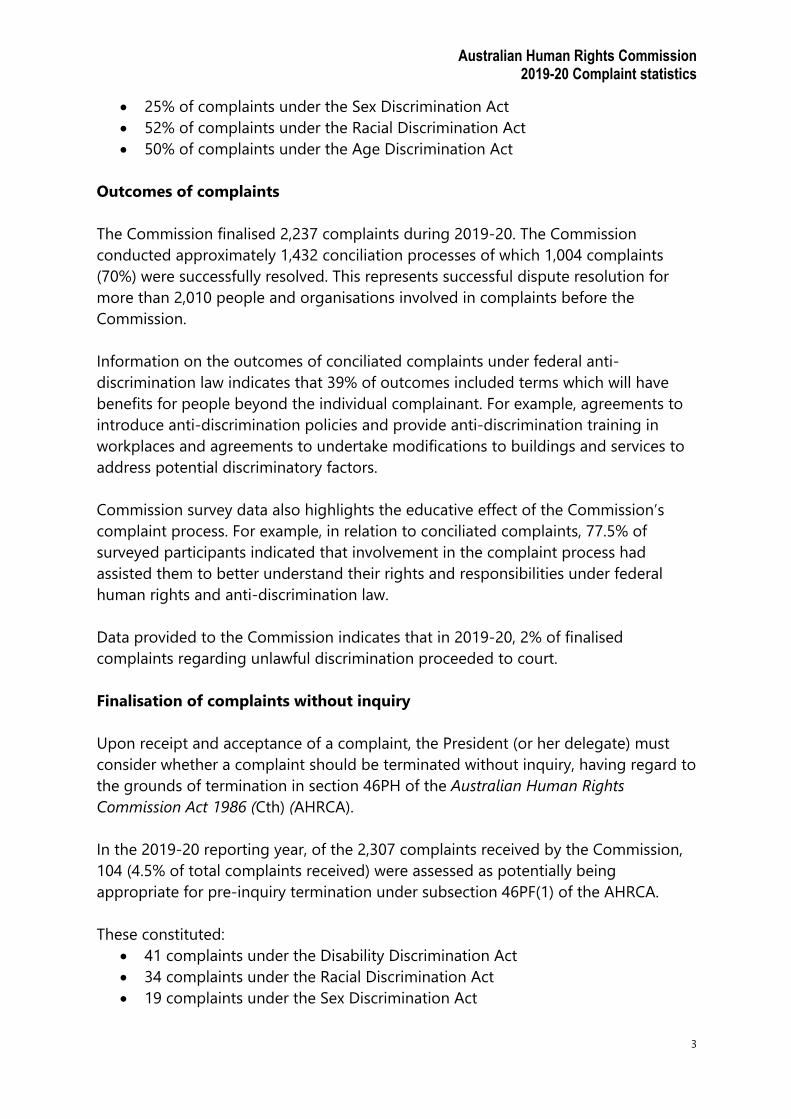
• 25% of complaints under the Sex Discrimination Act • 52% of complaints under the Racial Discrimination Act • 50% of complaints under the Age Discrimination Act
Outcomes of complaints The Commission finalised 2,237 complaints during 2019-20. The Commission conducted approximately 1,432 conciliation processes of which 1,004 complaints (70%) were successfully resolved. This represents successful dispute resolution for more than 2,010 people and organisations involved in complaints before the Commission. Information on the outcomes of conciliated complaints under federal anti-discrimination law indicates that 39% of outcomes included terms which will have benefits for people beyond the individual complainant. For example, agreements to introduce anti-discrimination policies and provide anti-discrimination training in workplaces and agreements to undertake modifications to buildings and services to address potential discriminatory factors. Commission survey data also highlights the educative effect of the Commission’s complaint process. For example, in relation to conciliated complaints, 77.5% of surveyed participants indicated that involvement in the complaint process had assisted them to better understand their rights and responsibilities under federal human rights and anti-discrimination law. Data provided to the Commission indicates that in 2019-20, 2% of finalised complaints regarding unlawful discrimination proceeded to court. Finalisation of complaints without inquiry Upon receipt and acceptance of a complaint, the President (or her delegate) must consider whether a complaint should be terminated without inquiry, having regard to the grounds of termination in section 46PH of the Australian Human Rights Commission Act 1986 (Cth) (AHRCA). In the 2019-20 reporting year, of the 2,307 complaints received by the Commission, 104 (4.5% of total complaints received) were assessed as potentially being appropriate for pre-inquiry termination under subsection 46PF(1) of the AHRCA. These constituted:
• 41 complaints under the Disability Discrimination Act • 34 complaints under the Racial Discrimination Act • 19 complaints under the Sex Discrimination Act
Australian Human Rights Commission 2019-20 Complaint statistics
4
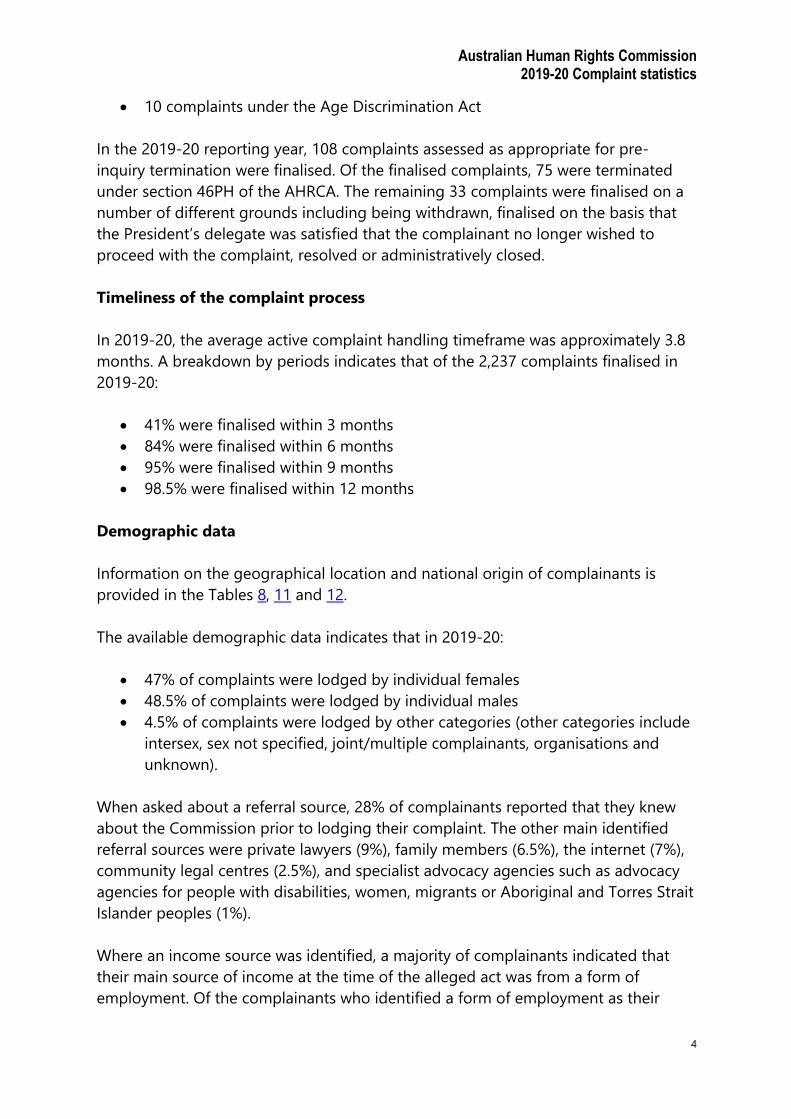
• 10 complaints under the Age Discrimination Act In the 2019-20 reporting year, 108 complaints assessed as appropriate for pre-inquiry termination were finalised. Of the finalised complaints, 75 were terminated under section 46PH of the AHRCA. The remaining 33 complaints were finalised on a number of different grounds including being withdrawn, finalised on the basis that the President’s delegate was satisfied that the complainant no longer wished to proceed with the complaint, resolved or administratively closed. Timeliness of the complaint process In 2019-20, the average active complaint handling timeframe was approximately 3.8 months. A breakdown by periods indicates that of the 2,237 complaints finalised in 2019-20:
• 41% were finalised within 3 months • 84% were finalised within 6 months • 95% were finalised within 9 months • 98.5% were finalised within 12 months
Demographic data Information on the geographical location and national origin of complainants is provided in the Tables 8, 11 and 12. The available demographic data indicates that in 2019-20:
• 47% of complaints were lodged by individual females • 48.5% of complaints were lodged by individual males • 4.5% of complaints were lodged by other categories (other categories include
intersex, sex not specified, joint/multiple complainants, organisations and unknown).
When asked about a referral source, 28% of complainants reported that they knew about the Commission prior to lodging their complaint. The other main identified referral sources were private lawyers (9%), family members (6.5%), the internet (7%), community legal centres (2.5%), and specialist advocacy agencies such as advocacy agencies for people with disabilities, women, migrants or Aboriginal and Torres Strait Islander peoples (1%). Where an income source was identified, a majority of complainants indicated that their main source of income at the time of the alleged act was from a form of employment. Of the complainants who identified a form of employment as their

Australian Human Rights Commission 2019-20 Complaint statistics
5
income source, 79% indicated they were in full or part-time permanent employment, 19% were engaged in casual, contract or outwork and 3% were self-employed. Approximately 35% of complainants (804) said they were represented during the complaint process. Of the represented complainants, 36% said they were represented by privately funded solicitors. Other identified forms of representation were family members or friends (31%), community legal centres, including Aboriginal or disability legal services (10%), other advocacy groups such as working women’s centres or disability advocacy services (8%) and trade unions or professional associations (4%). In 2019-20, the main respondent organisation categories were private enterprises (52%), state/territory departments/statutory authorities (17%) and Commonwealth departments/statutory authorities (14%). These are consistently the main respondent organisation categories. Satisfaction with the complaint service We seek feedback on aspects of the service from people lodging complaints (complainants) and people responding to complaints (respondents). The survey can be completed online or in other formats. Feedback is sought regardless of the outcome of the complaint and includes feedback from parties where the complaint was terminated, withdrawn or discontinued. In 2019-20, 213 complainants and 205 respondents agreed to participate in the survey. Details of survey feedback is provided below.
• 93% of participants (90% of complainants and 97% of respondents) reported
that they were satisfied with the service provided and 78% of participants (74% of complainants and 81% of respondents) rated the service as ‘very good’ or ‘excellent’. Where complaints were conciliated, these figures increased with 99% of participants reporting they were satisfied with the service and 83% rating the service as ‘very good‘ or ‘excellent’.
• 95% of participants (92.5% of complainants and 97.5% of respondents) felt that Commission staff explained things in a way that was easy for them to understand.
• 95% of participants (92% of complainants and 98% of respondents) felt that forms and correspondence from the Commission were easy to understand.
• 79% of participants (70% of complainants and 89% of respondents) felt that the Commission dealt with the complaint in a timely manner.
• 89% of participants (83% of complainants and 95% of respondents) felt they were treated fairly.

Australian Human Rights Commission 2019-20 Complaint statistics
6
Our Charter of Service provides an avenue through which complainants and respondents can understand the nature and standard of service they can expect, as well as contribute to continual improvement of our service. All complainants are provided with a copy of the Charter when their complaint is accepted by the Commission. Respondents receive a copy when notified of a complaint. Our Charter of Service is available at http://www.humanrights.gov.au/complaints-charter-service. In 2019-20 the Commission did not receive any complaint about its service under the complaint process provided in the Charter.
Australian Human Rights Commission 2019-20 Complaint statistics
7
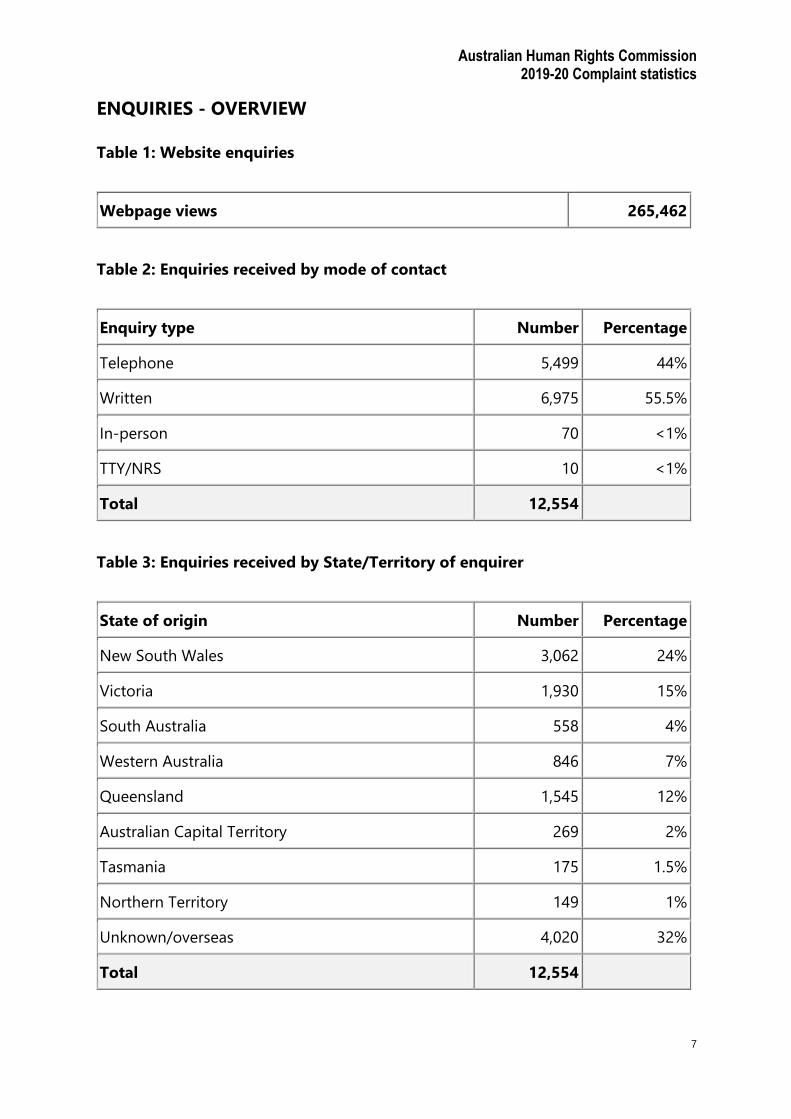
ENQUIRIES - OVERVIEW Table 1: Website enquiries
Webpage views 265,462
Table 2: Enquiries received by mode of contact
Enquiry type Number Percentage
Telephone 5,499 44%
Written 6,975 55.5%
In-person 70 <1%
TTY/NRS 10 <1%
Total 12,554
Table 3: Enquiries received by State/Territory of enquirer
State of origin Number Percentage
New South Wales 3,062 24%
Victoria 1,930 15%
South Australia 558 4%
Western Australia 846 7%
Queensland 1,545 12%
Australian Capital Territory 269 2%
Tasmania 175 1.5%
Northern Territory 149 1%
Unknown/overseas 4,020 32%
Total 12,554
Australian Human Rights Commission 2019-20 Complaint statistics
8
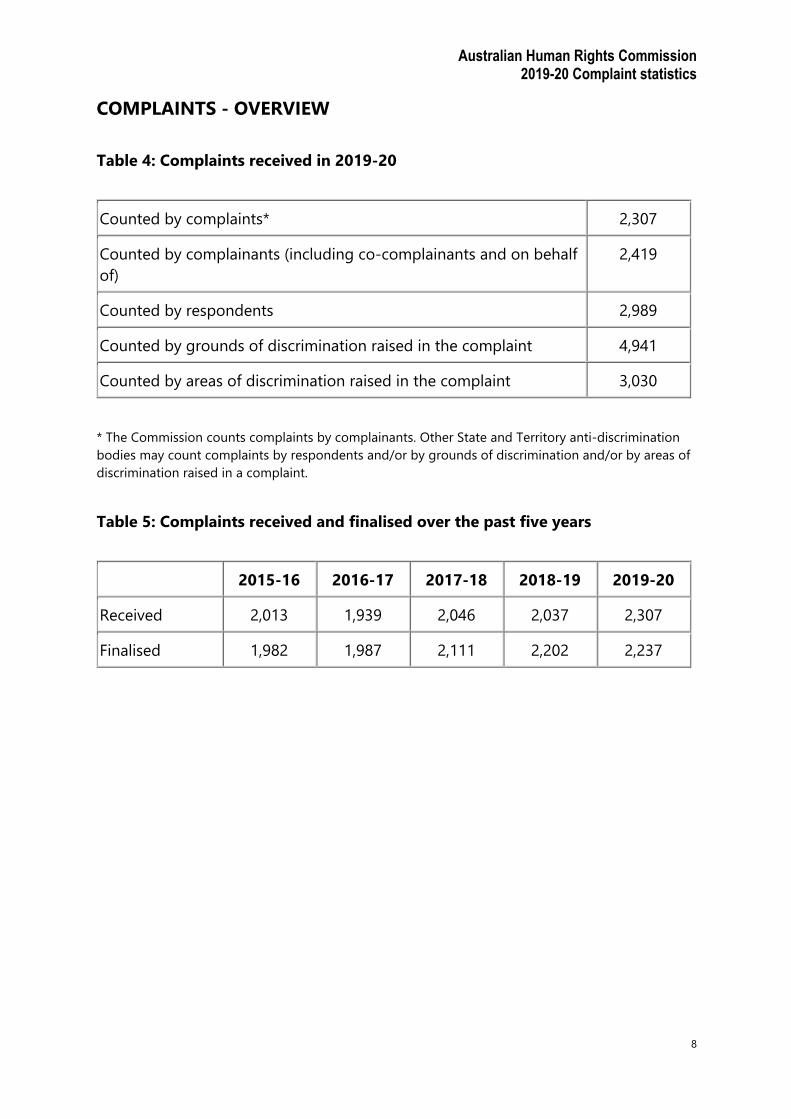
COMPLAINTS - OVERVIEW Table 4: Complaints received in 2019-20
Counted by complaints* 2,307
Counted by complainants (including co-complainants and on behalf of)
2,419
Counted by respondents 2,989
Counted by grounds of discrimination raised in the complaint 4,941
Counted by areas of discrimination raised in the complaint 3,030
* The Commission counts complaints by complainants. Other State and Territory anti-discrimination bodies may count complaints by respondents and/or by grounds of discrimination and/or by areas of discrimination raised in a complaint.
Table 5: Complaints received and finalised over the past five years
2015-16 2016-17 2017-18 2018-19 2019-20
Received 2,013 1,939 2,046 2,037 2,307
Finalised 1,982 1,987 2,111 2,202 2,237
Australian Human Rights Commission 2019-20 Complaint statistics
9
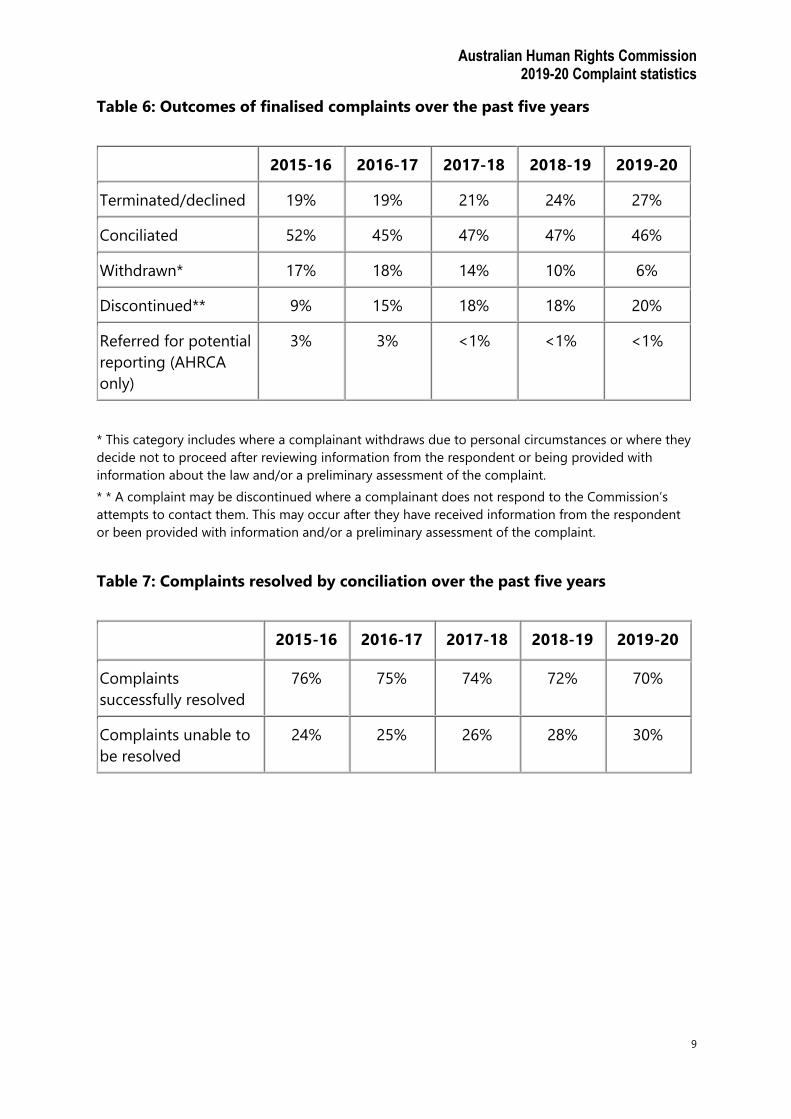
Table 6: Outcomes of finalised complaints over the past five years
2015-16 2016-17 2017-18 2018-19 2019-20
Terminated/declined 19% 19% 21% 24% 27%
Conciliated 52% 45% 47% 47% 46%
Withdrawn* 17% 18% 14% 10% 6%
Discontinued** 9% 15% 18% 18% 20%
Referred for potential reporting (AHRCA only)
3% 3% <1% <1% <1%
* This category includes where a complainant withdraws due to personal circumstances or where they decide not to proceed after reviewing information from the respondent or being provided with information about the law and/or a preliminary assessment of the complaint. * * A complaint may be discontinued where a complainant does not respond to the Commission’s attempts to contact them. This may occur after they have received information from the respondent or been provided with information and/or a preliminary assessment of the complaint. Table 7: Complaints resolved by conciliation over the past five years
2015-16 2016-17 2017-18 2018-19 2019-20
Complaints successfully resolved
76% 75% 74% 72% 70%
Complaints unable to be resolved
24% 25% 26% 28% 30%

Australian Human Rights Commission 2019-20 Complaint statistics
10
Table 8: Complaints received by State/Territory of complainant
State of origin Number Percentage
New South Wales 907 39%
Victoria 509 22%
South Australia 136 6%
Western Australia 206 9%
Queensland 329 14%
Australian Capital Territory 84 4%
Tasmania 28 1%
Northern Territory 27 1%
Unknown/overseas 81 3.5%
Total 2,307
Table 9: Complaints received and finalised by Act
Act Received Finalised
Disability Discrimination Act (DDA) 1,006 939
Sex Discrimination Act (SDA) 479 500
Racial Discrimination Act (RDA) 403 476
Age Discrimination Act (ADA) 168 117
Australian Human Rights Commission Act (AHRCA) 251 205
Total 2,307 2,237

Australian Human Rights Commission 2019-20 Complaint statistics
11
Chart 1: Complaints received by Act
Disability Discrimination Act 44% Sex Discrimination Act 21% Racial Discrimination Act 17% Age Discrimination Act 7% Australian Human Rights Commission Act 11% Table 10: Complaints received by Act over the past five years
2015-16 2016-17 2017-18 2018-19 2019-20
Disability Discrimination Act 750 755 869 891 1,006
Sex Discrimination Act 409 465 552 520 479
Racial Discrimination Act 429 409 290 332 403
Age Discrimination Act 152 154 172 137 168
Australian Human Rights Commission Act
273 156 163 157 251
Total 2,013 1,939 2,046 2,037 2,307
44%
21%
17%
7%
11%Disability Discrimination Act
Sex Discrimination Act
Racial Discrimination Act
Age Discrimination Act
Australian Human RightsCommission Act

Australian Human Rights Commission 2019-20 Complaint statistics
12
Table 11: Country of birth of complainants
A DDA (%)
SDA (%)
RDA (%)
ADA (%)
AHRCA (%)
Total (%)
Born in Australia 27% 16% 21% 17% 14% 21%
Born outside of Australia 6% 11% 72% 10% 26% 21%
Unknown or unspecified 70% 73% 7% 73% 60% 57%
Table 12: Indigenous status of complainants
A DDA (%)
SDA (%)
RDA (%)
ADA (%)
AHRCA (%)
Total (%)
Aboriginal 3% 2.5% 17% <1 2% 5%
Torres Strait Islander <1 <1 <1 <1
Both of the above <1 <1
None of the above/ Unknown
97% 97% 83% 99% 98% 95%
Table 13: Time from receipt to finalisation for finalised complaints
A DDA (%)
SDA (%)
RDA (%)
ADA (%)
AHRCA (%)
Cumulative Total (%)
0 - 3 months 35% 44% 52% 39% 34% 41%
0 - 6 months 82% 86% 88% 88% 74% 84%
0 - 9 months 95% 95% 96% 97% 91% 95%
0 - 12 months 99% 99% 99% 100% 95% 98.5%
Australian Human Rights Commission 2019-20 Complaint statistics
13
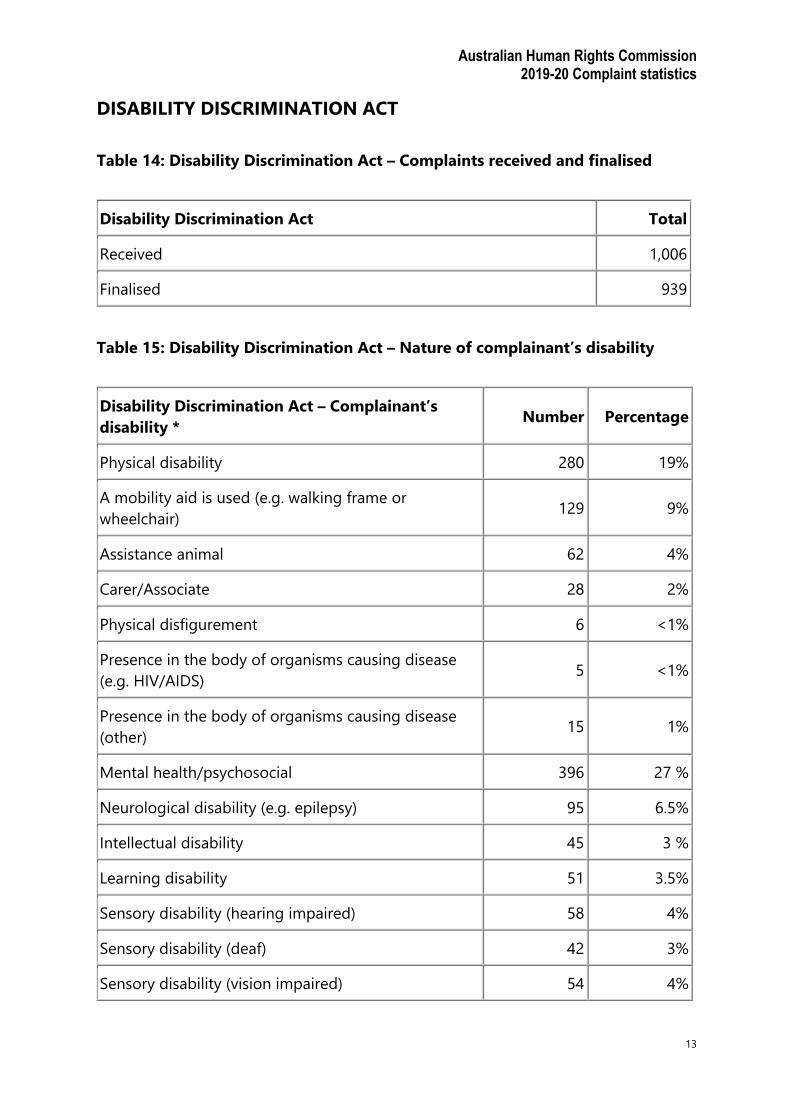
DISABILITY DISCRIMINATION ACT Table 14: Disability Discrimination Act – Complaints received and finalised
Disability Discrimination Act Total
Received 1,006
Finalised 939
Table 15: Disability Discrimination Act – Nature of complainant’s disability
Disability Discrimination Act – Complainant’s disability * Number Percentage
Physical disability 280 19%
A mobility aid is used (e.g. walking frame or wheelchair) 129 9%
Assistance animal 62 4%
Carer/Associate 28 2%
Physical disfigurement 6 <1%
Presence in the body of organisms causing disease (e.g. HIV/AIDS) 5 <1%
Presence in the body of organisms causing disease (other) 15 1%
Mental health/psychosocial 396 27 %
Neurological disability (e.g. epilepsy) 95 6.5%
Intellectual disability 45 3 %
Learning disability 51 3.5%
Sensory disability (hearing impaired) 58 4%
Sensory disability (deaf) 42 3%
Sensory disability (vision impaired) 54 4%

Australian Human Rights Commission 2019-20 Complaint statistics
14
Sensory disability (blind) 28 2%
Work-related injury 20 1%
Medical condition (e.g. diabetes) 133 9%
Other 0 0%
Total 1,447
* One complainant may have multiple disabilities. Table 16: Disability Discrimination Act – Complaints received by ground
Disability Discrimination Act – Grounds* Number Percentage
Disability of person(s) aggrieved 1,841 78%
Associate 88 4%
Disability – person assisted by a trained animal 103 4%
Disability – accompanied by a carer or assistant 9 <1%
Disability – aid 75 3%
Harassment 7 <1%
Victimisation 51 2%
Causes, instructs, induces, aids or permits an unlawful act 14 <1%
Incites unlawful act
Advertisements
Unlawful to contravene disability standard 183 7.72%
Total 2,371
* One complaint may raise multiple grounds and may include claims of both direct and indirect discrimination.

Australian Human Rights Commission 2019-20 Complaint statistics
15
Table 17: Disability Discrimination Act – Complaints received by area
Disability Discrimination Act – Areas* Number Percentage
Employment 298 20%
Goods, services and facilities 563 39%
Access to premises 122 8%
Land
Accommodation 46 3%
Superannuation, insurance 16 1%
Education 128 9%
Clubs, incorporated associations 15 1%
Administration of Commonwealth laws and programs 74 5%
Sport 5 <1%
Requests for information 2 <1%
Qualifying bodies 5 <1%
Registered organisations
Disability standards 183 12.5%
Total 1,457
* One complaint may relate to more than one area.

Australian Human Rights Commission 2019-20 Complaint statistics
16
Table 18: Disability Discrimination Act – Outcomes of finalised complaints
Disability Discrimination Act – Outcomes of finalised complaints Number
Terminated without inquiry under section 46PF* 23
Terminated after inquiry 243
Not unlawful
More than 6 months old 1
Trivial, vexatious, frivolous, misconceived, lacking in substance 25
More effective or convenient remedy 4
No reasonable prospect of conciliation 207
Inquiry not warranted 6
Discontinued** 150
Withdrawn*** 62
Conciliated 438
Administrative closure**** 23
Total 939
* A complaint may be terminated without inquiry if the President’s delegate is satisfied, having regard to the matters referred to in section 46PH of the AHRCA, that the complaint should be terminated without inquiry. ** A complaint may be discontinued in circumstances where the President’s delegate is satisfied the complainant no longer wishes the Commission to continue its inquiry. This may occur after the complainant has received information from the respondent or been provided with information and/or a preliminary assessment of the complaint. *** This category includes where a complainant withdraws due to personal circumstances or where they decide not to proceed after reviewing information from the respondent or being provided with information about the law and/or a preliminary assessment of the complaint. **** Includes where a complaint has not been lodged by or on behalf of an aggrieved person and where a complaint has also been lodged under State or Territory anti-discrimination law.

Australian Human Rights Commission 2019-20 Complaint statistics
17
Chart 2: Disability Discrimination Act – Outcomes of finalised complaints
Conciliated 48% Discontinued 16% Withdrawn 7% Terminated without inquiry 2.5% Terminated - no reasonable prospect of conciliation 22.5% Terminated - other reason 4% Chart 3: Disability Discrimination Act – Complaints resolved by conciliation
Complaints successfully resolved 68% Complaints unable to be resolved 32%
48%
16%
7%2.5%
22.5%
4%
Conciliated
Discontinued
Withdrawn
Terminated without inquiry
Terminated - no reasonableprospect of conciliation
Terminated - other reason
68%
32% Complaints successfullyresolved
Complaints unable to beresolved

Australian Human Rights Commission 2019-20 Complaint statistics
18
SEX DISCRIMINATION ACT Table 19: Sex Discrimination Act – Complaints received and finalised
Sex Discrimination Act Total
Received 479
Finalised 500
Table 20: Sex Discrimination Act – Complaints received by complainant category
Sex Discrimination Act – Complainant category Number Percentage
Female 364 76%
Male 110 23%
Intersex 3 <1%
Other category* 2 <1%
Total 479
* Includes sex not specified, joint/multiple, or organisation
Table 21: Sex Discrimination Act – Complaints received by ground
Sex Discrimination Act – Grounds* Number Percentage
Sex discrimination 347 37%
Marital or relationship status 44 5%
Pregnancy 77 8%
Sexual harassment 231 24.5%
Family responsibilities 48 5%
Breastfeeding 7 <1%

Australian Human Rights Commission 2019-20 Complaint statistics
19
Gender identity 41 4%
Intersex
Sexual orientation 50 5%
Victimisation 91 10%
Causes, instructs, induces, aids or permits an unlawful act 5 <1%
Advertisements
Total 941
* One complaint may raise multiple grounds and may include claims of both direct and indirect discrimination.
Table 22: Sex Discrimination Act – Complaints received by area
Sex Discrimination Act – Areas* Number Percentage
Employment 341 64%
Goods, services and facilities 122 23%
Land
Accommodation 29 5%
Superannuation & insurance 2 <1%
Education 13 2 %
Clubs 8 1.5%
Administration of Commonwealth laws and programs 14 3%
Requests for information
Registered organisations
Qualifying bodies 2 <1%
Total 531
* One complaint may relate to more than one area.

Australian Human Rights Commission 2019-20 Complaint statistics
20
Table 23: Sex Discrimination Act – Outcomes of finalised complaints
Sex Discrimination Act - Outcomes Number
Terminated without inquiry under section 46PF* 12
Terminated after inquiry 119
Trivial, vexatious, frivolous, misconceived, lacking in substance 9
No reasonable prospect of conciliation 109
Inquiry not warranted 1
Discontinued** 83
Withdrawn*** 33
Conciliated 227
Administrative closure**** 26
Total 500
* A complaint may be terminated without inquiry if the President’s delegate is satisfied, having regard to the matters referred to in section 46PH of the AHRCA, that the complaint should be terminated without inquiry. ** A complaint may be discontinued in circumstances where the President’s delegate is satisfied the complainant no longer wishes the Commission to continue its inquiry. This may occur after the complainant has received information from the respondent or been provided with information and/or a preliminary assessment of the complaint. *** This category includes where a complainant withdraws due to personal circumstances or where they decide not to proceed after reviewing information from the respondent or being provided with information about the law and/or a preliminary assessment of the complaint. **** Includes where a complaint has not been lodged by or on behalf of an aggrieved person and where a complaint has also been lodged under State or Territory anti-discrimination law.

Australian Human Rights Commission 2019-20 Complaint statistics
21
Chart 4: Sex Discrimination Act – Outcomes of finalised complaints
Conciliated 48% Discontinued 17.5% Withdrawn 7% Terminated without inquiry 2.5% Terminated – no reasonable prospect of conciliation 23% Terminated – other reason 2% Chart 5: Sex Discrimination Act – Complaints resolved by conciliation
Complaints successfully resolved 68% Complaints unable to be resolved 32%
48%
17.5%
7%2.5%
23%
2%
Conciliated
Discontinued
Withdrawn
Terminated without inquiry
Terminated - no reasonableprospect of conciliation
Terminated - other reason
68%
32% Complaints successfullyresolved
Complaints unable to beresolved
Australian Human Rights Commission 2019-20 Complaint statistics
22
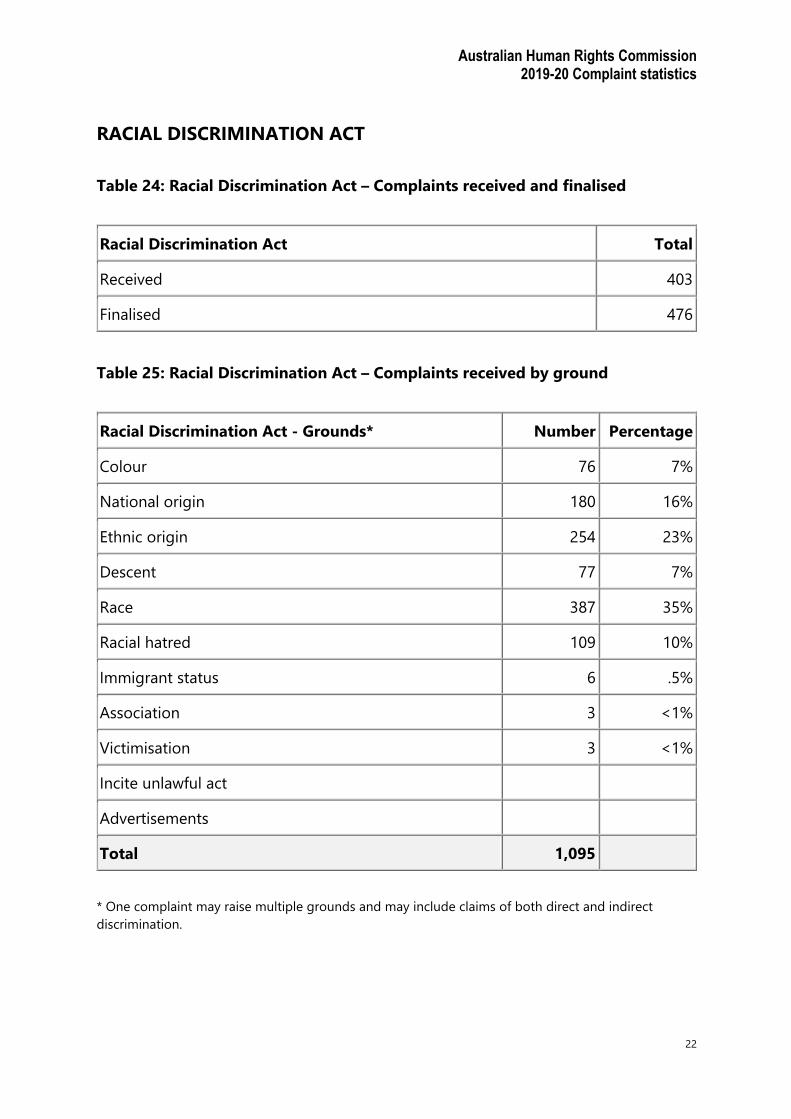
RACIAL DISCRIMINATION ACT Table 24: Racial Discrimination Act – Complaints received and finalised
Racial Discrimination Act Total
Received 403
Finalised 476
Table 25: Racial Discrimination Act – Complaints received by ground
Racial Discrimination Act - Grounds* Number Percentage
Colour 76 7%
National origin 180 16%
Ethnic origin 254 23%
Descent 77 7%
Race 387 35%
Racial hatred 109 10%
Immigrant status 6 .5%
Association 3 <1%
Victimisation 3 <1%
Incite unlawful act
Advertisements
Total 1,095
* One complaint may raise multiple grounds and may include claims of both direct and indirect discrimination.

Australian Human Rights Commission 2019-20 Complaint statistics
23
Table 26: Racial Discrimination Act – Complaints received by area
Racial Discrimination Act - Areas* Number Percentage
Rights to equality before the law 1 <1%
Access to places and facilities 7 1%
Land, housing and other accommodation 18 3%
Provision of goods and services 211 37%
Superannuation 1 <1%
Right to join trade union
Employment 110 19%
Education 12 2%
Other - section 9 100 17.5%
Racial hatred 109 19%
Total 569
* One complaint may relate to more than one area.
Table 27: Racial hatred complaints received by sub-area
Racial hatred sub-areas Number Percentage
Media – press/TV/radio 15 14%
Disputes between neighbours 18 16.5%
Personal conflict 7 6%
Employment 30 27.5%
Internet - e-mail/webpage/chat room 14 13%
Sport 1 1%
Public debate
Provision of goods and services 19 17%

Australian Human Rights Commission 2019-20 Complaint statistics
24
Table 28: Racial Discrimination Act – Outcomes of finalised complaints
Racial Discrimination Act - Outcomes Number
Terminated without inquiry under section 46PF* 26
Terminated after inquiry 85
Adequately dealt with by the Commission 1
Inquiry not warranted 1
Trivial, vexatious, frivolous, misconceived, lacking in substance 16
No reasonable prospect of conciliation 65
Not unlawful discrimination 2
Discontinued** 77
Withdrawn*** 18
Conciliated 254
Administrative closure**** 16
Total 476
* A complaint may be terminated without inquiry if the President’s delegate is satisfied, having regard to the matters referred to in section 46PH of the AHRCA, that the complaint should be terminated without inquiry. ** A complaint may be discontinued in circumstances where the President’s delegate is satisfied the complainant no longer wishes the Commission to continue its inquiry. This may occur after the complainant has received information from the respondent or been provided with information and/or a preliminary assessment of the complaint. *** This category includes where a complainant withdraws due to personal circumstances or where they decide not to proceed after reviewing information from the respondent or being provided with information about the law and/or a preliminary assessment of the complaint.
Education
Racist propaganda 1 1%
Other 4 4%
Total 109

Australian Human Rights Commission 2019-20 Complaint statistics
25
**** Includes where a complaint has not been lodged by or on behalf of an aggrieved person and where a complaint has also been lodged under State or Territory anti-discrimination law.

Australian Human Rights Commission 2019-20 Complaint statistics
26
Chart 6: Racial Discrimination Act – Outcomes of finalised complaints
Conciliated 55% Discontinued 17% Withdrawn 4% Terminated without inquiry 6% Terminated - no reasonable prospect of conciliation 14% Terminated - other reason 4% Chart 7: Racial Discrimination Act – Complaints resolved by conciliation
Complaints successfully resolved 80% Complaints unable to be resolved 20%
55%
17%
4%6%
14%4%
Conciliated
Discontinued
Withdrawn
Terminated without inquiry
Terminated - no reasonableprospect of conciliation
Terminated - other reason
80%
20%Complaints successfullyresolved
Complaints unable to beresolved

Australian Human Rights Commission 2019-20 Complaint statistics
27
AGE DISCRIMINATION ACT Table 29: Age Discrimination Act – Complaints received and finalised
Age Discrimination Act Total
Received 168
Finalised 117
Table 30: Age Discrimination Act – Age group of complainant
Age Discrimination Act – Complainant age group Number Percentage
0 – 12 years
13 – 17 years 2 1%
18 – 24 years 9 5%
25 – 34 years 21 12.5%
35 – 44 years 9 5%
45 – 54 years 23 14%
55 – 64 years 38 23%
65 – 74 years 39 23%
>75 years 27 16%
Total 168
Table 31: Age Discrimination Act – Complaints received by ground
Age Discrimination Act - Grounds* Number Percentage
Age 269 98.5%
Causes, instructs, induces, aids or permits an unlawful act 1 >1%
Victimisation 3 1%

Australian Human Rights Commission 2019-20 Complaint statistics
28
Advertisements
Total 273
* One complaint may raise multiple grounds and may include claims of both direct and indirect discrimination.
Table 32: Age Discrimination Act – Complaints received by area
Age Discrimination Act - Areas* Number Percentage
Employment 79 36%
Goods, services and facilities 84 38%
Access to premises 34 15%
Land
Accommodation 3 1%
Advertisements
Superannuation, insurance 4 2%
Education 1 <1%
Administration of Commonwealth laws and programs 13 6%
Sport
Qualifying bodies 2 <1%
Requests for information 1 >1%
Victimisation
Total 221
* One complaint may relate to more than one area.
Table 33: Age Discrimination Act – Outcomes of finalised complaints
Age Discrimination Act – Outcomes Number

Australian Human Rights Commission 2019-20 Complaint statistics
29
Terminated without inquiry under section 46PF* 1
Terminated after inquiry 27
Not unlawful 3
Trivial, vexatious, frivolous, misconceived, lacking in substance 3
No reasonable prospect of conciliation 20
More effective or convenient remedy 1
Discontinued** 37
Withdrawn*** 14
Conciliated 34
Administrative closure**** 4
Total 117
* A complaint may be terminated without inquiry if the President’s delegate is satisfied, having regard to the matters referred to in section 46PH of the AHRCA, that the complaint should be terminated without inquiry. ** A complaint may be discontinued in circumstances where the President’s delegate is satisfied the complainant no longer wishes the Commission to continue its inquiry. This may occur after the complainant has received information from the respondent or been provided with information and/or a preliminary assessment of the complaint. *** This category includes where a complainant withdraws due to personal circumstances or where they decide not to proceed after reviewing information from the respondent or being provided with information about the law and/or a preliminary assessment of the complaint. **** Includes where a complaint has not been lodged by or on behalf of an aggrieved person and where a complaint has also been lodged under State or Territory anti-discrimination law.

Australian Human Rights Commission 2019-20 Complaint statistics
30
Chart 8: Age Discrimination Act – Outcomes of finalised complaints
Conciliated 30% Discontinued 33% Withdrawn 12% Terminated without inquiry <1% Terminated - no reasonable prospect of conciliation 18% Terminated - other reason 6% Chart 9: Age Discrimination Act – Complaints resolved by conciliation
Complaints successfully resolved 63% Complaints unable to be resolved 37%
30%
33%
12%
<1%
18%
6%
Conciliated
Discontinued
Withdrawn
Terminated without inquiry
Terminated - no reasonableprospect of conciliation
Terminated - other reason
63%
37% Complaints successfullyresolved
Complaints unable to beresolved

Australian Human Rights Commission 2019-20 Complaint statistics
31
AUSTRALIAN HUMAN RIGHTS COMMISSION ACT (AHRCA) Table 34: AHRCA – Complaints received and finalised
Australian Human Rights Commission Act Total
Received 251
Finalised 205
Table 35: AHRCA – Complaints received by ground
Australian Human Rights Commission Act – Grounds* Number Percentage
Age (ILO111)
Religion (ILO 111) 19 7%
Political opinion (ILO 111) 3 1%
Social origin (ILO 111)
Disability (ILO 111)
Medical record (ILO 111)
Criminal record (ILO 111) 97 37%
Sexual preference (ILO 111)
Trade union activity (ILO 111) 2 <1%
International Covenant on Civil and Political Rights 112 43%
Convention on the Rights of the Child 2 <1%
Convention on the Rights of Persons with Disabilities 23 9%
Declaration on the Elimination of All Forms of Intolerance and of Discrimination Based on Religion or Belief
2 <1%
Victimisation 1 <1%

Australian Human Rights Commission 2019-20 Complaint statistics
32
Total 261
* One complaint may raise multiple grounds.
Table 36: AHRCA – Complaints received by area
Australian Human Rights Commission Act - Areas* Number Percentage
Acts or practices of the Commonwealth 130 52%
No acts or practices of the Commonwealth 3 1%
Employment 119 47%
Total 252
* One complaint may relate to more than one area.
Table 37: AHRCA – Outcomes of finalised complaints
Australian Human Rights Commission Act - Outcomes Number
Declined 45
Does not constitute discrimination
Human rights breach, not inconsistent or contrary to any human right 1
More than 12 months old 1
Trivial, vexatious, frivolous, misconceived, lacking in substance 8
Adequately dealt with already
More appropriate remedy available
More effective or convenient remedy
No reasonable prospect of conciliation 27
Inquiry not warranted 8
Discontinued - withdrawn (DNWP = 33+60) 63
Discontinued - lost contact 30

Australian Human Rights Commission 2019-20 Complaint statistics
33
Conciliated 51
Referred for reporting** 15
Administrative closure 1
Total 205
* Complaints in this category could not be conciliated and were transferred from the Commission’s Investigation and Conciliation Section to the Legal Section for further inquiry and possible reporting.
Chart 10: AHRCA – Outcomes of finalised complaints
Conciliated 25% Referred for reporting 7% Declined 22% Discontinued (withdrawn) 31% Discontinued (lost contact) 15%
25%
7%
22%
31%
15%Conciliated
Referred for reporting
Declined
Discontinued (withdrawn)
Discontinued (lost contact)

Australian Human Rights Commission 2019-20 Complaint statistics
34
Chart 11: AHRCA – Complaints resolved by conciliation
Complaints successfully resolved 65% Complaints unable to be resolved 35%
65%
35% Complaints successfullyresolved
Complaints unable to beresolved

Australian Human Rights Commission 2019-20 Complaint statistics
35
Attachment A COVID-19 related written enquiries and complaints Enquiries The Commission received approximately 587 COVID-19 related written enquiries in 2019-20 and per month, the highest number received was in April 2020 (223). The main areas of concern raised in written enquiries are as follows:
• Racial hatred and abuse • Stimulus packages and employment • Quarantine • Lockdown and travel restrictions • Mandatory vaccinations • Mask wearing requirements
Complaints Initially COVID-19 related complaints received by the Commission in 2019-20 were complaints under the Racial Discrimination Act. However, as 2020 progressed, the Commission started to receive an increasing number of COVID-19 related complaints under the Disability Discrimination Act and the Australian Human Rights Commission Act. This trend is continuing into the 2020-21 year.
Act Received
Disability Discrimination Act 30
Sex Discrimination Act 8
Racial Discrimination Act 55
Age Discrimination Act 8
Australian Human Rights Commission Act 38
Total 139