2019 annual report - das.nh.govhuman resources policy, and supports the personnel appeals board. in...
TRANSCRIPT

State of New Hampshire Department of Administrative Services
Division of Personnel
2019 ANNUAL REPORT


State of New Hampshire Department of Administrative Services
Division of Personnel
2019 Annual Report Fiscal Year Ended June 30, 2019
Pursuant to RSA 21-I: 42
Charles M. Arlinghaus, Commissioner Lorrie A. Rudis, Director of Personnel
Carol Jerry, Deputy Director
Christopher T. Sununu, Governor Michael J. Cryans, Executive Councilor Theodore L. Gatas, Executive Councilor
Debora B. Pingnatelli, Executive Councilor Russell E. Prescott, Executive Councilor
Andru Volinsky, Executive Councilor
State House Annex 28 School Street
Concord, New Hampshire 03301 www.nh.gov/hr/


5
TABLE OF CONTENTS
GENERAL SUMMARY ..................................................................................................................................................... 7
DIVISION OF PERSONNEL .............................................................................................................................................. 8
OVERVIEW ....................................................................................................................................................................................................... 8
DIVISION OF PERSONNEL .............................................................................................................................................. 9
ORGANIZATIONAL STRUCTURE .................................................................................................................................................................... 9
DIRECTOR .............................................................................................................................................................. 9
BUREAU OF HUMAN RESOURCE ADMINISTRATION ............................................................................................. 9
BUREAU OF EMPLOYEE RELATIONS .................................................................................................................... 10
BUREAU OF EDUCATION AND TRAINING ............................................................................................................ 10
EMPLOYEE SUGGESTION AND EXTRAORDINARY SERVICE AWARD PROGRAM .......................................................... 11
EXECUTIVE BRANCH AT A GLANCE ............................................................................................................................. 13
EMPLOYEES BY CATEGORY ....................................................................................................................................................................... 14
POSITIONS BY CATEGORY .......................................................................................................................................................................... 14
DEMOGRAPHICS ......................................................................................................................................................... 15
WORKFORCE CHARACTERISTICS ................................................................................................................................. 16
DETAILED BREAKDOWN OF STATE OF NEW HAMPSHIRE EMPLOYEES ......................................................................... 17
EMPLOYEES BY GENDER AND EEO CATEGORY ...................................................................................................................................... 18
EMPLOYEES BY GENERATION .................................................................................................................................................................... 19
EMPLOYEES BY AGE .................................................................................................................................................................................... 20
EMPLOYEES BY YEARS OF SERVICE ......................................................................................................................................................... 21
EMPLOYEES BY AGE AND LABOR GRADE ................................................................................................................................................. 21
EMPLOYEES BY COUNTY ............................................................................................................................................................................ 22
FULL-TIME EMPLOYEES BY AGENCY ......................................................................................................................................................... 23
EMPLOYEES BY TYPE AND AGENCY .......................................................................................................................................................... 25
EMPLOYEE STATISTICS BY AGENCY WITH 10 OR MORE EMPLOYEES ................................................................................................. 27
ANNUAL AND SICK LEAVE USAGE BY AGENCY ........................................................................................................................................ 28
COMPENSATION ......................................................................................................................................................... 29
AVERAGE SALARY BY AGENCY .................................................................................................................................................................. 30
AVERAGE SALARY BY YEARS OF SERVICE* ............................................................................................................................................. 32
AVERAGE SALARY BY EEO CATEGORY* ................................................................................................................................................... 32
DISTRIBUTION OF EMPLOYEES BY LABOR GRADE STEP* ...................................................................................................................... 33
COST OF LONGEVITY* ................................................................................................................................................................................. 34
POSITION STATISTICS .................................................................................................................................................. 35
BREAKDOWN OF STATE OF NH POSITIONS BY TYPE AND BRANCH OF GOVERNMENT ...................................................................... 36
FILLED AND TOTAL FULL-TIME PERMANENT CLASSIFIED POSITIONS* ................................................................................................. 37
POSITIONS BY EEO OCCUPATION GROUP ................................................................................................................................................ 38

6
CLASSIFIED FULL-TIME PERMANENT POSITIONS BY AGENCY ............................................................................................................... 39
FULL-TIME SEASONAL POSITIONS BY AGENCY ....................................................................................................................................... 40
FULL-TIME TEMPORARY POSITIONS BY AGENCY .................................................................................................................................... 41
TURNOVER AND SEPARATION FROM SERVICE .......................................................................................................... 42
TURNOVER .................................................................................................................................................................................................... 43
TURNOVER OF CLASSIFIED EMPLOYEES ................................................................................................................................................. 44
DISTRIBUTION OF SEPARATED EMPLOYEES BY LENGTH OF SERVICE* .............................................................................................. 46
RATE OF SEPARATION BY LENGTH OF SERVICE ..................................................................................................................................... 47
EMPLOYEE SEPARATION FROM SERVICE BY REASON ........................................................................................................................... 48
VACANCY ..................................................................................................................................................................... 49
VACANCY RATE FOR FULL-TIME POSITIONS BY AGENCY....................................................................................................................... 50
VACANT FULL-TIME POSITIONS ON JUNE 30, 2019 BY NUMBER OF DAYS VACANT ............................................................................ 51
VACANT POSITIONS ON JUNE 30, 2019 BY NUMBER OF DAYS VACANT BY POSITION TYPE ............................................................. 52
VACANCY RATE ON JUNE 30, 2019 BY POSITION TYPE .......................................................................................................................... 52
RETIREMENT ELIGIBILITY ............................................................................................................................................ 53
EXECUTIVE BRANCH - GROUP 1 EMPLOYEES .......................................................................................................................................... 54
ESTIMATE OF CURRENT AND FUTURE ELIGIBILITY FOR RETIREMENT & STATE HEALTH INSURANCE BENEFIT . 54
ESTIMATE OF FUTURE ELIGIBILITY FOR RETIREMENT BY AGENCY AS OF JULY 1, 2019 ...................................... 55
ESTIMATE OF FUTURE ELIGIBILITY FOR RETIREMENT BY AGENCY AS OF JULY 1, 2021 ...................................... 56
EXECUTIVE BRANCH - GROUP 2 EMPLOYEES .......................................................................................................................................... 57
ESTIMATE OF FUTURE ELIGIBILITY FOR RETIREMENT & STATE HEALTH INSURANCE BENEFIT .......................... 57
ESTIMATE OF CURRENT ELIGIBILITY FOR RETIREMENT AS OF JULY 1, 2019 ...................................................... 58
ESTIMATE OF FUTURE ELIGIBILITY FOR RETIREMENT AS OF JULY 1, 2021 ......................................................... 58
DIVISION OF PERSONNEL WORK ACTIVITIES .............................................................................................................. 59
RECRUITMENT AND CERTIFICATION SECTION......................................................................................................................................... 60
CLASSIFICATION SECTION .......................................................................................................................................................................... 66
CENTRAL HUMAN RESOURCE PROCESSING UNIT .................................................................................................................................. 81
BUREAU OF EMPLOYEE RELATIONS .......................................................................................................................................................... 83
BUREAU OF EDUCATION AND TRAINING ................................................................................................................................................... 90

7
GENERAL SUMMARY
Fiscal Year 2019
Authority
RSA Chapter 21-I: 42-44, RSA Chapter 21-I: 54-57 Federal Merit System Standards
Mission
Establish and promote best practices in human resources through training and operational efficiency making the State of New Hampshire an employer of choice.
Location
State House Annex 28 School Street Concord, NH 03301 (Wheelchair accessible entrance - School Street)
Staff Composition
19 Full-time classified employees
7 Part-time employees 2 Unclassified employees
Fiscal Year Appropriation
$2,426,905
Personnel Appeals Board
RSA 21-I:45 authorizes the Governor and Executive Council to appoint three members and two alternates to serve three (3) year terms on the New Hampshire Personnel Appeals Board. The Commissioners serving on the Board during Fiscal Year 2019 David Goldstein, Christopher Nicolopoulos, Marilee Nihan, Norman Patenaude, and Charla Stevens.

8
DIVISION OF PERSONNEL OVERVIEW
The Division of Personnel was created in 1989 to manage a centralized State system of personnel administration. As such, the Division is tasked with establishing and enforcing appropriate methods of recruitment, appointment, compensation, promotion, transfer, removal, layoff, evaluation, and discipline of state employees; preparing and overseeing the State classification system and allocating all classified positions to an appropriate classification title based on job duties and level of responsibility; administering all collective bargaining agreements with classified employees; and providing training programs for state agencies. The Division also conducts investigations of complaints of harassment or misconduct, sets statewide human resources policy, and supports the Personnel Appeals Board. In Fiscal Year 2019, the Division of Personnel kicked off its One Workforce initiative, a multi-year effort to review, streamline and modernize all aspects of the NH State Government’s personnel management systems and procedures. Phase I of One Workforce includes three strategic projects: 1) A comprehensive review of the State’s Classification Plan to evaluate current titles and
procedures for modifying/reclassifying positions with the goal of simplifying the system so it is more flexible and easier to navigate;
2) Revamping procedures for posting positions, receiving and reviewing applications, and
hiring in NH FIRST to improve the functionality and move to fully electronic processing; and
3) Developing a state-level orientation for new hires (Day One Orientation) to provide a
positive, consistent, and comprehensive on-boarding experience and ensure that all-important information is covered.
In performance of these duties, the Division of Personnel serves a valuable function to maintain a fair, equitable, and comprehensive system of personnel administration for the State and supports the success of each agency and each employee.

9
DIVISION OF PERSONNEL ORGANIZATIONAL STRUCTURE
DIRECTOR The Director of the Division of Personnel oversees all activities conducted by the Division with the assistance of a Deputy Director, a Manager of Employee Relations, a Training and Education Officer, and a Senior Human Resources Technician. In addition, an investigator, a professional development administrator, and an administrator for the Personnel Appeals Board report directly to the Director. BUREAU OF HUMAN RESOURCE ADMINISTRATION The Bureau of Human Resource Administration oversees all aspects of employee and position management and is comprised of three units:
(1) Recruitment and Certification
This Unit develops and implements statewide recruitment initiatives and certification procedures, monitors internal and external job recruitment activities of state agencies, maintains the state recruitment webpage, and manages the online application system for internal and external applicants. This unit also provides career-counseling services to employees and applicants and coordinates the State’s participation and compliance with the Uniformed Services Employment and Reemployment Rights Act (USERRA) and the U.S. Army Partnership for Youth Success (PaYS).
(2) Central HR Processing
This Unit establishes and oversees all personnel records management procedures and audits all personnel actions including hiring, promotions, demotions, transfers, increments, leaves of absence, terminations, retirements, and date adjustments, ensuring that all employee data is correct for the administration of payroll and benefits. This section also administers State examination programs, provides training and testing for changes and upgrades of the State’s human resource management system (NH FIRST), and processes all retroactive corrections affecting employee pay and/or benefits.
(3) Classification
This Unit develops and administers the State Classification Plan, including assigning all classified positions to an appropriate job classification title, which specifies the applicable salary grade, duties and qualification requirements. This Unit also evaluates all requests for reclassification of positions and reallocation of duties, requirements and/or salary of classification titles; and works with State agencies to conduct organizational analyses to realign staffing with agency business needs. This Unit also oversees all position management operations, including setting procedures and auditing for all position modifications, including establishment and abolishment of all types of positions.

10
BUREAU OF EMPLOYEE RELATIONS The Bureau of Employee Relations negotiates and administers all collective bargaining and sub-unit agreements with classified employees. This Bureau represents the State in collective bargaining negotiations and, in coordination with the attorney general, in resolution of all grievance actions related to the collective bargaining agreements. This Bureau also promotes communications between management and employees and seeks to resolve employee and agency concerns prior to formal proceedings. BUREAU OF EDUCATION AND TRAINING The Bureau of Education and Training provides quality education and training services to enhance the skills, knowledge, and abilities of State and municipal government employees who provide services to the citizens of New Hampshire. Key among these are the Certified Public Manager and Certified Public Supervisor programs. The Bureau coordinates full- and part-time instructors and contract instructors to provide a comprehensive curriculum, including an expanding number of on-line training courses.

11
EMPLOYEE SUGGESTION AND EXTRAORDINARY SERVICE AWARD PROGRAM
Senate Bill 52 (Laws 2005, Chapter 258) became effective on September 14, 2005. This law reorganized the “Employee Incentive and Reward Program” of RSA 99-E and established a fund of $10,000 in the Governor’s Office for implementation of the program. Drafted by members of the State Committee, the new law revitalized and streamlined the program for providing monetary and non-monetary recognition to classified executive branch employees who have performed extraordinary services or provided original suggestions of substantial value to the State. The new RSA 99-E integrates each Department into the process of reviewing employee suggestions and services. Chapter 99-E requires that each Department establish an award evaluation committee consisting of three (3) employees appointed by the agency. The agency committee completes the initial review of suggestions and services submitted for award. They are forwarded to the Director of Personnel who shares them with the State Committee, which then conducts its own review and makes award recommendations to the Governor and Executive Council. During State Fiscal Year 2019, six employees received monetary recognition.
Monetary Award Recipients Edward Sargent, Adjutant General Department - $1,000 Award The Adjutant General’s Department sought recognition for Edward Sargent for his savings in successfully planning and coordinating with the National Guard Bureau to secure unprecedented quantities of construction and repair projects for New Hampshire. The NH Army National Guard was selected for FY 2023 Future Years Defense Program for a $17 Million Readiness Center in Littleton, NH. This program would not have been possible at the National Guard Bureau without Mr. Sargent’s exceptional programming and sophisticated analysis of regulatory documentation, life cycle costing and economic analysis of military requirements. Mr. Sargent ensured the Engineer Automation Markup and other Army Data bases were properly maintained to ensure accurate requirements were calculated. Over the course of a decade, Mr. Sargent has been responsible for bringing in over $100 Million in Military Construction to the State of New Hampshire. Federal programmatic guidance and scoring criteria has a goal that each state obtain one military construction funding every five years. However, Mr. Sargent provided such exceptional program documentation, justification, and analysis that throughout the past decade, he has successfully obtained five major military construction dollars in a 10-year period as well as several minor military construction projects for the NH Army National Guard and the Adjutant General’s Department. This far exceeds the expected pace as well as the pace of our peer states. Mr. Sargent’s intelligence in all aspects of planning, engineering, and construction matters is exquisite and this excellence is seen most clearly in his results. Without his expertise and diligence, our service members would continue to remain in inadequate, outdated facilities that do not support their mission and impair their ability to respond. On Wednesday, November 14 the State Committee, with the Governor and Council’s assistance presented, a certificate of recognition and a check for $1,000 to Edward Sargent for providing service beyond his work performance to the State of New Hampshire.

12
Paul Connolly, Jarod Guay, Jedediah Jackson, Joshua Mann and Tim Martineau, Department of Safety - $300 Award each The Department of Safety sought monetary recognition to Paul Connolly, Jarod Guay, Jedediah Jackson, Joshua Mann and Tim Martineau for successfully collaborating to improve the Department of Safety's radio system. The Division of Emergency Services and Communications (DESC) responsibility is to maintain the integrity of the State Police radio network DESC utilizes network monitoring software. Over time, it became apparent that the existing monitoring system, which cost $78,843 per year to operate, was inadequate and not supportable going forward. In February 2018, technical staff from both the DESC Radio Maintenance section and the DESC Technical Support Section collaborated to find a solution. They tested several possible replacements, shared network infrastructure, and persisted in their efforts until an acceptable solution was identified and implemented. This new solution not only provides better monitoring, and is simpler and user friendly, its cost is only $245 a year, which has resulted in a 99% decrease in annual cost. These two technically minded groups found an effective solution that not only provides higher quality radio system monitoring, but also saved the State approximately $678,000 in up-front costs and $78,000 per year in annual maintenance. In addition, this effort inspired better collaboration between the two teams. On Wednesday, January 23, 2019, the State Suggestion and Incentive Awards Committee, with the Governor and Council's assistance, presented each of these individuals with a certificate and check for $300 for their extraordinary service in the interest of the state.

13
EXECUTIVE BRANCH AT A GLANCE

14
EMPLOYEES BY CATEGORY Fiscal Year 2019
Category* Full-Time
Full-Time Temporary
Full-Time Seasonal
Part-Time Regular
Part-Time Seasonal
Per Diem Part-Time
Classified 9,020 161 0 2,266 302 16
Non-Classified 33 1 0 155 0 603
Unclassified 323 0 0 10 0 1
Total 9,376 162 0 2,431 302 620
* Includes employees on extended leave as well as active status; excludes employees expected to work less than 6 months.
* 6 classified, 7 unclassified, and 0 non-classified employees did not meet any group criteria and are excluded from this report.
Report Generated 6/30/2019 by Employee Matrix Version V6.4
POSITIONS BY CATEGORY Fiscal Year 2019
Category* Full-Time
Full-Time Temporary
Full-Time Seasonal
Part-Time Regular
Part-Time Seasonal
Per Diem Part-Time
Classified 10,164 287 1,134 4,438 1,247 38
Non-Classified 38 N/A N/A 148 N/A 987
Unclassified 361 N/A N/A 9 N/A 3
Total 10,563 287 1,134 4,595 1,247 1,028
* Includes both filled and vacant positions expected to last longer than 6 months. * Report does not contain 16 positions found in error.
Report Generated: 9/20/2019 for data as of 6/30/2019 by Position Matrix Version V6.2

15
DEMOGRAPHICS
New Hampshire State Employees
Fiscal Year 2019
State Government Employees Executive Branch
Class Type Number of Positions**
Classified 10,451 Unclassified 361
TOTAL POSITIONS: 10,812
** Includes only full-time permanent
and temporary positions lasting more than 6 months
The Classified Full-Time State Workforce* is made up of…
52% Female 48% Male
4% Minority 96% White (not of
Hispanic background)
The Average Full-Time Classified Employee*…
Is 47 years old Has 11 years of service Earns $57,238
Classified State Employees
that are …
Full-Time* …………………..9,181 Part-Time ……………..…….2,584
Classified Full-Time Employees* work in…
Belknap County………...….. 6% Carroll County……….……... 2% Cheshire County………..….. 2% Coos County………..……… 4% Grafton County……..……… 4% Hillsborough County..……. 7% Merrimack County……..….. 67% Rockingham County………. 5% Strafford County…………… 2% Sullivan County……………. 1%
*Full-time employees includes full-time permanent, full-time temporary and full-time seasonal employees working greater than 6 months.

16
WORKFORCE CHARACTERISTICS

17
Active
Active
Active
Leave
Leave
Leave
DETAILED BREAKDOWN OF STATE OF NEW HAMPSHIRE EMPLOYEES Executive Branch
All Employees Report Run Date*: 07/02/2019
Ca
teg
ory
Full-Time Employees
Full-Time Temporary Employees
Full-Time Seasonal Employees
Part-Time Regular Employees Working >= 30
hours/week but < FT
Part-Time Seasonal Employees Working >= 30
hours/week but < FT
Part-Time Regular Employees Working
< 30 hours/week
Part-Time Seasonal Employees Working
< 30 hours/week
Per Diem Part-Time Employees
EXCEPTIONS Employees that do not fit into
defined categories Duration
>= 6 mo Duration < 6 mo
Duration >= 6 mo
Duration < 6 mo
Duration >= 6 mo
Duration < 6 mo
Duration >= 6 mo
Duration < 6 mo
Cla
ssif
ied
8,819
201
159
6
0
491
12
40
0
0
2,252
302
16
6
2
0
0
0
0
2
0
0
Un
cla
ssif
ied
323
0
N/A
N/A
N/A
N/A
0
N/A
N/A
N/A
10
N/A
1
7
0
0
0
No
n-c
lass
ifie
d
33
1
0
N/A
N/A
0
N/A
N/A
N/A
155
N/A
603
0
0
0
0
0
See "Employee Categories Matrix" V 6 . 4 at http://sunspot.nh.gov/hr/CentralHRProcessing.aspx?tab=EmplTransProcessing for rules and exclusions applied.
* Only includes data up to the end of the prior pay period.

18
EMPLOYEES BY GENDER AND EEO CATEGORY
Fiscal Year 2019
EEO Category* Total Percentage
Admin Support 496 6% Official Administrator 828 9% Para-professionals 1,300 14% Professional 3,237 35% Protective Service 923 10% Service and Maintenance 1,287 14% Skilled Craft 267 3% Technician 843 9% Total 9,181
* Includes classified full-time permanent, full-time temporary and seasonal full-time employees working more than 6 months as well as employees on extended leave. * Percentage of minority employees included in this report is 4% * 6 classified employees did not meet any group criteria and are excluded from this report.
Report Generated: 6/30/2019 by Employee Matrix Version V6.4
0 500 1000 1500 2000 2500 3000 3500
Admin Support
Official Administrator
Para-professionals
Professional
Protective Service
Service and Maint
Skilled Craft
Technician
441
457
1,000
2,201
210
264
24
214
55
371
300
1,036
713
1,023
243
629
Female Male

19
EMPLOYEES BY GENERATION Fiscal Year 2019
Total Number of Employees* = 9,181
* Includes classified full-time permanent, full-time temporary and seasonal full-time employees working more than 6 months as well as employees on extended leave. * 6 classified employees did not meet any group criteria and are excluded from this report
Report Generated: 6/30/2019 by Employee Matrix Version V6.4
166
1410
1272 1291
231137
14401374
1602
258
0
200
400
600
800
1000
1200
1400
1600
1800
Generation Z Generation Y Generation X Boomers Early Boomers
Male Female
*Generation Z = Born 1995-2012 *Generation Y = Born 1977-1994 *Generation X = Born 1966-1976 *Boomers = Born 1955-1965 *Early Boomers = Born < 1955

20
EMPLOYEES BY AGE Fiscal Year 2019
Total Number of Employees* = 9,181 Average Employee Age = 46.9
Report Generated 6/30/2019 by Employee Matrix Version V6.4
0
200
400
600
800
1000
1200
1400
1600
15-19 Years20-24 Years
25-29 Years30-34 Years
35-39 Years40-44 Years
45-49 Years50-54 Years
55-59 Years60-64 Years
65+ Years
8
246
675
823
952 950
1,218
1,388
1,504
1,015
402
Female Male
* Includes classified full-time permanent, full-time temporary and seasonal full-time employees working more than 6 months as well as employees on extended leave. * 6 classified employees did not meet any group criteria and are excluded from this report.

21
EMPLOYEES BY YEARS OF SERVICE Fiscal Year 2019
Total Number of Employees* = 9,181
Average Years of Service = 11.01
* Includes classified full-time permanent, full-time temporary and seasonal full-time employees working more than 6 months as well as employees on extended leave. * 6 classified employees did not meet any group criteria and are excluded from this report.
Report Generated 6/30/2019 by Employee Matrix Version V6.4
EMPLOYEES BY AGE AND LABOR GRADE Fiscal Year 2019
Age Labor Grade*
Total <=20 21-26 27+ Unclassified
<40 1,684 788 232 60 2,764
40-59 2,407 1,622 1,031 193 5,253
60+ 718 400 299 70 1,487
Total 4,809 2,810 1,562 323 9,504 * Includes classified full-time permanent, full-time temporary and seasonal full-time employees working more than 6
months, and full-time unclassified employees, as well as employees on extended leave. * 6 classified and 7 unclassified employees did not meet any group criteria and are excluded from this report
Report Generated 6/30/2019 by Employee Matrix Version V6.4
0
200
400
600
800
1000
1200
1400
1600
1800
<2 Years 2-4 Years 5-9 Years 10-14 Years 15-19 Years 20-24 Years 25-29 Years 30+ Years
774 713 646743
637
371225 261
877888
680
860
663
353
226264
1,6511,601
1,326
1,603
1,300
724
451525
Female Male

22
HILLSBOROUGH 635
BELKNAP 543
MERRIMACK 6,136 STRAFFORD
229
ROCKINGHAM 437
COOS 395
CHESHIRE 195
EMPLOYEES BY COUNTY
Fiscal Year 2019
Total Number of Employees* = 9,181
GRAFTON 363
CARROLL
148
Report Generated 6/30/2019 by Employee Matrix Version V6.4
SULLIVAN
100
*Includes classified full-time permanent, full-time temporary and seasonal full-time employees working more than 6 months as well as employees on extended leave. *6 classified employees did not meet any group criteria and are excluded from this report.

23
FULL-TIME EMPLOYEES BY AGENCY Five Year History
AGENCY* 2015 2016 2017 2018
2019
ADJUTANT GENERAL'S DEPT 110 110 121 115 123
ADMINISTRATIVE SERVICES DEPT 265 267 262 281 281
AGRICULTURE, MARKETS & FOOD DEPT 27 28 29 29 29
BANKING DEPT 40 38 40 39 38
BUS & ECON AFFAIRS DEPT 0 0 0 53 58
CORRECTIONS DEPT 781 758 752 766 781
CULTURAL RESOURCES DEPT 41 39 38 0 0
DEVELOPMENT DISABILITIES CNCL 2 2 2 1 3
EDUCATION DEPT 232 242 241 224 224
EMPLOYMENT SECURITY DEPT 265 246 231 225 216
ENVIRONMENTAL SERVICES DEPT 386 385 396 412 413
EXECUTIVE DEPT 11 13 12 15 15
FISH AND GAME DEPT 167 171 171 171 173
HHS: ADMIN ATTACHED BOARDS 32 0 0 0 0
HHS: BEHAVIORAL HEALTH DIV 20 40 37 33 31
HHS: COMM-BASED CARE SVCS DIV 19 19 21 23 18
HHS: COMMISSIONER'S OFFICE 318 331 327 339 336
HHS: DEVELOPMENTAL SVCS DIV 47 47 47 47 48
HHS: ELDERLY & ADULT SVCS DIV 83 79 76 79 77
HHS: GLENCLIFF HOME 161 157 152 152 145
HHS: HUMAN SERVICES DIV 678 679 702 717 723
HHS: JUVENILE JUSTICE SERV 1 1 1 0 0
HHS: MEDICAID & BUS POLICY OFC 41 34 37 43 45
HHS: NH HOSPITAL 530 515 510 506 520
HHS: PUBLIC HEALTH DIV 217 217 227 231 243
HHS: TRANSITIONAL ASSIST DIV 419 405 412 402 394
HIGHWAY SAFETY AGCY OF 5 0 0 0 0
HUMAN RIGHTS COMMISSION 7 6 6 7 7
INFORMATION TECHNOLOGY DEPT 295 290 315 316 311
INSURANCE DEPT 57 61 58 62 54
JOINT BOARD OF LICENSUR - CERT 15 0 0 0 0
JUDICIAL COUNCIL 2 2 1 2 2
JUSTICE DEPT 47 53 59 58 58
LABOR DEPT 79 75 69 74 69
LIQUOR COMMISSION 301 302 315 324 320
LOTTERY COMMISSION 40 56 55 56 58
NATURAL & CULT RESOURCES DEPT 198 214 212 203 197
PEASE DEVELOPMENT AUTHORITY 5 5 5 5 5
POLICE STDS & TRAINING COUNCIL 18 16 19 20 19
PROF LICENSURE & CERT OFFICE 0 58 59 60 62
PUBLIC EMPLOYEE LABOR REL BRD 4 4 4 4 4

24
FULL-TIME EMPLOYEES BY AGENCY (Continued)
Five Year History
AGENCY* 2015 2016 2017 2018 2019
PUBLIC UTILITIES COMMISSION 64 67 65 65 66
RACING CHARITABLE GAMING COMM 15 0 0 0 0
REAL ESTATE COMMISSION 5 0 0 0 0
REVENUE ADMINISTRATION DEPT 101 108 106 114 111
SAFETY DEPT 1,002 1,009 1,001 1,027 1048
STATE DEPT 57 55 53 56 54
TAX AND LAND APPEALS BOARD 4 4 4 3 4
TRANSPORTATION DEPT 1,499 1,531 1,494 1,506 1,476
TREASURY DEPT 14 16 16 13 16
VETERANS HOME 322 328 321 315 297
VETERANS SERVICES OFFICE 6 5 7 7 9
Total 9,055 9,088 9,088 9,199 9,181
*Includes classified full-time permanent, full-time temporary and seasonal full-time employees working more than 6 months including employees on extended leave, as of June 30th each year. *This report reflects data in NH FIRST on the date the report is generated; historic data will change from year to year due to transactions processed after June 30th. *6 classified employees did not meet any group criteria and are excluded from this report.
Report Generated 6/30/2019 by Employee Matrix Version V6.4

25
EMPLOYEES BY TYPE AND AGENCY Fiscal Year 2019
AGENCY* Full-Time Classified
Full-Time Unclassified
and Non-Classified
Full-Time Seasonal
Part-Time Regular
Part-Time Seasonal
Part-Time Per
Diem ADJUTANT GENERAL'S DEPT 123 2 0 5 0 0 ADMINISTRATIVE SERVICES DEPT 281 11 0 135 0 5
AGRICULT, MARKETS & FOOD DEPT 29 4 0 9 0 1 BANKING DEPT 38 3 0 0 0 0 BOXING & WRESTLING COMMISSION 0 0 0 6 0 2 BUS & ECON AFFAIRS DEPT 58 2 0 31 12 0 CORRECTIONS DEPT 781 11 0 50 0 8 DEVELOPMENT DISABILITIES CNCL 3 0 0 5 0 0
EDUCATION DEPT 224 5 0 6 1 0 EMPLOYMENT SECURITY DEPT 216 7 0 40 0 2 ENVIRONMENTAL SERVICES DEPT 413 6 0 65 0 2 EXECUTIVE COUNCIL 0 1 0 5 0 0 EXECUTIVE DEPT 15 34 0 2 1 0 FISH AND GAME DEPT 173 1 0 24 30 0
HHS: BEHAVIORAL HEALTH DIV 31 3 0 0 0 0 HHS: COMM-BASED CARE SVCS DIV 18 1 0 0 0 0 HHS: COMMISSIONER'S OFFICE 336 39 0 35 0 2 HHS: DEVELOPMENTAL SVCS DIV 48 2 0 6 0 0 HHS: ELDERLY & ADULT SVCS DIV 77 2 0 1 0 0 HHS: GLENCLIFF HOME 145 1 0 17 0 0
HHS: HUMAN SERVICES DIV 723 5 0 20 0 4 HHS: MEDICAID & BUS POLICY OFC 45 7 0 4 0 0 HHS: NH HOSPITAL 520 11 0 134 0 4 HHS: PUBLIC HEALTH DIV 243 3 0 16 0 0 HHS: TRANSITIONAL ASSIST DIV 394 5 0 12 0 1 HUMAN RIGHTS COMMISSION 7 0 0 2 0 0
INFORMATION TECHNOLOGY DEPT 311 11 0 12 0 0 INSURANCE DEPT 54 13 0 0 0 0 JUDICIAL COUNCIL 2 1 0 3 0 0 JUSTICE DEPT 58 71 0 12 0 0 LABOR DEPT 69 2 0 6 0 30 LIQUOR COMMISSION 320 5 0 1,000 0 0
LOTTERY COMMISSION 58 1 0 11 0 1 NATURAL & CULT RESOURCES DEPT 197 7 0 151 249 0 PEASE DEVELOPMENT AUTHORITY 5 0 0 4 0 0 POLICE STDS & TRAINING COUNCIL 19 1 0 5 0 0 PROF LICENSURE & CERT OFFICE 62 1 0 46 0 173 PUBLIC EMPLOYEE LABOR REL BRD 4 0 0 8 0 2
PUBLIC UTILITIES COMMISSION 66 8 0 3 0 0 REVENUE ADMINISTRATION DEPT 111 29 0 9 0 1 SAFETY DEPT 1,048 11 0 189 9 376 STATE DEPT 54 12 0 75 0 1

26
EMPLOYEES BY TYPE AND AGENCY (Continued) Fiscal Year 2019
AGENCY* Full-Time Classified
Full-Time Unclassified
and Non-Classified
Full-Time Seasonal
Part-Time
Regular
Part-Time Seasonal
Part-Time Per
Diem TAX AND LAND APPEALS BOARD 4 3 0 2 0 0 TRANSPORTATION DEPT 1,476 8 0 209 0 0
TREASURY DEPT 16 5 0 0 0 0
VETERANS HOME 297 1 0 56 0 5
VETERANS SERVICES OFFICE 9 1 0 0 0 0
TOTAL 9,181 357 0 2,431 302 620
* Excludes employees working less than 6 months. * 6 classified employees, 7 unclassified employees, and 0 non-classified employees did not meet any group
criteria and are excluded from this report.
Report Generated: 6/30/2019 by Employee Matrix Version V6.4

27
EMPLOYEE STATISTICS BY AGENCY WITH 10 OR MORE EMPLOYEES Fiscal Year 2019
AGENCY* Full-Time Employees
Avg. Age
Avg. Salary
Avg. Yrs Service
% Female
% Union Rep
ADJUTANT GENERAL'S DEPT 125 47.3 $48,273 8.7 18% 94% ADMINISTRATIVE SERVICES
292 50.7 $60,240 11.2 41% 81%
AGRICULT, MARKETS & FOOD
33 48.1 $56,082 11.6 58% 94% BANKING DEPT 41 45.5 $70,350 9.7 63% 95% BUS & ECON AFFAIRS DEPT 60 48.4 $55,651 8.5 60% 98% CORRECTIONS DEPT 792 44.3 $58,103 10.5 34% 97% EDUCATION DEPT 229 49.4 $58,337 10.4 80% 97% EMPLOYMENT SECURITY DEPT 223 53.3 $53,101 13.2 70% 96% ENVIRONMENTAL SERVICES
419 49.0 $67,580 13.3 44% 98%
EXECUTIVE DEPT 49 44.5 $56,656 3.7 55% 53% FISH AND GAME DEPT 174 45.2 $56,917 14.3 33% 97% HHS: BEHAVIORAL HEALTH DIV 34 48.6 $68,703 10.2 85% 100% HHS: COMM-BASED CARE SVCS
19 54.6 $69,295 15.5 58% 100%
HHS: COMMISSIONER'S OFFICE 375 51.4 $65,410 13.1 77% 92% HHS: DEVELOPMENTAL SVCS
50 52.1 $59,294 12.3 84% 100%
HHS: ELDERLY & ADULT SVCS
79 51.0 $62,241 11.7 84% 100% HHS: GLENCLIFF HOME 146 46.7 $46,484 9.6 73% 99% HHS: HUMAN SERVICES DIV 728 44.1 $55,952 11.0 75% 99% HHS: MEDICAID & BUS POLICY
52 51.3 $79,707 14.4 79% 100%
HHS: NH HOSPITAL 531 45.4 $55,399 9.8 64% 98% HHS: PUBLIC HEALTH DIV 246 47.4 $62,894 9.9 77% 100% HHS: TRANSITIONAL ASSIST DIV 399 43.2 $46,314 8.0 90% 100% INFORMATION TECHNOLOGY
322 52.0 $77,001 12.4 37% 98%
INSURANCE DEPT 67 53.9 $81,853 11.8 64% 97% JUSTICE DEPT 129 47.0 $71,037 8.5 61% 55% LABOR DEPT 71 51.6 $52,711 11.9 76% 94% LIQUOR COMMISSION 325 44.9 $47,669 7.8 54% 96% LOTTERY COMMISSION 59 45.7 $52,973 10.0 61% 93% NATURAL & CULT RESOURCES
204 48.3 $54,182 12.3 43% 98%
POLICE STDS & TRAINING
20 52.9 $64,077 13.3 30% 5% PROF LICENSURE & CERT
63 53.4 $55,163 9.0 76% 94%
PUBLIC UTILITIES COMMISSION 74 54.7 $76,073 10.7 53% 11% REVENUE ADMINISTRATION
140 47.1 $59,253 11.5 70% 97%
SAFETY DEPT 1,059 43.9 $59,453 10.6 45% 98% STATE DEPT 66 53.0 $58,059 14.1 52% 18% TRANSPORTATION DEPT 1,484 47.5 $50,160 12.4 18% 99% TREASURY DEPT 21 53.1 $66,954 13.4 67% 86% VETERANS HOME 298 46.9 $48,435 7.8 81% 98% VETERANS SERVICES OFFICE 10 45.4 $45,464 2.6 50% 10% OVERALL AVERAGE 9,538 47.1 $57,238 11.0 52% 95%
*Includes classified, unclassified, and non-classified full-time permanent, full-time temporary and seasonal full-time employees working more than 6 months including employees on extended leave. Salary includes base pay only. Overtime and longevity pay are excluded. * 6 classified employees, 7 unclassified employees, and 0 non-classified employees did not meet any group criteria and are excluded from this report
Report Generated: 6/30/2019 by Employee Matrix Version V6.4

28
ANNUAL AND SICK LEAVE USAGE BY AGENCY Fiscal Year 2019
AGENCY* (Agencies with 10 or more Employees)
Total Annual (Hours)
# Employees
Using Annual Leave
Average Annual Leave
Used Per Employee
(Hours)
Total Sick Leave**
(Hours)
# Employees Using Sick
Leave**
Average Sick Leave Used Per Employee
(Hours) ADJUTANT GENERA’S DEPT 15,731 137 115 10,335 137 75 ADMINISTRATIVE SERVICES
32,415 289 112 21,691 289 75
AGRICULT, MARKETS & FOOD
3,701 30 123 2,131 30 71 BANKING DEPT 4,469 41 109 5,649 41 138 BUS & ECON AFFAIRS DEPT 5,902 59 100 3,452 59 59 CORRECTIONS DEPT 98,140 827 119 78,449 827 95 EDUCATION DEPT 27,089 245 111 20,950 245 86 EMPLOYMENT SECURITY DEPT 26,881 229 117 22,284 229 97 ENVIRONMENTAL SERVICES
51,651 434 119 34,728 434 80
EXECUTIVE DEPT 2,400 52 46 1,687 51 33 FISH AND GAME DEPT 22,483 178 126 11,222 178 63 HHS: BEHAVIORAL HEALTH DIV 3,266 31 105 2,336 31 75 HHS: COMM-BASED CARE SVCS
2,538 19 134 1,856 19 98
HHS: COMMISSIONER'S OFFICE 38,694 347 112 31,077 347 90 HHS: DEVELOPMENTAL SVCS DIV 6,458 56 115 3,983 56 71 HHS: ELDERLY & ADULT SVCS
9,975 83 120 7,873 84 94
HHS: GLENCLIFF HOME 19,522 167 117 17,111 167 102 HHS: HUMAN SERVICES DIV 84,452 760 111 67,153 764 88 HHS: MEDICAID & BUS POLICY
5,680 45 126 3,659 45 81
HHS: NH HOSPITAL 64,264 576 112 50,861 576 88 HHS: PUBLIC HEALTH DIV 27,259 254 107 20,530 255 81 HHS: TRANSITIONAL ASSIST DIV 42,976 432 99 37,895 433 88 INFORMATION TECHNOLOGY
37,446 333 112 27,322 333 82
INSURANCE DEPT 7,345 65 113 5,837 65 90 JUSTICE DEPT 7,117 84 85 4,993 84 59 LABOR DEPT 8,361 74 113 7,205 74 97 LIQUOR COMMISSION 34,742 346 100 26,147 347 75 LOTTERY COMMISSION 5,737 62 93 4,039 62 65 NATURAL & CULT RESOURCES
22,822 214 107 13,411 214 63
POLICE STDS & TRAINING
2,373 18 132 1,076 18 60 PROF LICENSURE & CERT
6,547 69 95 5,859 69 85
PUBLIC UTILITIES COMMISSION 7,026 69 102 4,508 69 65 REVENUE ADMINISTRATION
13,057 120 109 10,710 123 87
SAFETY DEPT 132,217 1,102 120 89,925 1,102 82 STATE DEPT 8,161 69 118 6,042 69 88 TRANSPORTATION DEPT 188,679 1,584 119 139,496 1,584 88 TREASURY DEPT 2,167 16 135 1,664 16 104 VETERANS HOME 36,854 354 104 30,877 354 87 VETERANS SERVICES OFFICE 805 10 80 702 10 70
* Includes leave used by all types of eligible employees employed at any point during the Fiscal Year. ** Excludes sick dependent and bereavement leave
Report Generated: 10/10/2019 for data as of 6/30/2019 by Employee Matrix Version V6.4

29
COMPENSATION

30
AVERAGE SALARY BY AGENCY Five Year History
AGENCY* 2015 2016 2017 2018 2019 ADJUTANT GENERAL'S DEPT $ 45,000 $ 46,472 $ 46,246 $ 46,265 $ 46,136 ADMINISTRATIVE SERVICES DEPT $ 50,805 $ 53,103 $ 55,211 $ 56,199 $ 57,765 AGRICULT, MARKETS & FOOD DEPT $ 47,262 $ 48,022 $ 48,971 $ 48,803 $ 50,211 BANKING DEPT $ 58,551 $ 61,924 $ 60,521 $ 64,184 $ 67,298 BUS & ECON AFFAIRS DEPT - - - $ 51,858 $ 53,580 CORRECTIONS DEPT $ 51,646 $ 53,389 $ 54,516 $ 56,989 $ 55,902 CULTURAL RESOURCES DEPT $ 50,133 $ 49,445 $ 49,451 - - DEVELOPMENT DISABILITIES CNCL $ 69,401 $ 67,187 $ 70,132 $ 78,000 $ 54,984 EDUCATION DEPT $ 51,644 $ 52,996 $ 53,708 $ 55,456 $ 57,328 EMPLOYMENT SECURITY DEPT $ 46,438 $ 48,008 $ 49,656 $ 50,399 $ 51,438 ENVIRONMENTAL SERVICES DEPT $ 61,617 $ 62,687 $ 64,145 $ 64,665 $ 66,669 EXECUTIVE DEPT $ 52,069 $ 52,263 $ 51,288 $ 50,474 $ 53,255 FISH AND GAME DEPT $ 51,884 $ 53,216 $ 54,387 $ 55,184 $ 56,565 HHS: ADMIN ATTACHED BOARDS $ 49,971 - - - - HHS: BEHAVIORAL HEALTH DIV $ 61,905 $ 59,776 $ 57,032 $ 59,053 $ 66,313 HHS: COMM-BASED CARE SVCS DIV $ 58,662 $ 58,609 $ 61,383 $ 64,559 $ 66,600 HHS: COMMISSIONER'S OFFICE $ 55,863 $ 56,851 $ 57,962 $ 59,222 $ 61,782 HHS: DEVELOPMENTAL SVCS DIV $ 51,058 $ 51,480 $ 53,986 $ 55,331 $ 56,201 HHS: ELDERLY & ADULT SVCS DIV $ 53,664 $ 56,595 $ 58,789 $ 59,568 $ 60,567 HHS: GLENCLIFF HOME $ 41,216 $ 41,697 $ 43,054 $ 44,946 $ 46,006 HHS: HUMAN SERVICES DIV $ 51,138 $ 51,950 $ 52,853 $ 53,851 $ 55,651 HHS: JUVENILE JUSTICE SERV $ 56,659 $ 62,878 $ 64,106 - - HHS: MEDICAID & BUS POLICY OFC $ 66,253 $ 69,590 $ 70,804 $ 72,049 $ 75,213 HHS: NH HOSPITAL $ 45,817 $ 48,505 $ 50,238 $ 52,011 $ 53,638 HHS: PUBLIC HEALTH DIV $ 55,942 $ 57,150 $ 58,346 $ 60,072 $ 62,180 HHS: TRANSITIONAL ASSIST DIV $ 40,734 $ 42,061 $ 43,254 $ 44,084 $ 45,604 HIGHWAY SAFETY AGCY OF $ 51,987 - - - - HUMAN RIGHTS COMMISSION $ 52,065 $ 55,702 $ 54,165 $ 50,697 $ 52,839 INFORMATION TECHNOLOGY DEPT $ 68,806 $ 70,357 $ 71,228 $ 73,082 $ 75,360 INSURANCE DEPT $ 64,694 $ 66,973 $ 68,813 $ 71,817 $ 76,619 JOINT BOARD OF LICENSUR - CERT $ 47,720 - - - - JUDICIAL COUNCIL $ 37,294 $ 38,961 $ 45,377 $ 44,324 $ 42,218 JUSTICE DEPT $ 46,628 $ 47,899 $ 48,373 $ 49,802 $ 51,449 LABOR DEPT $ 45,455 $ 46,696 $ 48,317 $ 48,964 $ 50,887 LIQUOR COMMISSION $ 42,368 $ 44,036 $ 44,533 $ 45,193 $ 46,497 LOTTERY COMMISSION $ 44,667 $ 49,448 $ 50,075 $ 51,150 $ 49,812 NATURAL & CULT RESOURCES DEPT $ 48,302 $ 48,998 $ 50,476 $ 50,851 $ 51,691
PEASE DEVELOPMENT AUTHORITY $ 49,280 $ 50,274 $ 50,231 $ 51,608 $ 54,063 POLICE STDS & TRAINING COUNCIL $ 57,993 $ 66,164 $ 60,042 $ 60,110 $ 58,670 PROF LICENSURE & CERT OFFICE - $ 49,463 $ 50,428 $ 52,043 $ 54,327 PUBLIC EMPLOYEE LABOR REL BRD $ 58,739 $ 60,963 $ 63,541 $ 64,506 $ 65,895 PUBLIC UTILITIES COMMISSION $ 65,167 $ 65,286 $ 67,999 $ 70,007 $ 70,422 RACING CHARITABLE GAMING COM $ 56,075 - - - -

31
AVERAGE SALARY BY AGENCY (Continued)
Five Year History
AGENCY* 2015 2016 2017 2018 2019
REAL ESTATE COMMISSION $ 36,430 - - - -
REVENUE ADMINISTRATION DEPT $ 48,435 $ 48,751 $ 50,114 $ 50,145 $ 51,186
SAFETY DEPT $ 53,873 $ 54,851 $ 56,346 $ 57,271 $ 58,340
STATE DEPT $ 45,702 $ 46,115 $ 48,104 $ 49,121 $ 49,504 TAX AND LAND APPEALS BOARD $ 62,025 $ 63,273 $ 62,658 $ 60,145 $ 70,575 TRANSPORTATION DEPT $ 44,454 $ 45,197 $ 46,777 $ 47,637 $ 49,381 TREASURY DEPT $ 47,598 $ 49,144 $ 52,288 $ 54,602 $ 55,783 VETERANS HOME $ 41,810 $ 44,398 $ 46,509 $ 47,349 $ 47,605 VETERANS SERVICES OFFICE $ 40,505 $ 42,647 $ 42,800 $ 40,365 $ 37,070
* Includes classified full-time permanent, full-time temporary and seasonal full-time employees working more than 6 months as of June 30th each year. *This report reflects data in NH FIRST on the date the report is generated; historic data will change from year to year due to transactions processed after June 30th. * 6 classified employee(s) did not meet any group criteria and are excluded from this report.
Report Generated 6/30/2019 by Employee Matrix Version V6.4.

32
AVERAGE SALARY BY YEARS OF SERVICE* Fiscal Year 2019
* Includes classified full-time permanent, full-time temporary and seasonal full-time employees working more than 6 months as well as employees on extended leave. * Excludes up to 6 classified employees that did not meet a defined category. Salary includes base pay only. Overtime and longevity pay are excluded.
Report Generated: 6/30/2019 by Employee Matrix V6.4
AVERAGE SALARY BY EEO CATEGORY* Fiscal Year 2019
* Includes classified full-time permanent, full-time temporary and seasonal full-time employees working more than 6 months as well as employees on extended leave. * Excludes up to 6 classified employees that did not meet a defined category. Salary includes base pay only. Overtime and longevity pay are excluded.
Report Generated: 6/30/2019 by Employee Matrix V6.4
$46,558 $51,342
$56,611 $60,191
$63,612 $65,831 $65,875 $66,887
$0.00
$10,000.00
$20,000.00
$30,000.00
$40,000.00
$50,000.00
$60,000.00
$70,000.00
$80,000.00
<2 Years 2-4 Years 5-9 Years 10-14 Years 15-19 Years 20-24 Years 25-29 Years 30+ Years
$37,853
$81,736
$42,306
$62,895
$58,784
$39,807
$46,237
$60,082
$0 $10,000 $20,000 $30,000 $40,000 $50,000 $60,000 $70,000 $80,000 $90,000
Admin Support
Official Administrator
Para-professionals
Professional
Protective Service
Service and Maintenance
Skilled Craft
Technician

33
DISTRIBUTION OF EMPLOYEES BY LABOR GRADE STEP* Fiscal Year 2019
Step
Number of Employees
Step 1 718
Step 2 669
Step 3 638
Step 4 638
Step 5 1,271
Step 6 1,003
Step 7 862
Step 8 1,493
Step 9 1,565
Total 8,857
Report Generated: 6/30/2019 by Employee Matrix V6.4
3.5%7.8%7.3%6.9%
6.9%13.8%
10.9%9.4%
16.3%
17.0%
EnhancementsStep 1Step 2Step 3Step 4Step 5Step 6Step 7Step 8Step 9
* Includes classified full-time permanent, full-time temporary and seasonal full-time employees working more than 6 months as well as employees on extended leave. * Excludes 6 classified employees that did not meet a defined category. Total does not include 324 employees with salary enhancements.

34
COST OF LONGEVITY* Fiscal Year 2019
*Includes classified, unclassified, non-classified, full-time permanent, full-time temporary and full-time seasonal employees working more than 6 months as of December 31, 2018. Employees receive $300 a year bonus pay in mid-November for 10-14 years of service and an additional $300 a year for each 5 years of service beyond 10 years. 51% of employees received a longevity payment in Fiscal Year 2019.
Report Generated: 6/30/2019 for data as of 12/31/2019 by Employee Matrix Version V6.4
$517,500
$833,400 $807,300
$644,400 $607,500
$271,800
$138,600
$26,400 $2,700
$0
$100,000
$200,000
$300,000
$400,000
$500,000
$600,000
$700,000
$800,000
$900,000
$300 $600 $900 1,200 $1,500 $1,800 $2,100 $2,400 $2,700
Tot
al C
ost
Amount of Payment Received

35
POSITION STATISTICS

36
BREAKDOWN OF STATE OF NH POSITIONS BY TYPE AND BRANCH OF GOVERNMENT Report Run Date: 09/20/2019 for Data as of 06/30/2019
* See "Position Categories Matrix" V6.2 at: http://sunspot.nh.gov/hr/documents/Classification/Position_Categories_Matrix.pdf
* Only includes data up to the end of the prior pay period.
* This report does not contain 16 positions found in error.

37
FILLED AND TOTAL FULL-TIME PERMANENT CLASSIFIED POSITIONS*
Five-Year History
* Includes full-time permanent classified positions and full-time permanent classified employees * This report reflects data in NHFIRST on the date the report is generated; historic data will change from year to year due to transactions processed after June 30th * 6 classified employees did not meet any group criteria and are excluded from this report. * This report does not contain 16 positions found in error.
Report Generated: 6/30/2019 Employee Matrix Version V6.4 and 09/23/2019 for data as of 6/30/2019 by Position Matrix V6.2
10,05310,143 10,104
10,28410,164
9,057 9,043 9,0029,080 9,020
8,000
8,500
9,000
9,500
10,000
10,500
2015 2016 2017 2018 2019
Total Positions Filled Positions

38
POSITIONS BY EEO OCCUPATION GROUP
Fiscal Year 2019
Report Generated: 9/20/2019 for data as of 6/30/2019 by Position Matrix V6.2
Admin Support5%
Official Administrator9%
Para-professionals15%
Professional35%
Protective Service10%
Service and Maintenance14%
Skilled Craft3%
Technician9%
Occupational Group* Number of Positions % Vacant** Administrative Support 560 12% Officials/Administrators 914 10% Para-Professional 1,551 16% Professionals 3,665 12% Protective Services 1,063 13% Service/Maintenance 1,452 11% Skilled Craft 289 8% Technicians 957 12% Total 10,451 12% *Includes classified full-time permanent and full-time temporary positions expected to last for more than 6 months as of June 30th that have an Occupational Group associated with the position.
* This report does not contain 16 positions found in error.
**Percent Filled is calculated as: {the number of employees in EEO} divided by {the number of positions in the EEO category} as of June 30th.

39
CLASSIFIED FULL-TIME PERMANENT POSITIONS BY AGENCY Five Year History
AGENCY * 2015 2016 2017 2018 2019 ADJUTANT GENERAL'S DEPT 135 135 135 141 141 ADMINISTRATIVE SERVICES DEPT 301 310 284 296 292 AGRICULT, MARKETS & FOOD DEPT 30 32 32 34 34 BANKING DEPT 51 52 51 52 47 BUS & ECON AFFAIRS DEPT 0 0 0 65 59 CORRECTIONS DEPT 877 879 881 950 925 CULTURAL RESOURCES DEPT 54 54 53 0 0 DEVELOPMENT DISABILITIES CNCL 3 3 3 3 3 EDUCATION DEPT 280 283 284 289 289 EMPLOYMENT SECURITY DEPT 285 265 263 263 245 ENVIRONMENTAL SERVICES DEPT 467 467 468 468 470 EXECUTIVE DEPT 15 16 16 16 15 FISH AND GAME DEPT 187 188 189 189 177 HHS: ADMIN ATTACHED BOARDS 36 0 0 0 0 HHS: BEHAVIORAL HEALTH DIV 24 47 43 40 25 HHS: COMM-BASED CARE SVCS DIV 27 23 22 22 21 HHS: COMMISSIONER'S OFFICE 377 380 378 382 371 HHS: DEVELOPMENTAL SVCS DIV 53 53 54 55 53 HHS: ELDERLY & ADULT SVCS DIV 90 85 83 80 79 HHS: GLENCLIFF HOME 168 168 168 168 167 HHS: HUMAN SERVICES DIV 735 742 764 785 786 HHS: JUVENILE JUSTICE SERV 1 0 0 0 0 HHS: MEDICAID & BUS POLICY OFC 47 38 47 51 48 HHS: NH HOSPITAL 561 573 574 574 587 HHS: PUBLIC HEALTH DIV 255 252 246 247 245 HHS: TRANSITIONAL ASSIST DIV 441 473 429 428 423 HIGHWAY SAFETY AGCY OF 5 0 0 0 0 HUMAN RIGHTS COMMISSION 7 7 7 7 7 INFORMATION TECHNOLOGY DEPT 346 348 356 356 344 INSURANCE DEPT 67 70 70 70 70 JOINT BOARD OF LICENSUR - CERT 16 0 0 0 0 JUDICIAL COUNCIL 2 2 2 2 2 JUSTICE DEPT 54 55 56 58 58 LABOR DEPT 92 92 92 91 87 LIQUOR COMMISSION 296 312 314 338 338 LOTTERY COMMISSION 45 62 62 66 65 NATURAL & CULT RESOURCES DEPT 204 205 207 198 195 PEASE DEVELOPMENT AUTHORITY 6 6 6 6 6 POLICE STDS & TRAINING COUNCIL 20 20 20 20 20 PROF LICENSURE & CERT OFFICE 0 59 59 59 62 PUBLIC EMPLOYEE LABOR REL BRD 4 4 4 4 4 PUBLIC UTILITIES COMMISSION 68 68 69 71 71 RACING CHARITABLE GAMING COMM 16 0 0 0 0 REAL ESTATE COMMISSION 6 0 0 0 0 REVENUE ADMINISTRATION DEPT 123 120 120 121 120 SAFETY DEPT 1,077 1,083 1,081 1,097 1,095

40
CLASSIFIED FULL-TIME PERMANENT POSITIONS BY AGENCY Five Year History (Continued)
AGENCY* 2015 2016 2017 2018 2019 STATE DEPT 70 70 63 73 72 TAX AND LAND APPEALS BOARD 5 5 5 5 4 TRANSPORTATION DEPT 1,633 1,631 1,634 1,635 1,635 TREASURY DEPT 17 17 17 17 17 VETERANS HOME 366 381 382 383 383 VETERANS SERVICES OFFICE 7 7 7 7 7 Total: 10,052 10,142 10,100 10,282 10,164 * Includes both filled and vacant classified full-time permanent positions as of June 30th of each fiscal year. * This report reflects data in NH FIRST on the date the report is generated; historic data will change from year to year due to transactions processed after June 30th. * This report does not contain 16 positions found in error in FY19.
Report Generated: 9/20/2019 for data as of 6/30/2019 by Position Matrix Version V6.2
FULL-TIME SEASONAL POSITIONS BY AGENCY
Five Year History
AGENCY* 2015 2016 2017 2018 2019 ENVIRONMENTAL SERVICES DEPT 43 46 46 46 46
FISH AND GAME DEPT 3 3 3 4 4
NATURAL & CULT RESOURCES 726 774 807 848 879
SAFETY DEPT 0 0 32 33 33
TRANSPORTATION DEPT 1 1 1 1 172
TOTAL 773 824 889 932 1,134
* Includes classified temporary full-time seasonal positions as of June 30th of each fiscal year. * This report reflects data in NH FIRST on the date the report is generated; historic data will change from year to year due to transactions processed after June 30th. * This report does not contain 16 positions found in error in FY19.
Report Generated: 9/20/2019 for data as of 6/30/2019 by Position Matrix V6.2

41
FULL-TIME TEMPORARY POSITIONS BY AGENCY Five Year History
AGENCY* 2015 2016 2017 2018 2019
ADMINISTRATIVE SERVICES DEPT 23 11 11 11 13
AGRICULTURE, MARKETS & FOOD DEPT 2 0 0 0 0
CORRECTIONS DEPT 5 0 1 1 3
EDUCATION DEPT 12 5 7 7 10
EMPLOYMENT SECURITY DEPT 36 27 24 10 13
ENVIRONMENTAL SERVICES DEPT 5 5 6 11 11
FISH AND GAME DEPT 3 6 6 6 6
HHS: ADMIN ATTACHED BOARDS 1 0 0 0 0
HHS: BEHAVIORAL HEALTH DIV 0 1 1 1 8
HHS: COMM-BASED CARE SVCS DIV 5 0 1 1 1
HHS: COMMISSIONER'S OFFICE 4 7 7 16 15
HHS: HUMAN SERVICES DIV 4 14 14 14 14
HHS: MEDICAID & BUS POLICY OF 0 0 0 0 1
HHS: NH HOSPITAL 92 43 43 46 46
HHS: PUBLIC HEALTH DIV 8 13 23 24 35
HHS: TRANSITIONAL ASSIST DIV 39 1 27 27 40
INFORMATION TECHNOLOGY DEPT 0 1 2 2 2
JUSTICE DEPT 4 4 4 4 6
LIQUOR COMMISSION 29 24 26 2 2
LOTTERY COMMISSION 0 1 1 0 0
NATURAL & CULTURE RESOURES DEPT 38 32 28 32 47
PROF LICENSURE & CERT OFFICE 0 2 2 2 3
PUBLIC UTILITIES COMMISSIONER 0 0 0 1 1
SAFETY DEPT 1 11 13 16 15
STATE DEPT 12 3 3 3 4
TRANSPORTATION DEPT 21 26 165 154 120
VETERANS HOME 6 17 28 29 0
VETERANS SERVICES OFFICE 0 0 0 0 2
Total 350 254 443 420 418 * Includes classified temporary full-time positions as of June 30th of each fiscal year. * This report reflects data in NH FIRST on the date the report is generated; historic data will change from year to year due to transactions processed after June 30th.
* This report does not contain 16 positions found in error.
Report Generated: 9/20/2019 for data as of 6/30/2019 by Position Matrix V6.2

42
TURNOVER AND SEPARATION FROM SERVICE

43
TURNOVER Separations from Classified Service
10 Year History
* Turnover is calculated as the number of employees who left full-time state service divided by the number of positions in NH FIRST on the end date of the time period analyzed. Movement within and between state agencies is not considered turnover for the purposes of this report.
* Includes classified full-time permanent and full-time temporary positions expected to last more than 6 months and employee separations for classified full-time permanent and full-time temporary employees working more than 6 months.
Report Generated: 9/23/2019 for data as of 6/30/2019 data using Position Matrix V6.2
8% 8%
11%
8%
9%
10% 10%
9%
8%
9%
0%
2%
4%
6%
8%
10%
12%
14%
2010 2011 2012 2013 2014 2015 2016 2017 2018 2019
Tur
nove
r R
ates
44
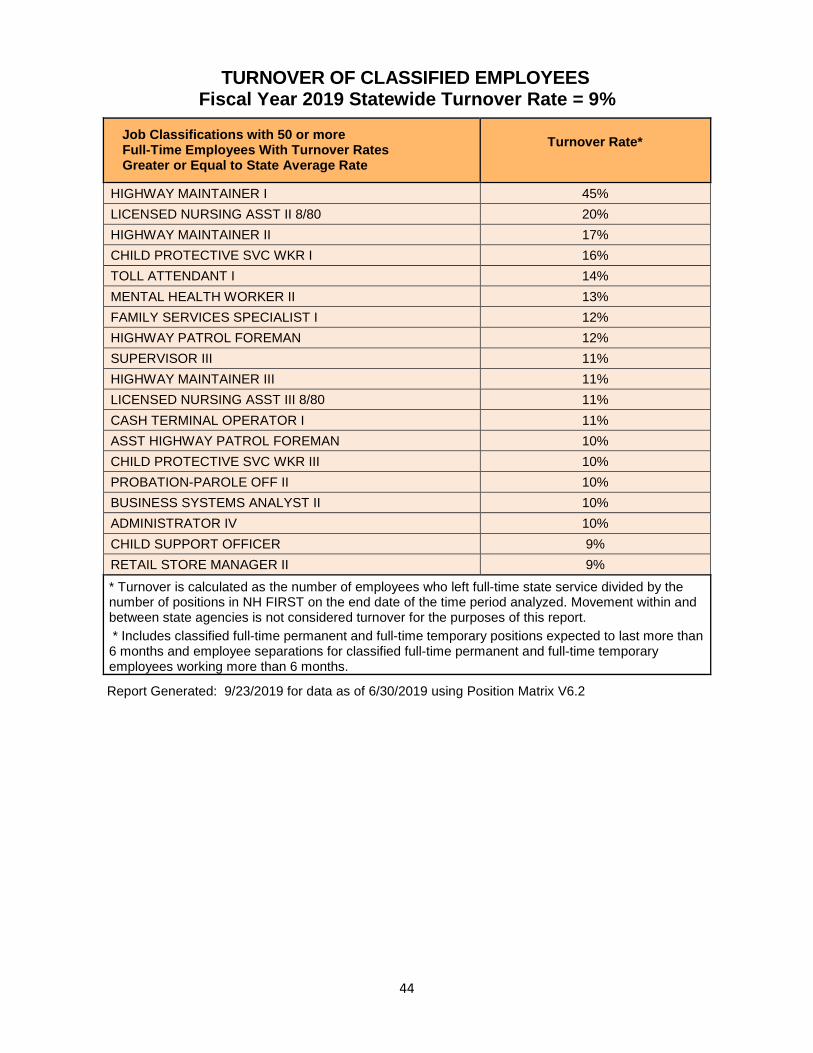
TURNOVER OF CLASSIFIED EMPLOYEES Fiscal Year 2019 Statewide Turnover Rate = 9%
Job Classifications with 50 or more Full-Time Employees With Turnover Rates Greater or Equal to State Average Rate
Turnover Rate*
HIGHWAY MAINTAINER I 45%
LICENSED NURSING ASST II 8/80 20%
HIGHWAY MAINTAINER II 17%
CHILD PROTECTIVE SVC WKR I 16%
TOLL ATTENDANT I 14%
MENTAL HEALTH WORKER II 13%
FAMILY SERVICES SPECIALIST I 12%
HIGHWAY PATROL FOREMAN 12%
SUPERVISOR III 11%
HIGHWAY MAINTAINER III 11%
LICENSED NURSING ASST III 8/80 11%
CASH TERMINAL OPERATOR I 11%
ASST HIGHWAY PATROL FOREMAN 10%
CHILD PROTECTIVE SVC WKR III 10%
PROBATION-PAROLE OFF II 10%
BUSINESS SYSTEMS ANALYST II 10%
ADMINISTRATOR IV 10%
CHILD SUPPORT OFFICER 9%
RETAIL STORE MANAGER II 9%
* Turnover is calculated as the number of employees who left full-time state service divided by the number of positions in NH FIRST on the end date of the time period analyzed. Movement within and between state agencies is not considered turnover for the purposes of this report. * Includes classified full-time permanent and full-time temporary positions expected to last more than 6 months and employee separations for classified full-time permanent and full-time temporary employees working more than 6 months.
Report Generated: 9/23/2019 for data as of 6/30/2019 using Position Matrix V6.2

45
Turnover Rates by Agency Fiscal Year 2019
AGENCY* # of Separations # of Positions Turnover Rate Change from FY 18 ADJUTANT GENERAL'S DEPT 16 141 11% -1.4% ADMINISTRATIVE SERVICES DEPT 17 305 6% 2.0% AGRICULT, MARKETS & FOOD DEPT 2 34 6% -2.9% BANKING DEPT 4 47 9% 2.7% BUS & ECON AFFAIRS DEPT 7 59 12% 4.2% CORRECTIONS DEPT 77 928 8% 1.1% DEVELOPMENT DISABILITIES CNCL 0 3 0% -33.3% EDUCATION DEPT 33 299 11% -0.4% EMPLOYMENT SECURITY DEPT 23 258 9% 1.2% ENVIRONMENTAL SERVICES DEPT 30 480 6% 0.4% EXECUTIVE DEPT 0 15 0% -25.0% FISH AND GAME DEPT 11 183 6% 0.9% HHS: BEHAVIORAL HEALTH DIV 2 33 6% -1.3% HHS: COMM-BASED CARE SVCS DIV 4 22 18% 18.2% HHS: COMMISSIONER'S OFFICE 19 379 5% -0.9% HHS: DEVELOPMENTAL SVCS DIV 11 53 21% 15.3% HHS: ELDERLY & ADULT SVCS DIV 10 79 13% 3.9% HHS: GLENCLIFF HOME 25 167 15% 5.4% HHS: HUMAN SERVICES DIV 66 800 8% -0.6% HHS: MEDICAID & BUS POLICY OFC 1 49 2% 0.1% HHS: NH HOSPITAL 68 633 11% 0.6% HHS: PUBLIC HEALTH DIV 24 278 9% 0.9% HHS: TRANSITIONAL ASSIST DIV 55 463 12% 4.0% HUMAN RIGHTS COMMISSION 3 7 43% 0.0% INFORMATION TECHNOLOGY DEPT 29 346 8% 2.0% INSURANCE DEPT 4 70 6% 1.4% JUDICIAL COUNCIL 1 2 50% 50.0% JUSTICE DEPT 10 64 16% 1.1% LABOR DEPT 7 87 8% 4.7% LIQUOR COMMISSION 31 340 9% -4.4% LOTTERY COMMISSION 5 65 8% 1.6% NATURAL & CULT RESOURCES DEPT 18 241 7% 2.2% PEASE DEVELOPMENT AUTHORITY 0 6 0% 0.0% POLICE STDS & TRAINING COUNCIL 2 20 10% 5.0% PROF LICENSURE & CERT OFFICE 9 65 14% 5.6% PUBLIC EMPLOYEE LABOR REL BRD 0 4 0% 0.0% PUBLIC UTILITIES COMMISSION 6 72 8% -4.2% REVENUE ADMINISTRATION DEPT 9 120 8% -1.6% SAFETY DEPT 74 1,110 7% -1.4% STATE DEPT 4 76 5% 0.0% TAX AND LAND APPEALS BOARD 0 4 0% 0.0% TRANSPORTATION DEPT 172 1,635 11% 2.0% TREASURY DEPT 0 17 0% -5.9% VETERANS HOME 60 383 16% 3.2% VETERANS SERVICES OFFICE 1 9 11% -3.2% TOTAL 950 10,451 9% 0.9%
*Turnover is calculated as the number of employees who left full-time state service divided by the number of positions in NH FIRST on end date of the time period analyzed. Movement within and between state agencies is not considered turnover for the purposes of this report. *Includes classified full-time permanent and full-time temporary positions expected to last 6 months or more, and separated classified full-time permanent and full-time temporary employees working more than 6 months. This report does not include 16 positions found in error.
Report Generated: 9/23/2019 for position data as of 6/30/19 using Position Matrix V6.2 and separations data for 7/01/2018-6/30/2019 (FY 2019) based on Employee Matrix V6.4

46
DISTRIBUTION OF SEPARATED EMPLOYEES BY LENGTH OF SERVICE*
Fiscal Year 2019
*Distribution percentage is calculated as the number of employees that left full-time state service in each length of service category divided by the total number of employees that left full-time state service during the time period analyzed. *Includes classified full-time permanent employees and classified full-time temporary employees working more than 6 months.
Report Generated: 9/23/2019 for separations data for 7/01/2018-6/30/2019 (FY 2019) based on Employee Matrix V6.4
<2 Years26%
2-4 Years18%
5-9 Years10%
10-14 Years12%
15-19 Years12%
20-24 Years7%
25-29 Years6%
30+ Years9%
<2 Years
2-4 Years
5-9 Years
10-14 Years
15-19 Years
20-24 Years
25-29 Years
30+ Years
47
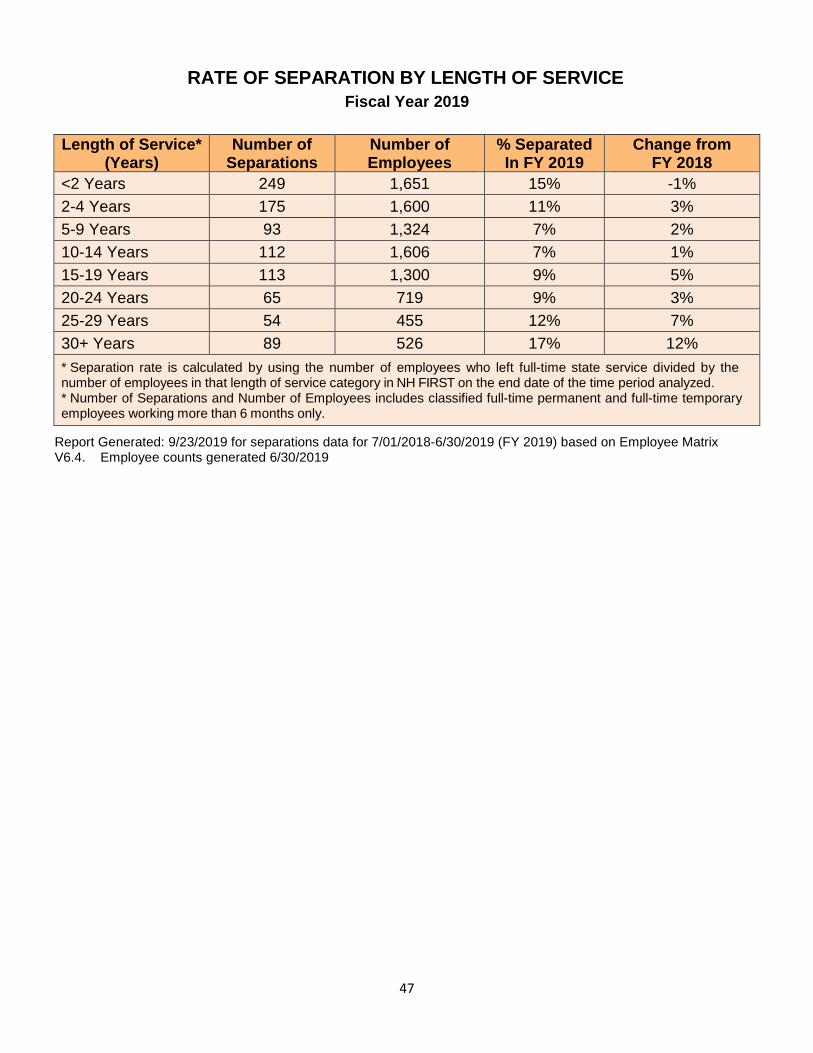
RATE OF SEPARATION BY LENGTH OF SERVICE Fiscal Year 2019
Length of Service*
(Years) Number of
Separations Number of Employees
% Separated In FY 2019
Change from FY 2018
<2 Years 249 1,651 15% -1% 2-4 Years 175 1,600 11% 3% 5-9 Years 93 1,324 7% 2% 10-14 Years 112 1,606 7% 1% 15-19 Years 113 1,300 9% 5% 20-24 Years 65 719 9% 3% 25-29 Years 54 455 12% 7% 30+ Years 89 526 17% 12% * Separation rate is calculated by using the number of employees who left full-time state service divided by the number of employees in that length of service category in NH FIRST on the end date of the time period analyzed. * Number of Separations and Number of Employees includes classified full-time permanent and full-time temporary employees working more than 6 months only.
Report Generated: 9/23/2019 for separations data for 7/01/2018-6/30/2019 (FY 2019) based on Employee Matrix V6.4. Employee counts generated 6/30/2019
48
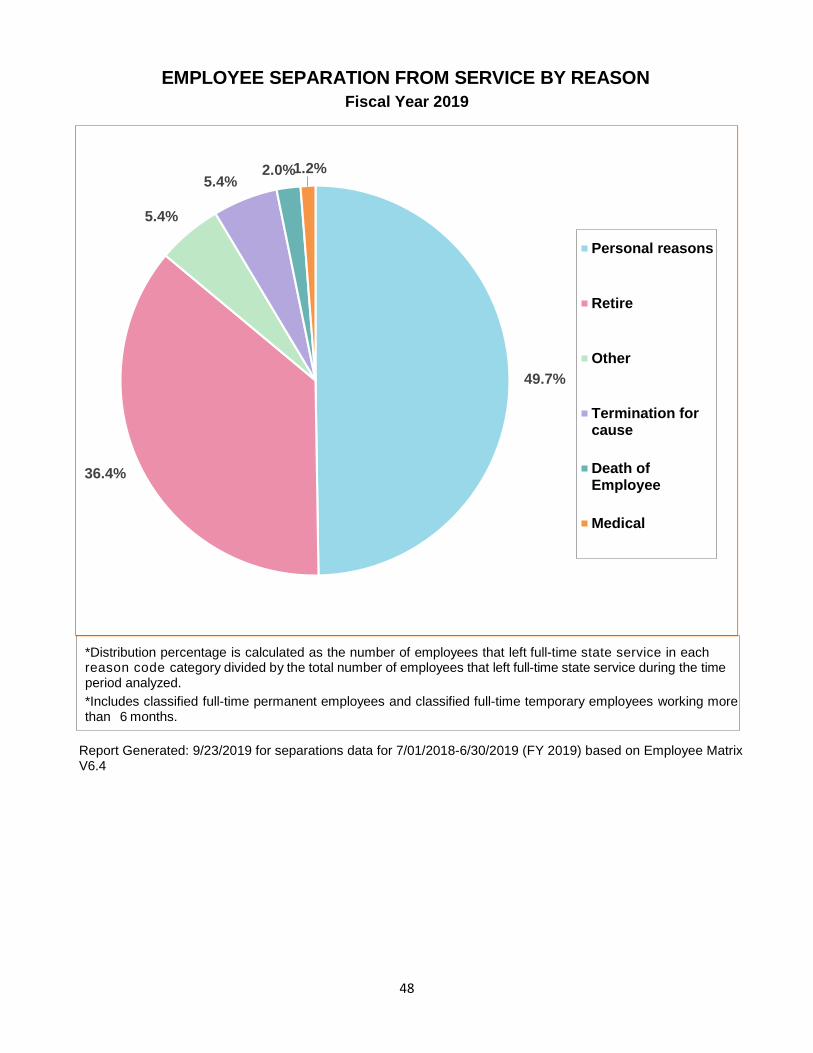
EMPLOYEE SEPARATION FROM SERVICE BY REASON Fiscal Year 2019
*Distribution percentage is calculated as the number of employees that left full-time state service in each reason code category divided by the total number of employees that left full-time state service during the time period analyzed. *Includes classified full-time permanent employees and classified full-time temporary employees working more than 6 months.
Report Generated: 9/23/2019 for separations data for 7/01/2018-6/30/2019 (FY 2019) based on Employee Matrix V6.4
49.7%
36.4%
5.4%
5.4%2.0%1.2%
Personal reasons
Retire
Other
Termination forcause
Death ofEmployee
Medical

49
VACANCY

50
VACANCY RATE FOR FULL-TIME POSITIONS BY AGENCY Fiscal Year 2019
AGENCY* # of Positions # of Vacancies Vacancy Rate
ADJUTANT GENERAL'S DEPT 141 18 13% ADMINISTRATIVE SERVICES DEPT 305 23 8% AGRICULT, MARKETS & FOOD DEPT 34 5 15% BANKING DEPT 47 9 19% BUS & ECON AFFAIRS DEPT 59 2 3% CORRECTIONS DEPT 928 147 16% DEVELOPMENT DISABILITIES CNCL 3 0 0% EDUCATION DEPT 299 75 25% EMPLOYMENT SECURITY DEPT 258 42 16% ENVIRONMENTAL SERVICES DEPT 480 67 14% EXECUTIVE DEPT 15 0 0% FISH AND GAME DEPT 183 9 5% HHS: BEHAVIORAL HEALTH DIV 33 2 6% HHS: COMM-BASED CARE SVCS DIV 22 4 18% HHS: COMMISSIONER'S OFFICE 379 43 11% HHS: DEVELOPMENTAL SVCS DIV 53 5 9% HHS: ELDERLY & ADULT SVCS DIV 79 2 3% HHS: GLENCLIFF HOME 167 22 13% HHS: HUMAN SERVICES DIV 800 82 10% HHS: MEDICAID & BUS POLICY OFC 49 4 8% HHS: NH HOSPITAL 633 113 18% HHS: PUBLIC HEALTH DIV 278 35 13% HHS: TRANSITIONAL ASSIST DIV 463 68 15% HUMAN RIGHTS COMMISSION 7 0 0% INFORMATION TECHNOLOGY DEPT 346 35 10% INSURANCE DEPT 70 16 23% JUDICIAL COUNCIL 2 0 0% JUSTICE DEPT 64 6 9% LABOR DEPT 87 18 21% LIQUOR COMMISSION 340 20 6% LOTTERY COMMISSION 65 7 11% NATURAL & CULT RESOURCES DEPT 241 43 18% PEASE DEVELOPMENT AUTHORITY 6 1 17% POLICE STDS & TRAINING COUNCIL 20 1 5% PROF LICENSURE & CERT OFFICE 65 3 5% PUBLIC EMPLOYEE LABOR REL BRD 4 0 0% PUBLIC UTILITIES COMMISSION 72 6 8% REVENUE ADMINISTRATION DEPT 120 9 8% SAFETY DEPT 1,110 63 6% STATE DEPT 76 22 29% TAX AND LAND APPEALS BOARD 4 0 0% TRANSPORTATION DEPT 1,635 158 10% TREASURY DEPT 17 1 6% VETERANS HOME 383 84 22% VETERANS SERVICES OFFICE 9 0 0% Total 10,451
1,270 12%
*Includes classified full-time permanent, and full-time temporary positions expected to last more than 6 months. *Vacancy Rate = Total number of vacancies divided by total number of positions. This report does not contain 16 positions found in error.
Report Generated: 9/23/2019 for data as of 6/30/2019 by Position Matrix V6.2

51
VACANT FULL-TIME POSITIONS ON JUNE 30, 2019 BY NUMBER OF DAYS VACANT AGENCY*
# of Vacancies with Date
# Vacant <=30 Days
# Vacant >30-60 Days
# Vacant >60-90 Days
# Vacant >90-240
Days
# Vacant > 240 Days
ADJUTANT GENERAL'S DEPT 18 1 1 5 4 7 ADMINISTRATIVE SERVICES DEPT 20 3 1 2 4 10 AGRICULT, MARKETS & FOOD DEPT 4 1 0 0 1 2 BANKING DEPT 9 1 1 2 0 5 BUS & ECON AFFAIRS DEPT 2 0 0 1 0 1 CORRECTIONS DEPT 132 7 31 19 47 28 DEVELOPMENT DISABILITIES CNCL 0 0 0 0 0 0 EDUCATION DEPT 70 3 3 2 14 48 EMPLOYMENT SECURITY DEPT 40 2 4 5 5 24 ENVIRONMENTAL SERVICES DEPT 60 2 7 3 19 29 EXECUTIVE DEPT 0 0 0 0 0 0 FISH AND GAME DEPT 6 1 1 0 2 2 HHS: BEHAVIORAL HEALTH DIV 2 0 1 0 1 0 HHS: COMM-BASED CARE SVCS DIV 4 0 0 1 3 0 HHS: COMMISSIONER'S OFFICE 40 3 5 5 4 23 HHS: DEVELOPMENTAL SVCS DIV 5 0 1 0 2 2 HHS: ELDERLY & ADULT SVCS DIV 2 0 0 1 1 0 HHS: GLENCLIFF HOME 22 5 2 2 7 6 HHS: HUMAN SERVICES DIV 81 9 11 11 19 31 HHS: MEDICAID & BUS POLICY OFC 4 0 0 1 0 3 HHS: NH HOSPITAL 112 11 10 4 21 66 HHS: PUBLIC HEALTH DIV 32 2 4 6 4 16 HHS: TRANSITIONAL ASSIST DIV 64 7 11 14 21 11 HUMAN RIGHTS COMMISSION 0 0 0 0 0 0 INFORMATION TECHNOLOGY DEPT 35 3 4 4 15 9 INSURANCE DEPT 15 0 2 4 6 3 JUDICIAL COUNCIL 0 0 0 0 0 0 JUSTICE DEPT 5 0 4 0 1 0 LABOR DEPT 18 0 2 0 5 11 LIQUOR COMMISSION 20 9 5 1 2 3 LOTTERY COMMISSION 6 1 0 0 2 3 NATURAL & CULT RESOURCES DEPT 27 0 3 3 8 13 PEASE DEVELOPMENT AUTHORITY 1 0 0 0 0 1 POLICE STDS & TRAINING COUNCIL 1 0 0 1 0 0 PROF LICENSURE & CERT OFFICE 3 0 0 1 2 0 PUBLIC EMPLOYEE LABOR REL BRD 0 0 0 0 0 0 PUBLIC UTILITIES COMMISSION 5 0 1 0 1 3 REVENUE ADMINISTRATION DEPT 9 3 1 1 2 2 SAFETY DEPT 61 9 11 4 21 16 STATE DEPT 17 0 1 2 2 12 TAX AND LAND APPEALS BOARD 0 0 0 0 0 0 TRANSPORTATION DEPT 158 8 16 25 64 45 TREASURY DEPT 1 0 0 0 0 1 VETERANS HOME 73 4 6 4 24 35 VETERANS SERVICES OFFICE 0 0 0 0 0 0 Total 1,184 95 150 134 334 471 *Includes classified full-time permanent and full-time temporary positions expected to last more than 6 months. This report does not contain 16 positions found in error.
Report Generated: 9/23/2019 for data as of 6/30/2019 by Position Matrix V6.2

52
VACANT POSITIONS ON JUNE 30, 2019 BY NUMBER OF DAYS VACANT BY POSITION TYPE
POSITION* # Vacant
with Date # Vacant
<= 30 days
# Vacant >30-60 days
# Vacant >60-90 days
# Vacant >90-240
days
# Vacant >240 days
FULL-TIME 1,087 91 148 128 319 401
FULL-TIME TEMPORARY 97 4 2 6 15 70
Total 1,184 95 150 134 334 471
% of TOTAL 8% 13% 11% 28% 40%
*Includes classified full-time permanent and full-time temporary positions expected to last more than 6 months. This report does not contain 16 positions found in error.
Report Generated: 9/23/2019 for data as of 6/30/2019 by Position Matrix V6.2
VACANCY RATE ON JUNE 30, 2019 BY POSITION TYPE
POSITION* Number of Positions
Number of Vacancies
Vacancy Rate (%)
FULL-TIME 10,164 1,144 11%
FULL-TIME TEMPORARY 287 126 44%
Total 10,451 1,270 12%
*Includes classified full-time permanent and full-time temporary positions expected to last more than 6 months. *Vacancy Rate = Total number of vacancies divided by total number of positions. This report does not contain 16 positions found in error.
Report Generated: 9/23/2019 for data as of 6/30/2019 by Position Matrix V6.2

53
RETIREMENT ELIGIBILITY

54
EXECUTIVE BRANCH - GROUP 1 EMPLOYEES Estimate of Current and Future Eligibility for Retirement & State Health Insurance
Benefit 8,400 Employees* - Based on Current Employees as of 6/30/2019
As of July 1: 2019 % of Total Pop 2021 % of Total
Pop
Eligible Age 65+ (with health ins ben) 209 2.5% 377 4.5%
Eligible Age 65+ (w/o health ins ben) 212 2.5% 385 4.6%
Eligible Age 60+ (with health ins ben) 461 5.5% 592 7.0%
Eligible Age 60+ (w/o health ins ben) 275 3.3% 309 3.7%
Early Eligible - 70 rule (with health ins ben) 342 4.1% 322 3.8%
Early Eligible - 70 rule (w/o health ins ben) 665 7.9% 778 9.3%
Early Eligible - Age 50-59 (with health ins ben) 0 0.0% 0 0.0%
Early Eligible - Age 50-59 (w/o health ins ben) 905 10.8% 800 9.5%
Total Eligible 3,069 36.5% 3,563 42.4%
"Likely to Retire" 65+ or 60+ with health ins ben
882 10.5% 1,354 16.1%
*Includes full-time and full-time temporary classified, unclassified, and non-classified employees expected to work more than 6 months. Employees are counted in only the first eligibility group that they qualify for top-to-bottom, even if they qualify under more than category (e.g., employees who qualify under both Early Eligibility Rules are only counted in the “70 Rule” category).
Report generated based on employee data as of 6/30/2019 by Employee Matrix V6.4
55
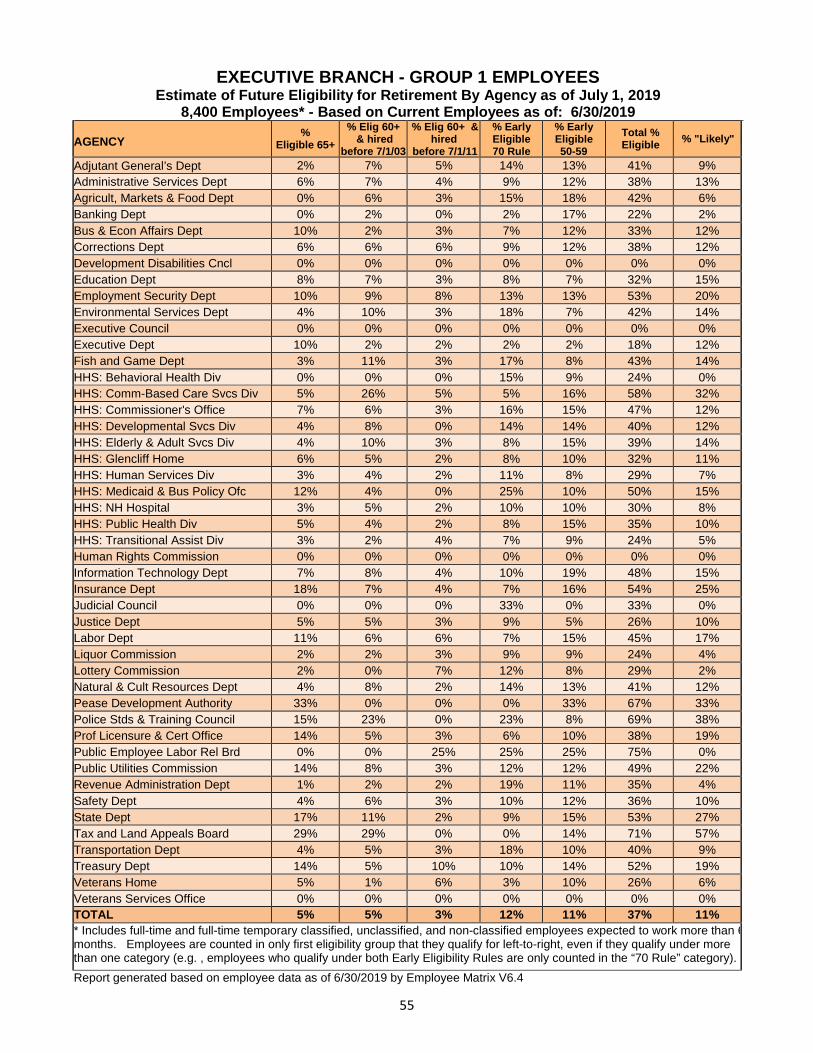
EXECUTIVE BRANCH - GROUP 1 EMPLOYEES Estimate of Future Eligibility for Retirement By Agency as of July 1, 2019
8,400 Employees* - Based on Current Employees as of: 6/30/2019
AGENCY
% Eligible 65+
% Elig 60+ & hired
before 7/1/03
% Elig 60+ & hired
before 7/1/11
% Early Eligible 70 Rule
% Early Eligible 50-59
Total % Eligible % "Likely"
Adjutant General’s Dept 2% 7% 5% 14% 13% 41% 9% Administrative Services Dept 6% 7% 4% 9% 12% 38% 13% Agricult, Markets & Food Dept 0% 6% 3% 15% 18% 42% 6% Banking Dept 0% 2% 0% 2% 17% 22% 2% Bus & Econ Affairs Dept 10% 2% 3% 7% 12% 33% 12% Corrections Dept 6% 6% 6% 9% 12% 38% 12% Development Disabilities Cncl 0% 0% 0% 0% 0% 0% 0% Education Dept 8% 7% 3% 8% 7% 32% 15% Employment Security Dept 10% 9% 8% 13% 13% 53% 20% Environmental Services Dept 4% 10% 3% 18% 7% 42% 14% Executive Council 0% 0% 0% 0% 0% 0% 0% Executive Dept 10% 2% 2% 2% 2% 18% 12% Fish and Game Dept 3% 11% 3% 17% 8% 43% 14% HHS: Behavioral Health Div 0% 0% 0% 15% 9% 24% 0% HHS: Comm-Based Care Svcs Div 5% 26% 5% 5% 16% 58% 32% HHS: Commissioner's Office 7% 6% 3% 16% 15% 47% 12% HHS: Developmental Svcs Div 4% 8% 0% 14% 14% 40% 12% HHS: Elderly & Adult Svcs Div 4% 10% 3% 8% 15% 39% 14% HHS: Glencliff Home 6% 5% 2% 8% 10% 32% 11% HHS: Human Services Div 3% 4% 2% 11% 8% 29% 7% HHS: Medicaid & Bus Policy Ofc 12% 4% 0% 25% 10% 50% 15% HHS: NH Hospital 3% 5% 2% 10% 10% 30% 8% HHS: Public Health Div 5% 4% 2% 8% 15% 35% 10% HHS: Transitional Assist Div 3% 2% 4% 7% 9% 24% 5% Human Rights Commission 0% 0% 0% 0% 0% 0% 0% Information Technology Dept 7% 8% 4% 10% 19% 48% 15% Insurance Dept 18% 7% 4% 7% 16% 54% 25% Judicial Council 0% 0% 0% 33% 0% 33% 0% Justice Dept 5% 5% 3% 9% 5% 26% 10% Labor Dept 11% 6% 6% 7% 15% 45% 17% Liquor Commission 2% 2% 3% 9% 9% 24% 4% Lottery Commission 2% 0% 7% 12% 8% 29% 2% Natural & Cult Resources Dept 4% 8% 2% 14% 13% 41% 12% Pease Development Authority 33% 0% 0% 0% 33% 67% 33% Police Stds & Training Council 15% 23% 0% 23% 8% 69% 38% Prof Licensure & Cert Office 14% 5% 3% 6% 10% 38% 19% Public Employee Labor Rel Brd 0% 0% 25% 25% 25% 75% 0% Public Utilities Commission 14% 8% 3% 12% 12% 49% 22% Revenue Administration Dept 1% 2% 2% 19% 11% 35% 4% Safety Dept 4% 6% 3% 10% 12% 36% 10% State Dept 17% 11% 2% 9% 15% 53% 27% Tax and Land Appeals Board 29% 29% 0% 0% 14% 71% 57% Transportation Dept 4% 5% 3% 18% 10% 40% 9% Treasury Dept 14% 5% 10% 10% 14% 52% 19% Veterans Home 5% 1% 6% 3% 10% 26% 6% Veterans Services Office 0% 0% 0% 0% 0% 0% 0% TOTAL 5% 5% 3% 12% 11% 37% 11% * Includes full-time and full-time temporary classified, unclassified, and non-classified employees expected to work more than 6 months. Employees are counted in only first eligibility group that they qualify for left-to-right, even if they qualify under more than one category (e.g. , employees who qualify under both Early Eligibility Rules are only counted in the “70 Rule” category).
Report generated based on employee data as of 6/30/2019 by Employee Matrix V6.4
56
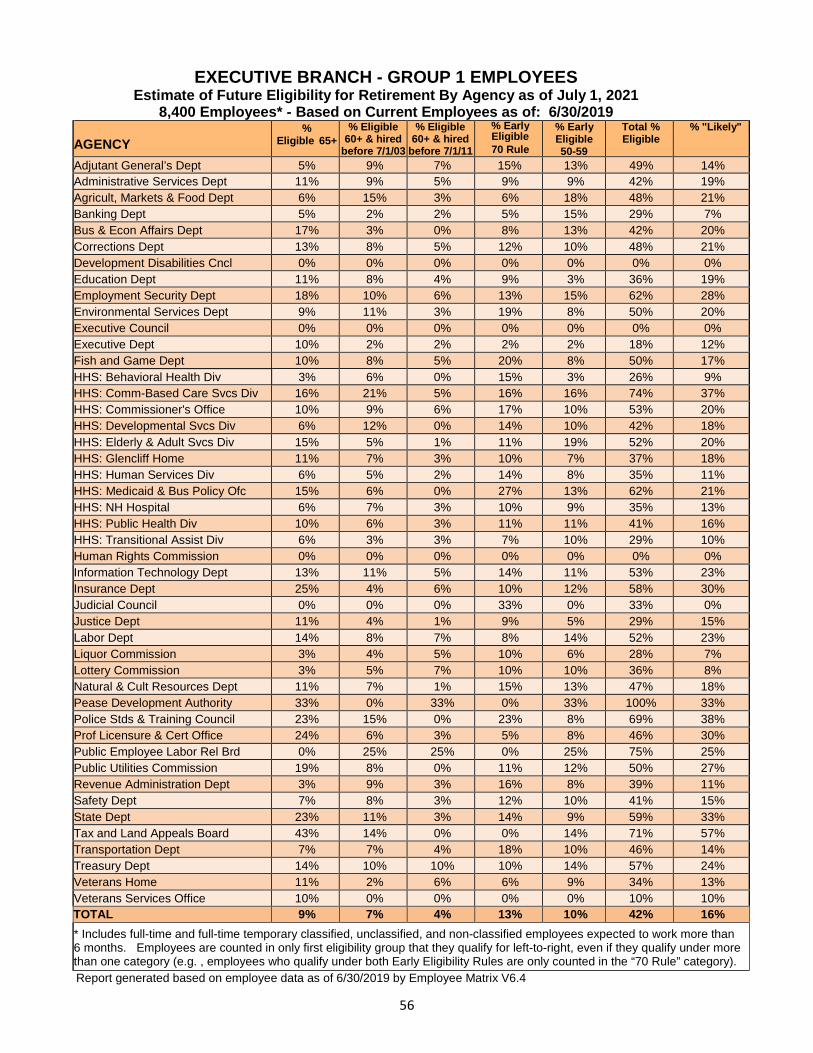
EXECUTIVE BRANCH - GROUP 1 EMPLOYEES Estimate of Future Eligibility for Retirement By Agency as of July 1, 2021
8,400 Employees* - Based on Current Employees as of: 6/30/2019
AGENCY
% Eligible 65+
% Eligible 60+ & hired
before 7/1/03
% Eligible 60+ & hired
before 7/1/11
% Early Eligible 70 Rule
% Early Eligible 50-59
Total % Eligible
% "Likely"
Adjutant General’s Dept 5% 9% 7% 15% 13% 49% 14% Administrative Services Dept 11% 9% 5% 9% 9% 42% 19% Agricult, Markets & Food Dept 6% 15% 3% 6% 18% 48% 21% Banking Dept 5% 2% 2% 5% 15% 29% 7% Bus & Econ Affairs Dept 17% 3% 0% 8% 13% 42% 20% Corrections Dept 13% 8% 5% 12% 10% 48% 21% Development Disabilities Cncl 0% 0% 0% 0% 0% 0% 0% Education Dept 11% 8% 4% 9% 3% 36% 19% Employment Security Dept 18% 10% 6% 13% 15% 62% 28% Environmental Services Dept 9% 11% 3% 19% 8% 50% 20% Executive Council 0% 0% 0% 0% 0% 0% 0% Executive Dept 10% 2% 2% 2% 2% 18% 12% Fish and Game Dept 10% 8% 5% 20% 8% 50% 17% HHS: Behavioral Health Div 3% 6% 0% 15% 3% 26% 9% HHS: Comm-Based Care Svcs Div 16% 21% 5% 16% 16% 74% 37% HHS: Commissioner's Office 10% 9% 6% 17% 10% 53% 20% HHS: Developmental Svcs Div 6% 12% 0% 14% 10% 42% 18% HHS: Elderly & Adult Svcs Div 15% 5% 1% 11% 19% 52% 20% HHS: Glencliff Home 11% 7% 3% 10% 7% 37% 18% HHS: Human Services Div 6% 5% 2% 14% 8% 35% 11% HHS: Medicaid & Bus Policy Ofc 15% 6% 0% 27% 13% 62% 21% HHS: NH Hospital 6% 7% 3% 10% 9% 35% 13% HHS: Public Health Div 10% 6% 3% 11% 11% 41% 16% HHS: Transitional Assist Div 6% 3% 3% 7% 10% 29% 10% Human Rights Commission 0% 0% 0% 0% 0% 0% 0% Information Technology Dept 13% 11% 5% 14% 11% 53% 23% Insurance Dept 25% 4% 6% 10% 12% 58% 30% Judicial Council 0% 0% 0% 33% 0% 33% 0% Justice Dept 11% 4% 1% 9% 5% 29% 15% Labor Dept 14% 8% 7% 8% 14% 52% 23% Liquor Commission 3% 4% 5% 10% 6% 28% 7% Lottery Commission 3% 5% 7% 10% 10% 36% 8% Natural & Cult Resources Dept 11% 7% 1% 15% 13% 47% 18% Pease Development Authority 33% 0% 33% 0% 33% 100% 33% Police Stds & Training Council 23% 15% 0% 23% 8% 69% 38% Prof Licensure & Cert Office 24% 6% 3% 5% 8% 46% 30% Public Employee Labor Rel Brd 0% 25% 25% 0% 25% 75% 25% Public Utilities Commission 19% 8% 0% 11% 12% 50% 27% Revenue Administration Dept 3% 9% 3% 16% 8% 39% 11% Safety Dept 7% 8% 3% 12% 10% 41% 15% State Dept 23% 11% 3% 14% 9% 59% 33% Tax and Land Appeals Board 43% 14% 0% 0% 14% 71% 57% Transportation Dept 7% 7% 4% 18% 10% 46% 14% Treasury Dept 14% 10% 10% 10% 14% 57% 24% Veterans Home 11% 2% 6% 6% 9% 34% 13% Veterans Services Office 10% 0% 0% 0% 0% 10% 10% TOTAL 9% 7% 4% 13% 10% 42% 16%
* Includes full-time and full-time temporary classified, unclassified, and non-classified employees expected to work more than 6 months. Employees are counted in only first eligibility group that they qualify for left-to-right, even if they qualify under more than one category (e.g. , employees who qualify under both Early Eligibility Rules are only counted in the “70 Rule” category). Report generated based on employee data as of 6/30/2019 by Employee Matrix V6.4

57
EXECUTIVE BRANCH - GROUP 2 EMPLOYEES Estimate of Future Eligibility for Retirement & State Health Insurance Benefit
1,138 Employees - Based on Current Employees as of: 6/30/2019
As of July 1: 2019 % of Total Pop 2021 % of Total Pop
Eligible Age 60+ (with health ins ben) 38 3.3% 56 4.9%
Eligible Age 60+ (without health ins ben) 14 1.2% 20 1.8%
Eligible Age 45+ with 20+ YFS (with health ins ben) 103 9.1% 202 17.8%
Eligible Age 46-52.5 with 25+ YFS (with health ins ben) 0 0.0% 0 0.0%
Eligible Age 50-52.5 with 25+ YFS (without health ins ben) 0 0.0% 0 0.0%
Total Eligible & "Likely" (with health benefit) 155 13.6% 278 24.4%
*Includes full-time and full-time temporary classified and unclassified employees expected to work more than 6 months. “YFS” = years of full-time service.
Report generated based on employee data as of 6/30/2019 by Employee Matrix V6.4

58
EXECUTIVE BRANCH - GROUP 2 EMPLOYEES Estimate of Current Eligibility for Retirement as of July 1, 2019
1,138 Employees* - Based on Current Employees as of: 6/30/2019
AGENCY
Eligible Age 45+ with 20+
YFS (with health
ins ben)
Eligible Age 46-52.5 with
25+ YFS (with health
ins ben)
Eligible Age 60+
(with health ins ben)
Eligible Age 60+
(without health ins
ben)
Total Eligible & "Likely"
(with health benefit)
ADJUTANT GENERAL'S DEPT 0% 0% 0% 0% 0%
CORRECTIONS DEPT 9% 0% 5% 2% 15%
FISH AND GAME DEPT 12% 0% 2% 0% 14%
LIQUOR COMMISSION 5% 0% 0% 0% 5% NATURAL & CULT RESOURCES DEPT 30% 0% 0% 0% 30%
PEASE DEVELOPMENT AUTHORITY 0% 0% 50% 0% 50%
POLICE STDS & TRAINING COUNCIL 0% 0% 14% 14% 14%
SAFETY DEPT 9% 0% 0% 1% 9%
TOTAL 9% 0% 3% 1% 14%
* Includes full-time and full-time temporary classified and unclassified employees expected to work more than 6 months. “YFS” = years of full-time service
Report generated based on employee data as of 6/30/2019 by Employee Matrix V6.4
EXECUTIVE BRANCH - GROUP 2 EMPLOYEES Estimate of Future Eligibility for Retirement as of July 1, 2021 1,138 Employees* - Based on Current Employees as of: 6/30/2019
AGENCY
Eligible Age 45+ with 20+
YFS (with health
ins ben)
Eligible Age 46-52.5 with
25+ YFS (with health
ins ben)
Eligible Age 60+
(with health ins ben)
Eligible Age 60+
(without health ins
ben)
Total Eligible & "Likely"
(with health benefit)
ADJUTANT GENERAL'S DEPT 0% 0% 0% 0% 0%
CORRECTIONS DEPT 20% 0% 8% 2% 28%
FISH AND GAME DEPT 19% 0% 2% 0% 21%
LIQUOR COMMISSION 5% 0% 0% 0% 5% NATURAL & CULT RESOURCES DEPT 50% 0% 0% 0% 50%
PEASE DEVELOPMENT AUTHORITY 0% 0% 50% 0% 50%
POLICE STDS & TRAINING COUNCIL 14% 0% 14% 14% 29%
SAFETY DEPT 15% 0% 1% 1% 16%
TOTAL 18% 0% 5% 2% 24%
* Includes full-time and full-time temporary classified and unclassified employees expected to work more than 6 months. “YFS” = years of full-time service
1
Report generated based on employee data as of 6/30/2019 by Employee Matrix V6.4

59
DIVISION OF PERSONNEL WORK ACTIVITIES

60
RECRUITMENT AND CERTIFICATION SECTION The Recruitment and Certification Unit is responsible for the following functions:
• Identify and implement recruitment strategies to increase the State’s visibility and promote the State of New Hampshire as an employer of choice such as: maintaining a social media presence, attending job and career fairs, and promoting the State’s internship programs.
• Maintain the State’s online recruitment presence to inform the public concerning job and career opportunities within the Executive Branch of state government.
• Provide guidance to state agencies and human resource staff on best practices for recruitment as identified in professional recruitment literature and through analysis of reports and studies.
• Manage and coordinate all aspects of the Talent Acquisition module within NH FIRST including the creation of recruitment reports and oversight of the recruitment-landing page. Advise, train, and assist agency staff in the job posting process.
• Plan, develop, organize and conduct training sessions to instruct agency human resource personnel in certification requirements, hiring processes, and personnel rules to maintain consistency in the interpretation of recruitment and selection standards.
• Audit agencies’ assessments of applicant information to ensure consistency in the interpretation and evaluation of minimum qualifications and adherence with statewide certification standards.
• Interview and counsel job applicants, to include the public and current state personnel, regarding job vacancies, promotional opportunities, minimum skills required, and career aspirations; develop individual employability plans; compose counseling reports and statistical summaries of interviews conducted with applicants, employees, and managers within state agencies to record sources of information, dates of contact, results of inquiries, and recommended personnel actions.
• Provide expert consultation and technical assistance to professional staff in the Division of Personnel regarding proposed revisions to agency and statewide minimum qualification requirements; assist in the development of policy and procedural revisions based upon interpretations of new laws and executive orders in the area of recruitment and selection.
Under the Personnel Rules, a full-time job opening is posted internally within the Executive Branch classified personnel system for a period of five business days and the internal opening is available to all state agency employees (Per 402.01). If no qualified candidates apply or a candidate is not selected during the internal posting process, the position is opened to the public as an external posting (Per 404.01). State employees may also apply during the external recruitment process. The Personnel Rules do not mandate an internal posting period for part-time or seasonal positions. The numbers provided below represent only those positions posted in the State Online Recruitment System and applications submitted electronically through the online system. These numbers do not include candidates that completed paper job applications outside of the State Online Recruitment System.

61
RECRUITMENT OF FULL-TIME AND PART-TIME POSITIONS BY AGENCY Fiscal Year 2019
AGENCY Internal Postings
External Postings
Full-Time Postings
Part-Time Postings
Total Job Postings
Total Applications
Received*
Adjutant General’s Department 52 40 88 4 92 438
Administrative Services Dept. 127 102 97 132 229 1,266
Agriculture Department 12 7 13 6 19 122
Banking Department 5 1 6 0 6 26
Business & Economic Affairs 26 23 13 36 49 304
Corrections Department 157 78 221 14 235 1,813
Development Disabilities Council 3 2 3 2 5 49
Education Department 80 48 122 6 128 1,310
Employment Security 90 45 90 45 135 919
Environmental Services Dept. 97 49 124 22 146 880
Executive Department 4 3 5 2 7 142
Fish and Game Department 22 14 20 16 36 399
Health & Human Services Dept. 983 600 1,431 152 1,583 15,462
Human Rights Commission 4 2 3 3 6 131
Information Technology Dept. 101 79 176 4 180 1,617
Insurance Department 29 17 46 0 46 290
Justice Department 30 18 43 5 48 381
Labor Department 24 13 32 5 37 217
Liquor Commission 180 52 131 101 232 1,134
Lottery Commission 23 6 23 6 29 280
Natural & Cultural Resources 81 65 72 74 146 1,191
Police Standards & Training 1 1 2 0 2 11
Prof Licensure and Cert. Office 35 26 30 31 61 567
Public Utilities Commission 15 6 21 0 21 170
Revenue Administration Dept. 37 15 52 0 52 300
Safety Department 283 159 259 183 442 5,140
State Department 6 1 7 0 7 87
Tax and Land Appeals Board 3 2 3 2 5 12
Transportation Department 517 341 777 81 858 3,831
Treasury Department 3 0 3 0 3 19
Veterans Home 99 75 117 57 174 400
Veterans Services Office 3 2 5 0 5 82
Total 3,132 1,892 4,035 989 5,024 38,990
*Information reflects NH FIRST applications only.

62
RECRUITMENT OF FULL-TIME AND PART-TIME POSITIONS BY MONTH Fiscal Year 2019
RECRUITMENT OF FULL-TIME AND PART-TIME POSITIONS BY OCCUPATIONAL CATEGORY
Fiscal Year 2019
Month Internal Postings
External Postings
Full-Time Postings
Part-Time Postings
Total Job Postings
Total Applications*
July 321 209 419 11 530 3,153
August 260 160 356 64 420 3,938
September 301 109 270 40 310 3,730
October 272 183 369 86 455 3,982
November 180 113 233 60 293 3,130
December 207 117 268 56 324 2,549
January 274 163 355 82 437 3,772
February 247 161 324 84 408 2,438
March 250 166 301 115 416 2,493
April 301 192 398 95 493 2,683
May 306 158 388 76 464 3,641
June 313 161 355 119 474 3,481
Total 3,132 1,892 4,036 988 5,024 38,990
*Information reflects NH FIRST applications only.
Occupational Category Internal Postings
External Postings
Full-Time Postings
Part-Time Postings
Total Job Postings
Total Applications*
Administrative Support 571 281 506 346 852 9,200 Enforcement Protection & Institution 355 179 460 74 534 4,061
Labor & Trade 714 495 935 274 1,209 4,426
Other 39 38 53 24 77 823
Professional & Managerial 1,298 791 1,867 222 2,089 18,362
Technical 155 108 215 48 263 2,118
Total 3,132 1,892 4,036 988 5,024 38,990
*Information reflects NH FIRST applications only.

63
CANDIDATE REFERRAL BY SOURCE Fiscal Year 2019
SOURCE # OF APPLICATIONS* Attached From a Different Requisition 93 Career Fair / Job Fair 684 Current State Employee 3,257 Facebook.com 199 In-House Posting 7326 Indeed.com 14,191 LinkedIn.com 758 Newspaper 133 Division of Personnel 7,658 Radio 47 Other 4,644 TOTAL APPLICATIONS RECEIVED 38,990 *Information reflects NH FIRST applications only.
RECRUITMENT ACTIVITIES CONDUCTED IN FISCAL YEAR 2019
Recruitment and Certification has worked with Financial Data Management (FDM) to improve the applicant experience by removing barriers in the online application process. Additional messaging has been added to the recruitment website to better assist the applicant in completing the registration process; as well as tips and directions to help the applicant complete the online application successfully. The Recruitment Unit enhanced its web presence by reducing the number of clicks required to reach the job opportunities page. Video tiles with links have been added that provide information regarding veteran information, internship opportunities, testimonials, diversity information, and a link to the total compensation calculator. The total compensation calculator allows applicants to calculate the “total” compensation in a state position. After entering the advertised salary of the posted position and the number of parties to be enrolled in the benefits package, the total compensation is calculated for the first year of employment. In Fiscal Year 2019, the State received a Statement of Commitment from the Employer Support of Guard and Reserve. This statement is a pledge from the State to comply with the Uniformed Services Employment and Reemployment Rights Act (USERRA) and ensure that State managers have the tools needed to manage those state employees who serve in the Guard and Reserves in recognition and support of our country’s Service members and their families in peace, in crisis, and in war. On May 15, 2019, Governor Sununu signed a Memorandum of Agreement (MOA) with the U.S. Army Partnership for Youth Success (PaYS) under which future soldiers and Reserve Officer Training Corps (ROTC) cadets are guaranteed a job interview for State positions upon meeting certification requirements after they complete their enlistment with the Army. The PaYS program is an enlistment option and recruiting initiative for the Army and the State. The Military
64
Occupational Specialties (MOS) will be matched to an equivalent State classification job description(s), allowing for the education and experience the soldier acquires during their term of enlistment to qualify them to meet the minimum qualifications of the same type of position with the State. Recruitment and Certification personnel attended 13 job fairs and career events from July 2018 to June 2019. These included both public and private colleges. Attending college career fairs has helped in marketing State career opportunities directly to students looking for jobs upon graduation. The Recruitment and Certification Unit attended a Career Planning Day event at one of the local high schools to encourage students to consider jobs within their community when they are starting to think of possible careers. Students were given information on educational requirements for various fields within state government to help them select the best course of studies. The Recruitment and Certification Unit participated in an employer discussion panel held with Southern New Hampshire University (SNHU) Career Counseling staff and other private employers from around the state. The panel helped SNHU career staff better understand what common practices could hurt an applicant’s likelihood to obtain an interview, as well as the strengths students are bringing to the application process. This information will help the career staff better prepare students to apply for employment. The Recruitment and Certification Unit provided two training sessions for agency Human Resource staff on the certification of applications. 58 human resources staff attended this training and are now able to certify their agency’s applications themselves, enabling the agency’s hiring managers to access their certified (qualified) applicants sooner. The Recruitment and Certification Unit provided instruction on certification and recruitment processes as part of the Bureau of Education and Training’s Human Resource Certificate Program this year. DOP reviewed the Administrative Rules pertaining to the State’s recruitment and certification processes, as well as the process flow from starting point to its ending point, to help students better understand how the Administrative Rules apply within the recruitment process.

65
EMPLOYEE REDUCTION IN FORCE (RIF) LIST
Effective May 30, 2018, the Legislature passed Chapter 121.1, which re-enacted the Reduction in Force (RIF) provision requiring statewide placement of laid off state employees. This legislation extended the definition of “laid-off employee” to include any state employee laid off between July 1, 2017 and June 30, 2019, because of reorganization or downsizing in state government. This legislation mandates that any classified position that becomes available in a department or establishment, as defined in RSA 9:1, be filled, if possible, by a state employee laid off, as defined in paragraph I, if such person is not currently employed by the State of New Hampshire, if he or she meets the minimum qualifications for the position, and if he or she does not receive a promotion as a result of being rehired. It also requires the appointing authority of each department or agency to submit names and classification titles of individuals laid off to the Director of Personnel within 10 days of the layoff. The following is a summary of the actions that took place in connection with the Reduction in Force (RIF) List during Fiscal Year 2019:
ACTION NUMBER
Individual Names Submitted to Personnel 0 Names Removed from RIF List: Placement to State Agencies 1 Recalled/Re-employed by Agency 3 Declined Placement Services 4 Total Number of Names Removed 8 Number of Full Time Vacant Positions Submitted by Agencies 184 Total Number of Positions Released 183 Names Remaining on RIF List * 0 *The total number of names on the RIF List may include employees who have been re-employed on a continuing part-time basis at the agency from which they were originally laid off. Other names remaining on the RIF List may include individuals who have retired, are on Workers’ Compensation, or have set their own limitations to re-employment as a full-time employee due to location, salary requirements or other personal reasons.
66
CLASSIFICATION SECTION
The Classification and Compensation Section is responsible for the development, review, maintenance, and revision of the classification and compensation plan for the State of New Hampshire. The Section also ensures system support and processing for position movement and changes within the State Human Resource Management System (NH FIRST). The Classification Section is overseen by an Administrator and consists of a Position Transaction Processing and Reporting Office (Office) with one full-time Supervisor and one full-time Human Resources Technician, and an Analytical/Auditing Unit (Unit) with two full-time and one part-time Human Resources Specialists that serve as Analysts/Auditors. The Classification Section is working with Financial Data Management (FDM) to improve mechanisms to capture detailed metrics for transactions. Improved analytics will help the Section more accurately report on transactions processed and timelines, improve auditing of position data, and to identify and solve compliance problems more efficiently. The Office is the hub for position-focused analytics and metrics. The Office staff coordinates with FDM for reports, metrics and troubleshooting and with the Department of Administrative Services’ Budget Office to prepare requests that must go before Governor and the Executive Council for approval. For Fiscal Year 2019, the Section reviewed and processed a combined total of 15,861 position actions and transactions. This included the processing of 757 classified position movement transactions, and 1,150 non-classified and unclassified position changes. The section validates position information and data within NH FIRST for each transaction. The Section conducts and participates in a variety of salary and position surveys on a national, regional, and local basis. Analysts work in tandem with New Hampshire State Agencies to review labor market information, updates in educational and certification requirements, and industry changes that coincide with comparable industry and state government positions, to ensure alignment with national and regional data. The Section worked on projects this year that helped state agencies address position and organizational issues that influenced areas of recruitment and hiring, employee turnover and retention, training and development, performance, environment and communication, cross-function, Equal Employment Opportunity Commission, pay equity, and diversification of skills. Fiscal Year 2019 also brought initiatives to streamline and improve the New Hampshire Classification System and procedures. The Section was an integral part of this effort and an active participant in project meetings, operational assessments, and reviews of rules, policies, and procedures. The Classification Section focused on gathering input from many stakeholder groups and conducted extensive research in to define proposed short- and long-term changes to the State Classification System. TECHNICAL ASSISTANCE, AUDITING, AND TRAINING:
The complexity of research and technical assistance provided by the Section varies by project. This year, the Section consulted on labor market research, wage analysis, review of organizational impacts, and cross-functional assessments. Organizational and position analysis was conducted to help agencies improve their workforce performance planning, find solutions to recruitment challenges, and address other relevant human resource concerns.

67
Fiscal Year 2019 brought significant movement and turnover within state human resources and agency administration; both the Unit and the Office were engaged in providing extensive training, technical assistance, and explanations of rules, procedures, and standards, and in general, areas of government human resources. The Section also broadened its oversight with an expanded auditing role in order to help address challenges with capacity and resources. Training and guidance to agency human resources personnel in their ability to review materials, transactions, requests, and to mitigate personnel and quality issues directly and prior to the submittal of position action requests has been effective in improving quality and appropriateness of information. The Section also began developing methodologies for assessing agencies on the effectiveness of classification and position management practices, policies, and procedures. Consultation meetings provided planning and direction to enhance effectiveness in achieving agency objectives in broader areas of organizational planning, development, and forecasting of workforce needs. Competency training for targeted agency human resources staff as part of these ongoing efforts will continue to add efficiencies in statewide classification operations. The Office provides training, review, and feedback to state agencies on the processing of their transactions including: position extensions, establishments, categorization, and maintenance. They ensure successful process flow to the Division’s Central Human Resources Processing Section for timely pay and employee status adjustments. This year the Office provided more formalized training and technical assistance to agency human resources professionals to guide them on the laws and rules pertaining to the maintenance of jobs and positions. The Classification Section relies on the Office to assist with critical tracking, timely updates, systems reports, and technical input for projects and process improvement efforts. ONE WORKFORCE INITIATIVE: UPDATING THE STATE’S CLASSIFICATION PLAN & SYSTEM
In August 2018, the Department of Administrative Services began investing considerable staff time to examine the current personnel management practices and processes, and to identify options for improving and modernizing systems. The Classification Section worked with an assigned Project Manager and with the Division leadership to examine all aspects of the current Classification System and its related operations. The focus was on the identification of short- and long-term recommendations to increase speed and flexibility in managing positions, and to enable agencies to quickly adjust staffing to meet their business and service demands. The Section conducted extensive outreach for input to identify concerns and best practices associated with the State’s current classification plan and system. In FY 2019, a series of focus group meetings were conducted and an online comment tool was used to gather input. In addition, the Section conducted extensive benchmark research on how other states and public entities have set-up, modified, and streamlined their classification and compensation systems. Major topics identified from outreach included the need to:
Provide more flexibility in the application of minimum qualifications for positions.
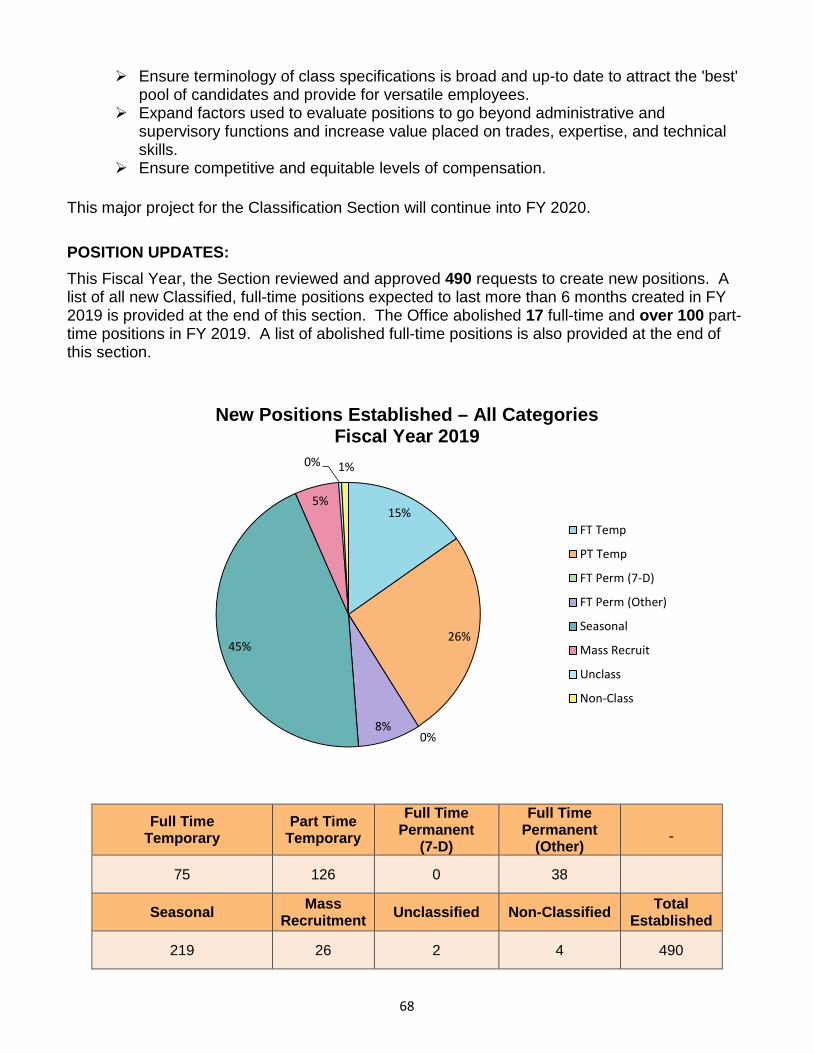
68
Ensure terminology of class specifications is broad and up-to date to attract the 'best' pool of candidates and provide for versatile employees.
Expand factors used to evaluate positions to go beyond administrative and supervisory functions and increase value placed on trades, expertise, and technical skills.
Ensure competitive and equitable levels of compensation.
This major project for the Classification Section will continue into FY 2020.
POSITION UPDATES:
This Fiscal Year, the Section reviewed and approved 490 requests to create new positions. A list of all new Classified, full-time positions expected to last more than 6 months created in FY 2019 is provided at the end of this section. The Office abolished 17 full-time and over 100 part-time positions in FY 2019. A list of abolished full-time positions is also provided at the end of this section.
New Positions Established – All Categories Fiscal Year 2019
Full Time Temporary
Part Time Temporary
Full Time Permanent
(7-D)
Full Time Permanent
(Other)
75 126 0 38
Seasonal Mass Recruitment Unclassified Non-Classified Total
Established
219 26 2 4 490
15%
26%
0%8%
45%
5%
0% 1%
FT Temp
PT Temp
FT Perm (7-D)
FT Perm (Other)
Seasonal
Mass Recruit
Unclass
Non-Class

69
TEMPORARY CHANGES TO POSITIONS: The Section follows appropriate RSAs and procedures when approving and processing all position actions involving temporary changes. This includes the monitoring of positions going beyond their expiration date. Actions of this nature, for example, may involve a request to extend an end date for a full-time temporary position beyond its one-year approval timeframe. Any special assignments or temporary promotion requests are also examined for compliance with appropriate Administrative Rules of the Division of Personnel. For Fiscal Year 2019, 348 transactions of this nature were performed by the Section.
POSITION EXTENSIONS/ TEMPORARY CHANGES Fiscal Year 2019
Action Count
Extend End Date 119
Promotional Path 37
Temporary Reclassification Down 0
Temporary Reclassification Up and Return 5
Temporary Promotion and Return 116
Override Grade and Return 26
Special Assignments - Promotions and Return 45
34%
11%
0%1%
33%
8%
13%
Extend End Date
Promotional Path
Temporary Reclassification Down
Temporary Reclassification Upand Return
Temporary Promotion and Return
Override Grade and Return
Special Assignments - Promotionsand Return

70
CLASS SPECIFICATION REVISIONS AND MAINTENANCE: State job classification specifications set and maintain the statewide standard for characteristic duties and minimum qualification requirements for all classified positions. Project requests from agencies to revise classification specifications require critical analysis because they may have legal ramifications, affect more than one agency and affect multiple positions. Updates or changes to minimum qualification and certification requirements, correction of outdated language, changes in industry standards, state licensing requirements, or significant changes in purpose or characteristic duties of a classification, can take place. This Fiscal Year, the Classification Section processed 46 classification specification reviews and revisions (including reallocations). The Section also developed and implemented a streamlined electronic procedure for classification specification requests in efforts to move away from a cumbersome paper process toward an electronic tracking and archiving system and standardized electronic formats to improve efficiency in the workflow for document revisions and updates. Maintenance efforts for our state classification system in Fiscal Year 2019 focused on reducing the total number of active classification titles available. First, the Classification Unit identified several class titles not currently in use and worked with agencies to deactivate 71 titles no longer needed. The Classification Unit also looked for opportunities to migrate positions with unique titles to an alternative, more general classification title based on similarity of functions and alignment with duties assigned. The consolidation of titles helps ensure that positions performing similar duties in comparable organizational structures across agencies are evaluated against the same standard and compensated equitably. REALLOCATIONS:
The Section reviews requests to reallocate the labor grade of classification titles or classification series in addition to requests to modify existing class title specifications. Reallocations affect all positions assigned to that title in every state agency. The work involves complex impact and labor market analysis, extensive research, multiple revisions and edits. Meetings with any impacted agencies are also held as changes could result in budgetary and organizational adjustments. In Fiscal Year 2019, 6 reallocations were approved that affected 551 filled and vacant positions. One additional reallocation request was received in FY 2019 and remained under review as of June 30, 2019.
SUMMARY OF CLASS SPECIFICATION MODIFICATION AND REALLOCATION REQUESTS Fiscal Year 2019
Requested Action # Submitted
# Approved
# Denied/ Incomplete
# Still in Review
Revision to Class Title Specification with Labor Grade Change 10 6 3 1
Revision to Class Specification w/o Labor Grade Change 78 37 0 41
TOTAL 88 43 3 42

71
APPROVED REALLOCATION OF CLASSIFICATION TITLES
Fiscal Year 2019
Classification Title Changed
Old Labor Grade
Old Base Salary Step 1
New Labor Grade
New Base
Salary Step 1
# Positions Affected*
Estimated Cost of Title Reallocation
Per Year (all positions)**
EMP Assistance Program Field Rep 25 $50,954 27 $55,556 4 $18,408
Assistant Highway Patrol Foreman 14 $32,624 15 $33,872 102 $127,296
Highway Maintainer I 7 $25,097 9 $27,027 62 $119,691
Highway Maintainer II 9 $27,027 11 $29,153 236 $501,618
Highway Maintainer III 12 $30,225 14 $32,624 144 $345,384
Human Resources Specialist II 24 $48,770 27 $55,556 3 $20,358
NET TOTAL - - 551 $1,132,755
* Includes only permanent classified, full-time and temporary classified full-time positions expected to last more than 6 months established between 7/1/2018 and 6/30/2019.
** Additional cost is estimated based on Step 1 salary difference for all positions (vacant and filled).
RECLASSIFICATIONS:
The Classification Section reviews requests to reclassify positions from one job classification title to another, which typically involves a change in labor grade. Organizational changes can also result in a reclassification of a position. Requests may also be combined with other position actions such as transfers, location and supervisor changes, supplemental job description revisions, and organizational structure reconfigurations. Reclassifications are the most frequent and numerous type of request submitted for review by this Section. Time, analysis, and research varies by type and complexity of each reclassification request. OUT-OF-CLASS SERIES RECLASSIFICATIONS:
Position reclassifications that are considered “out-of-class series” per the existing RSA 21-I: 56, continued to be brought before Governor & Council (G & C) for approval. This Fiscal Year, 88 out of the 372 position reclassifications were submitted to and approved by G & C. The chart at the end of this section lists all out-of-series position reclassifications.

72
SUMMARY OF RECLASSIFICATION REQUESTS FOR FULL-TIME POSITIONS Fiscal Year 2019
Requested Action* # Submitted
# Processed # Returned # Still Under
Review
Position Reclassification – Vacant 194 158 14 22
Position Reclassification – Filled 220 148 12 60
Position Reclassification with Re-Organization 25 8 5 12
TOTAL 442 314 31 94
Transaction Type Net or Average Cost** (Est. Per Year) # Transactions
Per Position Reclassification with Change to Higher Labor Grade $6,370 231
Per Position Reclassification with Change to Lower Labor Grade ($5,840) 42
Position Reclassification with No Change in Labor Grade $ 0 26
Position Reclassification Denied $ 0 15
All Reclassifications (Est Net Cost) $1,213,850 314
* Includes requests for permanent reclassification of Classified Permanent and Full-time Temporary Positions Lasting More Than 6 Months Only; excludes requests affecting Non- classified and Unclassified Positions and requests for temporary (short-term) position reclassifications.
** Cost is estimated based on Step 1 salary for vacant positions and actual salary for filled positions.

73
RECLASSIFICATION DECISIONS WHICH DIFFERED FROM AGENCY REQUESTS: This year, 37 decision letters were sent to agencies explaining the determination of the Classification Section in regards to reclassification and/or reallocation requests. Decision letters are necessary when the Classification Section disagrees with an agency request or arrives at an alternative decision based on a review of materials and analysis, or when communicating a decision outcome after an agency reorganization that changes functions of a positions or affects a position’s role within an organizational structure. The Section anticipates that as more focused competency training takes place, agency human resources staff will be better able to assist employees and supervisors in understanding the purpose of a reclassification. Further, those same agency staff can provide assistance to their employees and administration when reviewing materials for reclassification or reallocation requests, and be able to mitigate issues, address concerns or explain decision outcomes. REORGANIZATIONS: Reorganizations occur when an agency seeks to better align business operations or in response to changes in funding or programmatic needs. This year the Section completed 132 work units that involved agency reorganization (Reorgs). These included requests for changes in class series, reclassifications, position and employee transfers, organizational changes, and transactional request supporting agency restructuring initiatives. Complex technical assistance involving position movement is provided due to the impact a reorganization can have on agency employees and organizational structures. This Fiscal Year the Section worked with FDM to develop definitions around Reorg codes so that better metrics could be tracked and distinctions could be made between the transactional and position change requests that are involved.

74
OUT-OF-SERIES POSITION RECLASSIFICATIONS APPROVED BY GOVERNOR AND COUNCIL Fiscal Year 2019
DEPARTMENT FROM (TITLE & SALARY GRADE) LG TO (TITLE & SALARY GRADE) LG G & C Department of Information Technology Program Assistant II 15 Technical Support Specialist III 25 7/25/18 New Hampshire Insurance Department Insurance Company Examiner II 31 Attorney III 30 7/25/18 Justice Department Legal Assistant I 19 Legal Assistant II 22 7/25/18 Department of Corrections Corrections Counselor Case Manager 20 Supervisor II 21 8/22/18 Department of Health and Human Services Data Entry Operator III 8 Program Assistant I 12 9/5/18 Department of Health and Human Services Case Technician I 14 Quality Control Reviewer I 20 9/5/18 Revenue Administration Clerk III 8 Administrator II 29 9/20/18 Department of Health and Human Services Internal Auditor III 23 Financial Analyst 28 10/3/18 Revenue Administration Clerk IV 12 Paralegal II 19 10/3/18 Office of Professional Licensure & Certification License Clerk 11 Administrative Assistant I 16 10/3/18 Department of Health and Human Services Program Specialist IV 25 Administrator II 29 10/3/18 Department of Health and Human Services Business Systems Analyst I 28 Business Administrator III 27 10/3/18 Treasury State Internal Auditor I 19 Program Assistant II 15 10/17/18 Department of Transportation Geological Exploration Technician I 9 Business Systems Analyst I 28 10/17/18 Department of Information Technology Business Systems Analyst II 30 System Development Specialist VI 30 10/17/18 Justice Department Criminal Justice Program Specialist 24 Accountant IV 23 10/17/18 Department of Safety Data Control Clerk III 12 Maintenance Mechanic II 12 10/17/18 Department of Safety Administrator IV 33 Administrator II 29 10/17/18 Department of Health and Human Services Administrator I 27 Business Administrator IV 29 10/31/18 Department of Transportation Environmentalist III 23 Business Systems Analyst I 28 10/31/18 Department of Environmental Services Hydrogeologist III 27 Environmentalist III 23 10/31/18 Department of Corrections Teacher III 18 Pharmacist 27 10/31/18 Department of Health and Human Services Admin of Planning Coordination 30 Administrator IV 33 10/31/18 Department of Health and Human Services Paralegal I 16 Legal Secretary III 13 10/31/18 Department of Health and Human Services Program Specialist IV 25 Public Health Program Manager 26 11/14/18 Department of Health and Human Services Executive Secretary 11 Program Specialist I 19 11/14/18 Department of Information Technology Supervisor of Computer Operations 19 Technical Support Specialist VI 32 11/14/18 Department of Information Technology Service & Production Clerk 12 Business Systems Analyst II 30 12/5/18 Department of Information Technology Systems Development Spec II 21 Technical Support Spec VI 32 12/5/18 Department of Health and Human Services Program Specialist IV 25 Administrator III 31 12/5/18 Department of Transportation Engineering Technician III 16 Business Systems Analyst I 28 12/19/18 Department of Health and Human Services Administrator I 27 Business Systems Analyst II 30 12/19/18 Department of Health and Human Services Administrator I 27 Business Systems Analyst II 30 12/19/18 Department of Health and Human Services Administrator IV
33 Executive Project Manager 35 1/23/19

75
DEPARTMENT FROM (TITLE & SALARY GRADE) LG TO (TITLE & SALARY GRADE) LG G & C Department of Health and Human Services Mental Health Worker Trainee 7 Registered Nurse I 19 1/23/19 Department of Health and Human Services Mental Health Worker II 11 Registered Nurse I 19 1/23/19 Treasury State Technical Support Specialist III 25 Technical Support Spec IV 27 1/23/19 Department of Transportation Program Specialist I 19 Systems Development Specialist III 23 1/23/19 Department of Health and Human Services Social Worker III 19 Supervisor III 23 1/23/19 Department of Health and Human Services Fraud Investigator 21 Administrator II 29 1/23/19 Department of Environmental Services Environmental Technician III 14 Program Assistant II 15 1/23/19 Department of Environmental Services Environmental Technician III 14 Program Assistant II 15 1/23/19 Department of Environmental Services Environmental Technician III 14 Program Assistant II 15 1/23/19 Department of Safety Secretary II 9 Paralegal I 16 1/23/19 Department of Environmental Services Environmental Technician III 14 Program Assistant II 15 1/23/19 Adjutant General Clerk III 8 Plant Maintenance Engineer III 21 1/23/19 Adjutant General Maintenance Engineer II 12 Plant Maintenance Engineer III 21 1/23/19 Department of Health and Human Services Child Support Officer 20 Program Specialist IV 25 2/6/19 Department of Health and Human Services Child Support Officer 20 Program Specialist IV 25 2/6/19 Office of Professional Licensure & Certification Systems Development Specialist IV 26 Business Systems Analyst I 28 2/6/19 Department of Information Technology Systems Development Spec VI 30 Technical Support Spec VI 32 2/20/19 Department of Health and Human Services Executive Secretary 11 Program Assistant II 15 2/20/19 Department of Information Technology Information Technology Manager II 30 Business Systems Analyst I 28 3/13/19 Department of Health and Human Services Public Health Coordinator 23 Program Specialist IV 25 3/27/19 Department of Corrections Prison Shop Manager II 18 Supervisor II 19 3/27/19 Department of Safety Accountant III 21 Technical Support Spec IV 27 3/27/19 Department of Health and Human Services Business Administrator IV 29 Administrator III 31 3/27/19 Department of Health and Human Services Inventory Control Supervisor 14 Warehouse Supervisor 17 3/27/19 Department of Health and Human Services Business Administrator IV 29 Administrator III 27 3/27/19 Department of Health and Human Services Financial Analyst 28 Administrator II 29 3/27/19 Department of Health and Human Services Case Technician 14 Accountant I 16 4/17/19 Department of Health and Human Services Program Specialist III 23 Business Administrator III 27 4/17/19 Department of Health and Human Services Paralegal I 16 Program Specialist IV 25 4/17/19 Department of Safety Emergency Management Specialist 23 Program Specialist III 21 5/1/19 Department of Health and Human Services Accountant II 18 Administrator I 27 5/1/19 Department of Health and Human Services Accounting Technician 12 Administrator I 27 5/1/19 Department of Transportation Engineering Technician III 16 Information Technology Manager III 31 5/1/19 Department of Health and Human Services Staff Development and Training Specialist 24 Occupational Therapist II 21 5/15/19 Department of Safety Counter Clerk II 9 Stock Clerk II 8 5/15/19 Department of Health and Human Services Substance Abuse Counselor 18 Program Assistant I 12 5/15/19 Department of Health and Human Services Radiation Health Physicist III 26 Records Control Clerk 10 5/15/19 Department of Health and Human Services Financial Agent I 20 Fraud Investigator 21 5/15/19

76
DEPARTMENT FROM (TITLE & SALARY GRADE) LG TO (TITLE & SALARY GRADE) LG G & C Department of Health and Human Services Program Assistant II 15 Supervisor III 23 5/15/19 Department of Health and Human Services Senior Management Analyst 26 Systems Development Spec IV 26 6/5/19 Department of Health and Human Services Program Specialist IV 25 Business Systems Analyst I 28 6/5/19 Department of Health and Human Services Mental Health Worker I 11 Licensed Nursing Assistant I 11 6/5/19 Department of Health and Human Services Mental Health Worker II 11 Licensed Nursing Assistant I 9 6/5/19 Department of Health and Human Services Mental Health Worker II 11 Licensed Nursing Assistant I 9 6/5/19 Banking Commission Business Administrator I 21 Human Resources Coordinator I 21 6/5/19 Department of Information Technology Systems Development Spec V 28 Business Systems Analyst II 30 6/5/19 Department of Health and Human Services Mental Health Worker II 11 Licenses Nursing Assistant II 11 6/5/19 Department of Health and Human Services Mental Health Worker II 11 Licenses Nursing Assistant II 11 6/5/19 Department of Environmental Services Word Processor Operator II 12 Program Assistant II 15 6/5/19 Department of Information Technology Computer Operator II 13 Information Technology Manager IV 32 6/5/19 Adjutant General Engineering Technician V 22 Program Specialist IV 25 6/19/19 Department of Education Secretary II 9 Program Assistant I 12 6/19/19 Department of Education Accounting Technician 12 Rehabilitation Technician 12 6/19/19 Department of Safety Administrative Supervisor 17 Program Assistant II 15 7/10/19

77
NEW FULL-TIME PERMANENT AND FULL-TIME TEMPORARY POSITIONS Fiscal Year 2019
Agency Classification Title* Labor Grade
Estimated Cost (Step 1)
ADJUTANT GENERAL'S DEPT Veterans Service Officer 18 $38,201 ADJUTANT GENERAL'S DEPT Veterans Service Officer 18 $38,201 ADMINISTRATIVE SERVICES DEPT Surplus Property Storekeeper II 13 $31,337 ADMINISTRATIVE SERVICES DEPT Program Assistant II 15 $33,872 CORRECTIONS DEPT PROGRAM COORDINATOR RE-ENTRY CARE 26 $53,177 CORRECTIONS DEPT PROGRAM COORDINATOR RE-ENTRY CARE 26 $53,177 EDUCATION DEPT Program Specialist IV 25 $50,954 EDUCATION DEPT Program Specialist IV 25 $50,954 EDUCATION DEPT Program Specialist IV 25 $50,954 ENVIRONMENTAL SERVICES DEPT Environmentalist IV 27 $55,556 ENVIRONMENTAL SERVICES DEPT Toxicologist IV 29 $60,470 EXECUTIVE DEPT Program Specialist IV 25 $50,954 HEALTH AND HUMAN SERVICES Executive Secretary 11 $29,153 HEALTH AND HUMAN SERVICES Executive Secretary 11 $29,153 HEALTH AND HUMAN SERVICES Program Assistant I 12 $30,225 HEALTH AND HUMAN SERVICES PROGRAM ASSISTANT I 12 $30,225 HEALTH AND HUMAN SERVICES Family Services Specialist Trainee 15 $33,872 HEALTH AND HUMAN SERVICES Family Services Specialist Trainee 15 $33,872 HEALTH AND HUMAN SERVICES Family Services Specialist Trainee 15 $33,872 HEALTH AND HUMAN SERVICES Family Services Specialist Trainee 15 $33,872 HEALTH AND HUMAN SERVICES Family Services Specialist Trainee 15 $33,872 HEALTH AND HUMAN SERVICES Family Services Specialist Trainee 15 $33,872 HEALTH AND HUMAN SERVICES Family Services Specialist Trainee 15 $33,872 HEALTH AND HUMAN SERVICES Family Services Specialist Trainee 15 $33,872 HEALTH AND HUMAN SERVICES Family Services Specialist Trainee 15 $33,872 HEALTH AND HUMAN SERVICES Family Services Specialist Trainee 15 $33,872 HEALTH AND HUMAN SERVICES Family Services Specialist Trainee 15 $33,872 HEALTH AND HUMAN SERVICES Family Services Specialist Trainee 15 $33,872 HEALTH AND HUMAN SERVICES Accountant II 18 $38,201 HEALTH AND HUMAN SERVICES Child Protective Service Worker I 18 $38,201 HEALTH AND HUMAN SERVICES Child Protective Service Worker I 18 $38,201 HEALTH AND HUMAN SERVICES Child Protective Service Worker I 18 $38,201 HEALTH AND HUMAN SERVICES Child Protective Service Worker I 18 $38,201 HEALTH AND HUMAN SERVICES Child Protective Service Worker I 18 $38,201 HEALTH AND HUMAN SERVICES Child Protective Service Worker I 18 $38,201 HEALTH AND HUMAN SERVICES Child Protective Service Worker I 18 $38,201
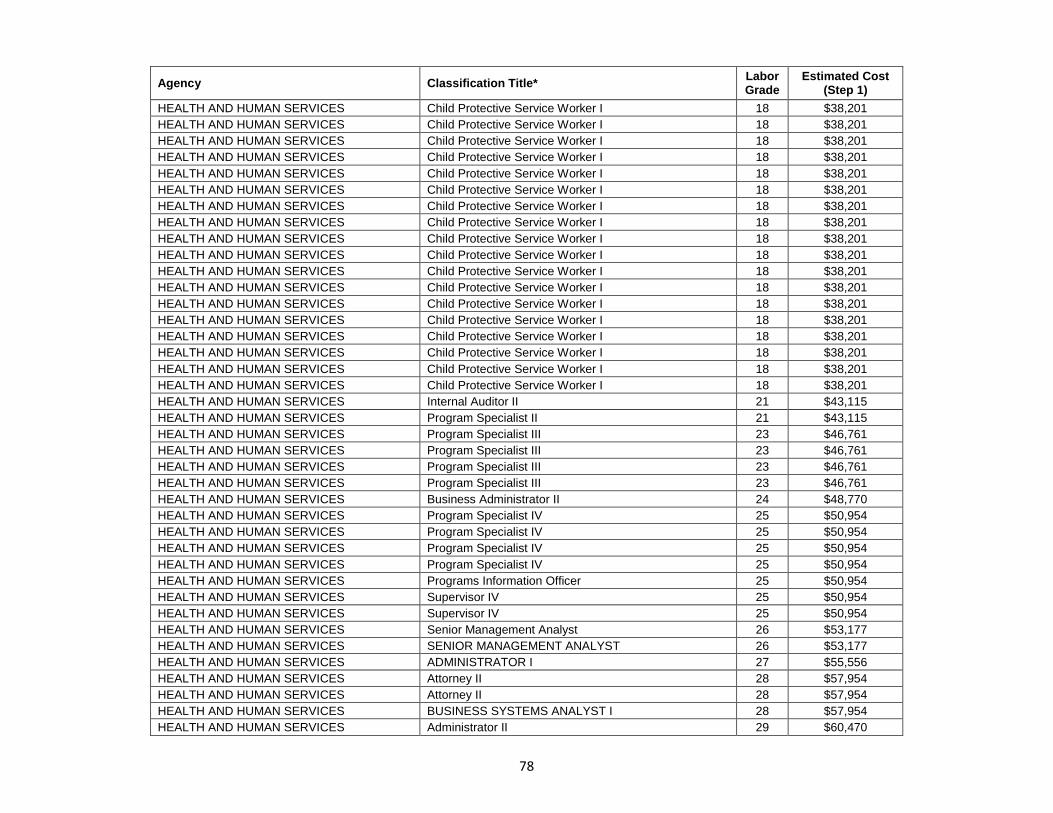
78
Agency Classification Title* Labor Grade
Estimated Cost (Step 1)
HEALTH AND HUMAN SERVICES Child Protective Service Worker I 18 $38,201 HEALTH AND HUMAN SERVICES Child Protective Service Worker I 18 $38,201 HEALTH AND HUMAN SERVICES Child Protective Service Worker I 18 $38,201 HEALTH AND HUMAN SERVICES Child Protective Service Worker I 18 $38,201 HEALTH AND HUMAN SERVICES Child Protective Service Worker I 18 $38,201 HEALTH AND HUMAN SERVICES Child Protective Service Worker I 18 $38,201 HEALTH AND HUMAN SERVICES Child Protective Service Worker I 18 $38,201 HEALTH AND HUMAN SERVICES Child Protective Service Worker I 18 $38,201 HEALTH AND HUMAN SERVICES Child Protective Service Worker I 18 $38,201 HEALTH AND HUMAN SERVICES Child Protective Service Worker I 18 $38,201 HEALTH AND HUMAN SERVICES Child Protective Service Worker I 18 $38,201 HEALTH AND HUMAN SERVICES Child Protective Service Worker I 18 $38,201 HEALTH AND HUMAN SERVICES Child Protective Service Worker I 18 $38,201 HEALTH AND HUMAN SERVICES Child Protective Service Worker I 18 $38,201 HEALTH AND HUMAN SERVICES Child Protective Service Worker I 18 $38,201 HEALTH AND HUMAN SERVICES Child Protective Service Worker I 18 $38,201 HEALTH AND HUMAN SERVICES Child Protective Service Worker I 18 $38,201 HEALTH AND HUMAN SERVICES Child Protective Service Worker I 18 $38,201 HEALTH AND HUMAN SERVICES Internal Auditor II 21 $43,115 HEALTH AND HUMAN SERVICES Program Specialist II 21 $43,115 HEALTH AND HUMAN SERVICES Program Specialist III 23 $46,761 HEALTH AND HUMAN SERVICES Program Specialist III 23 $46,761 HEALTH AND HUMAN SERVICES Program Specialist III 23 $46,761 HEALTH AND HUMAN SERVICES Program Specialist III 23 $46,761 HEALTH AND HUMAN SERVICES Business Administrator II 24 $48,770 HEALTH AND HUMAN SERVICES Program Specialist IV 25 $50,954 HEALTH AND HUMAN SERVICES Program Specialist IV 25 $50,954 HEALTH AND HUMAN SERVICES Program Specialist IV 25 $50,954 HEALTH AND HUMAN SERVICES Program Specialist IV 25 $50,954 HEALTH AND HUMAN SERVICES Programs Information Officer 25 $50,954 HEALTH AND HUMAN SERVICES Supervisor IV 25 $50,954 HEALTH AND HUMAN SERVICES Supervisor IV 25 $50,954 HEALTH AND HUMAN SERVICES Senior Management Analyst 26 $53,177 HEALTH AND HUMAN SERVICES SENIOR MANAGEMENT ANALYST 26 $53,177 HEALTH AND HUMAN SERVICES ADMINISTRATOR I 27 $55,556 HEALTH AND HUMAN SERVICES Attorney II 28 $57,954 HEALTH AND HUMAN SERVICES Attorney II 28 $57,954 HEALTH AND HUMAN SERVICES BUSINESS SYSTEMS ANALYST I 28 $57,954 HEALTH AND HUMAN SERVICES Administrator II 29 $60,470

79
Agency Classification Title* Labor Grade
Estimated Cost (Step 1)
HEALTH AND HUMAN SERVICES Business Systems Analyst II 30 $63,180 HEALTH AND HUMAN SERVICES Administrator IV 33 $72,306 HEALTH AND HUMAN SERVICES Executive Project Manager 35 $79,170 JUSTICE DEPT Criminal Justice Program Specialist 24 $48,770 NATURAL & CULT RESOURCES DEPT Maintenance Mechanic I 8 $25,974 NATURAL & CULT RESOURCES DEPT Account Clerk III 9 $27,027 NATURAL & CULT RESOURCES DEPT Forest Technician I 10 $28,061 NATURAL & CULT RESOURCES DEPT Forest Technician I 10 $28,061 NATURAL & CULT RESOURCES DEPT Mountain Equipment Operator 12 $30,225 NATURAL & CULT RESOURCES DEPT Park Manager II 12 $30,225 NATURAL & CULT RESOURCES DEPT Park Manager II 12 $30,225 NATURAL & CULT RESOURCES DEPT Retail Store Clerk II 12 $30,225 NATURAL & CULT RESOURCES DEPT Equipment Operator Supervisor 14 $32,624 NATURAL & CULT RESOURCES DEPT Maintenance Mechanic III 14 $32,624 NATURAL & CULT RESOURCES DEPT Retail Store Manager I 14 $32,624 NATURAL & CULT RESOURCES DEPT Grants & Contract Technician 15 $33,872 NATURAL & CULT RESOURCES DEPT Park Manager III 15 $33,872 NATURAL & CULT RESOURCES DEPT Park Manager III 15 $33,872 NATURAL & CULT RESOURCES DEPT Park Manager III 15 $33,872 NATURAL & CULT RESOURCES DEPT Ski School Director 19 $39,702 PROF LICENSURE & CERT OFFICE License Clerk 11 $29,153 PROF LICENSURE & CERT OFFICE License Clerk 11 $29,153 PROF LICENSURE & CERT OFFICE License Clerk 11 $29,153 PROF LICENSURE & CERT OFFICE PLANNING ANALYST/DATA SYSTEM 24 $48,770 SAFETY DEPT Program Assistant II 15 $33,872 SAFETY DEPT Program Specialist III 23 $46,761 STATE DEPT Technical Support Specialist VI 32 $69,089 TOTAL 102 positions TOTAL $4,175,438
AVERAGE 19 $40,936
* Includes only permanent classified, full-time and temporary classified full-time positions expected to last more than 6 months established between 7/1/2018 and 6/30/2019.

80
POSITIONS UNFUNDED OR ABOLISHED Fiscal Year 2019
Agency Classification Title* Labor Grade
Estimated Cost** (Step 1)
EMPLOYMENT SECURITY DEPT Employment Counselor Spec 19 $39,702 EMPLOYMENT SECURITY DEPT Employment Counselor Spec 19 $39,702 EMPLOYMENT SECURITY DEPT Employment Counselor Spec 19 $39,702 EMPLOYMENT SECURITY DEPT Program Specialist I 19 $39,702 SAFETY DEPT Program Assistant II 15 $33,872 SAFETY DEPT Field Rep I Emer Mgmt Comm 19 $39,702 VETERANS HOME Laundry Worker III 7 $25,097 VETERANS HOME Cook II 9 $27,027 VETERANS HOME Licensed Nursing Assistant I 9 $34,070 VETERANS HOME Licensed Nursing Assistant II 11 $36,774 VETERANS HOME Licensed Nursing Assistant II 11 $36,774 VETERANS HOME Licensed Nursing Assistant II 11 $36,774 VETERANS HOME Licensed Nursing Assistant II 11 $36,774 VETERANS HOME Licensed Nursing Assistant III 14 $41,142 VETERANS HOME Licensed Nursing Assistant III 14 $41,142 VETERANS HOME Licensed Practical Nurse II 18 $48,152 VETERANS HOME Registered Nurse II 21 $54,350 TOTAL 17 positions $650,457
* Includes only permanent classified, full-time and temporary classified full-time positions expected to last more than 6 months abolished between 7/1/2018 and 6/30/2019.
** Estimated annual cost per position is based on base salary only (using applicable wage schedule).

81
CENTRAL HUMAN RESOURCE PROCESSING UNIT
The Central Human Resource Processing Unit is comprised of two sections: the Employee HR Transactions and Record Maintenance Section, which processes all human resource transactions affecting the pay and status of Classified, Unclassified and Non-Classified employees; and the Examination Section, which administers written examinations to determine internal and external applicants’ competency for appointment consideration to job vacancies within New Hampshire State Government law enforcement community. This Unit continues to work closely with FDM and the BOA to identify improvements in processing human resource transactions. As NH FIRST processes are updated or newly created, this Section documents the procedures, presents new procedures to agency human resource staff, and posts the new procedures on the DOP Sunspot page on the Intranet. This Section also is instrumental in testing in support of system upgrades, use of new/modified codes, and implementation of new functionality within NH FIRST. Members of this Unit have met regularly with agency human resource representatives as part of a NH FIRST work group to get feedback and assistance with developing training material and communicating updates to state agency Human Resource staff as appropriate using email, Sunspot, meetings and written step-by-step instructions.
EMPLOYEE HR TRANSACTIONS AND RECORD MAINTENANCE SECTION This section processed 31,741 transactions in Fiscal Year 2019 including, but are not limited to: new hires, rehires, promotions, lateral assignment changes, transfers, demotions, increments, leave of absences, date adjustments, terminations, and retirements.
Transactions Total
New Hires 2,032 Rehires 1,151 Transfers 3,070 Promotions 380 Change in Pay Rates 5,836 Change Relationship to Organizations 13,096 Terminations 6,166 Miscellaneous Transactions 10 Total 31,741
Report Generated 06/30/2019 This Section processed an average of 610 transactions every week. This is an increase from last year of 3%. In addition to these standard employee transactions, this Section worked in conjunction with the Classification Section to retroactively correct historic position and/or employee data to adjust an employee’s pay and to implement mass updates for position changes, such as labor grade, union or title changes, that also affected employees in filled positions.

82
In Fiscal Year 2019, this Section increasingly used the mass upload method, which was developed to process multiple employee/position changes in the NH FIRST system using an excel spreadsheet rather than individual transactions. This method provides efficiency in processing large numbers of transactions such as location changes, address changes, salary enhancements and other data corrections resulting from audits. This year we completed 22 mass uploads, which otherwise would have required agencies and employees in this Section to process thousands of individual transactions. A significant project in Fiscal Year 2019 was completed with Employee Relations, Financial Data Management (FDM), Bureau of Accounts (BOA) and Classifications Section to change how differential pays are managed within NH FIRST. This project required the mass upload of 18 different spreadsheets, affecting thousands of employee records. This Section currently has three full-time positions and two part-time positions which included two positions that are cross trained for the Examination Section. One of the part-time positions is dedicated to and funded by the NH State Liquor Commission. EXAMINATION SECTION This section works with agency staff from the Department of Safety, the Department of Natural and Cultural Resources and Fish and Game to administer specific examinations in a large quantity at one time for such titles as State Police Troopers, Conservation Officers, Forest Rangers and Marine Patrol Officers. This section also offers field-testing of candidates at New Hampshire Employment Security local offices as alternative examination sites throughout the State. We also continue to provide technical assistance to state agency Human Resource Departments and hiring managers in the preparation and administration of structured interviews. A current list of the positions that require examinations or structured interviews can be found on Sunspot at the following link: http://sunspot.nh.gov/hr/documents/Examinations/State%20of%20NH%20Examinations.pdf Testing activity included proctoring written examinations, documenting and communicating the results of written examinations and structured interviews for 576 applicants.
Structured Interview Data Processing and Administration 327 Law Enforcement Written Exams 249 Total 576

83
BUREAU OF EMPLOYEE RELATIONS
Throughout the State, the Bureau of Employee Relations provides professional support and assistance to the Governor and represents the State in the conduct of negotiations with representatives of classified employees. Negotiations cover all cost items, terms, and conditions of employment to include wages, benefits, hours and other conditions of employment.
Additionally, the Bureau administers the collective bargaining agreements; represents the State, in cooperation with the Attorney General, in all grievance actions before the Public Employee Labor Relations Board; investigates, prepares and represents the State in grievance, mediation and settlement negotiations; and, provides technical advice and interpretations to all state agencies to ensure consistent policies and practices are followed in compliance with the State’s collective bargaining agreements.
COLLECTIVE BARGAINING
The following five unions represent state employees:
• State Employees’ Association (SEA)
The State Employees’ Association of New Hampshire Inc.-SEIU Local 1984 is the exclusive bargaining representative of the majority of classified employees in the state system. Certified bargaining units represented by State Employees’ Association include:
Adjutant General Administrative Services Department Agriculture Department Banking Department Business and Economic Affairs Department Corrections Department (except Probation Parole Officers I-III and Corrections
Officer - Corporal) Education Department Employment Security Environmental Services Department Fish and Game Department (except all Conservation Officers) Health and Human Services Department Human Rights, Commission for Information Technology Department Insurance Department Labor Department Liquor Commission (except Liquor Investigators and Liquor Investigator
Sergeants) Lottery Commission Natural and Cultural Resources Department Postsecondary Education Commission Professional Licensure & Certification, Office of Revenue Administration Department

84
Safety Department (except for State Police Troopers, State Police Sgts., and State Police Command Staff)
Supervisory Unit Transportation Department Treasury Department Veterans Home
• New Hampshire Troopers Association (NHTA) The sworn non-commissioned employees of the Division of State Police have been represented by the New Hampshire Troopers Association since 1997. This bargaining unit includes the State Police Troopers and State Police Sergeants.
• New Hampshire Troopers Association – Command Staff
The State Police Command Staff group are represented by the New Hampshire Troopers Association (NHTA). This bargaining unit includes State Police Captains, State Police Lieutenants, and State Police Majors.
• New England Police Benevolent Association (NEPBA)
Certified bargaining units represented by the NEPBA currently include: NH Fish and Game Conservation Officers, Local 40 NH Fish and Game Supervisory Officers, Local 45 Liquor Investigators, Local 260 Probation Parole Officers I and Probation/Parole Officers II, Local 265 Probation Parole Officers III’s (Supervisors or Chiefs), Local 270
• Teamsters Local 633
The Teamsters Local 633 represent the following bargaining unit: NH State Corrections Officers and Corrections Officer Corporals

85
EMPLOYEES BY UNION REPRESENTATION* Fiscal Year 2019
Union # of Represented
Employees
New England Police Benevolent Association Local 40 27
New England Police Benevolent Association Local 45 15
New England Police Benevolent Association Local 260 15
New England Police Benevolent Association Local 265 58
New England Police Benevolent Association Local 270 11
New Hampshire Troopers Association 313
New Hampshire Troopers Association-Command Staff 21
The State Employees' Association of NH, SEIU Local 1984 8,707
Teamsters Local 633 317
Total 9,484
* Includes classified full-time permanent and full-time temporary employees, as well as part-time represented employees of the Liquor Commission. Part-time liquor retail store employees who work 26 weeks or more in one year and who average 10 hours per week are considered part of the bargaining unit.
* Confidential employees are excluded. * 6 classified employees did not meet any group criteria and are excluded from this report.
Report Generated 06/30/2019 by Employee Matrix Version V6.4
POSITIONS BY UNION REPRESENTATION* Fiscal Year 2019
Union # Positions
New England Police Benevolent Association 40 33
New England Police Benevolent Association 45 16
New England Police Benevolent Association 260 17
New England Police Benevolent Association 265 60
New England Police Benevolent Association 270 11
New Hampshire Troopers Association 331
New Hampshire Troopers Association-Command Staff 21
The State Employees’ Association of NH, SEIU Local 1984 10,107
Teamsters Local 633 422 Total 11, 018
*Includes classified full-time permanent and full-time temporary positions expected to last for more than 6 months as well as part-time represented positions of the Liquor Commission. *This report does not contain 13 positions found in error.
Report Generated 06/30/2019 by Position Matrix V6.2

86
MASTER NEGOTIATIONS Collective Bargaining Agreements between the State and the following unions representing state employees became effective upon execution of their respective agreements through June 30, 2019.
• State Employees’ Association (SEA) • New England Police Benevolent Association (NEPBA Locals: 40, 45, 260, 265 and 270) • NH Troopers Association • NHTA – Command Staff • Teamsters Local 633
CHANGES TO 2017-2019 CBA BETWEEN STATE AND ITS UNIONS On June 30, 2019, the State and the Unions were still bargaining. The Collective Bargaining Agreements entered ‘evergreen’ on July 1, 2019. The complete text of the current (2017-2019) Collective Bargaining Agreements with the State Employees’ Association, the NH Troopers Association, New England Police Benevolent Association and the Teamsters can be found on the Division of Personnel’s website under Employee Relations, at the following link: https://das.nh.gov/hr/labor_rel/labor_relations.aspx NEGOTIATED STATE BENEFITS
The Bureau of Employee Relations negotiates on behalf of the State of New Hampshire benefits for Executive Branch employees. Additionally, it is the responsibility of the Bureau to ensure that all of these benefits are implemented in compliance with the respective Collective Bargaining Agreements. These benefits include but are not limited to:
• Wages • Overtime and Compensatory Time • Health Insurance • Prescription Drug Plan • Wellness & Health Promotion • Dental Insurance • Life Insurance • Short Term Disability Income Protection • Basic Work Week • Schedules – Flexible or Alternative • Meal Periods and Breaks • Holidays • Annual Leave • Sick Leave • Civil Leave • Safety and Health Protection • Travel Reimbursement

87
Wages: Payroll Information
*State Employees’ Association, New England Police Benevolent Association and Teamster Bargaining Units only: Effective January 4, 2019, in accordance with Article 19.3 “Payroll Information.” The Division of Personnel in conjunction with the Bureau of Accounts and Financial Data Management worked collaboratively on removing certain pay differentials (hazard, direct care and nursing) from base pay schedules.
The “Payroll Information” article requires payroll checks to include the following information: a clear designation as to the amount and category of pay, e.g., regular, overtime or holiday pay, for which payment is made; and that any pay above base pay be separated and identified.
This project was extensive and required changes to job codes, recruitment postings, and several system configurations that affected thousands of employees.
Supplemental Sick Leave
*State Employees Association Bargaining Unit Only:
Effective January 1, 2019, the Supplemental Sick Leave program is available only after all benefits approved under the short-term disability income protection plan have been exhausted. Supplemental sick leave is additional sick leave donated by state employees to other seriously ill or injured state employees through an application to the Labor Management Committee
Supplemental sick leave is only granted for emergent serious or life-threatening illnesses, injuries, impairments, or mental or physical conditions that have caused, or are likely to cause the employee to take leave without pay; approvals depend on appropriate medical information being provided.
Short Term Disability – Income Protection Short Term Disability Income Protection is additional leave provided by the State through an application to a third-party administrator. It is designed to provide financial support to eligible state employees recovering from a non-work related injury or sickness that has left them totally disabled and unable to perform the immediate duties and responsibilities of their job. Eligible employees are full-time classified employees, employed for one year represented by the State Employees Association, the New England Police Benevolent Association, Teamsters Local 633, New Hampshire Troopers Association – Command Staff Bargaining Units, as well as unrepresented employees.

88
STATE EMPLOYEES’ ASSOCIATION SUPPLEMENTAL SICK LEAVE PLAN
Fiscal Year 2019
AGENCY Requests Submitted
Requests Approved
Days of Leave Approved
ADJUTANT GENERAL’S DEPARTMENT 1 1 41
ADMINISTRATIVE SERVICES 1 0 0
BANKING DEPARTMENT 7 7 166
CORRECTIONS DEPARTMENT 3 2 30
EDUCATION DEPARTMENT 4 4 87
EMPLOYMENT SECURITY DEPARTMENT 9 6 197
ENVIRONMENTAL SERVICES DEPARTMENT 1 0 0
FISH & GAME DEPARTMENT 0 0 0
HEATH & HUMAN SERVICES DEPARTMENT 88 63 1,482
INFORMATION TECHNOLOGY DEPARTMENT 4 4 152
INSURANCE DEPARTMENT 2 2 180
LABOR DEPARTMENT 3 3 147
LIQUOR COMMISSION 0 0 0
NATURAL & CULTURAL RESOURCES DEPARTMENT 1 1 8
SAFETY DEPARTMENT 18 16 292
TRANSPORTATION DEPARTMENT 16 12 230
VETERANS HOME 2 2 110
Total 160 123 3,122
* Total Approved Requests = 123 or 77% * Average days approved per request – 26 days

89
INCOME PROTECTION PROGRAM Fiscal Year 2019
AGENCY Number of
Applications Submitted
Number of Requests Approved
Number of Calendar Days out on STD-IP
Average Number of
Calendar Days per Application
ADJUTANT GENERAL’S DEPARTMENT
3 2 238 119
ADMINISTRATIVE SERVICES 2 2 78 39
AGRICUTLURE, MARKETS & FOOD DEPARTMENT
1
1
42
42
BANKING DEPARTMENT 4 3 243 81
CORRECTIONS DEPARTMENT 11 11 159 15
EDUCATION DEPARTMENT 1 1 57 57
EMPLOYMENT SECURITY DEPARTMENT
1 1 59 59
ENVIRONMENTAL SERVICES DEPARTMENT
5 5 60 12
FISH AND GAME DEPARTMENT 1 1 170 170
HEATH & HUMAN SERVICES DEPARTMENT
32 30 1,848 62
INFORMATION TECHNOLOGY DEPARTMENT
2 1 57 57
LABOR DEPARTMENT 1 1 108 108
LIQUOR COMMISSION 5 4 343 86
LOTTERY COMMISSION 1 0 0 0
PROFESSIONAL LICENSURE & CERTIFICATION OFFICE
1 1 10 10
REVENUE ADMINISTRATION DEPARTMENT
3 3 200 67
SAFETY DEPARTMENT 4 4 122 31
TRANSPORTATION DEPARTMENT
13 12 864 72
VETERANS HOME 1 1 41 41
Total 92 84 4,699 52
* On January 1, 2019, the SEIU became eligible for the Short-term Disability-Income Protection Plan. * There were 92 Income Protection applications submitted for fiscal year 2019; 69 more than Fiscal Year 2018. * The average number of calendar days an employee was out of work per approved application for Fiscal Year 2019 was 52; on average 43 days less than the prior Fiscal Year.

90
BUREAU OF EDUCATION AND TRAINING The Division of Personnel, Bureau of Education and Training (BET) provides education, training, and resources that enhance the skills, knowledge, and abilities of government employees who service the citizens of New Hampshire. To fulfill this mission, the Bureau is committed to the following guiding principles:
• Deliver cost-effective, quality training using skilled and knowledgeable trainers, facilitators, teachers, and eLearning tools.
• Offer a variety of training opportunities designed for adult learners. • Provide training resources and consulting services to state agencies. • Provide training specified by RSA 21-I: 42.
BET Program Summary BET delivered the following programs in FY 2019:
• Certified Public Manager Program – Level I and Level II • Department of Health and Human Services –Supervisor Certificate Program II Program • Human Resource Certificate Program • Lean Process Improvement Initiatives and Certificate Programs – Lean White, Yellow,
Green, and Black Belts • Foundations of State Supervision and Foundations Review • Professional skill development resources and classes • 2018 & 2019 Sexual Harassment Training (Online) • 2018 & 2019 Respect in the Workplace Training (Online)
The total number of student enrollments for all programs in FY 2019 was 1,150. This was an increase of 114 enrollments over FY 2018. BET’s uptick in enrollment was the result of curriculum changes and an increased number of course offerings. BET’s FY 2019 faculty included one full-time professor, three part-time professors, and three contracted faculty. In addition, BET had one part-time position: a Staff Development & Training Specialist. In May 2019, the part-time Staff Development & Training Specialist position was changed to full-time. In addition, two full-time Division of Personnel employees provided support for BET’s courses and initiatives. BET’s continued enrollment growth combined with the expiration of the Training Center lease at 130 Pembroke Street in June of 2019 were motivators to explore securing a larger space that better supported training needs.
BET Fiscal Year 2019 Programming
New Hampshire Certified Public Manager Program Since FY 1996, the Bureau has offered a Certified Public Manager Program (CPM) for New Hampshire: state, county, municipal and school district employees. The aim of the NHCPM program is to establish a standardized level of professionalism in public management. The program uses a system of competency-based training to measure and then develop participants’ professional competencies in the field of public management.
91
• The Level I program is available to supervisors and individuals who planned to enter a
supervisory role. The Level I program takes students one year to complete with over 150 hours of core course work. Successful completion of the program earns participants the designation of Certified Public Supervisor (CPS).
• The Level II program is available to supervisors and managers who had already successfully completed Level I. Level II required an additional 120 hours of core course work as well as participation in a team project that required 60 to 100 hours of time. Students that completed the program earned the Certified Public Manager® (CPM) designation. The CPM designation is a registered service mark of the National Certified Public Manager Consortium. The BET Certified Public Manager® program is nationally accredited.
• In 2017, a partnership with DHHS provided DHHS employees with the opportunity to
complete program requirements for the CPS program. This new program, called Supervisory Certificate Program (SCP) II, enrolled 15 students in its inaugural year, with similar enrollment numbers the following year. By the end of FY 2019, 46 students had completed this program.
• In Fiscal Year 2019, there were 69 graduates from the Level I program and 31 graduates
from Level II. For the DHHS-SCP-CPS program, there were 14 graduates. We were at full capacity by the end for April 2019.
• BET sponsored the third annual L.E.A.D. (Leadership, Effectiveness, Accountability, and Development) Symposium in May of 2019 as a venue to display the CPM student capstone projects. More than 125 people attended.
• Both the CPS and CPM designations are deemed professional rather than academic
credentials. However, a number of colleges and universities do recognize the course work. BET established agreements with the following NH colleges and universities to grant college credit for completion of the Certified Public Supervisor and the Certified Public Manager programs: University of New Hampshire; Granite State College, Plymouth State University, New England College and Springfield College.
• The Certified Public Manager (CPM) program was re-accredited by the National CPM
Consortium (NCPMC) in October 2018. The New Hampshire CPM program has secured accreditation through 2024. Two BET employees secured seats on the NCPMC Board.
Lean Process Improvement Initiatives
• The Bureau delivered certificate programs and provided instructors/facilitators for on-site Lean, process improvement projects.
• BET faculty secured a seat on the NH Lean Executive Committee and participated in the planning and program development of the NH Lean Network events and the NH Lean Annual Summit.
• The Bureau, in conjunction with the Financial Data Management (FDM) and the Department of Administrative Services, hosted and maintained a website for the NH Lean Network: Lean NH.gov

92
We reduced the Lean programs classroom size to a maximum of 15 students to increase the effectiveness of learning transfer. The total enrollment for the FY 2019 was 241, which was 42 students less than FY 2018. In FY 2019 BET also conducted on-site yellow belt training at DHHS and DOS. BET delivered the following programs to state and municipal employees:
• Lean White Belt o 107 students completed and passed the Moodle - online Lean White Belt course. o BET established Lean White Belt as a pre-requisite for Lean Yellow Belt.
• Lean Yellow Belt o 178 students participated in the 3-day hands-on introduction to the philosophy and
methodology of Lean process improvement, including 81 students as part of the Certificated Public Supervisor Program.
• Lean Green Belt o 41 students participated in the three-day program that was focused on how to
guide a group through the Lean process and the techniques required to move a group through a range of challenges when initiating organizational change and/ or managing implementation.
o This was the same number of participants as FY 2018.
• Lean Black Belt o 9 students participated in the Black Belt program, the highest level of Lean
Certification that has been offered by BET. o Black Belt students developed a deeper understanding of all aspects of Lean
transformation across the entire government system.
• Lean Networking Meetings o Meeting were held monthly to foster the sharing of information and experience by
lean practitioners. Additionally, BET led two municipal training sessions in Lean Yellow Belt and delivered a Lean for Leaders webinar for members of the NH Municipal Association. Foundations of State Supervision This two-day program offers state supervisors and managers an interactive and systematic applied learning experience that improved employee performance. Participants develop an understanding of the state personnel rules and effective strategies to build a culture of respect in the workplace. In May of 2015, Governor Hassan directed all department supervisors to attend and complete Foundations of State Supervision. To facilitate this directive, BET Professor Frank Nugent launched an outreach initiative that promoted and coordinated efficient program delivery to accommodate department and agency needs. In FY 2019, 104 state employees participated in the program. BET also developed a focused train-the-trainer program that supported agency trainers that were tasked with delivering Foundations content to agency personnel. 70 employees attended the Foundations Review half-

93
day class - this was a refresher and was recommended to Foundations of State Supervision students that attended on or before 2016. DES, DHHS, DOT and DOS participated in the Foundations train-the-trainer program. Human Resources Certificate Program BET launched a revitalized version of the Human Resources Certificate in February of 2018.
• In February 2019, we offered this program - 12 students enrolled. • The 15-session program provided a foundation in human resource management at the
technical, operational, relationship, and strategic levels for employees who wants to further their career in Human Resources within government/public sector.
• The program explores key federal, state and local laws, and connects the three roles of HR professionals (compliance, consulting, and advocacy) with the different aspects of HR responsibilities and the employment cycle.
State of New Hampshire – Bureau of Education and Training - eLearning
• The Bureau of Education and Training made significant progress in further developing the statewide online learning management system (LMS) in FY 2019.
• BET continued to establish itself as the best option for a centralized online learning management resource for State of New Hampshire employees.
o During FY 2019 BET reestablished the State of New Hampshire MOT (Moodle Oversight Team) and further developed strategic partnerships with agencies throughout the state.
o BET continued to collaborate with the Department of Information Technology and Financial Data Management to ensure a great user experience for our online students.
o The State of NH LMS added three new agencies to the Moodle LMS platform during FY 2019.
• During FY 2019 BET brought four fully functional courses online. (Lean White Belt, Sexual Harassment Training, Respect in the Workplace Training, and the Statewide Computer Use Policy Training)
o Three of the four courses brought online during FY 2019 were compliance initiatives that had a mandatory completion requirement associated with them.
o Making this course content easily available online and trackable was a tremendous time and resource saver for the agencies that participated.
• During FY 2019, BET offered monthly compliance reporting to all participating agencies. o This was a great victory and agencies frequently voiced their appreciation!
• During FY 2019 BET hired a new Online Instructional Designer/eLearning developer.
o This helped pave the way for much of the progress detailed above. o BET staffing concerns have not yet been completely resolved. As our
online/eLearning presence grew, so did the level of support required to support our agencies in the manner that they required.

94
• BET’s new Online Instructional Designer/ eLearning developer eliminated course development limitations addressed in last year’s Annual Report.
o Our new Online Instructional Designer introduced an affordable set of tools that allowed us to maximize the non-enterprise LMS platform we had.
o Taking advantage of industry leading development tools and current business practices positioned BET, as a trusted resource for online learning needs of State of New Hampshire employees.
• A great demand for an “Enterprise” class Online Learning Management System was voiced by many agencies.
o BET continued to collaborate with participating agencies as well as DoIT and FDM in an effort to secure an Enterprise LMS.
o Securing an Enterprise class LMS will equip BET to grow with the demand that our internal customers are voicing.
• While budgetary constraints did prohibit BET from securing the new LMS mentioned in last year’s Annual Report, recruitment of an instructional designer did allow BET to make additional online learning available to every state employee in FY 2019.
• FY 2019 was an exciting and productive year for the Bureau of Education and Training’s online/ eLearning presence.
o As we closed out FY 2019, we recognize our accomplishments and committed to make quality eLearning available to employees of the State of New Hampshire.
Professional Development Classes BET reconfigured its delivery of classes and faculty workloads to offer a wide range of professional development classes in FY 2019. BET developed more applied learning classes. In FY 2019, BET delivered the following classes to 753 state, local, and county employees. Prepaid Training Packages for State Agencies In FY 2019, BET offered State agencies the opportunity to purchase a package of training to respond to training needs and provide a more efficient, cost-effective way to expand access to BET programs.
• The package included BET’s core professional development courses and programs including a Lean White Belt class, One Agency Lean Yellow Belt team, Foundations of State Supervision, Business Writing, Conflict Resolution, Communication Skills, Customer Service, Dealing with Difficult People, Personnel Rules, and online learning basics.
• Agencies had the opportunity to invest in their employees’ development for $10 per employee.
The following agencies took advantage of the Pre-Paid Program:
• Agriculture, Health and Human Services, NH Lottery Commission, and Safety/Division of Fire Standards & Training, Safety/Department of Motor Vehicles, Revenue, and NH Employment Security.

95
COURSES HELD BY BUREAU OF EDUCATION AND TRAINING Fiscal Year 2019
Course Title Number of Participants
Americans W/Disabilities Act 9 Balanced Scorecard Program 55 Business Etiquette 20 Business Writing 60 Change Management 7 Coaching Employees 10 Communication Skills 63 Conflict Resolution 26 Creating a Culture of Customer Service 26 Creative Problem Solving 24 Customer Service 34 De-Escalating Anger 15 Ethics/Integrity in Government 18 Family Medical Leave Act 14 Let's Talk I 23 Managing At A Distance 12 Managing Difficult Employees 25 Managing-Union Environment 9 MBTI 61 Motivating Employees 7 Organizational Behavior 31 Organizational Dev- Offsite 8 Performance Evaluation 20 Personnel Rules 29 Preparing For Diff Discussions 7 Proactive Leadership 4 Program Evaluation- 1 Day 11 Project Management 18 Public Speaking 31 Strategic Planning 18 Time Management 43 Understanding & Valuing Differences 15 Total 753