2019 index of economic and community progress - solano …
TRANSCRIPT
1
f
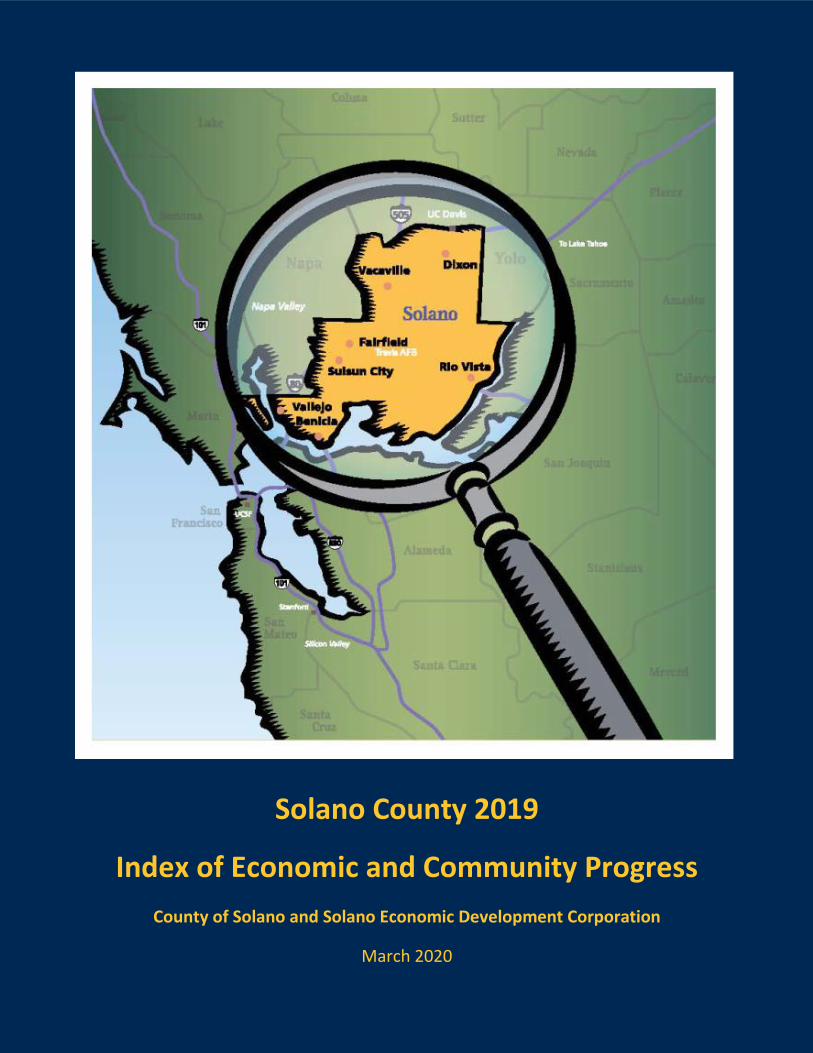
Solano County 2019
Index of Economic and Community Progress
County of Solano and Solano Economic Development Corporation
March 2020

Solano County 2019
Index of Economic and Community Progress
The Solano County Index of Economic and Community Progress is a project that was launched in 2007 after a
series of economic summits identified a need for more fact-based information to guide efforts by public and
private sector leaders to expand Solano County’s economy and support its long-term viability.
Three comprehensive editions were produced for 2008, 2009 and 2010 by the consultant Collaborative
Economics for the County of Solano and the Solano Economic Development Corporation. These insightful
documents provided an objective analysis of key indicators shaping the local economy.
In 2011, the Index became a project for County staff, in cooperation with the Solano EDC, to maintain and
update throughout the year. The Index was expanded to include comparisons in many instances to the
Sacramento Area, the Bay Area, California and the United States. The 2012 to 2019 editions include the
objective analysis of Dr. Robert Eyler from Economic Forensics and Analytics (www.econforensics.com).
All of the annual index reports, as well as several in-depth analyses of local industry clusters, can be found at
www.solanocounty.com/economicindex.

1
Index of Economic and Community Progress
s we are in one of the difficult periods of time in modern history as a result of the COVID-19 pandemic, it seems even more important to provide to you our 12th annual Solano County Index of Economic and Community Progress. Like previous years, the intent of this report is to provide a comprehensive analysis of various indicators, capturing trends shaping our local economy while providing long-term perspectives and considerations for economic
development. While most of the underlying data was gathered up to the previous twelve-month period, it was also imperative to provide current context and prospective considerations of the effects of the COVID-19 pandemic.
The purpose of the analysis is and has been to guide our policies and programs as well as aspirations to grow the health of our regional economy. Our data-based understanding of the short- and long-term effects of the current crisis will unfold in the weeks and months to come. However, having a strong grasp of our economy leading up to our recent downturn will provide a better understanding of the expected impacts and guidance on how we will emerge as a stronger and healthier region.
Solano Job Growth Continues The County continued to add jobs in 2019, however this was at a milder growth pace than the previous year, one percent compared to 3.1 percent in 2018. Through the end of 2019, unemployment continued its downward trend to 3.7 percent, down from 4.0 percent the previous year. To gauge, unemployment is generally considered to represent full employment at four percent. Largest numerical gains occurred in the Construction, Healthcare, Bars/Restaurants and the miscellaneous “All other industries” Sectors, combined adding a net new 2,700 jobs. Sectors with a net decrease in jobs included Agriculture, Manufacturing, and Retail, with a combined 1,300 jobs lost.
Employment data will reveal significant job loss in the coming months particularly in industries effected by anxiety of virus spread and “social-distancing” orders such as retail, restaurants, business services, tourism/hospitality, and many others.
The Bigger Picture Leading up to the COVID-19 crisis, our economy remained on a course of growth, albeit relatively mild to moderate. The analysis of the short- and long-term effects of the pandemic has only begun as traditional data sources have not yet reported on job, investment and income effects. The longer-term impacts on Solano’s economy will largely be a result of the resilience and structure of the regional economy prior to the onset of virus and policy effects. Equally as important is the need to make well-informed policy decisions based on sound economic information.
Moving Solano Forward The 2017 launch of our countywide campaign Solano Means Business encompasses the idea of a collective regional action plan for economic development that is bringing more economic opportunities to the Cities and County of Solano. The strategy has had tangible positive effects on the economy. In consideration of the unfolding crisis, regional and local economic development is more important than ever, and Moving Solano Forward will be revisited in 2020 to meet the needs of our regional economy as new data emerges.
Sincerely,
Erin Hannigan Robert Burris Chairwoman President
Solano County Board of Supervisors Solano Economic Development Corporation
A

2
Index of Economic and Community Progress
Contents Solano County Key Facts ......................................................................................................................................................................... 3
Key Highlights from the 2019 Index ........................................................................................................................................................ 4
COVID-19 and Solano County ....................................................................................................................................................5 Index Overview ....................................................................................................................................................................................... 6
Our Changing Economy ........................................................................................................................................................................ 14
Labor Markets ......................................................................................................................................................................... 15 Annual Local Industry Employment ............................................................................................................................................ 15
Total Non-Farm Employment ...................................................................................................................................................... 16
Unemployment Rate Comparisons ............................................................................................................................................. 17
Total Employed Residents Comparisons ..................................................................................................................................... 18
Cities Overview: Labor Markets .................................................................................................................................................. 19
Employment in Base Industries and Locally-Serving Industries .................................................................................................. 20
Long-Term Jobs Forecast to 2030 ............................................................................................................................................... 21
Businesses and Incomes .......................................................................................................................................................... 22 Non-Employer Businesses ........................................................................................................................................................... 22
Gross Product Change by Industry Sector ................................................................................................................................... 23
Gross Product Deflator and Local Cost of Living ......................................................................................................................... 25
Tourism Industry: Supporting Visitors ......................................................................................................................................... 26
Personal Income .......................................................................................................................................................................... 27
Sources of Personal Income ........................................................................................................................................................ 28
Business Affordability: Wages ..................................................................................................................................................... 29
Median Household Income Comparisons ................................................................................................................................... 30
Poverty Rates .............................................................................................................................................................................. 31
Agriculture................................................................................................................................................................................... 32
Housing and Commercial RE Demand ...................................................................................................................................... 33 Commercial Real Estate Pricing and Vacancy .............................................................................................................................. 33
Building Permits .......................................................................................................................................................................... 34
Housing “Deep Dive” ............................................................................................................................................................... 35 Median Home Prices: Two Perspectives ..................................................................................................................................... 35
Rental Prices ................................................................................................................................................................................ 35
Housing Stock .............................................................................................................................................................................. 36
Housing Prices Versus Median Household Income: Affordability ............................................................................................... 37
Market Dynamics: Housing Forecasts ......................................................................................................................................... 38
Market Dynamics: Housing Burden, Owners and Renters .......................................................................................................... 38
Market Dynamics: Building Permits for Housing through 2023 .................................................................................................. 39
CalTrans Forecast for Housing Units versus MTC ........................................................................................................................ 40
Housing Type Comparison, 2010 to 2019: What was built?........................................................................................................ 40
Homeownership since 2010 ........................................................................................................................................................ 41
Regional Housing Needs Allocation (RHNA) ................................................................................................................................ 41
Our Changing Community ..................................................................................................................................................................... 42
People..................................................................................................................................................................................... 43 Population Growth ...................................................................................................................................................................... 43
Population Growth Projections ................................................................................................................................................... 44
Components of Population Change ............................................................................................................................................ 45
Dependency Ratios ..................................................................................................................................................................... 46
High School Graduation Rates ..................................................................................................................................................... 47
UC/CSU-Readiness ...................................................................................................................................................................... 48
Workforce Readiness and Supply ............................................................................................................................................ 49 Labor Force Participation Rates .................................................................................................................................................. 49
City Overview: Education, Housing and Income ......................................................................................................................... 50
Broadband and Computer Access ............................................................................................................................................... 52
Commuting: Time to Work in the Car ......................................................................................................................................... 53
Quality of Place Index ............................................................................................................................................................. 54 Data Sources and Methodology .............................................................................................................................................. 55

3
Index of Economic and Community Progress
Solano County Key Facts
Area
Rural land area 675 square miles
Urban land area 150 square miles
Water area 84 square miles
2019 Population (January 1, 2019) 441,307
Benicia 27,570
Dixon 19,794
Fairfield 117,149
Rio Vista 9,416
Suisun City 29,447
Vacaville 98,807
Vallejo 119,544
Unincorporated 19,580
Population Change: 2018 to 2019 (Jan 1) +2,205
Solano County 2030 Population Est. 472,048 (CA Dept. of Finance, estimate as of Jan 2020)
Top 5 Employment Sectors (as of Dec. 2019)
Education & Health Services 29,000
All Government (incl. US Military) 24,800
Retail Trade 18,000
Leisure & Hospitality 16,100
Construction 12,600
Manufacturing 12,400
Total Industry Jobs (Dec. 2019) 145,100
Employment to Housing Units (2019) 90.9%
Employment to Housing Units (2010) 79.3%
Educational Attainment (2014–18 Avg.)
Less than high school 12.0%
High school graduate only 23.3%
Some college, no degree 28.3%
Associate’s degree 10.1%
Bachelor’s degree 18.3%
Graduate or Professional degree 7.9%
Age Distribution of Pop (2014–18 Avg.)
Under 5 years old 6.1%
5 to 19 18.8%
20 to 44 33.7%
45 to 64 26.7%
65 and older 14.7%
Ethnic Composition of Pop (2014–18 Avg.)
White 38.5%
Hispanic 26.1%
Asian 15.0%
African-American 13.6%
Other (incl. mixed race/Pacific Islander) 6.8%
Building Permits Issued, New Housing Units (Fiscal Year 2018–19) 1,066
Sources and Notes: 1. Population and housing data come from California Department of Finance (www.dof.ca.gov), March 2020. 2. Employment data come from California Employment Development Department (www.edd.ca.gov), March 2020. 3. Employment to housing unit ratios help city and county development planning for efficient municipalities and
transit networks. A ratio of 100 percent suggests a balance in housing units and commuting workers. Ratios below 100 percent suggest the local economy has more residents working outside than those coming into the local area to work; ratios above 100 suggest rising numbers of commuters from outside the local area.
4. Demographic data from the Census Bureau’s American Community Survey (factfinder.census.gov), Mar 2020. 5. Building Permits data were provided by the County of Solano for fiscal year 2018-19, ending June 30, 2019.

4
Index of Economic and Community Progress
Key Highlights from the 2019 Index Our Changing Economy
• Solano County employers hired 1,400 more workers in 2019 to a total 145,100 workers; this is a 1.0 percent increase from 2018.
• Farm jobs fell by 300 in 2019, while non-farm jobs increased by 1,700 workers (1.1 percent growth) at Solano County businesses, government, and nonprofit employers.
• Approximately 201,700 residents of Solano County were employed in 2019, 700 more than 2018.
• Solano County’s unemployment rate was 3.7 percent at the start of 2020, the lowest rate on record for Solano County’s economy.
• Based on the most recent available data, inflation-adjusted (real) gross product for Solano County grew by 2.0 percent in 2018 (the latest data), slightly slower than both California and the national economy.
• Solano County’s real personal income per person increased in 2018, the most recent available data.
• Median household income also increased in 2018 after inflation.
• Employment in industries focused on sales outside Solano County (“base” industries) increased by an estimated 267 jobs in 2019, led by more state government jobs, wholesale and finance.
• Solano County median wages in 2019 increased from 2018 for local workers, though wages remain lower than the Bay Area and California on average.
• Data on poverty rates for local residents in 2018 (the latest data), based on five-year averages, showed continued progress; Solano County’s poverty rate fell by more than a full percentage point to 10.4 percent of all residents in 2018 from 2017.
• The latest data on regional cost of living show rising cost levels in Solano County by 2.8 percent in 2018 (the latest data), with local inflation outpacing state and national averages in 2017.
• Local farmers gained in 2018 (the latest data) from 2017 to the highest level of agriculture value since 2010. Nursery products, processed tomatoes, alfalfa, beef cattle, and wine grapes were the top five agriculture products in terms of value harvested.
Our Changing Community
• Solano County’s population increased by 0.5 percent in 2018, and 6.8 percent since 2010.
• Population growth included 740 new residents moving to Solano County from other places.
• Solano County’s population is forecasted to grow from 2020 to 2030 by approximately 6.5 percent, slightly faster than the state average.
• Solano County’s graduation rate increased to 84.9 of those eligible, slightly ahead of the state average for the 2018-19 academic year.
• African-American students in Solano County continue to graduate at a higher rate than California on average.
• Housing prices increased 0.3 percent in 2019 to $448,200 at the median; housing affordability in Solano County increased. Rental prices increased to a median price of $2,109 for all rentals in Solano County as of January 2020.
• Recent allocations of housing units from state government assigned over 3,600 more units need to be built to balance supply and demand in Solano County.
• 1,066 building permits were issued for new homes for fiscal year 2018-19, the most since 2006-07. Approximately 2.1 million square feet of commercial space was permitted during fiscal year 2018-19, over three times the square feet from the previous fiscal year.
• Commute times to work increased in 2018 by 2 minutes on average from 2017 for Solano County residents.
• Solano County government revenue from property values and taxable sales continued to rise in 2019. Assessed property values increased to over $57 billion in 2019.
Considerations for the Future The COVID-19 crisis of 2020 is likely to dominate the data in the Index for two years minimum, and the evolution of Solano County’s economy depends greatly on its exit from this crisis into the early 2020s. The national and state economies both started 2020 with forecasts of slower growth, with no forecasted recession until 2022 at the earliest. Forecasts for the remainder of 2020 are likely showing a national and state recession due to the COVID-19 crisis. Amid crisis, there are opportunities for Solano County after 2020.

5
Index of Economic and Community Progress
COVID-19 and Solano County In February 2020, a flu outbreak (subsequently known as Coronavirus or COVID-19) in Asia began to
transmit worldwide due to travel, trade and slow-moving social policies. As of March 2020 (the time of this
writing), most of the world’s advanced economies (and some countries in sub-Saharan Africa, Central
America, and other emerging economic regions) engaged in social policies meant to reduce the potential
strain on healthcare resources at the cost of potential economic recession.
The subsequent economic slowdown may cast a shadow for years. This index, since the 2012 edition, has
considered 2010 as a benchmark year from which recovery from the Great Recession in Solano County
began. Because Solano County has relative strong balance among goods-producing and services-producing
and government employment versus California overall, silver linings for Solano County may exist relative to
other counties. However, pain will be felt throughout the state economy.
The social policy of “shelter-in-place” affects California’s economy in many ways, including Solano County.
Most of the local economy went into hibernation, though some parts do remain open; Solano County
continued to allow construction during shelter-in-place and Travis AFB may be a stabilizing factor to the
economy as it continues to operate as a military installation and also as an extension of healthcare
capacity. Tourism businesses (hotels, retail and restaurants focused on visitors) were hurt first and likely
are the last employers to return to normal once social policies are lifted.
In the United States, economic policy reactions included the largest, “bailout” fiscal-spending package in
history and new monetary policy reminiscent of the Great Recession (2008-10) policy reactions. Data such
as unemployment insurance claims and notices of default on home loans – data this Index followed during
the Great Recession – are likely focal data for 2020. Visitor spending data is to be keenly watched,
including hotel demand (with implications on transient occupancy tax (TOT) revenues), taxable retail sales
(visitor spending, cars and other consumer durables) and restaurant meals. Visitors include inbound,
commuting workers that come to Solano County along Interstates 80, 505, and 680.
The short-term economic effects on Solano County depend on the depth and duration of social policies.
Economics teach us that the progression of this disease’s effects on the macroeconomy, given the
measures in place and likely to continue in the first two quarters of 2020, affect labor markets primarily.
Economic development may face a tough choice of where to focus support efforts based on strategic
decisions by local businesses to remain in business due to reduced revenues and pessimistic forecasts.
Housing markets are currently predicted to see some price depression; due to an inability to maintain
mortgage payments from job loss or a need to move during or after this crisis, we should expect an
increase in existing homes for sale and also an increase in notices of default and foreclosures.
City and county government revenues are going to be lower on multiple fronts. Reduced taxable sales,
property values and transient occupancy taxes all lead to local government budget challenges in two fiscal
years (2020-21 and 2021-22) minimum. Equity market downturns may also strain public pension funds
both for revenue reasons (returns on investment) but also increased liability reasons (health services costs
rising and rising retirements as public employees observe incentives to retire). In short, the data in this
edition of the Index provides prologue and a benchmark; 2020 is likely to be a challenging year for Solano
County and California, where some opportunities also exist for Solano County and discussed in this report.
6
Index of Economic and Community Progress
Index Overview
Solano County jobs growth continues to over 145,000 workers. For a ninth consecutive year, non-farm employment in
Solano County increased. Approximately 1,700 more workers
were hired at non-farm employers in Solano County, a 1.1
percent increase; farm jobs contracted by -300. From 2010
to 2019, since the Great Recession ended, Solano County
employers added a total of 24,100 jobs. New construction
jobs increased by 1,400 jobs in 2019, supporting overall
county employment growth. Healthcare workers, including
non-profit, health services, increased by 300 jobs in 2019.
Manufacturing jobs contracted a bit in 2019 by -300 jobs, a reduction for the first time
since 2011. Jobs in wholesale services increased by 300 jobs, while jobs in financial services
had zero new workers. Almost 14 percent of retail jobs located in Solano County were lost
in 2019, down 700 workers. The state and national economies also expanded non-farm
jobs, with both areas rising slightly faster than Solano County in percentage terms.
The Broader Context: State and National Economic Updates The California and national economy entered
2020 with jobs and income expansions at the
longest period on record. Specifically, non-
farm jobs grew for California by 1.7 percent in
2019. Jobs forecasts for California’s economy
through 2023 were initially set by the
California Department of Finance (DOF) in
January 2020 at approximately 1.0 percent
per year on average; the DOF baseline
forecast pointed to California’s labor market
remaining near full employment to 2023. Growth of personal income before inflation was
forecasted to grow annually at 4.3 percent to 2023; from 2011 through 2019 growth in real
personal income was approximately 5.5 percent
annually for the state. Consumer spending and taxable
sales growth rise with personal income levels.
The national economy experienced continued jobs
growth in 2019 (+1.4 percent). However, interest rate
reductions took place to bolster waning business
investment and consumer spending levels to boost
stable but slowing inflation rates during a time of jobs
expansion; lower rates helped stock markets recover
from a flat 2018 to surge ahead in 2019. As 2019
ended, the Federal Reserve signaled interest rates
would be likely be left stable in 2020; the COVID-19
crisis has forced may central banks worldwide to lower
In 2019, Solano County
employment increased by
1.0%, approximately 1,400
more jobs than 2018 across
farm and non-farm employers.
Initial forecasts entering 2020
suggested a slower, but strong
economy to 2023. The national and
state economics are now likely to
enter recession in 2020 because of
the COVID-19 crisis.
The Federal Reserve cut
interest rates three times in
2019, a reflection of
concerns over too low of
inflation rates. The COVID-
19 aftermath in March 2020
has forced the Federal
Reserve to drop short-term
interest rates near zero.

7
Index of Economic and Community Progress
interest rates to stave off major economic downturns. The effects of both fiscal and monetary
stimulus in 2020 at unprecedented levels may pressure inflation upward after 2021; unfortunately, a
national recession is likely as of this writing in March 2020. Future inflation pressure depends very
much on national and global reactions to how the COVID-19 crisis ends in 2020. We see later that
both Solano County and California have recently shown faster cost of living increases versus national
costs of goods and services. Costs of living measures are influenced by housing costs.
Housing and Commercial Permits Grew Quickly in 2019, While Prices Were Flat
Solano County housing prices were
forecasted to have a relatively flat year in
2020 as of a January 2020 forecast by
ZillowTM Research. The median sale price for
homes in Solano County was approximately
$448,200 in December 2019, up 0.42
percent from the previous year according to ZillowTM Research. Median home prices in California
overall grew just 1.76 percent in 2019 to just under $556,900. Regional fires in 2019 were large again
-- the Kincaid Fire in Sonoma, Napa and Lake counties was one of the largest in California’s history in
terms of square miles -- but less destructive to property and lives; potential power shutoffs have now
added more, annual uncertainty to being a resident of and business in California. Projected
population and jobs growth suggest medium- to long-term support remains for home values and
economic development in Solano County. The COVID-19 crisis may change Solano County’s housing
market in multiple ways.
Solano County’s housing and commercial real estate permit and building activity rose sharply in fiscal
year 2018-19 (July 1 to June 30) versus fiscal year 2017-18. Residential building permits activity in
fiscal year 2018-19 saw 1,066 new housing units
permitted. Commercial square feet under construction
was up by approximately 2.01 million square feet
between July 2018 and June 2019; 83.2 percent of new
commercial real estate was in Fairfield, Vacaville and
unincorporated Solano County. The COVID-19 crisis in
2020 is likely to slow down statewide construction
activity through 2020 as compared to 2019; Solano
County continued to allow construction work during
shelter-in-place as an essential industry. Because
construction in Solano County is related to goods movement, including fulfillment centers, food
logistics and consumer goods, allowing construction to continue prepares Solano County for growth
once the social policies lift in 2020.
New and expanding businesses may need more and varied commercial space. Data on vacancy and
pricing come from Colliers International. Office space available in Solano County was at 19.2
percent vacancy for Class A space, and approximately 8.0 percent for Class B office space as 2019
ended. Industrial space in Solano County, including manufacturing space and warehousing, had 5.0
percent vacancy as of December 2019, continuing to trend down. Price changes were flat for Class
A space ending 2019 at approximately $2.43 per square foot, while prices for Class B increased over
ZillowTM Research predicted Solano
County home prices in 2020 to fall by
0.1 percent as of January 2020.
Solano Economic Development
Corporation faces challenges
and opportunities to attract,
expand and retain businesses
once the COVID-19 crisis passes
for Solano County.

8
Index of Economic and Community Progress
10 percent for the second year in a row to $2.21 per square foot in Solano County. In contrast, San
Francisco County has a median price of $10.32 per square foot on average for Class A space as of
Q4 2019, where there is less than 5.0 percent vacancy.
Solano Economic Development Corporation (EDC) continues with an economic development
strategy focused on the following industry clusters:
As these industry clusters hire more workers, that expansion positively affect countywide demand
for housing, retail sales, commercial real estate, and businesses hiring even more workers.
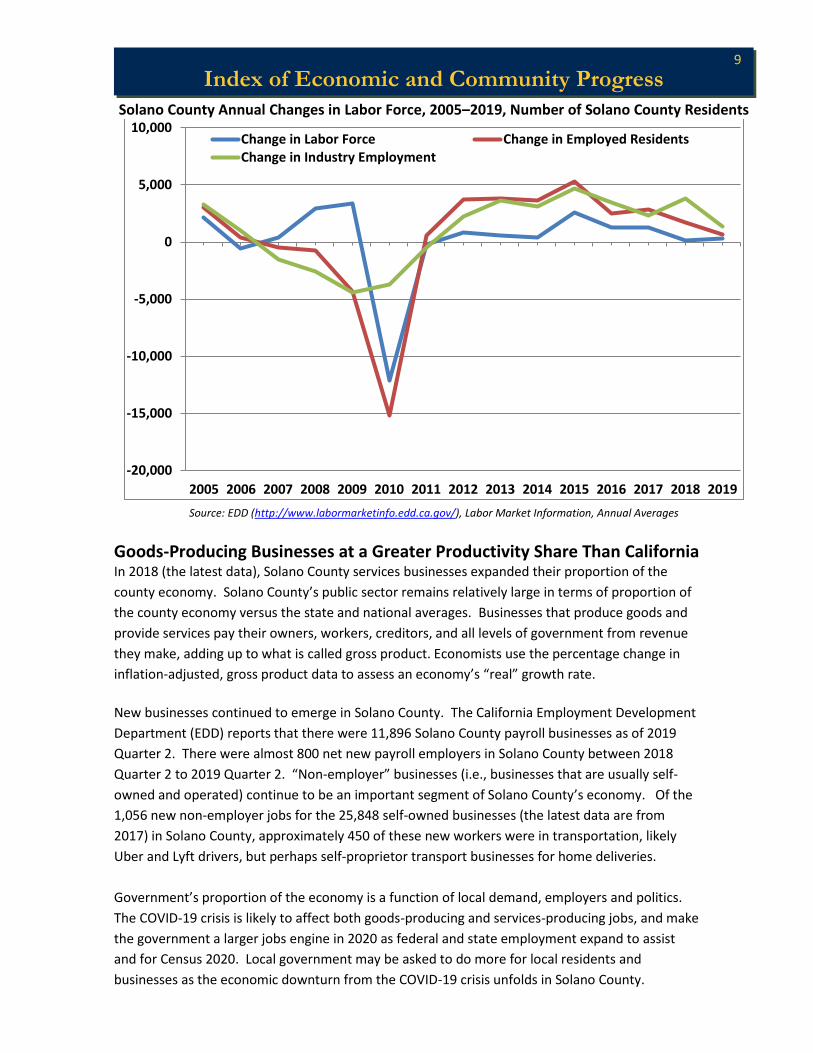
Solano County Labor Markets: Growth Flattened in 2019 Solano County’s residents working or looking for work (the labor force) increase in 2019 by just
0.1 percent; as the county unemployment rate continued to fall, another 700 county residents in
the labor force found work.
The number of employed
residents grew by 14.0
percent in Solano County
while the labor force has
grown by only 3.5 percent
since 2010. These data, and
the jobs data shown above,
suggest that Solano County’s
economy grew more due to its local businesses than its working residents in 2019. Jobs growth
by industry shows how construction jobs stood out for Solano County in 2019.
Solano County Employment 2019 Annual Average Gains and (Losses) of Jobs Since 2010, 2017 and 2018
Since 2010 Since 2017 Since 2018
Industry Gain/(Loss) % Chg. Gain/(Loss) % Chg. Gain/(Loss) % Chg.
Agriculture (Farm) 0 0.0% -400 -22.2% -300 -17.6% Bars and Restaurants 2,500 24.8% 900 7.7% 500 4.1% Construction 5,400 75.0% 2,000 18.9% 1,400 12.5% Federal Government (incl. Travis AFB) -1,000 -21.7% -100 -2.7% 100 2.9% Financial Activities 0 0.0% 100 2.0% 0 0.0% Healthcare 5,670 38.3% 1,430 7.5% 300 1.5% Information (Software and Publishing) -100 -7.7% 100 9.1% 100 9.1% Local Government Education 600 6.9% -200 -2.1% -200 -2.1% Manufacturing 2,700 27.8% 100 0.8% -300 -2.4% Retail Trade 1,600 9.8% -600 -3.2% -700 -3.7% State Government Excl. Education 200 4.3% 100 2.1% 100 2.1% Wholesale Trade 200 4.8% 200 4.8% 0 0.0% All Other Industries 3,700 19.4% 1,000 4.2% 400 1.0% Total, All Industries (Farm + Non-Farm) 24,100 19.9% 5,200 3.7% 1,400 1.0%
Source: EDD (http://www.labormarketinfo.edd.ca.gov/), Labor Market Information, Annual Data, Chg. = Change
Comparison of Solano County Labor Force Components, 2010 to 2019 Number of Workers and Percent Change Annual Averages
Number of Workers Percent Change
2010 2018 2019 2010 2018
Labor Force 202,400 209,300 209,500 3.5% 0.1% Employed Residents 177,000 201,000 201,700 14.0% 0.3% Unemployment Residents 25,400 8,300 7,900 -68.9% -4.8% Industry Employment 121,000 143,700 145,100 19.9% 1.0%
Source: EDD (http://www.labormarketinfo.edd.ca.gov/), Labor Market Information, Annual Averages; a new benchmark of 2019 was set with some revisions.
• Advanced Materials;
• Biotech/Biomed;
• Food and Beverages;
• Logistics; and
• Travis Air Force Base.
9
Index of Economic and Community Progress
Solano County Annual Changes in Labor Force, 2005–2019, Number of Solano County Residents
Source: EDD (http://www.labormarketinfo.edd.ca.gov/), Labor Market Information, Annual Averages
Goods-Producing Businesses at a Greater Productivity Share Than California In 2018 (the latest data), Solano County services businesses expanded their proportion of the
county economy. Solano County’s public sector remains relatively large in terms of proportion of
the county economy versus the state and national averages. Businesses that produce goods and
provide services pay their owners, workers, creditors, and all levels of government from revenue
they make, adding up to what is called gross product. Economists use the percentage change in
inflation-adjusted, gross product data to assess an economy’s “real” growth rate.
New businesses continued to emerge in Solano County. The California Employment Development
Department (EDD) reports that there were 11,896 Solano County payroll businesses as of 2019
Quarter 2. There were almost 800 net new payroll employers in Solano County between 2018
Quarter 2 to 2019 Quarter 2. “Non-employer” businesses (i.e., businesses that are usually self-
owned and operated) continue to be an important segment of Solano County’s economy. Of the
1,056 new non-employer jobs for the 25,848 self-owned businesses (the latest data are from
2017) in Solano County, approximately 450 of these new workers were in transportation, likely
Uber and Lyft drivers, but perhaps self-proprietor transport businesses for home deliveries.
Government’s proportion of the economy is a function of local demand, employers and politics.
The COVID-19 crisis is likely to affect both goods-producing and services-producing jobs, and make
the government a larger jobs engine in 2020 as federal and state employment expand to assist
and for Census 2020. Local government may be asked to do more for local residents and
businesses as the economic downturn from the COVID-19 crisis unfolds in Solano County.
-20,000
-15,000
-10,000
-5,000
0
5,000
10,000
2005 2006 2007 2008 2009 2010 2011 2012 2013 2014 2015 2016 2017 2018 2019
Change in Labor Force Change in Employed ResidentsChange in Industry Employment
10
Index of Economic and Community Progress
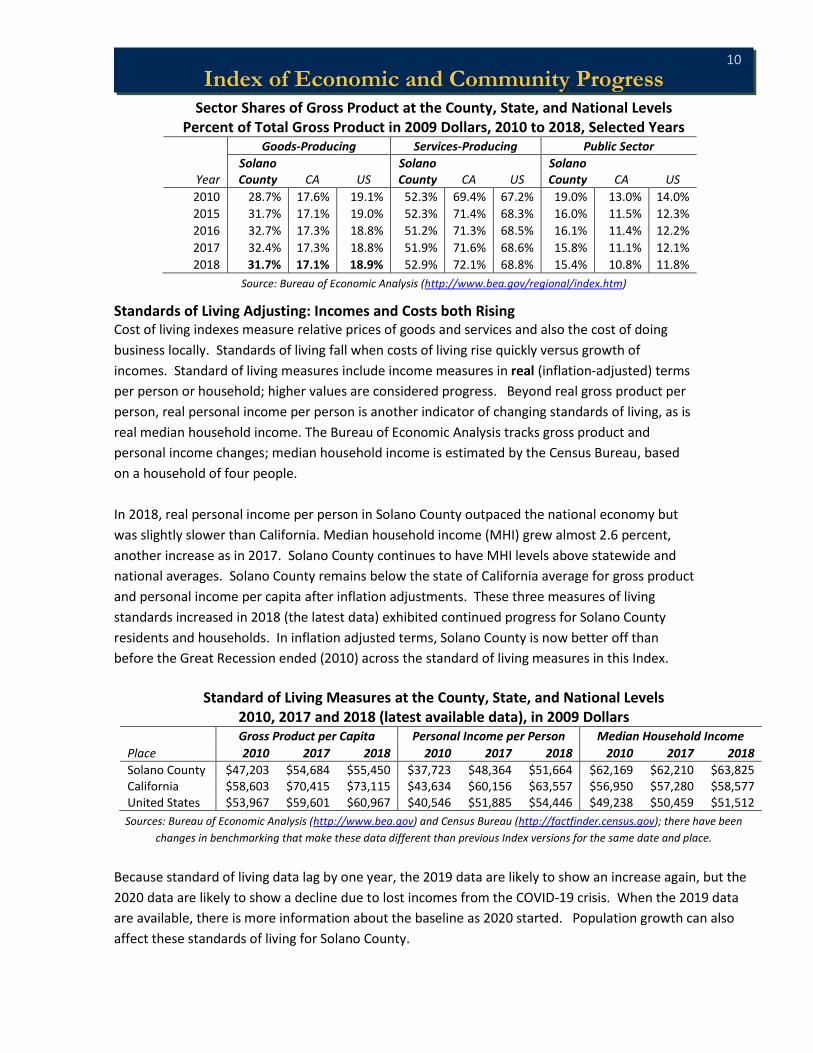
Sector Shares of Gross Product at the County, State, and National Levels Percent of Total Gross Product in 2009 Dollars, 2010 to 2018, Selected Years
Goods-Producing Services-Producing Public Sector
Year Solano County CA US
Solano County CA US
Solano County CA US
2010 28.7% 17.6% 19.1% 52.3% 69.4% 67.2% 19.0% 13.0% 14.0%
2015 31.7% 17.1% 19.0% 52.3% 71.4% 68.3% 16.0% 11.5% 12.3%
2016 32.7% 17.3% 18.8% 51.2% 71.3% 68.5% 16.1% 11.4% 12.2%
2017 32.4% 17.3% 18.8% 51.9% 71.6% 68.6% 15.8% 11.1% 12.1%
2018 31.7% 17.1% 18.9% 52.9% 72.1% 68.8% 15.4% 10.8% 11.8%
Source: Bureau of Economic Analysis (http://www.bea.gov/regional/index.htm)
Standards of Living Adjusting: Incomes and Costs both Rising Cost of living indexes measure relative prices of goods and services and also the cost of doing
business locally. Standards of living fall when costs of living rise quickly versus growth of
incomes. Standard of living measures include income measures in real (inflation-adjusted) terms
per person or household; higher values are considered progress. Beyond real gross product per
person, real personal income per person is another indicator of changing standards of living, as is
real median household income. The Bureau of Economic Analysis tracks gross product and
personal income changes; median household income is estimated by the Census Bureau, based
on a household of four people.
In 2018, real personal income per person in Solano County outpaced the national economy but
was slightly slower than California. Median household income (MHI) grew almost 2.6 percent,
another increase as in 2017. Solano County continues to have MHI levels above statewide and
national averages. Solano County remains below the state of California average for gross product
and personal income per capita after inflation adjustments. These three measures of living
standards increased in 2018 (the latest data) exhibited continued progress for Solano County
residents and households. In inflation adjusted terms, Solano County is now better off than
before the Great Recession ended (2010) across the standard of living measures in this Index.
Standard of Living Measures at the County, State, and National Levels 2010, 2017 and 2018 (latest available data), in 2009 Dollars
Gross Product per Capita Personal Income per Person Median Household Income
Place 2010 2017 2018 2010 2017 2018 2010 2017 2018
Solano County $47,203 $54,684 $55,450 $37,723 $48,364 $51,664 $62,169 $62,210 $63,825 California $58,603 $70,415 $73,115 $43,634 $60,156 $63,557 $56,950 $57,280 $58,577 United States $53,967 $59,601 $60,967 $40,546 $51,885 $54,446 $49,238 $50,459 $51,512
Sources: Bureau of Economic Analysis (http://www.bea.gov) and Census Bureau (http://factfinder.census.gov); there have been
changes in benchmarking that make these data different than previous Index versions for the same date and place.
Because standard of living data lag by one year, the 2019 data are likely to show an increase again, but the
2020 data are likely to show a decline due to lost incomes from the COVID-19 crisis. When the 2019 data
are available, there is more information about the baseline as 2020 started. Population growth can also
affect these standards of living for Solano County.

11
Index of Economic and Community Progress
Community Indicators: Continued Gains and Some Challenges Population is estimated twice annually by the
California Department of Finance, once for
the calendar year to compare to annual
Census estimates and again for county and
state fiscal-year counts (July to June) and the
components of any changes. Between July 1,
2018 and June 30, 2019, Solano County’s
population grew by an estimated 2,170
people; for the calendar year 2018, the estimated population growth was 2,205. Demographic
data for 2018 (the latest data available) show that Solano County’s population is now 37.9 years
old at the median (1.6 years older than California).
Data on high-school graduates estimated Solano County schools produced graduates at a rate
over 84.9 percent of eligible students, with 43.7 percent of graduates leaving high school eligible
for UC or CSU admission. Solano County is likely to see K-12 enrollments slowly fall over this
decade, and then begin to rebound slightly toward 2030. In terms of workforce education
levels, Solano County’s population over 25 years old has a bachelor’s degree 26.2 percent of the
time, slightly less than the state average.
Solano County’s population gained 740 new residents from other places.
Like much of northern California, and the state overall, there was a net outflow of residents due to
movement of people. A natural increase in Solano County’s population balanced the population
change for a net increase. Between July 1, 2018 and June 30, 2019, the California Department of
Finance estimated people moving to Solano County increased by 740 net new residents. Births
exceeded deaths by and estimated 1,430 in the 2018-19 fiscal year. Updated forecasts for all 58
California counties by the California Department of Finance (new as of Jan 2020) for 2020 to 2030
estimate that Solano County’s population will be 472,048 (down from 507,219 predicted in 2019).
Solano County’s graduation rate was 84.9 percent. During the 2018-19 academic year (the latest year for which data are available), Solano County's
graduation rate increased to 84.9 percent from 81.4 percent in 2017-18, ahead of California’s
average that increased slightly from 83.0 to 84.5 percent (methodology changes do not allow
historic comparisons to graduates data before 2016-17 easily, including data on students
preparing for college). The percent of graduates that were UC/CSU-ready was 43.7 percent of
Solano County graduates in 2018–19 versus 50.5 percent of graduates for the state of California.
Graduation-rate levels recently achieved are likely to be tested in 2020 and 2021 due to the
COVID-19 crisis. If family incomes drop and high-school students are forced to consider working
versus school, there may be short-term challenges for local high schools. Further, housing
market changes may shift demography toward older residents and slow down new student
growth in the early 2020s versus current forecasts. Local government is also going to be
challenged due to changing levels of sales tax and property tax revenues.
Graduation rates at Solano
County high schools were higher
than the state on average, with
gains also made in the number of
UC/CSU eligible students.

12
Index of Economic and Community Progress
Taxable sales and assessed property value continue to rise The combination of
rising home prices
and more taxable
sales suggests more
revenue for Solano
County’s city and
county governments
in 2019. Overall,
taxable sales grew
slightly after
inflation
adjustments;
inflation-adjusted,
taxable sales have
grown by 23.9
percent from fiscal
year 2009-10 to
2018-19 for the
County of Solano. Solano County should expect lower taxable sales in 2020 due to the COVID-19
crisis; the crisis’ shadow also affects transient occupancy tax (TOT) revenues in Solano County’s
cities.
Solano County’s assessed property values in the aggregate continued to grow in the 2018-19 fiscal
year; current values are used by the Solano County Assessor’s Office to set the annual tax roll. As
of June 30, 2019, the assessed value of property in Solano County was $57.6 billion, the seventh
year of increased property tax rolls in a row. Housing market fluctuations, like those during the
Great Recession (2008-10), may force property tax rolls down again due to the COVID-19 crisis.
Solano County Assessed Values for Property Tax Purposes, 2000 to 2019, in Current Dollars
Source: Solano County Assessor’s Office (current assessed value)
22.424.8
27.029.8
32.736.8
42.046.1 45.8
41.3 39.7 39.1 39.2 41.043.7 46.0
48.851.8
54.657.6
0
10
20
30
40
50
60
70
2000
2001
2002
2003
2004
2005
2006
2007
2008
2009
2010
2011
2012
2013
2014
2015
2016
2017
2018
2019
Bill
ion
s (C
urr
ent
Do
llars
)
Solano County Taxable Sales, 1996 to 2019 (estimated to year end), in 2009 Dollars
Sources: County of Solano and California Board of Equalization
(http://www.boe.ca.gov/news/tsalescont.htm)
1,000
2,000
3,000
4,000
5,000
6,000
7,000
8,000
900
1,100
1,300
1,500
1,700
1,900
2,100
An
nu
al S
ale
s Ta
x R
eve
nu
es
-M
illio
ns
Qu
arte
rly
Sale
s Ta
x R
eve
nu
es
-M
illio
ns
Annual 1st Qtr. 2nd Qtr. 3rd Qtr. 4th Qtr.

13
Index of Economic and Community Progress
Travel Times to Work and Laborshed Worsening traffic and rising employment opportunities combine for potential, negative effects
on Solano County residents. Solano Transportation Authority (STA), Metropolitan
Transportation Commission (MTC) and Solano Economic Development Corporation (Solano EDC)
continue to partner and seeking funding for projects to make other infrastructure upgrades to
Solano County’s roadway systems. Between 2010 and 2018 (the latest data available), Solano
County residents spent an extra 3.2 minutes going to work on average; the average time it takes
someone who lives in Solano County to get to work is 32.6 minutes. 60.3 percent of commuters
spend a minimum of 20 minutes getting to and from work each work day. Most commuters
leaving Solano County go to San Francisco, Contra Costa, Alameda, and Sacramento counties
according to the Census Bureau. Commute patterns remain similar to the period since 2010, but
the COVID-19 crisis may have effects on where and how people work after 2020.
Geographic Comparisons Unless stated otherwise, the 2019 Index groups counties into the following three areas
in California for the purpose of making comparisons. All of these counties, including
Solano County, can also be defined as a “super region”.
• Bay Area Other: San Francisco, Santa Clara, Alameda, San Mateo, Contra Costa, and Marin counties;
• North Bay: Sonoma and Napa counties;
• Sacramento Metropolitan Statistical Area (MSA): Sacramento, Placer, El Dorado, and Yolo counties.
Takeaways and What Is Important In previous versions of this Index, the author has ended each of the following subsections
with a brief “TAKEAWAY” and either an “OPPORTUNITY” or a “CHALLENGE” for Solano
County economic development. Due to COVID-19 and the global economy slowing down
as a result of social policies to restrict movement of workers and disease spread, 2020 is
likely to be a challenging economic year. If there is a true opportunity or a serious
challenge seen by the author, it is identified after the subsection’s TAKEAWAY. If not, we
use “For 2020” and try to point the reader to the most likely scenario for 2020 and what
next year’s Index report may reveal. The report starts with a look at Solano County’s
economy followed by community indicators.

14
Index of Economic and Community Progress
Our Changing Economy

15
Index of Economic and Community Progress
Labor Markets
Annual Local Industry Employment Solano County employers increased the number of workers hired in 2019 from the previous
year by 1,400 workers. Total payroll workers employed by Solano County businesses,
governments and non-profits (employers that are not self-employed) was 145,100 workers
at the end of 2019. This change of 1,400 more workers is a 1.0 percent increase from 2018
and the eighth year of continuous jobs growth for Solano County. Government
employment fell (due to 100 fewer workers) as a proportion of total employment versus
private-sector jobs growth.
Solano County Private and Public Sector Employment Annual Averages, 2000–2019
Source: California Employment Development Department (www.edd.ca.gov). Private- and public-sector employment levels are
indicated on the left-hand axis; share of private-sector (%) jobs to total employment is indicated on the right-hand axis.
TAKEAWAY: Solano County payroll employers hired 1,400 more workers in 2019 (1.0 percent gain), and have hired over 24,000 more workers since 2010. For 2020: As the aftermath of COVID-19 affects Solano County, it is likely that in 2020 and 2021, public employment rises as a percentage of employment for Solano County as private-sector employment falls.
74%
75%
76%
77%
78%
79%
80%
81%
82%
83%
-
20,000
40,000
60,000
80,000
100,000
120,000
140,000
2001 2003 2005 2007 2009 2011 2013 2015 2017 2019P
riva
te-S
ect
or
Pe
rce
nta
ge o
f Lo
cal I
nu
dst
ry E
mp
loym
en
t
Go
vern
me
nt
and
Pri
vate
-Se
cto
r Em
plo
yme
nt
(um
be
r o
f W
ork
ers
)
Government Employment
Private Sector Employment
Private Jobs as a Percent of Local Industry Employment

16
Index of Economic and Community Progress
Total Non-Farm Employment Agricultural jobs in Solano County slipped again in 2019 (-300 jobs); however, Solano County
employers hired 1,700 more workers in non-farm jobs in 2019 (1.1 percent gain). Since 2011,
there are 24,600 more people working at jobs in Solano County (15.6 percent growth, see
figure). Healthcare hiring led to 300 more jobs; Solano County’s healthcare sector has annual
jobs gains for thirty (30) years in a row, including three recessions. Construction employment
in Solano County saw another robust year with 1,400 new jobs in 2019. Solano County’s gain
in non-farm jobs in 2019 was in spite of 700 jobs lost in retail. Manufacturing and public
education also slipped slightly in 2019. Counties in the Bay Area Other category grew non-
farm jobs at 2.0 percent in 2019, including San Francisco County. The North Bay counties of
Sonoma and Napa had non-farm jobs growth of 1.2 percent overall in 2019, while Sacramento
County grew by 1.6 percent; the statewide average was 1.8 percent growth in 2019.
Solano County Non-Farm Employment, 2000–2019, Annual Data, Number of Workers
Source: California Employment Development Department (www.edd.ca.gov)
TAKEAWAY: Jobs in Solano County continued to grow in 2019, though at a percentage change slower than the state on average, the Bay Area and the North Bay counties. OPPORTUNITY: Because non-farm jobs in Solano County are less-dominated by services than the state of California on average, non-farm employment may see a larger percentage drop for the state than for Solano County because of the COVID-19 crisis.
119,100
143,700
100,000
105,000
110,000
115,000
120,000
125,000
130,000
135,000
140,000
145,000
2000
2001
2002
200
3
2004
2005
2006
2007
200
8
2009
2010
2011
2012
201
3
2014
2015
2016
2017
201
8
2019

17
Index of Economic and Community Progress
Unemployment Rate Comparisons Solano County’s unemployment rate was 3.7 percent as 2020 began, compared to 4.0
percent one year earlier. The drop in the unemployment rate was due to jobs growth and
approximately 200 fewer Solano County residents in the labor force in 2019 and 400 fewer
unemployed. The state of California had 4.1 percent unemployment, while the United
States overall had 3.5 percent unemployment as of January 1, 2020. San Francisco and the
Bay Area Other counties dropped below 2.5 percent unemployment as 2019 ended.
Unemployment Rate (%), January 2000 – December 2019 Comparisons Between Selected Areas, Monthly Data
Source: California Employment Development Department (http://www.edd.ca.gov)
TAKEAWAY: Unemployment rates in Solano County and California were at their lowest levels on record (since 1976) as of December 2019. FOR 2020: After years of low unemployment, Solano County is likely to see some of the largest jumps in unemployment rate history in 2020 due to the COVID-19 crisis, but potentially remain at lower unemployment rates than the state on average.
0.0%
2.0%
4.0%
6.0%
8.0%
10.0%
12.0%
14.0%
Jan
-00
Jan
-01
Jan
-02
Jan
-03
Jan
-04
Jan
-05
Jan
-06
Jan
-07
Jan
-08
Jan
-09
Jan
-10
Jan
-11
Jan
-12
Jan
-13
Jan
-14
Jan
-15
Jan
-16
Jan
-17
Jan
-18
Jan
-19
Jan
-20
Solano County CA Sac MSA Bay Area Other North Bay

18
Index of Economic and Community Progress
Total Employed Residents Comparisons In 2019, Solano County experienced 0.3 percent more employed residents, an increase of
approximately 700 Solano County residents working. The figure below compares Solano
County’s employed residents by index numbers to employed workers in other, selected
areas. Changes in the index are monthly, percentage changes from January 2010, the index
base month equal to 100. In December 2019, the index was 114.9, thus 14.9 percent
growth since 2010 (annual averages suggest slightly higher growth than the monthly data).
Total Employed Residents, 2010-19, Index Jan 2010 = 100
Comparisons Between Selected Areas, Seasonally-Adjusted Monthly Data
Source: California Employment Development Department (http://www.edd.ca.gov)
Percent Change in Employed Residents, Jan 2010 and Dec 2018 Compared to Dec 2019
Employed Residents 2010-19 2018-19
Solano County 14.9% 0.3%
California 16.5% 1.3%
Sacramento MSA 16.2% 1.6%
Bay Area Other 24.8% 2.7%
North Bay (Napa/Sonoma counties) 15.7% 0.5%
Source: California EDD (www.edd.ca.gov)
TAKEAWAY: Solano County has more residents working in 2019 than 2018; county residents work in multiple counties throughout northern California. FOR 2020: Levels of employed residents are likely to be lower in 2020 as the COVID-19 crisis evolves. Solano County’s residents that commute away from Solano County to jobs elsewhere, especially to urban areas such as core Bay Area counties like San Francisco and Alameda, may have longer, negative effects than those with jobs within Solano County. Cities may see two rounds of social distancing and business closures if COVID-19 returns toward the end of 2020.
80
85
90
95
100
105
110
115
120
125
130
Jan-10 Jan-11 Jan-12 Jan-13 Jan-14 Jan-15 Jan-16 Jan-17 Jan-18 Jan-19 Jan-20
Solano County CA Sac MSA Bay Area Other North Bay

19
Index of Economic and Community Progress
Cities Overview: Labor Markets Data on Solano County’s incorporated cities and their labor markets come from California’s
Employment Development Department (EDD). Jobs growth in 2019 increased slightly for all
Solano County’s cities except Rio Vista and Suisun City that had zero percent growth;
unemployment rates also fell in all cities due to both slight jobs growth and reduced labor
force levels. Solano County’s unemployment rate had an annual average of 3.7 percent.
Solano County Employed Residents by City; 2010, 2017, 2018, and 2019
Source: California EDD (www.edd.ca.gov)
Solano County Unemployment Rate by City, 2010, 2017, 2018, and 2019 (3.7% as Solano County Average at solid line for 2019)
Source: California EDD (www.edd.ca.gov)
TAKEAWAY: For Solano County cities, the number of employed residents increased in 2019 except for zero change in Rio Vista and Suisun City; with unemployment rates falling in all cities, city residents may be leaving the labor force due to retirements. FOR 2020: As unemployment rises in the wake of the COVID-19 crisis, all the cities in Solano County are likely to be affected negatively, regardless of the city’s size.
0
10,000
20,000
30,000
40,000
50,000
60,000
Benicia Dixon Fairfield Rio Vista Suisun City Vacaville Vallejo
Nu
mb
er
Emp
loye
d
2010 2017 2018 2019
0.0
2.0
4.0
6.0
8.0
10.0
12.0
14.0
16.0
Benicia Dixon Fairfield Rio Vista Suisun City Vacaville Vallejo
Pe
rce
nt
Un
emp
loye
d
2010 2017 2018 2019

20
Index of Economic and Community Progress
Employment in Base Industries and Locally-Serving Industries Economic development generally focuses on attraction, retention and expansion of “base”
or “traded-sector” industries,
businesses with markets beyond
Solano County’s borders. Base-
industry employment increased
slightly as of 2019 Quarter 2 versus
2018 Quarter 2. Solano County
jobs growth tilted toward
government jobs over those four
quarters. Warehousing and
transportation, as well as visitor
services (accommodation and food
services) industries also increased
jobs.
Construction saw a big increase in
jobs (+14.8 percent or 1,632 more
jobs), as did educational services
over these four quarters.
Healthcare jobs also saw a
continued increase. While
generally not the primary focus of
economic development efforts,
locally-serving businesses provide
local options for residents and
reduce income leakages to other
counties.
Efforts such as Moving Solano
Forward
(www.solanomeansbusiness.com)
continue to support base-industry
jobs growth. Because such
businesses draw from global
markets, more base jobs can stimulate more locally-serving jobs.
TAKEAWAY: Base industries employment increased by 267 jobs between Quarter 2 2018 and Quarter 2 2019 (the latest data), while total workers at Solano County employers increased by 2,433 over these four quarters. OPPORTUNITY: The COVID-19 crisis shows that having businesses essential to sustaining households. Economic development opportunities may expand in “essential” production as a way to provide import substitution: pharmaceuticals; chemicals; medical devices; and other advanced materials.
Solano County Base Industry Employment Second Quarter Data for 2010, 2017, 2018, and 2019
2010 Q2 2017 Q2 2018 Q2 2019 Q2
Base Industries Total 32,401 36,740 36,537 36,804 Agriculture 1,489 1,919 1,673 1,572 Mining 223 240 560 524 Wholesale Trade 3,986 4,098 4,203 4,212 Information 612 244 267 237 Finance and Insurance 991 1,001 1,047 1,070 Real Estate and Rental and Leasing 119 241 275 316 Prof., Scientific, Technical Services 266 263 306 283 Management/Consulting 1,217 966 797 763 Arts, Entertainment, and Recreation 2,455 2,860 2,833 2,822 Accommodation and Food Services 701 703 702 886 Federal government 4,975 3,702 3,548 3,579 State government 4,618 6,043 5,400 5,982 Manufacturing 6,109 9,378 9,816 9,559 Retail Trade 2,334 2,360 2,249 2,070 Transportation and Warehousing 2,306 2,722 2,861 2,929
Locally-Serving Industries Total 68,902 83,937 86,804 92,771 Utilities 480 586 585 593 Construction 7,119 9,993 11,047 12,679 Information 586 244 267 237 Finance and Insurance 2,323 1,001 1,047 1,070 Real Estate and Rental and Leasing 1,218 241 275 316 Prof, Scientific, Technical Services 3,121 263 306 283 Admin/Waste Management Services 6,579 5,607 6,059 5,387 Educational Services 1,537 1,217 1,322 2,034 Healthcare and Social Assistance 12,777 23,406 24,068 25,914 Arts, Entertainment, and Recreation 222 2,860 2,833 2,822 Accommodation and Food Services 438 349 437 496 Other Services 3,097 3,847 3,734 4,475 Local Government 15,380 16,061 16,077 15,847 Local Portion of Retail Trade 13,281 15,540 15,886 17,689 Local Portion, Trans and Warehouse 744 2,722 2,861 2,929
Jobs in industries unassigned 21,332 18,141 18,315 14,591
Sources: Bureau of Labor Statistics (www.bls.gov) and its Quarterly Census of Wages and
Employment (QCEW), Calculations by Author (“Unassigned” jobs in industries that serve a
mix of local and export markets).

21
Index of Economic and Community Progress
Long-Term Jobs Forecast to 2030 CalTrans, the California Department of Transportation, forecasts socioeconomic indicators for
all 58 California counties and the state overall annually. Projected jobs growth from 2019 to
2030 in Solano County is shown here as positive but slower growth than the state overall to
2030. Construction jobs in Solano County are forecasted to contract; such a change may be
due to assumed growth in the early 2020s, followed by a slowdown as home and commercial
construction reaches a short-term peak. Farm jobs and all other industries, except for
Information (software and publishing), are forecasted to grow positively to 2030. These data
change each year as CalTrans gains new information; the forecasts can be seen as
opportunities for economic development professionals.
Solano County Estimated Percentage Change (%) in Jobs by Industry Sector, 2019 to 2030
Sources: California EDD (www.edd.ca.gov) and CalTrans (www.caltrans.org)
TAKEAWAY: As of 2019, Solano County had a positive jobs-growth forecast of 5.5 percent in net from 2019 to 2030, slower than for the state overall (7.3 percent). OPPORTUNITY: For economic development, Solano County has opportunities to attract and expand industries that have portable jobs (workers can work from home) and also essential businesses (e.g., healthcare and construction). While this forecast is from before the COVID-19 crisis in 2020, California’s and Solano County’s emergence from the crisis may ultimately lead to little change in jobs growth predictions to 2030.
7.3%5.5%
1.4%
-11.1%
5.5%
4.7%
3.1%
2.1%
10.3%
-0.3%
15.3%
4.7%
4.8%
-15.0% -10.0% -5.0% 0.0% 5.0% 10.0% 15.0% 20.0%
Total Wage & Salary
Farm
Construction
Manufacturing
Transportation, Utilities
Wholesale & Retail Trade
Financial Activities
Professional Services
Information
Health & Education
Leisure
Government
Solano County California

22
Index of Economic and Community Progress
Businesses and Incomes
Non-Employer Businesses The growth of transportation and warehousing businesses for self-employed, “non-
employer” businesses since 2010 to 2017 (the latest data available) outpace the sum of all
other new self-employed businesses created for Solano County (287 percent growth as
shown in the figure). This is likely due to drivers being workers for businesses such as
Uber, Lyft, and Amazon Prime. Non-employer businesses hire fewer than four (4) workers,
and are generally self-employed businesses. The Census Bureau estimates the number of
non-employer businesses to track total business entities in the United States. Of Solano
County’s 1,056 self-employed businesses that newly opened in 2017, 42.6 percent were
transportation/warehousing businesses. As of 2017, there were approximately 25,850
such businesses operating in Solano County.
Solano County Non-Employers, Percent (%) Change in Number of Firms and Business Revenues, 2017 Compared to 2010
Source: Census Bureau (http://data.census.gov)
TAKEAWAY: Jobs in transportation as Uber and Lyft drivers continue to dominate growth of new, small business formation of firms with less than four, non-payroll employees since 2010. The data continue to lag 24 to 36 months. FOR 2020: While these data lag, the COVID-19 crisis and implications from 2019’s Assembly Bill (AB) 5’s definition of a worker may change how these workers approach remains in business. These smaller businesses may not be as plentiful after 2020 for some time due to the COVID-19 crisis hitting smaller, self-owned businesses harder that larger businesses.
287%
-100% -50% 0% 50% 100% 150% 200% 250% 300% 350%
Finance and insurance
Wholesale trade
Professional, scientific, and technical services
Mining, quarrying, and oil and gas extraction
Retail trade
Health care and social assistance
Admin, Support and Waste Mgmt services
Information
Other services (except public administration)
Construction
Educational services
Real estate and rental and leasing
Agriculture, forestry, fishing and hunting
Accommodation and food services
Arts, entertainment, and recreation
Manufacturing
Transportation and warehousing
Change in Revenues Change in Firms

23
Index of Economic and Community Progress
Gross Product Change by Industry Sector Gross product measures how employers add value to raw materials and create goods and
services. Gross County Product (GCP) data show Solano County continued to grow across
industry sectors and countywide in 2018 (the latest data available). While public-sector
employers remain important, including Travis Air Force Base, private-sector services have
grown in terms of their proportion of income generated for county business.
Gross Product Share (%) by Major Sector, 2001-18 Proportions in Solano County Over Time, in 2009 Dollars
Source: Bureau of Economic Analysis (www.bea.gov)
TAKEAWAY: Since 2010, the public sector has become smaller as a proportion of Solano County’s economy to 2018, as private-sector services businesses saw more gross product growth during 2018 than goods-producing or public-sector employers. FOR 2020: Due to the COVID-19 crisis, 2020 is likely a year where the public sector increases as a percentage of the total gross product for Solano County versus private-sector industries due to an economic contraction.
0.0%
10.0%
20.0%
30.0%
40.0%
50.0%
60.0%
70.0%
80.0%
90.0%
100.0%
20
01
20
02
20
03
20
04
20
05
20
06
20
07
20
08
20
09
20
10
20
11
20
12
20
13
20
14
20
15
20
16
20
17
20
18
Private goods-producing industries Private services-providing industries Government

24
Index of Economic and Community Progress
Gross product growth rates slowed down in 2017 and 2018 for Solano County, where
county gross product growth was 2.0 percent in 2018. Healthcare, advanced
manufacturing, retail, and construction remain foundations of Solano County’s economy;
finance and non-durable manufacturing gross product (food and beverage mainly)
contracted a bit in 2018. Government is approximately 15.4 percent of gross product in
Solano County in 2018 (the latest data available) down from 15.8 percent in 2017.
Gross Product Growth Annually, 2002–2018, Percent (%) Growth Solano County, California and the United States Overall, in 2009 Dollars
Source: Bureau of Economic Analysis (www.bea.gov)
TAKEAWAY: Solano County’s gross product growth after inflation at 2.0 percent in 2018 (the latest data available) was slower than the national economy (2.9 percent), and almost half the growth of California (4.3 percent) on average. The increase in the gross product deflator (see below) in Solano County partially accounts for slower growth. FOR 2020: Increasing unemployment from reduced consumer and business demand for goods and services in 2020 due to the COVID-19 crisis is likely to make gross product growth negative for Solano County in 2020. This is similar to the depths of the Great Recession (2008-10). Much depends on the number of jobs and businesses lost as a result of COVID-19 social restrictions and the supportive effects of fiscal and monetary stimulus packages by federal and state governments.
-6.0%
-4.0%
-2.0%
0.0%
2.0%
4.0%
6.0%
8.0%
10.0%
20
02
20
03
20
04
20
05
20
06
20
07
20
08
20
09
20
10
20
11
20
12
20
13
20
14
20
15
20
16
20
17
20
18
Solano County California United States

25
Index of Economic and Community Progress
Gross Product Deflator and Local Cost of Living The Gross Product Deflator (GP Deflator) is technically the ratio of nominal to real
(inflation-adjusted) gross product; the GP Deflator is a price index that converts the
value of production today to its purchasing-power level as of a base year from the past.
The Consumer Price Index (CPI) is closely related to the GP Deflator; while there is no
official CPI data available for Solano County, the GP Deflator can act as a proxy. Changes
in this deflator index may or may not suggest economic expansion or contraction alone.
The GP Deflator is the percentage change in the cost of living from the last year locally.
For Solano County, a 2.8 percent change (as in 2018, the latest data available) means, it
is 2.8 percent more expensive to live in Solano County since the previous year, but does
not suggest how expensive it is to live in Solano County versus national, state or other
regional economies.
GP Deflator, Percent (%) Change, Solano County Compared to US and CA, 2002-18
Source: Bureau of Economic Analysis, Regional Data (http://www.bea.gov/regional)
TAKEAWAY: Solano County’s cost of living (2.8 percent) grew slightly faster than the state and national rates of change (2.0 percent and 2.4 percent) respectively. OPPORTUNITY: Demand and jobs contraction in Solano County due to the COVID-19 crisis in 2020 may generally lower costs for consumers and businesses, providing incentives to spend. Lower prices also reduce the cost of living for lower-income residents and families in Solano County to offset potential income reductions.
0.0%
0.5%
1.0%
1.5%
2.0%
2.5%
3.0%
3.5%
4.0%
4.5%
5.0%
5.5%
6.0%
20
02
20
03
20
04
20
05
20
06
20
07
20
08
20
09
20
10
20
11
20
12
20
13
20
14
20
15
20
16
20
17
20
18
Solano County California United States

26
Index of Economic and Community Progress
Tourism Industry: Supporting Visitors Recent, regional fires in northern California reduced the number of visitors to places like
Sonoma, Napa, Butte, and Shasta counties in 2018; the fires’ effects were also felt in Solano
County. Spending by visitors to Solano County support an array of local attractions, retail
and restaurant employers, and their workers. The figure compares Solano County business
revenues from visitors to the state overall, as well as visitor-related employment. Solano
County has over 6.5 percent of non-farm jobs in 2018 (the latest data available) directly
supporting visitors.
Tourism Jobs and Spending, Visitors Spending in Solano County and California 1992 to 2018, Index 2010 = 100
Source: Dean Runyan Associates (http://www.deanrunyanassociates.com)
TAKEAWAY: Solano County tourism jobs did not grow or shrink in 2018, while statewide jobs supporting visitors grew slightly. Tourism spending in Solano County increased in 2018 versus 2017. CHALLENGE: Because of social restrictions on gathering and travel due to the COVID-19 crisis in 2020, Solano County’s visitor industries are likely (as for most of the state of California) to have economic development challenges (businesses and jobs lost) for a longer period during and after 2020 than other industries.
0
20
40
60
80
100
120
140
160
0
20
40
60
80
100
120
140
160
1992
1993
1994
1995
1996
1997
1998
1999
2000
2001
2002
2003
2004
2005
2006
2007
2008
2009
2010
2011
2012
2013
2014
2015
2016
2017
2018
Tou
rism
Jo
bs
Tou
rism
Sp
end
ing
Solano County Spending California Spending
Solano County Jobs California Jobs
27
Index of Economic and Community Progress
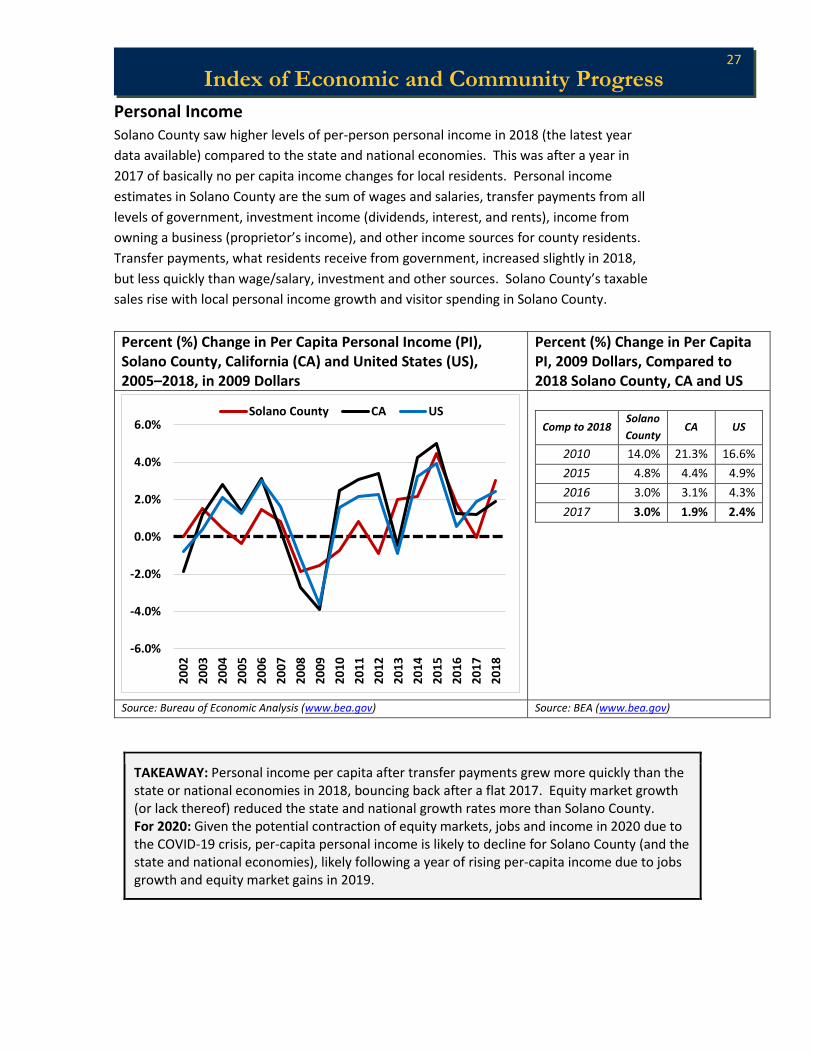
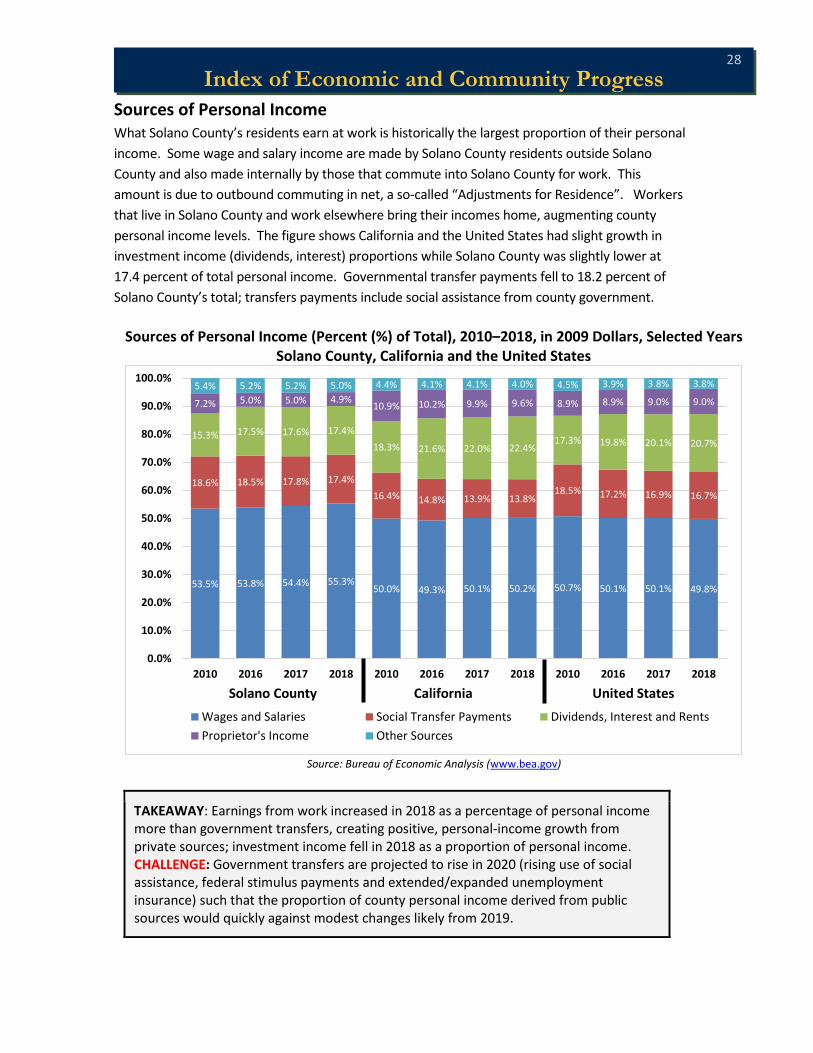
Personal Income Solano County saw higher levels of per-person personal income in 2018 (the latest year
data available) compared to the state and national economies. This was after a year in
2017 of basically no per capita income changes for local residents. Personal income
estimates in Solano County are the sum of wages and salaries, transfer payments from all
levels of government, investment income (dividends, interest, and rents), income from
owning a business (proprietor’s income), and other income sources for county residents.
Transfer payments, what residents receive from government, increased slightly in 2018,
but less quickly than wage/salary, investment and other sources. Solano County’s taxable
sales rise with local personal income growth and visitor spending in Solano County.
Percent (%) Change in Per Capita Personal Income (PI), Solano County, California (CA) and United States (US), 2005–2018, in 2009 Dollars
Percent (%) Change in Per Capita PI, 2009 Dollars, Compared to 2018 Solano County, CA and US
Comp to 2018 Solano
County CA US
2010 14.0% 21.3% 16.6%
2015 4.8% 4.4% 4.9%
2016 3.0% 3.1% 4.3%
2017 3.0% 1.9% 2.4%
Source: Bureau of Economic Analysis (www.bea.gov) Source: BEA (www.bea.gov)
TAKEAWAY: Personal income per capita after transfer payments grew more quickly than the state or national economies in 2018, bouncing back after a flat 2017. Equity market growth (or lack thereof) reduced the state and national growth rates more than Solano County. For 2020: Given the potential contraction of equity markets, jobs and income in 2020 due to the COVID-19 crisis, per-capita personal income is likely to decline for Solano County (and the state and national economies), likely following a year of rising per-capita income due to jobs growth and equity market gains in 2019.
-6.0%
-4.0%
-2.0%
0.0%
2.0%
4.0%
6.0%
20
02
20
03
20
04
20
05
20
06
20
07
20
08
20
09
20
10
20
11
20
12
20
13
20
14
20
15
20
16
20
17
20
18
Solano County CA US
28
Index of Economic and Community Progress
Sources of Personal Income What Solano County’s residents earn at work is historically the largest proportion of their personal
income. Some wage and salary income are made by Solano County residents outside Solano
County and also made internally by those that commute into Solano County for work. This
amount is due to outbound commuting in net, a so-called “Adjustments for Residence”. Workers
that live in Solano County and work elsewhere bring their incomes home, augmenting county
personal income levels. The figure shows California and the United States had slight growth in
investment income (dividends, interest) proportions while Solano County was slightly lower at
17.4 percent of total personal income. Governmental transfer payments fell to 18.2 percent of
Solano County’s total; transfers payments include social assistance from county government.
Sources of Personal Income (Percent (%) of Total), 2010–2018, in 2009 Dollars, Selected Years Solano County, California and the United States
Source: Bureau of Economic Analysis (www.bea.gov)
TAKEAWAY: Earnings from work increased in 2018 as a percentage of personal income more than government transfers, creating positive, personal-income growth from private sources; investment income fell in 2018 as a proportion of personal income. CHALLENGE: Government transfers are projected to rise in 2020 (rising use of social assistance, federal stimulus payments and extended/expanded unemployment insurance) such that the proportion of county personal income derived from public sources would quickly against modest changes likely from 2019.
53.5% 53.8% 54.4% 55.3%50.0% 49.3% 50.1% 50.2% 50.7% 50.1% 50.1% 49.8%
18.6% 18.5% 17.8% 17.4%
16.4% 14.8% 13.9% 13.8%18.5% 17.2% 16.9% 16.7%
15.3% 17.5% 17.6% 17.4%
18.3% 21.6% 22.0% 22.4%17.3% 19.8% 20.1% 20.7%
7.2% 5.0% 5.0% 4.9%10.9% 10.2% 9.9% 9.6% 8.9% 8.9% 9.0% 9.0%
5.4% 5.2% 5.2% 5.0% 4.4% 4.1% 4.1% 4.0% 4.5% 3.9% 3.8% 3.8%
0.0%
10.0%
20.0%
30.0%
40.0%
50.0%
60.0%
70.0%
80.0%
90.0%
100.0%
2010 2016 2017 2018 2010 2016 2017 2018 2010 2016 2017 2018
Wages and Salaries Social Transfer Payments Dividends, Interest and Rents
Proprietor's Income Other Sources
Solano County California United States

29
Index of Economic and Community Progress
Business Affordability: Wages Data on hourly wages is available by occupation and by industry employer from California’s
Employment Development Department (California EDD). Occupational wage data for jobs
in Solano County helps compare to other regional economies and the state overall by
categorical occupation. San Francisco and San Jose are over 140 percent of California’s
median wage level in 2019, while Solano County’s median wage of $20.32 remains just
under that median wage of $20.86. Solano County’s labor market remains a place to earn
higher wages across many occupations than the state average.
Solano County and California 2019 Wages and Occupations, 2019 Dollars Compared to Other Areas as a Percent (%) of Median Wages ($/hour) in California
Source: Employment Development Department, Occupations Data (www.edd.ca.gov), Q1 2019, 2010 Data Adjusted for Inflation Wages in GREEN are for occupations where Solano County median wages are greater than California wages.
TAKEAWAY: The gap between Solano County’s median wage per hour ($20.32) and the state median wage ($20.86) grew in 2019, with many occupations are now paying higher median wages in Solano County (shown in GREEN), mainly in services jobs. FOR 2020: One of the unknowns to come from the COVID-19 crisis is how many people will remain out of work for a sustained period of time. Such increases in unemployment put downward pressure on wages; we may also see the legislated, minimum-wage ascension slowed by the Governor’s Office in California per Senate Bill 3 (SB 3) from 2017 to support employers and provide incentives to re-hire.
Occupational Categories CA
Solano County Wages
Solano County
Napa County
Sonoma County
Sacra- mento MSA
Alameda County
San Jose MSA
San Francisco
County
Total all occupations $20.86 97.4% $20.32 98.4% 99.3% 101.2% 115.8% 141.7% 142.9% Management Services $58.54 86.2% $50.46 92.2% 88.1% 88.5% 109.8% 131.6% 129.1% Business and Financial Operations $36.31 99.0% $35.93 97.7% 93.9% 96.6% 108.6% 119.1% 121.4% Computer and Mathematical $50.53 82.0% $41.45 75.7% 83.7% 85.4% 104.0% 119.5% 117.9% Architecture and Engineering $46.65 90.1% $42.02 88.7% 97.7% 102.3% 100.6% 117.8% 108.9%
Life, Physical, and Social Science $38.84 124.4% $48.31 112.9% 98.7% 95.4% 105.3% 108.0% 123.0% Community and Social Services $25.20 92.6% $23.33 105.8% 95.2% 104.7% 109.1% 111.6% 111.8%
Legal Services $49.59 81.8% $40.57 123.2% 97.3% 101.3% 95.2% 140.3% 136.7% Education, Training, and Library $27.59 89.0% $24.55 94.3% 96.9% 93.9% 98.4% 107.0% 106.1% Arts, Design, Entertainment, Sports, and Media $28.88 80.5% $23.25 81.4% 94.0% 80.4% 87.4% 111.9% 121.3% Healthcare Practitioners and Technical $43.35 101.9% $44.18 104.7% 96.0% 111.6% 112.6% 119.5% 129.5% Healthcare Support Services $17.61 112.1% $19.74 108.4% 112.2% 104.2% 107.0% 116.1% 143.7% Protective Services $23.22 188.3% $43.72 101.9% 116.7% 100.6% 105.5% 90.3% 98.0% Food Preparation and Serving-Related $12.60 100.2% $12.63 109.0% 103.7% 97.0% 109.1% 108.4% 121.2%
Building and Grounds Cleaning and Maintenance $15.22 93.8% $14.27 97.4% 108.3% 101.2% 118.6% 112.0% 109.4% Personal Care and Services $12.49 100.6% $12.56 104.6% 111.4% 98.8% 107.2% 107.4% 113.1%
Sales and Related Services $15.48 93.4% $14.46 119.5% 111.6% 95.3% 108.3% 129.8% 138.0% Office and Administrative Support $19.38 100.8% $19.53 107.9% 104.5% 99.8% 111.0% 117.6% 126.1% Farming, Fishing, and Forestry $11.95 114.4% $13.67 136.2% 124.7% 99.2% 135.6% 99.3% 131.6% Construction and Extraction $27.02 103.1% $27.87 111.6% 109.1% 95.7% 115.8% 111.8% 115.2% Installation, Maintenance, and Repair $24.51 107.1% $26.24 100.0% 102.2% 98.6% 112.9% 111.3% 119.7% Production Jobs $16.82 124.9% $21.00 122.5% 108.0% 100.8% 111.2% 114.9% 111.4% Transportation and Material Moving Services $16.32 102.2% $16.68 109.8% 109.9% 97.9% 115.6% 112.9% 123.9%
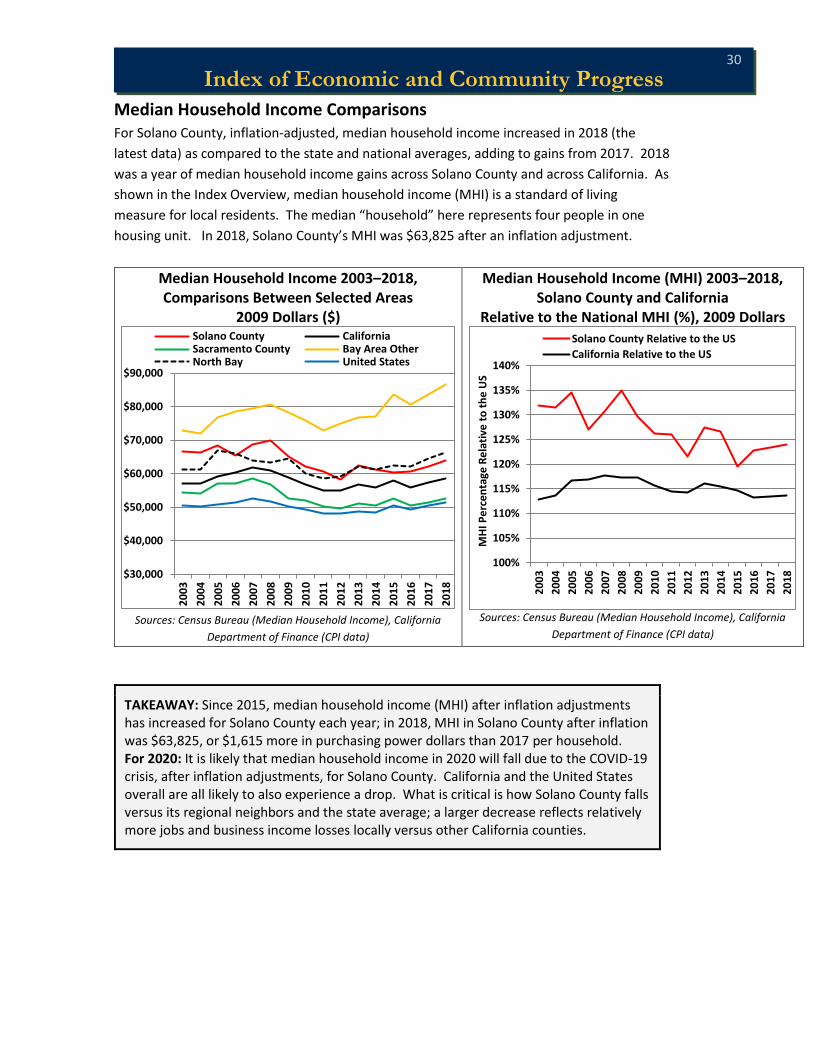
30
Index of Economic and Community Progress
Median Household Income Comparisons For Solano County, inflation-adjusted, median household income increased in 2018 (the
latest data) as compared to the state and national averages, adding to gains from 2017. 2018
was a year of median household income gains across Solano County and across California. As
shown in the Index Overview, median household income (MHI) is a standard of living
measure for local residents. The median “household” here represents four people in one
housing unit. In 2018, Solano County’s MHI was $63,825 after an inflation adjustment.
Median Household Income 2003–2018, Comparisons Between Selected Areas
2009 Dollars ($)
Sources: Census Bureau (Median Household Income), California
Department of Finance (CPI data)
Median Household Income (MHI) 2003–2018, Solano County and California
Relative to the National MHI (%), 2009 Dollars
Sources: Census Bureau (Median Household Income), California
Department of Finance (CPI data)
TAKEAWAY: Since 2015, median household income (MHI) after inflation adjustments has increased for Solano County each year; in 2018, MHI in Solano County after inflation was $63,825, or $1,615 more in purchasing power dollars than 2017 per household. For 2020: It is likely that median household income in 2020 will fall due to the COVID-19 crisis, after inflation adjustments, for Solano County. California and the United States overall are all likely to also experience a drop. What is critical is how Solano County falls versus its regional neighbors and the state average; a larger decrease reflects relatively more jobs and business income losses locally versus other California counties.
$30,000
$40,000
$50,000
$60,000
$70,000
$80,000
$90,000
20
03
20
04
20
05
20
06
20
07
20
08
20
09
20
10
20
11
20
12
20
13
20
14
20
15
20
16
20
17
20
18
Solano County CaliforniaSacramento County Bay Area OtherNorth Bay United States
100%
105%
110%
115%
120%
125%
130%
135%
140%
20
03
20
04
20
05
20
06
20
07
20
08
20
09
20
10
20
11
20
12
20
13
20
14
20
15
20
16
20
17
20
18
MH
I Pe
rce
nta
ge R
ela
tive
to
th
e U
S
Solano County Relative to the US
California Relative to the US

31
Index of Economic and Community Progress
Poverty Rates Poverty rates continued to improve across
Solano County. The American Community
Survey (ACS) of the Census Bureau tracks
poverty rates, the percent of people with
annual incomes below the federal poverty
line. These poverty rates are based on
averages over five years from Census-style
surveys. Solano County has a lower poverty
rate than both the United States and
California on average since 2010; in 2018
(the latest data) the rate was 10.4 percent.
Since 2010, Vallejo continues to have a
relatively high poverty rate among Solano
County cities.
Poverty Rates, 2012, 2016, 2017, 2018 Percentage of Residents (%), Solano County Cities and County Overall
Source: American Community Survey (ACS) Table DP03: http://data.census.gov
TAKEAWAY: Poverty rates continue to fall across Solano County in 2018 (the latest data). For 2020: Poverty rates in 2020 and perhaps 2021 in Solano County are likely to rise and hit already high-rate places like Dixon, Rio Vista and Vallejo first and hardest, but such a change depends greatly on changes in income levels and the number of jobs for local residents.
10.4%
0.0%
2.0%
4.0%
6.0%
8.0%
10.0%
12.0%
14.0%
16.0%
18.0%
Benicia Dixon Fairfield Rio Vista SuisunCity
Vacaville Vallejo SolanoCounty
2012 2016 2017 2018
Poverty Rates, 2012, 2016, 2017, 2018; Percent (%) of Residents in Solano County, California and United States
Source: American Community Survey (ACS) Table DP03:
http://factfinder.census.gov
10.4%
0.0%
2.0%
4.0%
6.0%
8.0%
10.0%
12.0%
14.0%
16.0%
18.0%
Solano County CA US
2012 2016 2017 2018

32
Index of Economic and Community Progress
Agriculture
Agricultural values continued to climb in 2018 (the latest data), with rising harvest volumes and
revenue for ranchers. Agriculture is a base industry for Solano County, focused primarily on markets
outside Solano County. Solano County maintains food and beverage manufacturing, which connect to
local farmers through a supply chain. The Solano County Agricultural Commissioner’s annual data (the
Crop Report) showed processed tomatoes sharply increased in value (+28.4 percent) in 2018. Grapes
experienced also increased in value, as did calves and cattle. After another strong winter of rain in
2019 and continued, global economic growth, values are likely to improve again in the 2019 data.
Total Agricultural Value, Solano County and California, 2004 to 2018
Current Dollars, Index 2004 = 100
Sources: BEA (www.bea.gov) and Solano County Agricultural Commissioner
TAKEAWAY: Agricultural values increased in 2018 for the third year in a row. OPPORTUNITY: As the wine industry goes through a cyclic glut of wine due to large harvests in 2018 and 2019, Solano County may be a place where agricultural processing and warehousing/distribution becomes a larger part of Solano County and the wine industry. Further, as an essential industry, agriculture may fare better in 2020 than other industries for Solano County.
0
50
100
150
200
2004 2005 2006 2007 2008 2009 2010 2011 2012 2013 2014 2015 2016 2017 2018
Ind
ex (
20
04
= 1
00
)
Solano County CA
Solano County Top 10 Agricultural Industry Revenues ($) 2010, 2015, 2016, 2017, and 2018 Sorted by 2018 Values
Agricultural Product 2010 2015 2016 2017 2018
Total Solano County $259,398,000 $353,869,000 $347,172,000 $354,556,000 $363,977,000
Nursery Products $23,352,000 $37,648,000 $39,754,000 $44,627,000 $43,248,000
Tomatoes (Processed) $36,901,400 $42,156,000 $33,843,000 $27,022,000 $34,720,000
Alfalfa $19,742,700 $34,821,000 $22,267,000 $25,612,000 $31,746,000
Cattle/Calves $22,608,000 $27,556,000 $9,192,000 $25,113,000 $30,367,000
Grapes $9,274,800 $14,988,000 $19,560,000 $20,369,000 $29,404,000
Almonds $8,468,100 $23,603,000 $35,917,000 $38,619,000 $29,299,000
Sunflower Seeds $7,845,300 $6,904,000 $11,414,000 $17,233,000 $25,203,000
Walnuts $31,161,700 $37,912,000 $44,822,000 $47,358,000 $25,133,000
Wheat $9,672,700 $9,092,000 $7,428,000 $7,261,000 $7,580,000
Sheep $6,355,600 $6,684,000 $9,339,000 $6,032,000 $3,721,000
All Other Ag Products $81,895,800 $112,505,000 $113,636,000 $95,310,000 $103,556,000
Source: Solano County Agricultural Commissioner
(http://solanocounty.com/depts/agriculture/crop_report/2009_2018.asp)

33
Index of Economic and Community Progress
Housing and Commercial RE Demand
Commercial Real Estate Pricing and Vacancy Solano County saw commercial real estate vacancy in office space increased a bit in 2019 while
commercial leasing rates also slowly increased according to Colliers Research. Commercial real
estate markets are regional; San Francisco’s office space markets saw prices rise and vacancy fall
in 2019, as the Bay Area economy continued to expand. Prices for office space in San Francisco
County were approximately $10.32 per square foot (sq ft) as of Quarter 4 2019 compared to $2.43
per sq ft in Solano County for Class A space (as shown in the figure). Industrial space vacancy in
Solano County was at 5.0% as 2019 ended, priced at $0.63 per square foot on average.
Solano County Office Space Asking Prices ($)/Sq Ft and Vacancy Rates (%), 2010 Q1 to 2019 Q4, Compared to San Francisco, Class A Space
Source: Colliers International (http://www.colliers.com/en-us/fairfield/insights)
Asking Price is indicated on the left-hand axis; Vacancy Rate is indicated on the right-hand axis.
TAKEAWAY: Vacancy rates in Solano County ticked up a little in 2019 for Class A office space, while prices increased slightly; industrial space remained close to five (5) percent vacancy as of Quarter 4 2019. OPPORTUNITY: The Bay Area commercial real estate markets’ continued high prices may drive some cost-conscious employers to consider Solano County, especially if there is a switch to more telecommuting workers for jobs and employers that utilize portability of work in the wake of the COVID-19 crisis in 2020 to reduce urban real estate costs and shift offices to where their workers live and smaller volumes of square feet leased.
0.0%
5.0%
10.0%
15.0%
20.0%
25.0%
30.0%
$0.00
$2.00
$4.00
$6.00
$8.00
$10.00
$12.00
1Q
20
10
2Q
20
10
3Q
20
10
4Q
20
10
1Q
20
11
2Q
20
11
3Q
20
11
4Q
20
11
1Q
20
12
2Q
20
12
3Q
20
12
4Q
20
12
1Q
20
13
2Q
20
13
3Q
20
13
4Q
20
13
1Q
20
14
2Q
20
14
3Q
20
14
4Q
20
14
1Q
20
15
2Q
20
15
3Q
20
15
4Q
20
15
1Q
20
16
2Q
20
16
3Q
20
16
4Q
20
16
1Q
20
17
2Q
20
17
3Q
20
17
4Q
20
17
1Q
20
18
2Q
20
18
3Q
20
18
4Q
20
18
1Q
20
19
2Q
20
19
3Q
20
19
4Q
20
19
Solano County Asking Rate Solano County Asking Rate
SF Vacancy Solano County Vacancy Rate

34
Index of Economic and Community Progress
Building Permits Building permits for residential units in Solano County increased at a faster pace in fiscal year
2018-19, as did permitted, commercial square feet from the previous fiscal year. As interest rates
increased in fiscal years 2016-17 and 2017-18, slower growth in permits seemed likely. As interest
rates fell in 2019, a subsequent uptick in housing permits and permitted commercial square feet
took place fiscal year 2018-2019. Economic development efforts also likely drove building activity,
as did prospects for more jobs growth at the national and state levels.
Approximately 2,010,200 square feet of new commercial space was permitted in the period of July
2018 to June 2019. There were 1,066 residential building permits issued, 927 of which were for
single-family houses. Fairfield, Vacaville and Dixon are where 81.2 percent of commercial permits
were pulled; Fairfield, Vacaville and Vallejo were where 81.9 percent of new housing permits were
pulled in the 2018-19 fiscal year for Solano County. The County of Solano tracks both data series.
Solano County Residential and Commercial Building Permits, Fiscal Years 2004-05 to 2018-19 Commercial Square Feet and Residential Units Permitted
Source: County of Solano, data provided by county staff
TAKEAWAY: Building permits for both residential and commercial space increased in fiscal year 2018-19 compared to the previous fiscal year. For 2020: Both commercial real estate and residential permit levels are likely to growing more slowly in fiscal year 2020-21 versus fiscal year 2019-20, even though construction was not restricted by Solano County during social distancing and isolation policies per COVID-19. Lower interest rates may help support more construction once constrictive social policies are relaxed generally, if the economic outlook for 2021 and beyond is positive.
-
500
1,000
1,500
2,000
2,500
3,000
3,500
-
500,000
1,000,000
1,500,000
2,000,000
2,500,000
3,000,000
3,500,000
20
05
20
06
20
07
20
08
20
09
20
10
20
11
20
12
20
13
20
14
20
15
20
16
20
17
20
18
20
19
Re
sid
en
tial
Pe
rmit
s
Co
mm
erci
al S
q F
t
Fiscal Year End
Commercial Sq Ft Permitted Number of Residential Permits
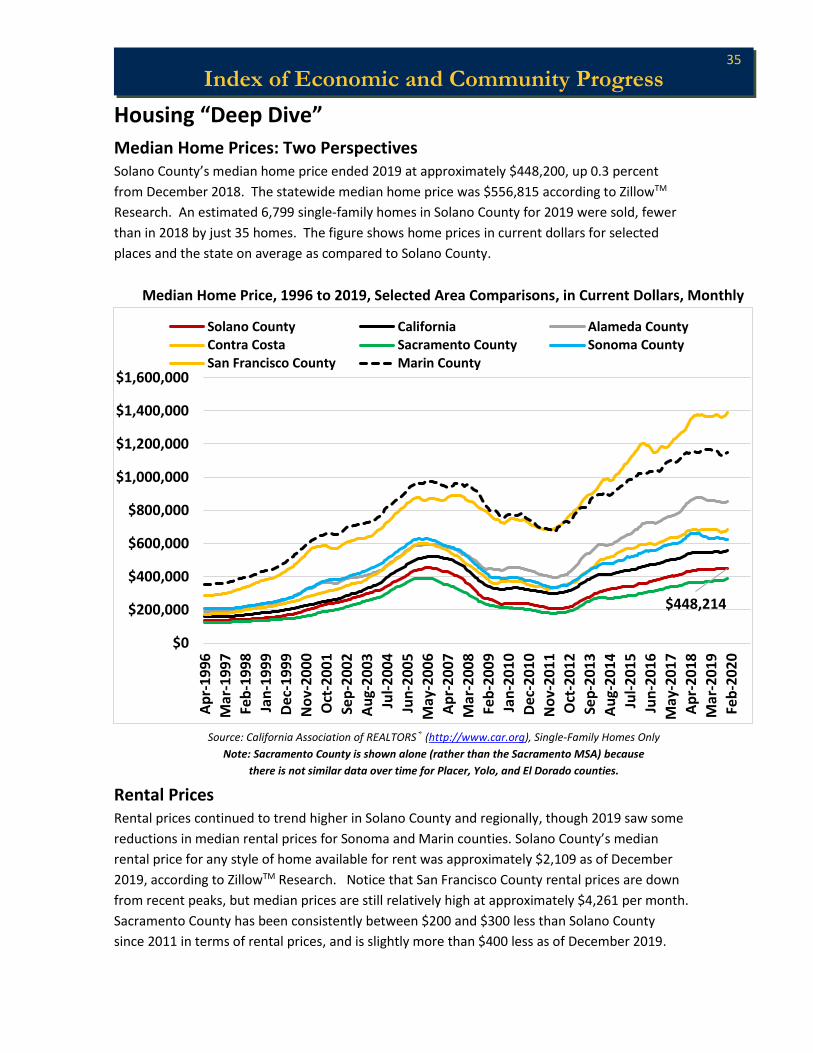
35
Index of Economic and Community Progress
Housing “Deep Dive”
Median Home Prices: Two Perspectives Solano County’s median home price ended 2019 at approximately $448,200, up 0.3 percent
from December 2018. The statewide median home price was $556,815 according to ZillowTM
Research. An estimated 6,799 single-family homes in Solano County for 2019 were sold, fewer
than in 2018 by just 35 homes. The figure shows home prices in current dollars for selected
places and the state on average as compared to Solano County.
Median Home Price, 1996 to 2019, Selected Area Comparisons, in Current Dollars, Monthly
Source: California Association of REALTORS® (http://www.car.org), Single-Family Homes Only
Note: Sacramento County is shown alone (rather than the Sacramento MSA) because
there is not similar data over time for Placer, Yolo, and El Dorado counties.
Rental Prices Rental prices continued to trend higher in Solano County and regionally, though 2019 saw some
reductions in median rental prices for Sonoma and Marin counties. Solano County’s median
rental price for any style of home available for rent was approximately $2,109 as of December
2019, according to ZillowTM Research. Notice that San Francisco County rental prices are down
from recent peaks, but median prices are still relatively high at approximately $4,261 per month.
Sacramento County has been consistently between $200 and $300 less than Solano County
since 2011 in terms of rental prices, and is slightly more than $400 less as of December 2019.
$448,214
$0
$200,000
$400,000
$600,000
$800,000
$1,000,000
$1,200,000
$1,400,000
$1,600,000
Ap
r-1
996
Mar
-19
97
Feb
-19
98
Jan
-19
99
Dec
-19
99
No
v-2
00
0
Oct
-20
01
Sep
-20
02
Au
g-2
003
Jul-
20
04
Jun
-20
05
May
-20
06
Ap
r-2
007
Mar
-20
08
Feb
-20
09
Jan
-20
10
Dec
-20
10
No
v-2
01
1
Oct
-20
12
Sep
-20
13
Au
g-2
014
Jul-
20
15
Jun
-20
16
May
-20
17
Ap
r-2
018
Mar
-20
19
Feb
-20
20
Solano County California Alameda CountyContra Costa Sacramento County Sonoma CountySan Francisco County Marin County

36
Index of Economic and Community Progress
Housing “Deep Dive” (cont.)
Rental Prices ($/month), Annual Average of All Rentals, 2011, 2015, 2018, 2019, Current Dollars
Source: http://www.zillow.com/research/data/#rental-data
TAKEAWAY: While homes to purchase had flat prices in 2019, rental prices continued to rise in Solano County. For 2020: Home prices and rental prices may fall in 2020 as more existing units go up for sale and as people potentially leave rental properties due to an inability to afford current rents, lack of short-term job opportunities and move away from Solano County. It is also possible that low interest rates and federal stimulus payments to households and employers may stabilize housing markets otherwise in 2020.
Housing
Stock The mix of
housing may
be as
important as
its availability
to attracting
and retaining
workers. The
growth of
housing units
in Solano
County since
2010 has affected little change in the housing mix as more units have been built. Approximately
75.2 percent of Solano County’s housing stock as of 2019 is single-family, predominantly
detached homes versus condominiums. California, due to larger, urban areas, has more of a
mix of multifamily (apartment) units.
$2,109$2,529 $2,643
$2,888
$3,653
$1,697
$2,712
$4,261
$-
$500
$1,000
$1,500
$2,000
$2,500
$3,000
$3,500
$4,000
$4,500
$5,000
SolanoCounty
California SonomaCounty
Napa County MarinCounty
Sacramento Contra Costa SanFrancisco
2011 2015 2018 2019
Single Detached
57.5%
Single Attached
7.0%
Two to Four8.0%
Five Plus23.6%
Mobile Homes3.9%
California
Single Detached
71.8%
Single Attached
4.3%
Two to Four7.1%
Five Plus14.0%
Mobile Homes2.9%
Solano County
Source: California Department of Finance (http://www.dof.ca.gov/Forecasting/Demographics/Estimates/e-5/)
Housing Stock, Types of Homes as % of Total, Solano County and California, 2019

37
Index of Economic and Community Progress
Housing “Deep Dive” (cont.)
Housing Prices Versus Median Household Income: Affordability Home price stability in Solano County helped local housing became more affordable in
2019, according to California Association of REALTORS®. This measure is a “Housing
Affordability Index” or HAI, a ratio of households that can pay the cost of owning a home
(mortgage, average cost of utilities and maintenance, etc.) at the current median
household income in an area. The threshold between affordable and unaffordable for a
household is a monthly cost of housing that exceeds 30 percent of household income.
If household incomes do not keep pace with rising, local housing prices, affordability falls; as
of Quarter 3 2019, approximately 47 percent of households in Solano County could afford to
purchase a home at the median home price based on median household income, given
current rates of interest and the average monthly cost of home ownership. This positive
outcome was up from 2018, suggesting Solano County’s housing prices were more
affordable in 2019. A higher percentage here is an improvement.
Housing Affordability Index, 2010 Q3 to 2019 Q3 Percent (%) of Households That Can Afford a Median-Priced Home
Quarter Solano Sacramento Calif. Sonoma Napa Santa Clara Alameda
Contra Costa Marin
San Francisco
2010.Q3 71% 68% 46% 40% 41% 30% 31% 21% 23% 22%
2011.Q3 75% 72% 52% 46% 48% 34% 36% 27% 25% 26%
2012.Q3 77% 73% 49% 46% 45% 32% 34% 28% 27% 25%
2013.Q3 56% 50% 32% 31% 28% 22% 21% 22% 18% 16%
2014.Q3 49% 48% 29% 29% 21% 21% 21% 20% 15% 12%
2015.Q3 45% 47% 29% 26% 23% 19% 20% 34% 19% 11%
2016.Q3 43% 43% 30% 26% 24% 21% 23% 36% 18% 13%
2017.Q3 43% 43% 28% 25% 26% 17% 20% 33% 18% 13%
2018.Q3 38% 42% 27% 22% 24% 17% 18% 32% 19% 15%
2019.Q3 47% 45% 31% 28% 29% 22% 26% 39% 22% 18% Source: California Association of REALTORS® (http://www.car.org/marketdata/data/haitraditional/),
Quarter 3 2019 is the latest data point
TAKEAWAY: Solano County’s housing mix is primarily single-family, detached houses. Price affordability increased for such homes in 2019 strongly from the recent past due to rising incomes and slower price ascension in housing markets. For 2020: Housing affordability in Solano County remains a way to attract workers and businesses. Workers that have portable employment and change how they spend their time commuting versus remaining at home to work may increase housing demand. Housing affordability challenges are likely to persist, where the opportunity cost may be rising vacancy rates in rental, lower median home prices (thus lower housing wealth), or both.

38
Index of Economic and Community Progress
Housing “Deep Dive” (cont.)
Market Dynamics: Housing Forecasts Solano County was forecasted for a slight
drop in housing prices for 2020 (-0.1
percent) as of January 2020 per a forecast by
ZillowTM Research. Housing, like all other
markets, is an interaction between supply
and demand. For the state overall, the
forecast was 3.2 percent growth for 2020.
Sacramento and San Francisco and Contra
Costa are set to see housing prices rise faster
than the state average, while Yolo and
Sonoma counties have forecasted prices that
are relatively flat. We are likely to see
forecasts revised downward for 2020 and
perhaps 2021 due to COVID-19.
Market Dynamics: Housing Burden, Owners and Renters Housing debates about affordability throughout California include an issue called housing
“burden”. The federal department of Housing and Urban Development (HUD) defines housing
burden as a situation where a household spends more than 30 percent of its monthly gross
income on housing payments (rent or mortgage). The estimated burden data shown here are
from 2010 and 2018 as five-year averages. Notice that Solano County started the 2010s with
renters more households burdened than the state on average; Solano County has seen better
conditions in the latest data from 2018; a lower percent of households here is an improvement.
Housing burden can fall, however, from either lower housing prices and rents or from rising
household incomes or both. We saw above housing costs and incomes have increased,
suggesting that Solano County’s household income growth outpaced housing costs for owners
more than renters, but both groups experienced lower levels of burden in 2018.
Rent Burden, Percent (%) of Households that pay at least 30 percent of household income for housing
Place 2010 2011 2012 2013 2014 2015 2016 2017 2018
Solano County 56.2 55.6 55.7 57.9 56.3 60.6 59.2 58.0 56.4
California 55.1 55.7 56.5 56.9 57.2 59.6 59.1 58.5 58.1
Benicia 46.9 46.9 45.3 54.0 53.8 60.1 63.9 61.2 61.0
Dixon 55.1 62.6 58.9 63.6 68.8 69.5 62.4 57.5 49.3
Fairfield 57.4 56.1 56.7 58.7 54.5 62.5 61.4 58.6 56.7
Rio Vista 56.3 50.5 55.3 57.2 59.5 60.5 62.1 50.1 52.1
Suisun City 60.3 59.3 62.3 64.6 57.1 61.7 59.4 55.1 49.6
Vacaville 57.4 55.2 53.5 52.8 51.7 55.6 51.5 52.3 53.6
Vallejo 57.0 58.1 58.6 61.4 60.9 61.9 61.4 61.8 59.8 Source: American Community Survey (ACS) Table DP03: http://data.census.gov
-0.1%
3.2%
5.0%4.6%
3.9%
2.8% 2.8%
1.6%
0.2% 0.1%
-1.0%
0.0%
1.0%
2.0%
3.0%
4.0%
5.0%
6.0%
Housing Forecast for 2020, January 2020, Selected
Counties and California, Percent (%) Change for Year
Source: http://www.zillow.com/research/data/#rental-data

39
Index of Economic and Community Progress
Housing “Deep Dive” (cont.)
Owners Burden, Percent (%) of Households paying at least 30 percent of household income for housing
Place 2010 2011 2012 2013 2014 2015 2016 2017 2018
Solano County 52.3 50.1 47.7 44.7 41.5 38.4 35.5 34.5 33.8
California 52.3 51.9 50.3 48.1 45.7 43.3 41.2 39.7 39.0
Benicia 44.5 45.2 42.2 38.5 35.0 31.9 29.6 29.9 30.8
Dixon 53.9 48.7 46.7 40.3 39.1 35.3 33.4 36.9 35.8
Fairfield 54.3 53.8 52.3 49.0 45.0 40.0 35.6 32.9 30.5
Rio Vista 56.9 50.7 45.2 43.7 41.7 37.9 40.6 38.0 34.4
Suisun City 56.1 51.9 49.5 43.8 38.7 36.2 33.5 34.1 34.5
Vacaville 48.5 44.7 43.2 40.3 37.7 34.3 31.9 31.9 31.7
Vallejo 55.2 52.9 49.9 47.7 44.3 43.1 40.3 38.2 37.9 Source: American Community Survey (ACS) Table DP03: http://data.census.gov
Market Dynamics: Building Permits for Housing through 2023 We now look at the potential future of housing permits pulled by developers and contractors, a
signal that housing units are going to be built. The California Department of Finance (DOF)
forecasts the number of residential building permits annually for the state of California; the latest
forecast as of January 2020 is through December 2023. Notice in the figure that Solano County
and California have closely followed each other over time in terms of changes in the number of
building permits from a baseline year (2000). The forecast shown here is for Solano County to
have residential permits grow as a slower pace than the state on average to 2023. The index
number is the percent change from the year 2000.
Building Permits, Solano County and California, 2000-2023,
Residential Permits Annually, Index, Year 2000 = 100 (Shaded Area = Forecast)
Sources: Census Bureau (https://www.census.gov/construction/bps/) and County of Solano
0
50
100
150
200
20
00
20
01
20
02
20
03
20
04
20
05
20
06
20
07
20
08
20
09
20
10
20
11
20
12
20
13
20
14
20
15
20
16
20
17
20
18
20
19
20
20
20
21
20
22
20
23
Solano County California
TAKEAWAY: Housing forecasts are for relatively flat prices growth in 2020, while housing burden remains across owners and renters at relatively high proportions with some relief in 2018. For 2020: Housing burden may be exacerbated as incomes fall in 2020 unless there is either stabilization of rents, rising incomes after the COVID-19 crisis, or both. It is also not clear if lower interest rates motivate renters to consider home purchases or developers to build more units or both.

40
Index of Economic and Community Progress
Housing Deep Dive (cont.)
CalTrans Forecast for Housing Units versus MTC Demographers estimate a slowdown in
population growth for California. CalTrans,
per its transportation infrastructure
planning, estimates a rise in housing units
permitted through 2026, and then a gradual
decline in residential construction to 2050.
With estimates of slower population growth,
and rising costs of living for California, an
assumption behind this gradual decline is a
slowly, aging population in California.
Decisions on where to build new homes, and
designing new homes, are likely tied to
transportation system access and multi-
family dwellings more in the future than in
the past. The index number is the percent
change from the year 2000.
Housing Type Comparison, 2010 to
2019: What was built?
One of the effects of the 2000s increase in
single-family homes was a slow comeback
to building more in the 2010s. Statewide
construction of homes from 2010 to 2019
generated more multifamily units than
single-family (the figure shows that
California built over 40,000 more
multifamily units than single-family units
from 2010 to 2019). Solano County did
not follow that trend. There were almost
5,702 new, single-family homes built since
2010 and only an additional 1,155
multifamily (apartment) units built.
Change in Housing Units by Type, 2000-09 and 2010-19
Solano County and its Cities and California
2000-09 2000-09 2010-19 2010-19 Place Single Multifamily Single Multifamily
Solano County 13,244 4,393 5,702 1,155
Benicia 442 371 38 0
Dixon 613 376 224 177
Fairfield 4,644 745 2,346 317
Rio Vista 1,890 -94 988 0
Suisun City 1,073 93 95 10
Vacaville 2,725 1,201 1,736 545
Vallejo 1,206 1,874 202 106
Unincorporated 651 -173 73 0
California 1,057,766 334,727 260,142 302,474
Source: California Department of Finance (http://www.dof.ca.gov)
Actual and CalTrans Forecast of Housing Units Permitted,
2000 – 2050, Index, Year 2000 = 100 (Shaded Area = Forecast)
Source: CalTrans (www.dot.ca.gov)
0
20
40
60
80
100
120
140
160
20
00
20
03
20
06
20
09
20
12
20
15
20
18
20
21
20
24
20
27
20
30
20
33
20
36
20
39
20
42
20
45
20
48
Solano County California
TAKEAWAY: Housing forecast are for relatively flat prices growth in 2020, while housing burden remains across owners and renters at relatively high proportions. For 2020: The number of new houses to be built during 2020 depends greatly on how the construction industry returns to work after the COVID-19 crisis and how California reacts to new housing market conditions in 2020 and beyond. With rental demand rising, and a shift to more renters proportionately since 2010, developers may be tempted and have incentives to build more rental than homes to own, which can exacerbate wealth inequality and increase housing burden without the commensurate gains in wealth.

41
Index of Economic and Community Progress
Housing “Deep Dive” (cont.)
Homeownership since 2010 Home prices may outpace a typical
household’s ability to easily afford to buy a
home. Rental markets are a complement
and substitute for home ownership in all
communities. Lower proportions of
homeowners in an area can negatively affect
worker retention for local employers. Data
shown are from the American Community
Survey for Solano County, its cities, and
California as of 2018 (the latest data
available). Only Rio Vista and Dixon had an
increase in home ownership as a proportion
of the total from 2010 to 2018; California has
now experienced a shift toward more renters.
Regional Housing Needs Allocation (RHNA) Each of Solano County’s cities faces a regional policy allocation for new housing units from the state of
California. Because each city has different zoning and general plans concerning housing units, the regional
housing needs allocation or RHNA estimates are sometimes highly debated by the Bay Area’s city and
county governments. These numbers inform Plan Bay Area, regional planning for employment, housing
and ultimately transportation infrastructure by Metropolitan Transportation Authority (MTC). As of March
2020, the following estimates are the assessment of new housing needed from 2015 to 2023. The number
of new, net housing units by city are also shown here based on California Department of Finance estimates.
For Solano County, as of March 2020, the estimated housing units needed is 3,646.
RHNA Estimates, Solano County, March 2020, MTC 5th Cycle, as of March 2020, Housing Units
City Permits Issued
2015-2019 RHNA Estimates Remaining
To meet RHNA levels
Benicia 22 327 305
Dixon 260 197 50
Fairfield 2,073 3,100 1,279
Rio Vista 476 299 77
Suisun City 84 505 421
Vacaville 1,334 1,084 277
Vallejo 146 1,362 1,216
Unincorporated Solano County 141 103 21 Source: RHNA Subregional Delegation, report by Placeworks Consulting for MTC, data provided by County of Solano
TAKEAWAY: Solano County continued to see homeownership decrease in 2018, as did California overall. For 2020: While Solano County had no construction restrictions during the shelter-in place, the forecasted economic downturn for all of California and Solano County may reduce developer incentives and put pressure to meet the RHNA estimates below. Changes in renter income versus homeowner income, as well as incentives to put existing units up for sale in the wake of the COVID-19 crisis in 2020 may shift the tenure (renter vs. owner) percentages.
Percent (%) Occupied Housing Units, Owner vs Rental, 2010
and 2018 compared, Solano County, Cities and California
2010 2010 2018 2018
Place Owner Rental Owner Rental
Solano County 72.9% 27.1% 60.7% 39.3%
Benicia 65.8% 34.2% 71.0% 29.0%
Dixon 63.6% 36.4% 68.7% 31.3%
Fairfield 64.2% 35.8% 58.4% 41.6%
Rio Vista 77.0% 23.0% 82.7% 17.3%
Suisun City 66.5% 33.5% 60.8% 39.2%
Vacaville 62.1% 37.9% 60.6% 39.4%
Vallejo 57.4% 42.6% 54.9% 45.1%
California 71.0% 29.0% 54.6% 45.4%
Source: American Community Survey (ACS) Table DP03: http://data.census.gov

42
Index of Economic and Community Progress
Our Changing Community

43
Index of Economic and Community Progress
People
Population Growth Population growth slowed regionally, with some counties and areas experiencing population
losses. In calendar-year measures by the California Department of Finance, Solano County’s
population grew by 2,205 residents from January 1, 2018 to January 1, 2019; the growth
rate was approximately 0.5 percent, as was California overall. The Bay Area Other counties
grew by 31,907 people, a growth rate that was 0.5 percent. Sacramento’s population
growth remained robust at over 1.0 percent in 2018. The recent fires likely contributed to
Sonoma and Napa counties’ (the North Bay) population decline in 2018; some of those
2,302 people leaving those two counties likely moved to Solano County.
Change in Total Population, compared to 2019, Number of People and Percent (%) Change Solano County and Selected Comparison Areas
Place 2010 2018 2010 2018
Solano County 27,963 2,205 6.8% 0.5% California 2,673,359 186,807 7.2% 0.5% Sacramento MSA 127,386 15,932 9.0% 1.0% Bay Area Other 573,196 31,907 9.8% 0.5% North Bay 31,562 -2,302 3.6% -0.3%
Source: California Department of Finance, Demographic Research Unit (www.dof.ca.gov)
Population Growth, Percent (%) Change from the Previous Year, 2002–2019, January 1 Estimates
Source: California Department of Finance, Demographic Research Unit (www.dof.ca.gov)
TAKEAWAY: Population growth in Solano County increased in 2018 by 0.5 percent more residents as of January 1, 2019. OPPORTUNITY: As more people leave both fire-affected and rising cost-of-living areas, Solano County may be a place where more working families and self-employed workers come to live.
-0.5%
0.0%
0.5%
1.0%
1.5%
2.0%
2.5%
3.0%
2002
2003
2004
2005
2006
2007
2008
2009
2010
201
1
2012
201
3
2014
2015
2016
2017
2018
2019
Solano County CA Sacramento MSABay Area Other North Bay

44
Index of Economic and Community Progress
Population Growth Projections The California Department of Finance (DOF) updated its county forecasts on population
growth to 2060 in January 2020. Solano County is compared to other areas in the figure
reflecting these updated forecasts. Notice the dramatic drop in the North Bay counties of
Sonoma, Marin and Napa; this estimated population change is new to the 2020 DOF
forecasts. Population forecasts help build employment and housing forecasts based on
assumed labor-force participation rates, people per household and the number of children
that become local students and potentially local workers.
Population Growth, Selected Areas, 2010–2060, Index 2010 = 100
Source: CA Department of Finance, Demographics Unit, Revised Jan 2019
(http://www.dof.ca.gov/Forecasting/Demographics/Projections)
TAKEAWAY: Solano County’s population growth is forecasted to grow at a decreasing rate toward 2060, slower than the urban Bay Area counties and Sacramento County. The North Bay counties (Sonoma and Napa specifically) are to see population decline. For 2020: As the effects of the COVID-19 crisis slowly unfold, Solano County’s population may rise due to outmigration from cities to suburban/rural areas such as Dixon, Vacaville, Fairfield, and Vallejo. After 2020, labor-force participation challenges and strains on both public and private health systems may come to Solano County depending on the types of households that come to Solano County.
80
90
100
110
120
130
140
150
20
10
20
12
20
14
20
16
20
18
20
20
202
2
20
24
20
26
20
28
20
30
20
32
20
34
20
36
20
38
20
40
20
42
204
4
20
46
20
48
20
50
20
52
20
54
20
56
20
58
20
60
Solano County California Sacramento County
Bay Area Other North Bay

45
Index of Economic and Community Progress
Components of Population Change Solano County’s population increased over fiscal year 2018-19 from the previous fiscal
year; for the period July 2018 to June 2019, Solano County’s population was estimated to
have grown by 2,170 people. Births outpaced deaths and new residents moved to Solano
County from other places worldwide in net. However, more people moved away from
Solano County to other parts of the United States in net. Fiscal year (July to June)
measures are used by the state of California to predict tax revenues and also education
data (number of students and graduates). It is also when adjustments are made to the
calendar year figures to benchmark the following year’s estimates. The 2020 Census data
will help show they types of households that migrated to and away from Solano County.
Solano County Components of Population Change (People) from Previous Fiscal Year (July 1 to June 30) and Net Change in Residents, 2000–2019
Source: California Department of Finance, Demographic Research Unit (www.dof.ca.gov)
Solano County Change in Population Compared to 2019, Number of People Fiscal Year End Births Deaths
Net New Residents from the United States
(Net Domestic)
Net New Residents from other Countries
(Net Foreign)
Net New Residents Moving to
Solano County
2010 46,454 -28,519 -80 11,417 11,337 2013 31,075 -19,884 1,661 7,949 9,610 2014 25,823 -16,881 723 6,816 7,539 2015 20,542 -13,733 607 5,473 6,080 2016 15,365 -10,520 -80 3,985 3,905 2017 10,156 -7,144 -873 2,712 1,839 2018 5,058 -3,628 -575 1,315 740
Source: California Department of Finance, Demographic Research Unit (www.dof.ca.gov)
TAKEAWAY: Solano County’s population grew in fiscal year 2018-19 by a mix of natural change and also in-bound migration from places outside the United States. For 2020: Strains on county social assistance are affected by migration patterns (trading workers for retirees and also families for single-person households). As the COVID-19 crisis effects urban more than suburban/rural areas, migration patterns may change.
-10,000
-7,500
-5,000
-2,500
0
2,500
5,000
7,500
10,000
12,500
20
00
20
01
20
02
20
03
20
04
20
05
20
06
20
07
20
08
20
09
20
10
20
11
20
12
20
13
20
14
20
15
20
16
20
17
20
18
20
19
Nu
mb
er o
f P
eo
ple
Births Deaths Net Foreign Net Domestic Net Change

46
Index of Economic and Community Progress
Dependency Ratios An area’s total dependency ratio measures the percentages of area residents 65 and older and
also those under 18 years of age. As the dependency ratio rises, it signals that fewer local
residents are of classic working age (between 18 and 64 years old). Solano County’s dependency
ratio was 36.0 percent in 2010 and increased in 2018 to 37.2 percent from 36.9 in 2017 (2018
data are the latest available). San Francisco County continues as relatively young versus regional
counterparts, with all other comparison counties experiencing a rising dependency ratio in 2018.
Total Dependency Ratio, Comparison Between Selected Areas, 2010, 2017 and 2018 Percent (%) of Population Under 18 Years Old and 65 Years and Older
Source: Census Bureau (www.census.gov) at http://factfinder.census.gov
TAKEAWAY: Solano County’s dependency ratio increased at a slow rate in 2018 (0.3 percent), as did all other comparison counties. CHALLENGE: If migration patterns change due to the COVID-19 crisis in 2020 such that more families and more senior households come to Solano County, the dependency ratio may rise in 2020 and afterward. The number of people that receive social assistance from the County of Solano may also rise as a result of a larger dependency ratio, the core reason why policy makers follow this data point.
36.0 36.9 37.2
0
5
10
15
20
25
30
35
40
45
SolanoCounty
AlamedaCounty
MarinCounty
NapaCounty
SacramentoCounty
SanFrancisco
County
SonomaCounty
California
Pe
rce
nt
of
Po
pu
lati
on
2010 2017 2018

47
Index of Economic and Community Progress
High School Graduation Rates Solano County’s graduation rate increased in 2018-19 (the latest data available) from the
previous academic year and exceeded the state of California’s graduation rate on average.
Graduation rates also increased for the state of California in academic year 2018-19. Labor
market incentives are connected to graduation rates; when wages and job opportunities rise,
students have incentives to leave high school. Solano County remained a place of African-
American student success in the 2018-19 academic year at 1.82 percentage points higher than
the state average.
Solano County and California Graduation Rates, 2016-17 to 2018–19 Academic Years
Source: California Department of Education (www.cde.ca.gov)
Note: There was a methodological change at the Department of Education that does not allow a comparison before 2016-17 academic year with the most recent data.
Solano County and California Graduation Rates (%) by Ethnicity, 2018-19 Academic Year Compared
Ethnicity Solano County California Difference
African American 78.6% 76.8% 1.8%
American Indian or Alaska Native 77.4% 74.8% 2.6%
Asian 93.0% 94.0% -1.0%
Filipino 95.2% 94.1% 1.1%
Hispanic or Latino 80.2% 82.1% -1.9%
Pacific Islander 85.7% 84.6% 1.1%
White 88.9% 88.4% 0.5%
Two or More Races 92.6% 85.5% 7.1%
Source: California Department of Education (www.cde.ca.gov) Note: There was a methodological change warning at the California Department of
Education against comparisons before 2016-17 with the most recent data.
TAKEAWAY: Overall, Solano County had 84.9 percent of those eligible to graduate did so in academic year 2018-19 (the latest data), up sharply from one year before; California’s statewide rate increased also, but is now lower than Solano County. For 2020: Graduation rates are likely to be as good or better in 2019-20, but with a potential contraction in the economy and online learning as the norm, higher dropout rates may occur to earn resources for lower-income households.
81.5 81.4
84.9
75.0
77.0
79.0
81.0
83.0
85.0
87.0
2016-17 2017-18 2018-19
Pe
rce
nt
of
To
tal
Solano County California

48
Index of Economic and Community Progress
UC/CSU-Readiness California’s public university systems prepare students for professional careers. Solano
County is home to CSU Maritime. UC Davis, Touro University and Solano Community
College are also located within or next to Solano County. In the 2018–19 academic year (the
latest data available), Solano County increased its percentage of 2018-19 academic year,
college-ready graduates to 43.7 percent from 43.3 percent. The state overall also increased
to 50.5 percent from 49.9 percent from the 2018-19 academic year versus 2017-18.
Comparisons of Percentages (%) of UC/CSU-Ready Solano County High School Graduates Selected Races and Ethnicities, 2018-19
Source: California Department of Education (www.cde.ca.gov)
Note: There was a methodological change warning at the California Department of Education against comparisons before 2016-17 with the most recent data.
TAKEAWAY: Solano County had more high-school graduates for UC or CSU admission in the 2018-19 academic year than the previous year, though the average remains behind the state. OPPORTUNITY: The increase in African-American and Hispanic student readiness for university admission is rising, providing more employment possibilities for these Solano County students that ultimately attend UC or CSU campuses. Support for these students, especially students with financial need, is critical to convert readiness into career and earnings potential.
0.0%
10.0%
20.0%
30.0%
40.0%
50.0%
60.0%
70.0%
80.0%
AfricanAmerican
AmericanIndian or
AlaskaNative
Asian Filipino Hispanic orLatino
PacificIslander
White Two orMore Races
Solano County 2018-19 California 2018-19
Solano County 2018-19 Average California 2018-19 Average
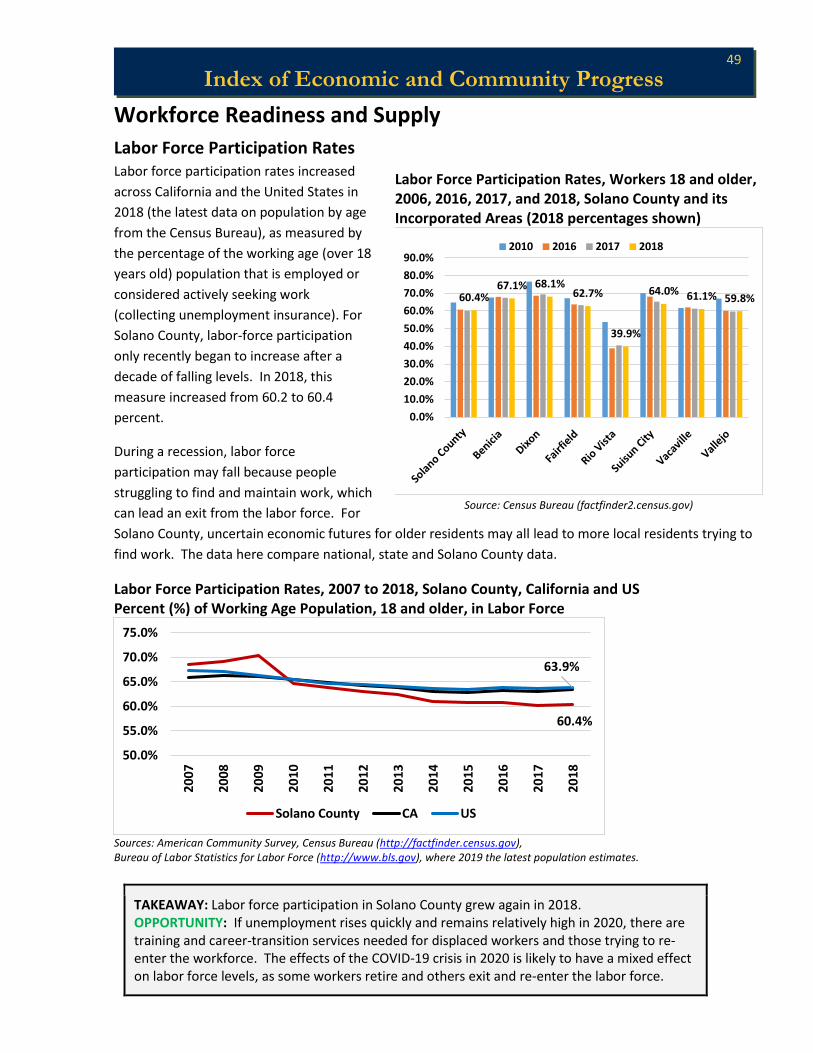
49
Index of Economic and Community Progress
Workforce Readiness and Supply
Labor Force Participation Rates Labor force participation rates increased
across California and the United States in
2018 (the latest data on population by age
from the Census Bureau), as measured by
the percentage of the working age (over 18
years old) population that is employed or
considered actively seeking work
(collecting unemployment insurance). For
Solano County, labor-force participation
only recently began to increase after a
decade of falling levels. In 2018, this
measure increased from 60.2 to 60.4
percent.
During a recession, labor force
participation may fall because people
struggling to find and maintain work, which
can lead an exit from the labor force. For
Solano County, uncertain economic futures for older residents may all lead to more local residents trying to
find work. The data here compare national, state and Solano County data.
Labor Force Participation Rates, 2007 to 2018, Solano County, California and US Percent (%) of Working Age Population, 18 and older, in Labor Force
Sources: American Community Survey, Census Bureau (http://factfinder.census.gov), Bureau of Labor Statistics for Labor Force (http://www.bls.gov), where 2019 the latest population estimates.
TAKEAWAY: Labor force participation in Solano County grew again in 2018. OPPORTUNITY: If unemployment rises quickly and remains relatively high in 2020, there are training and career-transition services needed for displaced workers and those trying to re-enter the workforce. The effects of the COVID-19 crisis in 2020 is likely to have a mixed effect on labor force levels, as some workers retire and others exit and re-enter the labor force.
60.4%
63.9%
50.0%
55.0%
60.0%
65.0%
70.0%
75.0%
2007
2008
2009
2010
2011
2012
2013
2014
2015
2016
2017
2018
Solano County CA US
Labor Force Participation Rates, Workers 18 and older, 2006, 2016, 2017, and 2018, Solano County and its Incorporated Areas (2018 percentages shown)
Source: Census Bureau (factfinder2.census.gov)
60.4%67.1% 68.1%
62.7%
39.9%
64.0% 61.1% 59.8%
0.0%
10.0%
20.0%
30.0%
40.0%
50.0%
60.0%
70.0%
80.0%
90.0%2010 2016 2017 2018

50
Index of Economic and Community Progress
City Overview: Education, Housing and Income Solano County continues to show improvements in occupied housing units, new
construction and residential education levels across its cities. These data are five-year
averages (2014-18 is the latest data available from the Census Bureau).
Median Age (Years) in Solano County and Its Cities, 2000, 2010, 2016, 2017, 2018 Place 2000 2010 2016 2017 2018
Solano County 33.9 36.5 37.5 37.7 37.9 United States 35.3 36.9 37.5 37.8 37.9 California 33.3 34.9 36.0 36.1 36.3 Benicia 38.9 45.0 44.2 44.9 45.7 Dixon 31.5 32.3 34.0 35.0 34.0 Fairfield 31.1 32.8 34.4 34.8 35.0 Rio Vista 40.7 55.8 62.3 62.3 62.2 Suisun City 31.7 32.7 33.1 33.7 34.4 Vacaville 33.9 36.7 37.1 37.4 37.3 Vallejo 34.9 37.5 38.3 37.8 38.0
Source: American Community Survey, Census Bureau (http://factfinder.census.gov)
Housing and Occupancy, 5-Year Averages Ending in Stated Year: 2010, 2017 and 2018 (How many homes are there and what percentage (%) are occupied or vacant.)
Total Housing Units Occupied (%) Vacant (%)
Place 2010 2017 2018 2010 2017 2018 2010 2017 2018
Solano County 151,616 155,973 156,896 91.7% 94.5% 95.0% 8.3% 5.5% 5.0%
United States 130,038,080 135,393,564 136,384,292 87.8% 87.8% 87.8% 12.2% 12.2% 12.2%
California 13,552,624 13,996,299 14,084,824 91.4% 92.1% 92.1% 8.6% 7.9% 7.9%
Benicia 11,905 11,717 11,649 91.7% 95.5% 95.5% 8.3% 4.5% 4.5%
Dixon 6,124 6,204 6,304 94.2% 95.1% 95.4% 5.8% 4.9% 4.6%
Fairfield 36,283 37,461 37,892 91.7% 95.5% 95.9% 8.3% 4.5% 4.1%
Rio Vista 3,592 4,506 4,629 92.7% 93.3% 92.6% 7.3% 6.7% 7.4%
Suisun City 9,291 9,448 9,495 93.3% 97.9% 98.1% 6.7% 2.1% 1.9%
Vacaville 31,780 33,812 34,195 94.4% 95.9% 96.3% 5.6% 4.1% 3.7%
Vallejo 45,297 45,026 44,869 88.9% 92.5% 93.6% 11.1% 7.5% 6.4%
Source: American Community Survey, Census Bureau (http://factfinder.census.gov)

51
Index of Economic and Community Progress
Income, Household Size, and Education, 2010, 2017, and 2018, Five-Year Averages
Median Household Income
(2009 Dollars)
Average Household Size
(People/Housing Unit) Percent (%) of Residents
with HS Diploma or Better
Percent (%) of Residents with Bachelor’s Degree
or Better
Place 2010 2017 2018 2010 2017 2018 2010 2017 2018 2010 2017 2018
Solano
County $67,559 $62,196 $63,782 2.83 2.88 2.87 85.8% 87.6% 88.0% 24.0% 25.6% 26.2%
United
States $51,269 $50,450 $51,461 2.61 2.63 2.63 85.0% 87.3% 87.6% 27.9% 30.9% 31.5%
California $60,127 $57,267 $58,537 2.93 2.96 2.96 80.7% 82.5% 83.0% 30.1% 32.6% 33.3%
Benicia $85,937 $81,187 $81,376 2.53 2.50 2.52 94.7% 96.3% 96.5% 41.2% 42.2% 43.4%
Dixon $68,876 $62,279 $63,448 3.00 3.30 3.28 82.1% 77.0% 78.3% 19.6% 19.6% 17.4%
Fairfield $67,164 $64,193 $66,527 3.00 3.10 3.09 84.8% 85.6% 85.6% 22.2% 25.6% 26.5%
Rio Vista $53,890 $56,097 $57,528 2.04 1.98 2.01 93.1% 92.1% 95.3% 25.3% 23.1% 29.2%
Suisun City $70,903 $64,110 $65,548 3.23 3.15 3.14 86.1% 88.4% 88.9% 19.3% 19.9% 20.5%
Vacaville $69,958 $66,337 $67,552 2.71 2.79 2.77 85.4% 88.6% 89.1% 21.0% 23.4% 23.5%
Vallejo $60,717 $53,092 $54,739 2.85 2.86 2.85 84.7% 87.7% 87.9% 24.7% 25.5% 26.1%
Source: American Community Survey, Census Bureau (http://factfinder.census.gov)
TAKEAWAY: Housing occupancy increased as number of people per housing units leveled off a bit in 2018. Educational levels are rising as are median household incomes. Solano County continues to age, following changes in the state median at approximately 1.5 years older. CHALLENGE: As a result of the COVID-19 crisis, all standards of living are likely to fall in 2020 and perhaps 2021. Median household income, in inflation-adjusted terms, was still below 2010 levels in Solano County and California as of 2018; the 2019 data will likely show inflation-adjusted levels for 2010.

52
Index of Economic and Community Progress
Broadband and Computer Access The American Community Survey of the Census Bureau provides data on broadband and
computer access for households. Such access helps households become places for a
home-based business, connecting students to resources for their education, and potential
telehealth connections for residents and families. Data here compare Solano County to the
national and state economies overall. As expected, there was continued improvement in
the 2018 data (the latest data) compared to 2017, 2016 and 2013 data (2013 was the first
year these data were tracked by the American Community Survey); as also expected,
Solano County is well connected versus its state and national counterparts.
Broadband and Computer Access, 2013, 2016, 2017, and 2018
Solano County Compared to CA and US, Percent (%) of Households
Source: American Community Survey, 1-year Survey Samples (http://factfinder.census.gov)
TAKEAWAY: Solano County households increased the proportion of the population that has internet access versus the national and state averages again in 2018, showing almost full coverage across the county population. OPPORTUNITY: Broadband internet may become one of the most critical, infrastructure needs for all households if the COVID-19 crisis lingers in 2020 and into 2021 affecting schools, employers, healthcare systems, and many other industries. Education and healthcare opportunities for rural communities and those less mobile can take advantage of this connectedness and expand workforce training and health services.
0.0%
10.0%
20.0%
30.0%
40.0%
50.0%
60.0%
70.0%
80.0%
90.0%
100.0%
SolanoCounty
2013
SolanoCounty
2016
SolanoCounty
2017
SolanoCounty
2018
California2013
California2016
California2017
California2018
UnitedStates2013
UnitedStates2016
UnitedStates2017
UnitedStates2018
Internet Access No Internet

53
Index of Economic and Community Progress
Commuting: Time to Work in the Car Time to work data can provide ways of understanding length of commuting and also
potential traffic conditions. As the Solano County economy has experienced more hiring
and more economic growth, the time to work has increased (from 2009 to 2018 as shown,
where 2018 data are the latest available). Notice the proportion of working residents in
Solano County has gone up for those traveling 60 minutes or more work; since 2009, due to
both a rising proportion and residential growth of workers, there are over 9,600 more
Solano County residents that work driving 60 minutes or more each way to and from work.
Time to Get to Work, Solano County Residents, 2009, 2010, 2016, 2017, and 2018 Count (People) and % Share of Annual Total
2009 2010 2016 2017 2018
Time to Work (minutes)
Count Share Count Share Count Share Count Share Count Share
Less than 10 minutes 22,948 13.10% 22,618 12.70% 21,827 12.00% 21,805 11.70% 21,478 11.20%
10 to 14 minutes 26,101 14.90% 26,714 15.00% 27,070 15.20% 27,956 15.00% 27,614 14.40%
15 to 19 minutes 24,524 14.00% 25,111 14.10% 24,933 14.00% 26,278 14.10% 27,039 14.10%
20 to 24 minutes 18,919 10.80% 19,056 10.70% 18,700 10.50% 19,010 10.20% 19,177 10.00%
25 to 29 minutes 7,357 4.20% 7,480 4.20% 8,192 4.60% 8,014 4.30% 8,821 4.60%
30 to 34 minutes 19,619 11.20% 20,837 11.70% 18,878 10.60% 19,196 10.30% 19,944 10.40%
35 to 44 minutes 12,262 7.00% 12,110 6.80% 11,576 6.50% 12,487 6.70% 12,848 6.70%
45 to 59 minutes 17,167 9.80% 17,631 9.90% 17,275 9.70% 18,078 9.70% 18,985 9.90%
60 or more minutes 26,276 15.00% 26,536 14.90% 30,097 16.90% 33,547 18.00% 35,860 18.70%
Mean travel time to work (minutes)
29.4
29.5
30.4
31.8
32.6
Source: American Community Survey, Census Bureau (http://factfinder.census.gov)
TAKEAWAY: Commute times and distances continued to rise in 2018 to 32.6 minutes as jobs growth continued. OPPORTUNITY: The COVID-19 crisis in 2020 may provide an opportunity to reduce commuter time in the car because more people are working from home. As economic development continues to attract, retain and expand businesses in Solano County, matching commuting workers to local job opportunities can be part of a broader, community development strategy.

54
Index of Economic and Community Progress
Quality of Place Index This final section looks at comparison data describing quality of place compared to
California (the Bay Area in the case of housing prices) on average: high-school graduation
rates; commute times; air quality; educational attainment; home purchase and rental
prices; and taxable sales per person. There are 58 counties in California; the data below
in many cases are rankings out of these 58 counties. Key takeaways are given by element.
Quality of Place Elements, 2018 (2017 is the latest data in some cases) Element Key Takeaway
Graduation Rates for High School Graduation rates were up in Solano County in 2018-19, gaining ground on many CA counties.
2010-11 44th in CA
2017-18 43rd
2018-19 33rd in CA
Commute Times Solano County experienced rising commute times in 2018 and is now in the top 7 worse counties for minutes to work.
2010 49th in CA
2017 50th in CA
2018 52nd in CA
Air Quality Air quality remained relatively similar to 2018 in 2019 for Solano County, as the Air Quality Index for Solano County was 18th lowest of the 58 counties in CA. (lower is better).
2010 20th in CA
2018 18th in CA
2019 18th in CA
Educational Attainment: % of Pop, 25 years old or more, BA min Solano County population above 25 years old remains in the top half of California County for residents with a BA degree minimum.
2010 29th in CA
2017 24th in CA
2018 25th in CA
Home and Rental Prices (as a % of San Francisco County)
Solano County’s home prices increased quickly in percentage terms versus rents in 2019. Solano County remains an affordable real-estate market versus the core Bay Area.
2010 Rent: 50% of SF Buy: 28% of SF
2018 Rent: 48% of SF Buy: 32% of SF
2019 Rent: 51% of SF Buy: 32% of SF
Taxable Sales/Capita Solano County residents and visitors continued making taxable purchases as their incomes rise increasing the total versus the state average.
2010 98.6% of State Avg
2018 100% of
State Avg
2019 102% of
State Avg
Sources: California Department of Education; American Community Survey; ZillowTM Research; California Air Resources Board;
California Board of Equalization and County of Solano
Quality of Index indicators suggest opportunities when in green and challenges for policy makers and the community when in red.
OVERALL TAKEAWAY: For both economic and workforce development, Solano County has many advantages for businesses and residents compared to other parts of California, and also similar challenges. For 2019, quality of place was slightly better than 2019. The COVID-19 crisis in 2020 is likely to positively affect air quality, commute times, graduation rates. It is likely to negatively affect taxable sales and education attainment of the population older than 25, and may be neutral or negative on home and rental prices.

55
Index of Economic and Community Progress
Data Sources and Methodology
Solano County Key Facts Area Data provided by the Solano Economic Development
Corporation (EDC).
Population Data are from the E-1: City/County Population Estimates
with Annual Percent Change report by the California
Department of Finance and for Solano County. Estimates
available in 2020 are for January 1, 2019, and also for fiscal
year 2018-19 in certain data comparisons.
Jobs Solano County employment data are provided by the
California Employment Development Department (EDD).
The industry data may include employees who live outside
the county. December 2019 and Annual 2019 data are
preliminary estimates.
Foreign Immigration and Domestic Immigration Data are from the E-6: Population Estimates and
Components of Change by County – July 1, 2010–2019
report by the California Department of Finance and are for
Solano County, the Bay Area Other (including Alameda,
Contra Costa, Marin, San Francisco, San Mateo, Santa Clara
counties), the North Bay (Napa and Sonoma counties), and
for California overall. Estimates for 2019 are preliminary.
Net migration includes all legal and unauthorized foreign
immigrants, residents who left the state to live abroad, and
the balance of hundreds of thousands of people moving to
and from California from within the United States.
Adult Educational Attainment, Age Distribution, and Ethnic Composition Data are provided by the U.S. Census Bureau American
Community Survey in 2019 is an average of data over the
years 2014 to 2018 for Solano County.
Taxable Sales and Assessed Property Value Data for taxable sales are from the State of California Board
of Equalization and the Solano County Department of
Finance. Data on the assessed value of residential
properties are from the Solano County Assessor’s office.
Our Changing Economy Annual Employment Solano County employment data are provided by the
California Employment Development Department (EDD).
The industry data reflects the number of jobs in the county
that may pay employees who live outside of the county.
https://www.labormarketinfo.edd.ca.gov/data/industries.html
Change in Annual Jobs Solano County employment data are provided by the
California Employment Development Department (EDD).
The industry data reflect the number of jobs in the county
that may pay employees who live outside of the county. The
data are as of December 2019 and are estimates, see
https://www.labormarketinfo.edd.ca.gov/data/industries.html.
Total Employed Residents and Total Unemployed Residents Solano County resident employment data is provided by
the California Employment Development Department (EDD)
Local Area Unemployment Statistics (LAUS). The data
reflects the number of residents employed and
unemployed in the county. Monthly data reports for Solano
County and selected areas originate at the Bureau of Labor
Statistics (www.bls.gov) and EDD reports the estimates.
Non-Employer Firm Growth and Percentage of Non-Employers by Industry Data for Non-employers are from the U.S. Census Bureau.
Non-employer statistics originate from tax return
information of the Internal Revenue Service. Data are
subject to tax forms data, as well as errors of response, non-
reporting and coverage. Values provided by each firm are
slightly modified to protect the respondent's confidentiality.
The latest Census Bureau data are from 2017.
Median Household Income Data for Median Household Income are from the 2003-
2018 American Community Survey data reports from the
U.S. Census Bureau, including the decennial Census in 2010.
All income values are inflation-adjusted and reported in
2009 dollars, using the California CPI from the California
Department of Finance. This California CPI is a weighted
average of consumer price index (CPI) data that the Bureau
of Labor Statistics (BLS) reports for the San Francisco, Los
Angeles, and San Diego metropolitan areas.

56
Index of Economic and Community Progress
Tourism and Visitor Support Estimated data on visitor spending, jobs that support
visitors and tax receipts generated from tourism and hotel
stays are provided for all 58 California counties and the
state overall by Dean Runyan Associates. Data are from
1992 to 2018.
Gross Product Data are provided by the U.S. Bureau of Economic Analysis
through 2018 Bureau of Economic Analysis (www.bea.gov).
Values are inflation-adjusted and reported in 2009 dollars.
Real Per Capita Personal Income Total personal income and population data are from the
Bureau of Economic Analysis. Income values are inflation-
adjusted and reported in 2009 dollars, using the California
CPI from the California Department of Finance. See
Sources of Personal Income Data are provided by the Bureau of Economic Analysis
(BEA) through 2018. Data are from Personal Income by
Major Source and Earnings by NAICS Industry through
2018. Personal income has been adjusted into 2009 dollars
using either the California CPI from the California
Department of Finance or the U.S. City Average Consumer
Price Index (CPI) of all urban consumers, published by the
Bureau of Labor Statistics, when data are national.
Economic Base and Locally-Serving Industries: Moving Solano Forward Phase II These data come from the Quarterly Census of
Employment and Wages (QCEW) which allows for a look at
employment, wages, and establishments data at the NAICS-
4-digit level. The North American Industry Classification
System (NAICS) allows analysis for major industry sectors.
These data are the official estimates from the Bureau of
Labor Statistics (http://www.bls.gov/cew).
Agriculture Data on county agriculture and the industries within that
sector come from the Solano County Agricultural
Commissioner and the Bureau of Economic Analysis (BEA).
The BEA tracks farm incomes, almost like an income
statement, annually with a one-year lag. The latest data
are from 2018.
Poverty Rates Poverty rates represent the percentage of households
under the federal poverty level in terms of household
income in a given year. Five-year averages for Solano
County are provided by the American Community Survey of
the Census Bureau. The latest data are from 2018.
Wages by Occupation Wages data are available from The California Employment
Development Department (www.edd.ca.gov) and the U.S.
Bureau of Labor Statistics (www.bls.gov) by occupation
following Standard Occupation Classification (SOC) codes.
Wages are adjusted to 2009 dollars using the California CPI
from the California Department of Finance or the U.S. City
Average Consumer Price Index (CPI) of all urban consumers,
published by the Bureau of Labor Statistics, when the data
are national. These data are from May 2019.
Commercial Real Estate Data on Solano County’s commercial real estate comes
from author contact with Colliers International’s research
department. The tracking of office space, both class A and
B, as well as industrial space, is from a survey instrument
that is proprietary to Colliers. Other commercial real estate
firms, such as Cushman-Wakefield, will likely have different
estimates, but there is not a governmental source for these
data. The latest data are from Quarter 4 2019.
Housing Deep Dive Data on forecasted housing units need come from both
Metropolitan Transportation Commission (MTC) and from
California Department of Transportation (CalTrans).
Housing type is estimated by the California Department of
Finance as part of its demographic research and housing
tenure (own versus rental) data comes from the Census
Bureau’s American Community Survey. Regional Housing
Needs Allocation (RHNA) estimates were provided by
County of Solano staff for 2020.
Our Changing Community
Population Growth and Domestic and Foreign Immigration Data are from the E-6: Population Estimates and
Components of Change by County – July 1, 2000–2019
report by the California Department of Finance and are for
Solano County, the Bay Area Other (including Alameda,
Contra Costa, Marin, San Francisco, San Mateo, and Santa
Clara counties), the North Bay (Napa and Sonoma counties)
and California overall. Net migration includes all legal and
unauthorized foreign immigrants, residents who left the
state to live abroad, and the balance of hundreds of
thousands of people moving to and from California from
within the United States. For the population projections,
the data used comes from the California Department of

57
Index of Economic and Community Progress
Finance, P-3 report (State and County Population
Projections by Race/Ethnicity, Detailed Age, and Gender,
2010–2060 (by year)). The latest estimates are from
January 2020.
Dependency Ratios Data for the dependency ratios, which are the percentage
of the population that is either under 18 years of age or
over 65 years of age, come from the American Community
Survey from the U.S. Census Bureau, including the
decennial Census in 2010, covering years between 2005
and 2018.
High School Dropout Rates Data for the 2018–2019 academic year are provided by the
California Department of Education Educational
Demographics Office. The 4-year derived dropout rate is an
estimate of the percent of students who would drop out in
a four-year period based on data collected for a single year.
There has been a recent change in methodology such that
time periods before 2016-17 are not comparable to those
after 2016-17.
High School Graduation Rates and UC/CSU-Readiness Data for the 2018–2019 academic year are provided by the
California Department of Education. In theory, the
methodology used calculates an approximate probability
that one will graduate on time by looking at the number of
12th grade graduates and number of 12th, 11th, 10th and
9th grade dropouts over a four-year period. There has been
a recent change in methodology such that time periods
before 2016-17 are not comparable to those after 2016-17.
Home Sales and Housing Affordability Data were provided by the California Association of
REALTORS® (CAR) for median home prices, sales
volume of single-family homes and also by ZillowTM
Research (Rental Prices). CAR also calculates the
percentage change in homes sales by county, compares
numerous counties across the state, and also has a housing
affordability index (HAI) it publishes quarterly at
www.car.org. Data on housing burden are available from
the Census Bureau (http://data.census.gov).
Labor Force Participation Rates This is a ratio of the population over 16 years old and under
65 years of age to the total population traditionally. Some
measures have expanded that to 16 years and above as a
way of measuring local working-age residents and their
engagement in local labor markets.
Broadband and Computer Access The Census Bureau, in its American Community Survey, is
now tracking the number of households with a computer or
with broadband access of both. These data are shown here
as a way to consider Solano County versus the state and
nation and the ability to use tools at home to increase labor
supply readiness and learning opportunities. The latest
data is as of 2018.
Building Permits Building permits data are available from both the County of
Solano and the Census Bureau at the metropolitan
statistical area (MSA) level. The County of Solano provided
both residential permit counts and square footage of new
commercial construction permitted. The building permits
database at the Census Bureau can be found at:
http://www.census.gov/construction/bps/
City Data: Economics and Demographics Data on the cities and their demographics come from the
American Community Survey (ACS) of the Census Bureau
through 2018. While this survey has some data limitation
for smaller municipalities and the unincorporated portions
of counties, it is the best current source of information on
cities and towns between the ten-year Census dates. Data
shown here are five-year averages.
CalTrans/CA Economic Forecast Data for the forecasts of jobs and population for all 58
California counties has been performed by CalTrans in
partnership with the California Economic Forecast from the
UCLA Anderson School of Business. This forecast is to
provide CalTrans with planning data for new roadways and
infrastructure as California’s economy and population
grow. The 2019 to 2050 version is available at CalTrans.
Rental and Home Prices Home rental prices come from ZillowTM Research, which has
information on rental price estimates for most
metropolitan areas and counties in the United States.
http://www.zillow.com/research/data/#rental-data
Time to Work Data on commuting workers come from the Census Bureau
and its partnership with the Bureau of Labor Statistics and
the QWI called the Longitudinal Employer-Household
Dynamics (LEHD) database. These data are from 2002 to
2018 as of January 2020.

58
Index of Economic and Community Progress
Economic Forensics and Analytics
Robert Eyler, Ph.D., President
PO Box 750641, Petaluma, CA 94975
(707) 318-0348 ◆ [email protected]
www.econforensics.com
County of Solano
Nancy Huston, Assistant County Administrator
675 Texas Street, Suite 6500, Fairfield, CA 94533
(707) 784-6100 ◆ [email protected]
www.solanocounty.com
Solano County Economic Development Corporation
Robert Burris, President
360 Campus Lane, Suite 102, Fairfield, CA 94534
(707) 784-1855 ◆ [email protected]
The 2019 Solano County Index of Economic and
Community Progress can be found at:
www.solanocounty.com/economicindex