social progress index 2014 report (main pages)
DESCRIPTION
Singapore is not included in the indexTRANSCRIPT

15Social Progress Index 2014
Social Progress Index 2014 results
RANK SCORE COUNTRYPPP GDP
PER CAPITA
1 88.24 New Zealand 25,857
2 88.19 Switzerland 39,293
3 88.07 Iceland 33,880
4 87.37 Netherlands 36,438
5 87.12 Norway 47,547
6 87.08 Sweden 34,945
7 86.95 Canada 35,936
8 86.91 Finland 31,610
9 86.55 Denmark 32,363
10 86.10 Australia 35,669
11 85.11 Austria 36,200
12 84.61 Germany 34,819
13 84.56 United Kingdom 32,671
14 84.21 Japan 31,425
15 84.05 Ireland 36,723
16 82.77 United States 45,336
17 82.63 Belgium 32,639
18 81.65 Slovenia 24,483
19 81.28 Estonia 18,927
20 81.11 France 29,819
21 80.77 Spain 26,395
22 80.49 Portugal 21,032
23 80.41 Czech Republic 23,815
24 78.93 Slovakia 21,175
25 77.75 Costa Rica 11,156
26 77.51 Uruguay 13,821
27 77.44 Poland 18,304
28 77.18 Korea, Republic of 27,991
29 76.93 Italy 26,310
30 76.30 Chile 15,848
31 73.91 Latvia 15,826
32 73.87 Hungary 17,033
33 73.76 Lithuania 18,799
34 73.68 Mauritius 13,056
35 73.43 Greece 20,922
36 73.31 Croatia 16,005
37 72.92 United Arab Emirates 36,267
38 72.58 Panama 14,320
39 71.40 Israel 27,296
40 70.66 Kuwait 40,102
41 70.61 Serbia 9,683
42 70.59 Argentina 11,658
43 70.39 Jamaica 7,083
44 70.24 Bulgaria 12,178
RANK SCORE COUNTRYPPP GDP
PER CAPITA
45 70.00 Malaysia 14,822
46 69.97 Brazil 10,264
47 69.88 Trinidad and Tobago 23,260
48 69.13 Albania 8,123
49 68.33 Macedonia 9,323
50 68.15 Ecuador 8,443
51 67.72 Romania 11,444
52 67.24 Colombia 9,143
53 66.80 Montenegro 10,602
54 66.41 Mexico 13,067
55 66.29 Peru 9,431
56 65.86 Philippines 3,801
57 65.60 Botswana 14,109
58 65.20 Belarus 13,427
59 65.14 Thailand 8,463
60 65.03 Armenia 7,374
61 64.99 Bosnia and Herzegovina 7,356
62 64.91 Ukraine 6,394
63 64.70 El Salvador 6,125
64 64.62 Turkey 13,737
65 64.38 Saudi Arabia 27,346
66 63.94 Georgia 5,086
67 63.78 Venezuela 11,623
68 63.03 Dominican Republic 8,794
69 62.96 South Africa 9,860
70 62.96 Tunisia 8,442
71 62.90 Bolivia 4,552
72 62.65 Paraguay 5,290
73 62.44 Azerbaijan 8,871
74 62.33 Nicaragua 3,510
75 61.92 Jordan 5,289
76 61.37 Guatemala 4,397
77 61.28 Honduras 3,657
78 61.19 Namibia 6,520
79 61.07 Cuba n/a
80 60.79 Russia 15,177
81 60.12 Moldova 2,951
82 60.06 Guyana 2,930
83 60.05 Lebanon 12,592
84 59.97 Egypt 5,795
85 59.71 Sri Lanka 5,384
86 59.47 Kazakhstan 11,973
87 59.13 Algeria 7,400
88 58.98 Indonesia 4,272
RANK SCORE COUNTRYPPP GDP
PER CAPITA
89 58.97 Mongolia 4,708
90 58.67 China 7,958
91 58.01 Morocco 4,573
92 57.34 Uzbekistan 3,095
93 57.08 Kyrgyzstan 2,077
94 56.65 Iran 10,405
95 56.05 Tajikistan 1,920
96 55.96 Ghana 1,764
97 53.52 Senegal 1,671
98 52.41 Laos 2,522
99 52.04 Bangladesh 1,622
100 51.89 Cambodia 2,150
101 51.58 Nepal 1,276
102 50.24 India 3,341
103 50.20 Kenya 1,522
104 49.88 Zambia 1,475
105 49.46 Rwanda 1,167
106 49.11 Benin 1,364
107 48.94 Lesotho 1,692
108 48.87 Swaziland 4,522
109 48.79 Malawi 660
110 47.99 Congo, Republic of 3,815
111 47.75 Uganda 1,165
112 47.33 Burkina Faso 1,304
113 46.85 Mali 1,047
114 46.06 Tanzania 1,380
115 45.95 Djibouti 2,051
116 45.51 Cameroon 2,025
117 45.23 Mozambique 882
118 44.84 Iraq 3,659
119 44.28 Madagascar 843
120 44.02 Liberia 560
121 43.11 Mauritania 2,244
122 42.80 Togo 906
123 42.65 Nigeria 2,335
124 42.40 Pakistan 2,402
125 40.23 Yemen 2,145
126 40.10 Niger 674
127 39.93 Angola 5,262
128 38.45 Sudan 1,894
129 37.41 Guinea 921
130 37.33 Burundi 483
131 34.17 Central African Republic 943
132 32.60 Chad 1,870
EXECUTIVE SUMMARY
16 Social Progress Index 2014
EXECUTIVE SUMMARY
SOCIAL PROGRESS AND ECONOMIC DEVELOPMENT
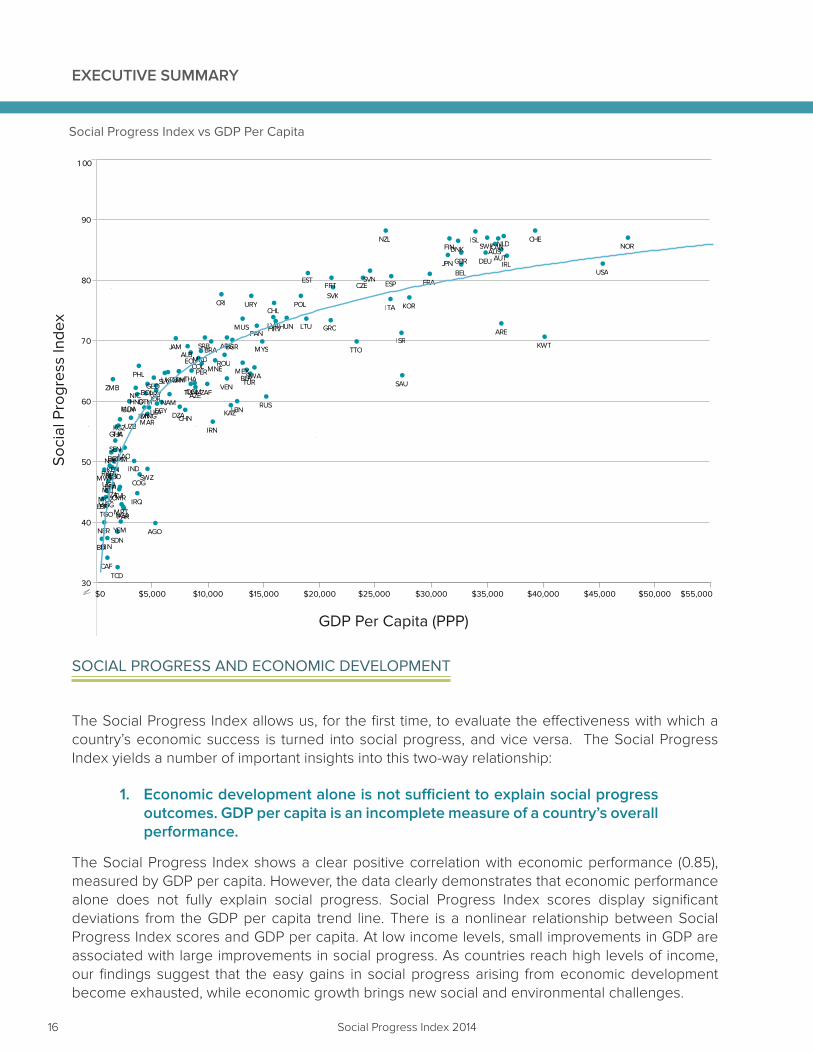
The Social Progress Index allows us, for the first time, to evaluate the effectiveness with which a country’s economic success is turned into social progress, and vice versa. The Social Progress Index yields a number of important insights into this two-way relationship:
1. Economic development alone is not sufficient to explain social progress outcomes. GDP per capita is an incomplete measure of a country’s overall performance.
The Social Progress Index shows a clear positive correlation with economic performance (0.85), measured by GDP per capita. However, the data clearly demonstrates that economic performance alone does not fully explain social progress. Social Progress Index scores display significant deviations from the GDP per capita trend line. There is a nonlinear relationship between Social Progress Index scores and GDP per capita. At low income levels, small improvements in GDP are associated with large improvements in social progress. As countries reach high levels of income, our findings suggest that the easy gains in social progress arising from economic development become exhausted, while economic growth brings new social and environmental challenges.
Social Progress Index vs GDP Per Capita
ZMBZAF
YEM
VEN
UZB
USA
URY
UKR
UGATZA
TURTUN
TTO
TJK
THA
TGO
TCD
SWZ
SWE
SVN
SVK
SRB
SLV
SEN
SDN
SAU
RWA
RUS
ROU
PRY
PRT
POL
PHL PER
PAN
PAK
NZL
NPL
NORNLD
NIC
NGA
NER
NAM
MYS
MWI
MUS
MRT
MOZ
MNG
MNE
MLI
MKD
MEX
MDG
MDA
MAR
LVA LTU
LSO
LKA
LBR
LBN
LAO
KWT
KOR
KHM
KGZ
KEN
KAZ
JPN
JOR
JAM
ITA
ISR
ISL
IRQ
IRN
IRL
IND
IDN
HUNHRV
HNDGUY
GTM
GRC
GIN
GHA
GEO
GBR
FRA
FIN
EST ESP
EGY
ECU
DZA
DOM
DNK
DJI
DEU
CZE
CRI
COL
COG
CMR
CHN
CHL
CHECAN
CAF
BWA
BRA
BOL
BLRBIH
BGR
BGD
BFA
BEN
BEL
BDI
AZE
AUTAUS
ARM
ARG
ARE
ALB
AGO
Soci
al P
rogr
ess
Inde
x
GDP Per Capita (PPP)
$5,000 $10,000 $15,000 $20,000 $25,000 $30,000 $35,000 $40,000 $45,000 $50,000 $55,000$030
40
50
60
70
80
90
1 00

111Social Progress Index 2014
APPENDIX 4 / DATA GAPS
Nut
ritio
n an
d B
asic
M
edic
al C
are
Wat
er a
nd S
anita
tion
Shel
ter
Pers
onal
Saf
ety
Acc
ess
to B
asic
K
now
ledg
e
Acc
ess
to In
form
atio
n an
d K
now
ledg
e
Hea
lth a
nd W
elln
ess
Ecos
yste
m
Sust
aina
bilit
y
Pers
onal
Rig
hts
Pers
onal
Fre
edom
and
C
hoic
e
Tole
ranc
e an
d In
clus
ion
Acc
ess
to A
dvan
ced
Educ
atio
n
AfghanistanAndorraAntigua and BarbudaBahamas, TheBahrainBarbadosBelizeBhutanBrunei DarussalamCape VerdeComorosCongo, Dem. Rep.Côte d'IvoireCyprusDominicaEquatorial GuineaEritreaEthiopiaFijiGabonGambia, TheGrenadaGuinea-BissauHaitiKiribatiKorea, Dem. Rep.LibyaLiechtensteinLuxembourgMaldivesMaltaMarshall IslandsMicronesiaMonacoMyanmarOmanPalauPapua New GuineaQatarSamoaSan MarinoSao Tome and PrincipeSeychellesSierra LeoneSingaporeSolomon IslandsSomaliaSouth SudanSt. Kitts and NevisSt. LuciaSt. Vincent and the GrenadinesSurinameSyrian Arab RepublicTimor-LesteTongaTurkmenistanTuvaluVanuatuViet NamZimbabwe
2 or more missing indicators
1 missing indicator