2019 - programmatic digital advertising technology & solutions€¦ · all rights reserved 2019...
TRANSCRIPT
2019GLOBAL DIGITALAD TRENDS

Innovation is a constant force driving the evolution of the digital media ecosystem. Digital channels are expected to provide nearly all incremental spend flowing into global ad budgets through 2020, and programmatic will account for most of that growth. Publishers and media buyers must understand the nuances and key trends impacting the market in order to capitalize on the vast opportunities available.
In such a fast-evolving industry, reliable data is the foundation of good business decisions. We have put together a compilation of key metrics, charts and insights to inform your 2019 strategies. This guide includes global advertising forecasts, growth trends for emerging and evolving formats, trends in header bidding, fraud protection, and more!
© 2 0 1 8 P U B M AT I C , I N C . A L L R I G H T S R E S E R V E D 2 0 1 9 G L O B A L D I G I TA L A D T R E N D S / 1
T A B L E O F C O N T E N T
US DIGITAL & PROGRAMMATIC MARKET 2
GLOBAL DIGITAL & PROGRAMMATIC MARKET 9
MOBILE ADVERTISING 17
VIDEO ADVERTISING 24
PRIVATE MARKETPLACES 32
HEADER BIDDING 37
INVENTORY & AD QUALITY 42

US DIGITAL & PROGRAMMATIC MARKET
© 2 0 1 8 P U B M AT I C , I N C . A L L R I G H T S R E S E R V E D 2 0 1 9 G L O B A L D I G I TA L A D T R E N D S / 2

PROJECTED AD REVENUE GROWTH IN NORTH AMERICA, BY MEDIA TYPEDigital media will account for nearly all advertising growth momentum in 2019.
Following a positive growth year, boosted by the World Cup and the midterm elections, Local TV is expected to experience double digit declines in 2019. Out of home is the only traditional media type forecasted to grow next year.
© 2 0 1 8 P U B M AT I C , I N C . A L L R I G H T S R E S E R V E D 2 0 1 9 G L O B A L D I G I TA L A D T R E N D S / 3© 2 0 1 8 P U B M AT I C , I N C . A L L R I G H T S R E S E R V E D 2 0 1 9 G L O B A L D I G I TA L A D T R E N D S / 3
0.2%
-3.5
%
9.9%
-14.
7%
15%
11.3
%
-16.
9%
-17.
8%
-3.8
%
-4.2
%
1.9% 2.5%
NAT
ION
AL T
V(I
NC.
CE)
LOCA
L TV
(IN
C. C
E)
DIGI
TAL
PRIN
T
RADI
O
OUT
OF H
OME
20192018
Source: Magna Global

PROJECTED US DIGITAL AD SPEND
Digital ad spend growth remains strong in the US, where over half of total media ad spend will be devoted to digital in 2019. That share is projected to rise to nearly two-thirds by 2022.
© 2 0 1 8 P U B M AT I C , I N C . A L L R I G H T S R E S E R V E D 2 0 1 9 G L O B A L D I G I TA L A D T R E N D S / 4© 2 0 1 8 P U B M AT I C , I N C . A L L R I G H T S R E S E R V E D 2 0 1 9 G L O B A L D I G I TA L A D T R E N D S / 4
Source: eMarketer
% of total media ad spendDigital ad spend
$187.88$172.39
$156.74
$132.32
$111.14
49.7%55.0%
59.6%62.4%
64.9%
2018 2019 2020 2021 2022
Billi
ons $200
$150
$100
$50
$0

PROJECTED US DIGITAL DISPLAY AD SPEND
The share of digital spend allocated to display advertising is expected to remain flat over the next four years. However, as digital advertising as a whole rises, display ad spend is projected to nearly double in the US between 2018-2022.
© 2 0 1 8 P U B M AT I C , I N C . A L L R I G H T S R E S E R V E D 2 0 1 9 G L O B A L D I G I TA L A D T R E N D S / 5© 2 0 1 8 P U B M AT I C , I N C . A L L R I G H T S R E S E R V E D 2 0 1 9 G L O B A L D I G I TA L A D T R E N D S / 5
Source: eMarketer
% of total digital ad spendDigital display ad spend
$97.18
$88.46
$79.85
$67.87
$57.42
51.7%
51.3% 50.9% 51.3% 51.7%
2018 2019 2020 2021 2022
Billi
ons $100
$75
$50
$25
$0

PROJECTED SHARE OF US DIGITAL DISPLAY AD SPEND, BY PURCHASE METHOD
Already the norm for digital display ad spend in the US, programmatic transactions will gain further market share as automation innovation continues to expand into new environments including in-app and video.
© 2 0 1 8 P U B M AT I C , I N C . A L L R I G H T S R E S E R V E D 2 0 1 9 G L O B A L D I G I TA L A D T R E N D S / 6© 2 0 1 8 P U B M AT I C , I N C . A L L R I G H T S R E S E R V E D 2 0 1 9 G L O B A L D I G I TA L A D T R E N D S / 6
N O N-P R O G R A M M A T I C 201915.5%
P R O G R A M M A T I C 201984.5%
201817.5%
201882.5%
Source: eMarketer

PROJECTED SHARE OF US PROGRAMMATIC DIGITAL DISPLAY AD SPEND, BY DEVICE
Mobile growth will outpace that of desktop to represent two-thirds of programmatic transactions in the US come 2019.
© 2 0 1 8 P U B M AT I C , I N C . A L L R I G H T S R E S E R V E D 2 0 1 9 G L O B A L D I G I TA L A D T R E N D S / 7© 2 0 1 8 P U B M AT I C , I N C . A L L R I G H T S R E S E R V E D 2 0 1 9 G L O B A L D I G I TA L A D T R E N D S / 7
Source: eMarketer
D E S K T O P 201934%
M O B I L E 201966%

LEADING PRIORITIES OF US COMPANIES’ MEDIA SPENDING OVER THE NEXT YEAR
Efficiency, measurement and attribution represent the leading priorities for US media buyers in 2019. Publishers and technology vendors alike can provide valuable tools and insights to support the continuation of advertising budget flows toward digital channels.
© 2 0 1 8 P U B M AT I C , I N C . A L L R I G H T S R E S E R V E D 2 0 1 9 G L O B A L D I G I TA L A D T R E N D S / 8© 2 0 1 8 P U B M AT I C , I N C . A L L R I G H T S R E S E R V E D 2 0 1 9 G L O B A L D I G I TA L A D T R E N D S / 8
53.3%Increase efficiency
42.0%
34.7%Improving ad viewability levels
31.1%
Establishing effective benchmarks in measuring campaign success
16.6%
40.8%Effective allocations of resources
% of Respondents, November 2018
0.2%Other
1.6%No top priorities
Demonstrating that marketing strategy aligns with business objectives
23.6%Gaining full transparency of campaign performance
16.1%Linking digital media with offline
Ensuring that all ad campaign run in brand-safe environments
Source: Xaxis

GLOBAL DIGITAL & PROGRAMMATIC MARKET
© 2 0 1 8 P U B M AT I C , I N C . A L L R I G H T S R E S E R V E D 2 0 1 9 G L O B A L D I G I TA L A D T R E N D S / 9

Digital display formats, including video, will contribute over half of incremental ad spend dollars projected for the 2017-2020 period. Display will represent over half of digital ad spend by 2019.
Digital as a whole will provide nearly all the projected growth for the global advertising market through 2020.
PROJECTED AD SPEND GROWTH WORLDWIDE, BY MEDIA TYPE/FORMAT, 2017-2020
© 2 0 1 8 P U B M AT I C , I N C . A L L R I G H T S R E S E R V E D 2 0 1 9 G L O B A L D I G I TA L A D T R E N D S / 1 0© 2 0 1 8 P U B M AT I C , I N C . A L L R I G H T S R E S E R V E D 2 0 1 9 G L O B A L D I G I TA L A D T R E N D S / 1 0
Internet Display
Internet Paid Search
Internet Classified
Outdoor
Cinema
Television
Source: Zenith
Radio
Magazines
Newspaper
$44.30
$22.40
$3.90
$3.00
$2.10
$6.80
$1.20
-$5.30
-$8.00
Billions

PROJECTED WORLDWIDE DIGITAL AD SPEND
Global digital ad spend growth rates remain strong. By 2020, digital advertising will represent that majority of total media ad spend worldwide.
© 2 0 1 8 P U B M AT I C , I N C . A L L R I G H T S R E S E R V E D 2 0 1 9 G L O B A L D I G I TA L A D T R E N D S / 1 1© 2 0 1 8 P U B M AT I C , I N C . A L L R I G H T S R E S E R V E D 2 0 1 9 G L O B A L D I G I TA L A D T R E N D S / 1 1
Source: eMarketer
% of total media ad spendDigital media ad spend
$457.85$420.15
$380.40
$327.28
$279.56
44.6%
48.5%52.2% 54.5% 56.4%
2018 2019 2020 2021 2022
Billi
ons $500
$400
$200
$100
$0
$300

TOP 5 DIGITAL AD SPEND MARKETS WORLDWIDE
China and the US are the only markets with over $10 billion in digital ad spend projected to grow at double-digit rates in 2019, expanding their lead as the largest digital ad markets in the world.
$ billions and % YOY change
© 2 0 1 8 P U B M AT I C , I N C . A L L R I G H T S R E S E R V E D 2 0 1 9 G L O B A L D I G I TA L A D T R E N D S / 1 2© 2 0 1 8 P U B M AT I C , I N C . A L L R I G H T S R E S E R V E D 2 0 1 9 G L O B A L D I G I TA L A D T R E N D S / 1 2
Source: PricewaterhouseCoopers; PubMatic calculations
$110.99
$99.82
US
Billi
ons $120
$80
$60
$0
$100
2018 2019
$60.81$53.42
CHINA
$16.72$15.47
UK
$13.71$13.00
JAPAN$8.82$8.35
GERMANY
$40
$20
+11%YOY C H A N G E
+14%YOY C H A N G E
+8%YOY C H A N G E
+5%YOY C H A N G E
+6%YOY C H A N G E

MAJOR DIGITAL AD SPEND MARKETS WORLDWIDE
Indonesia is the fastest-growing digital advertising market in the world, followed by India. Both are home to large populations of increasingly digital and mobile users.
© 2 0 1 8 P U B M AT I C , I N C . A L L R I G H T S R E S E R V E D 2 0 1 9 G L O B A L D I G I TA L A D T R E N D S / 1 3© 2 0 1 8 P U B M AT I C , I N C . A L L R I G H T S R E S E R V E D 2 0 1 9 G L O B A L D I G I TA L A D T R E N D S / 1 3
Source: PricewaterhouseCoopers, eMarketer; PubMatic calculations
$ billions and % YOY change
Billi
ons $8
$4
$0
$7
$2
$1
$6
$5
$3
+8%
AUST
RALI
A
+7%
SOUT
H KO
REA
+8%
CANA
DA
+8%
FRAN
CE
+19%
RUSS
IA
+9%
ITAL
Y
+13%
BRAZ
IL
+10%
NETH
ERLA
NDS
+11%
SWED
EN
+8%
SPAI
N
+26%
INDO
NESI
A
+9%
SWIT
ZERL
AND
+15%
MEX
ICO
+7%
DENM
ARK
+20%
INDI
A
+9%
NORW
AY
+13%
ARGE
NTIN
A
+5%
AUST
RIA
+7%
NEW
ZEA
LAND
+11%
HONG
KON
G
+11%
IREL
AND
+15%
THAI
LAND
2018 2019

PROJECTED PROGRAMMATIC AD SPEND WORLDWIDE
Programmatic transactions will represent more than two-thirds of digital display ad spend around the globe in 2019.
© 2 0 1 8 P U B M AT I C , I N C . A L L R I G H T S R E S E R V E D 2 0 1 9 G L O B A L D I G I TA L A D T R E N D S / 1 4© 2 0 1 8 P U B M AT I C , I N C . A L L R I G H T S R E S E R V E D 2 0 1 9 G L O B A L D I G I TA L A D T R E N D S / 1 4
Source: Zenith
% of digital display ad spendProgrammatic ad spend
$84.85
$71.46
$57.52
$44.61$31.28
58.8%45.1%52.9% 64.2%
2015 2016 2017 2018 2019
Billi
ons $100
$80
$40
$20
$0
$60 67.5%

TOP 5 PROGRAMMATIC* DIGITAL AD SPEND MARKETS WORLDWIDE
Double-digit YOY growth rates remain the norm among the largest programmatic advertising markets in the world. China, Japan and Australia stand out, however, underlining revenue growth opportunities for APAC publishers prepared to offer inventory through automation technology next year.
$ billions and % YOY change
© 2 0 1 8 P U B M AT I C , I N C . A L L R I G H T S R E S E R V E D 2 0 1 9 G L O B A L D I G I TA L A D T R E N D S / 1 5© 2 0 1 8 P U B M AT I C , I N C . A L L R I G H T S R E S E R V E D 2 0 1 9 G L O B A L D I G I TA L A D T R E N D S / 1 5
$18.02
$15.92
US
Billi
ons $20
$16
$12
$0
2018 2019
$5.72$4.62
CHINA
$2.68$2.22
JAPAN
$2.54$2.20
UK$1.33$1.14
AUSTRALIA
$8
$4
+13%YOY C H A N G E
+24%YOY C H A N G E +21%
YOY C H A N G E+15%YOY C H A N G E +17%
YOY C H A N G E
Source: Magna Global; PubMatic calculations*excludes search and social media

MAJOR PROGRAMMATIC* DIGITAL AD SPEND MARKETS WORLDWIDE
Indonesia, India and Brazil will be the fastest-growing programmatic digital ad markets in annual terms in 2019. Brazil will become only the seventh programmatic market to reach a billion-dollar valuation next year.
© 2 0 1 8 P U B M AT I C , I N C . A L L R I G H T S R E S E R V E D 2 0 1 9 G L O B A L D I G I TA L A D T R E N D S / 1 6© 2 0 1 8 P U B M AT I C , I N C . A L L R I G H T S R E S E R V E D 2 0 1 9 G L O B A L D I G I TA L A D T R E N D S / 1 6
$ millions and % YOY change
$1,400
$800
$0
$400
$200
$1,200
$1,000
$600
+19%
GERM
ANY
+45%
BRAZ
IL
+26%
FRAN
CE
+19%
ITAL
Y
+9%
CANA
DA
+9%
NETH
ERLA
NDS
+89%
INDO
NESI
A
+36%
ARGE
NTIN
A
+23%
SPAI
N
+12%
SWED
EN
+47%
INDI
A
+20%
MEX
ICO
+40%
HONG
KON
G SA
R
+14%
RUSS
IA
+33%
KORE
A
+14%
DENM
ARK
+10%
CZEC
H RE
PUBL
IC
+11%
NORW
AY
2018 2019Source: Magna Global; PubMatic calculations*excludes search and social media
Mill
ions

MOBILE ADVERTISING
© 2 0 1 8 P U B M AT I C , I N C . A L L R I G H T S R E S E R V E D 2 0 1 9 G L O B A L D I G I TA L A D T R E N D S / 1 7

PROJECTED MOBILE AD SPEND WORLDWIDE
Mobile advertising will surpass $200 billion worldwide in 2019. Growth rates will remain in double-digit territory through 2022, at which point mobile is projected to represent more than three-quarters of global digital ad spend.
© 2 0 1 8 P U B M AT I C , I N C . A L L R I G H T S R E S E R V E D 2 0 1 9 G L O B A L D I G I TA L A D T R E N D S / 1 8© 2 0 1 8 P U B M AT I C , I N C . A L L R I G H T S R E S E R V E D 2 0 1 9 G L O B A L D I G I TA L A D T R E N D S / 1 8
Source: eMarketer
% of digital ad spendMobile ad spend
$354.79
$318.53
$279.47
$232.34
$189.02
67.6%71.0%
73.5%75.8% 77.5%
2018 2019 2020 2021 2022
Billi
ons $400
$200
$100
$0
$300

TOP 5 MOBILE AD SPEND MARKETS WORLDWIDE
US mobile ad spend will expand most in absolute terms, raising the value of the US market by more than $11 billion in 2019 compared to a year prior. China is expected to experience the largest growth as a percentage of spend among the five largest mobile advertising markets.
$ billions and % YOY change
© 2 0 1 8 P U B M AT I C , I N C . A L L R I G H T S R E S E R V E D 2 0 1 9 G L O B A L D I G I TA L A D T R E N D S / 1 9© 2 0 1 8 P U B M AT I C , I N C . A L L R I G H T S R E S E R V E D 2 0 1 9 G L O B A L D I G I TA L A D T R E N D S / 1 9
Source: PricewaterhouseCoopers; PubMatic calculations
$72.51
$61.30
US
Billi
ons $80
$40
$20
$0
$60
2018 2019
$37.27
$30.00
CHINA
$9.03$7.78
UK
$7.00$6.36
JAPAN
$3.72$3.13
AUSTRALIA
+18%YOY C H A N G E
+24%YOY C H A N G E
+16%YOY C H A N G E
+10%YOY C H A N G E
+19%YOY C H A N G E

MAJOR MOBILE AD SPEND MARKETS WORLDWIDE
Indonesia and Russia are expected to experience the fastest mobile advertising growth in 2019, with each market rising 34% year over year. Additionally, Russia, Germany, Mexico, and Canada are projected to surpass $1 billion in mobile ad spend for the first time in 2019.
© 2 0 1 8 P U B M AT I C , I N C . A L L R I G H T S R E S E R V E D 2 0 1 9 G L O B A L D I G I TA L A D T R E N D S / 2 0© 2 0 1 8 P U B M AT I C , I N C . A L L R I G H T S R E S E R V E D 2 0 1 9 G L O B A L D I G I TA L A D T R E N D S / 2 0
$ millions and % YOY change
$3,500
$2,000
$0
$1,000
$500
$3,000
$2,500
$1,500
+19%
FRAN
CE
+8%
SOUT
H KO
REA
+19%
ITAL
Y
+34%
INDO
NESI
A
+24%
BRAZ
IL
+34%
RUSS
IA
+19%
GERM
ANY
+17%
MEX
ICO
+18%
CANA
DA
+32%
SWED
EN
+23%
NETH
ERLA
NDS
+27%
INDI
A
+18%
ARGE
NTIN
A
+14%
DENM
ARK
+24%
NORW
AY
+14%
SPAI
N
2018 2019
Mill
ions
Source: PricewaterhouseCoopers; PubMatic calculations

MOBILE INTERNET USERS WORLDWIDE
Mobile internet uptake has reached critical mass among consumers, with over 85 percent of internet users accessing the web via handheld devices. This provides advertisers and publishers alike with a strong incentive to increase investment in mobile strategies.
© 2 0 1 8 P U B M AT I C , I N C . A L L R I G H T S R E S E R V E D 2 0 1 9 G L O B A L D I G I TA L A D T R E N D S / 2 1© 2 0 1 8 P U B M AT I C , I N C . A L L R I G H T S R E S E R V E D 2 0 1 9 G L O B A L D I G I TA L A D T R E N D S / 2 1
Source: eMarketer
% of internet usersMobile internet users
3.713.57
3.413.23
3.04
84.6%86.2% 87.6% 88.8% 89.5%
2018 2019 2020 2021 2022
Billi
ons 4
2
1
0
3

MOBILE WEB VS. IN-APPMobile internet uptake among consumers is increasingly driven by apps, where users spend considerably more time per day. For advertisers and publishers, apps are a fundamentally different environment that brings new challenges and opportunities to the fore.
© 2 0 1 8 P U B M AT I C , I N C . A L L R I G H T S R E S E R V E D 2 0 1 9 G L O B A L D I G I TA L A D T R E N D S / 2 2© 2 0 1 8 P U B M AT I C , I N C . A L L R I G H T S R E S E R V E D 2 0 1 9 G L O B A L D I G I TA L A D T R E N D S / 2 2
Source: Smaato
IN-APPA P P
Device ID
GPS location, device type, OS, gender, age, wireless carrier
Ad blocking technology has not advanced to universally block in-app ads
T R A C K IN G ME T HOD
AVA IL A BL E US E R DATA
A D BL O C K IN G
AV E R A G E DA ILY US A G E
MOBILE WEBW W W[ [
Cookies
Web activity (e.g, shopping habits, favorite websites)
Vulnerability to in-browser ad blockers
33 minutes 3 hours 8 minutes

PROJECTED SHARE OF US MOBILE AD SPEND, BY PLATFORM
In-app environments are driving mobile ad spend growth to approach $80 billion in the US in 2019. More than eight-in-ten mobile ad dollars in the US will be allocated to in-app advertising next year.
Similar estimates are not yet available worldwide, but growing app adoption among global consumers is likely to spur in-app ad spend around the globe next year. In Q2 2018 alone, nearly 30 billion apps were downloaded worldwide.*
© 2 0 1 8 P U B M AT I C , I N C . A L L R I G H T S R E S E R V E D 2 0 1 9 G L O B A L D I G I TA L A D T R E N D S / 2 3© 2 0 1 8 P U B M AT I C , I N C . A L L R I G H T S R E S E R V E D 2 0 1 9 G L O B A L D I G I TA L A D T R E N D S / 2 3
M O B I L E W E B201917.4%
I N -A P P201982.6%
201819.1%
201880.9%
Source: eMarketer; *App Annie

VIDEO ADVERTISING
© 2 0 1 8 P U B M AT I C , I N C . A L L R I G H T S R E S E R V E D 2 0 1 9 G L O B A L D I G I TA L A D T R E N D S / 2 4

PROJECTED DIGITAL VIDEO AD SPEND WORLDWIDE
Video is expected to remain a key driver of advertising expenditures on display, projected to represent nearly two-thirds of non-social display ad spend next year.
© 2 0 1 8 P U B M AT I C , I N C . A L L R I G H T S R E S E R V E D 2 0 1 9 G L O B A L D I G I TA L A D T R E N D S / 2 5© 2 0 1 8 P U B M AT I C , I N C . A L L R I G H T S R E S E R V E D 2 0 1 9 G L O B A L D I G I TA L A D T R E N D S / 2 5
Source: Zenith; PubMatic calculations
% of total non-social displayVIdeo display ad spend
$43.23
$37.46
$31.97
$26.82
53.1%59.0%
62.9%66.6%
2017 2018 2019 2020
Billi
ons $50
$20
$10
$0
$40
$30

PROJECTED DIGITAL VIDEO AD SPEND WORLDWIDE, BY PLATFORM
Global video ad spend is quickly shifting toward mobile with the share of handheld devices rising from half to more than 70% in four years.
© 2 0 1 8 P U B M AT I C , I N C . A L L R I G H T S R E S E R V E D 2 0 1 9 G L O B A L D I G I TA L A D T R E N D S / 2 6© 2 0 1 8 P U B M AT I C , I N C . A L L R I G H T S R E S E R V E D 2 0 1 9 G L O B A L D I G I TA L A D T R E N D S / 2 6
Source: Cowen and Company; PubMatic calculations
46.5%
53.5%
$37.45
2018
40.0%
60.0%
$48.17
2019
34.9%
65.1%
$59.26
2020
31.5%
68.5%
$70.66
2021
28.8%
71.2%
$82.41
2022
Desktop (% of total) Mobile (% of total)
Billi
ons $100
$40
$20
$0
$80
$60

DIGITAL VIDEO METRICS WORLDWIDEAlthough mobile video ad spend has gained a strong footing, representing the majority of digital video spend, the portion of video ad budgets allocated to handheld devices still trails mobile’s penetration of digital video viewership globally.
© 2 0 1 8 P U B M AT I C , I N C . A L L R I G H T S R E S E R V E D 2 0 1 9 G L O B A L D I G I TA L A D T R E N D S / 2 7© 2 0 1 8 P U B M AT I C , I N C . A L L R I G H T S R E S E R V E D 2 0 1 9 G L O B A L D I G I TA L A D T R E N D S / 2 7
Source: eMarketer, Cowen and Company; PubMatic calculations
Video ad spend ($ billions)
2018 2019 2018 2019
DESKTOP MOBILE
$17.4 $19.3 $20.0 $28.9
% YOY change 16% 11% 54% 44%
% share of digital video ad spend, by device
47% 40% 53% 60%
Viewership (billions) 0.51 0.49 1.87 2.04
% YOY change -4% -4% 12% 9%
% penetration of digital video viewers 21% 19% 78% 81%

MOBILE VIDEO AD SPEND INTENT IN THE NEXT 12 MONTHS AMONG US AD BUYERS
Nearly 60% of digital ad budgets were allocated to video, totaling more than $10 billion in 2018.Although desktop video ad budget allocation remains strong, positive advertiser sentiment toward mobile platforms should fuel further growth for the coveted format via handheld devices.
© 2 0 1 8 P U B M AT I C , I N C . A L L R I G H T S R E S E R V E D 2 0 1 9 G L O B A L D I G I TA L A D T R E N D S / 2 8© 2 0 1 8 P U B M AT I C , I N C . A L L R I G H T S R E S E R V E D 2 0 1 9 G L O B A L D I G I TA L A D T R E N D S / 2 8
Source: Interactive Advertising Bureau
51%INCREASEAD SPEND
46%
3%
MAINTAINAD SPEND
DECREASEAD SPEND
% of Respondents, May 2018

PROJECTED DIGITAL VIDEO AD SPEND SHARE WORLDWIDE, BY PURCHASE METHOD
Just over half of digital video ad spend outside the walled gardens of social media was transacted programmatically in 2018. The programmatic* share worldwide should rise above 60% in 2019.
© 2 0 1 8 P U B M AT I C , I N C . A L L R I G H T S R E S E R V E D 2 0 1 9 G L O B A L D I G I TA L A D T R E N D S / 2 9© 2 0 1 8 P U B M AT I C , I N C . A L L R I G H T S R E S E R V E D 2 0 1 9 G L O B A L D I G I TA L A D T R E N D S / 2 9
201845.4%
201854.6%
Source: PubMatic calculations based on Zenith and Magna Global estimates; *excludes search and social media
N O N-P R O G R A M M A T I C 201938.0%
P R O G R A M M A T I C 201962.0%

TOP 5 PROGRAMMATIC* VIDEO AD SPEND MARKETS WORLDWIDE
Automation technology is only beginning to gain traction for video monetization and robust double-digit growth rates remain commonplace even in the US. Brazil will be the fastest-growing market in this group, rising 54% to approach $1 billion in 2019.
$ billions and % YOY change
© 2 0 1 8 P U B M AT I C , I N C . A L L R I G H T S R E S E R V E D 2 0 1 9 G L O B A L D I G I TA L A D T R E N D S / 3 0© 2 0 1 8 P U B M AT I C , I N C . A L L R I G H T S R E S E R V E D 2 0 1 9 G L O B A L D I G I TA L A D T R E N D S / 3 0
Source: Magna Global; PubMatic calculations; *excludes social media
$10.05
$7.76
US
Billi
ons $11
$5
$3
$0
$8
2018 2019
$3.36
$2.48
CHINA
$1.77$1.32
JAPAN
$1.76$1.38
UK
$1.00$0.65
BRAZIL
+30%YOY C H A N G E
+36%YOY C H A N G E +34%
YOY C H A N G E+28%YOY C H A N G E +54%
YOY C H A N G E
$10
$9
$7
$6
$4
$1
$2

MAJOR PROGRAMMATIC* VIDEO AD SPEND MARKETS WORLDWIDE
Indonesia will see programmatic video ad spend double in 2019, making it the fastest-growing market for the format in the world. India and Hong Kong are projected to expand more than 50% YOY during the same period.
© 2 0 1 8 P U B M AT I C , I N C . A L L R I G H T S R E S E R V E D 2 0 1 9 G L O B A L D I G I TA L A D T R E N D S / 3 1© 2 0 1 8 P U B M AT I C , I N C . A L L R I G H T S R E S E R V E D 2 0 1 9 G L O B A L D I G I TA L A D T R E N D S / 3 1
Source: PricewaterhouseCoopers, eMarketer, PubMatic calculations
$ millions and % YOY change
Mill
ions $900
$400
$0
$700
$200
$100
$600
$500
$300
+25%
AUST
RALI
A
+42%
FRAN
CE
+39%
GERM
ANY
+31%
ITAL
Y
+24%
CANA
DA
+105
%IN
DONE
SIA
+30%
MEX
ICO
+47%
ARGE
NTIN
A
+39%
SPAI
N
+52%
HONG
KON
G SA
R
+21%
NETH
ERLA
NDS
+20%
SWED
EN
+54%
INDI
A
2018 2019
$800

© 2 0 1 8 P U B M AT I C , I N C . A L L R I G H T S R E S E R V E D 2 0 1 9 G L O B A L D I G I TA L A D T R E N D S / 3 2
PRIVATE MARKETPLACES
© 2 0 1 8 P U B M AT I C , I N C . A L L R I G H T S R E S E R V E D 2 0 1 9 G L O B A L D I G I TA L A D T R E N D S / 3 2

PROJECTED US PRIVATE MARKETPLACE DIGITAL DISPLAY AD SPEND
US private marketplaces (PMPs) will continue to grow at double digit rates through 2020 as buyers and sellers of digital impressions seek more control over their transactions.
© 2 0 1 8 P U B M AT I C , I N C . A L L R I G H T S R E S E R V E D 2 0 1 9 G L O B A L D I G I TA L A D T R E N D S / 3 3© 2 0 1 8 P U B M AT I C , I N C . A L L R I G H T S R E S E R V E D 2 0 1 9 G L O B A L D I G I TA L A D T R E N D S / 3 3
Source: eMarketer
% of total programmatic display ad spendPMP ad spend
$12.85
$11.04
$8.99
$6.81
18.5% 19.3% 19.4% 19.6%
2017 2018 2019 2020
Billi
ons $15
$12
$6
$3
$0
$9

PROJECTED SHARE OF US PROGRAMMATIC* DIGITAL DISPLAY AD SPEND, BY TRANSACTION METHOD
More than half of all US programmatic digital display ad spend will be transacted by private marketplaces by 2020.
© 2 0 1 8 P U B M AT I C , I N C . A L L R I G H T S R E S E R V E D 2 0 1 9 G L O B A L D I G I TA L A D T R E N D S / 3 4© 2 0 1 8 P U B M AT I C , I N C . A L L R I G H T S R E S E R V E D 2 0 1 9 G L O B A L D I G I TA L A D T R E N D S / 3 4
O P E N E X C H A N G E 202049%
P R I V A T E M A R K E T P L A C E 2020
201854%
201846%
Source: eMarketer; *excludes programmatic direct
51%

PROJECTED US PRIVATE MARKETPLACE AD SPEND SHARE, BY DEVICE
Mobile will account for over two-thirds of all US PMP ad spend by 2020. However, it will continue to trail the share the device achieves of overall programmatic ad spend.
© 2 0 1 8 P U B M AT I C , I N C . A L L R I G H T S R E S E R V E D 2 0 1 9 G L O B A L D I G I TA L A D T R E N D S / 3 5© 2 0 1 8 P U B M AT I C , I N C . A L L R I G H T S R E S E R V E D 2 0 1 9 G L O B A L D I G I TA L A D T R E N D S / 3 5
Source: eMarketer; *excludes programmatic direct
44.0%
56.0%
2017
42.0%
58.0%
2018
38.0%
62.0%
2019
33.0%
67.0%
2020
Desktop Mobile
Billi
ons $14
$8
$4
$0
$12
$10
$6
$2

MONETIZED MOBILE PRIVATE MARKETPLACE VOLUME, BY PLATFORM
Globally, the expansion of mobile private marketplace volume has been fueled by growth within in-app environments.
© 2 0 1 8 P U B M AT I C , I N C . A L L R I G H T S R E S E R V E D 2 0 1 9 G L O B A L D I G I TA L A D T R E N D S / 3 6
Source: PubMatic
2017
85% 64%
36%
15%
Q22017
Q22018
IN-APP
MOBILE WEB
+41%M OBIL E P MPV OL UMEYOY C H A N G E
+6%YOY C H A N G E
+244%YOY C H A N G E
A P P
W W W[ [

HEADER BIDDING

HEADER BIDDING ADOPTION
Over three-quarters of publishers that have embraced programmatic advertising have adopted header bidding. However, the technology remains in the early stages among the majority of the Alexa Top 3,000.
July 2018
© 2 0 1 8 P U B M AT I C , I N C . A L L R I G H T S R E S E R V E D 2 0 1 9 G L O B A L D I G I TA L A D T R E N D S / 3 8
S I T E S I N H B I X (TOP 1,000 SITES THAT DO PROGRAMMATIC ADVERTISING)
76%
Source: Adzerk
A L E X A T O P 3,000 S I T E S
22%

SHARE OF MONETIZED HEADER BIDDING VOLUME WORLDWIDE, BY DEVICE
Header bidding is considered a mature browser technology, including both desktops and the mobile web.
© 2 0 1 8 P U B M AT I C , I N C . A L L R I G H T S R E S E R V E D 2 0 1 9 G L O B A L D I G I TA L A D T R E N D S / 3 9
Source: PubMatic
Q32017
Q32018
81% 72%
28%19%
DESKTOP
+18%YOY C H A N G E
+3%YOY C H A N G E
+95%YOY C H A N G E
MOBILE

MONETIZED IN-APP HEADER BIDDING VOLUME WORLDWIDE
Triple-digit quarterly growth rates have been the norm in the early days of in-app header bidding adoption in 2018. Expect further gains in 2019 as current SDK drawbacks are addressed with server-to-server setups.
© 2 0 1 8 P U B M AT I C , I N C . A L L R I G H T S R E S E R V E D 2 0 1 9 G L O B A L D I G I TA L A D T R E N D S / 4 0
Source: PubMatic
Q42017
Q12018
Q22018
Q32018
QoQ C H A N G E+86%
QoQ C H A N G E+452%
QoQ C H A N G E+881%

MAIN FACTORS PREVENTING APP PUBLISHERS IN NORTH AMERICA FROM USING IN-APP HEADER BIDDING
For in-app header bidding adoption to become widespread, ad tech providers must ensure the technology is understood by publishers.
© 2 0 1 8 P U B M AT I C , I N C . A L L R I G H T S R E S E R V E D 2 0 1 9 G L O B A L D I G I TA L A D T R E N D S / 4 1
Source: InMobi
31%
Limited understanding of technology
23%
Implementation issue
11%
Difficulty scaling PMP deals
11%
Latency
10%
Compatibility issues
14%
Few programmtic deals/mostly direct deals

INVENTORY AND AD QUALITY

QUALITY MATTERS TO DIGITAL AD BUYERS AND SELLERS
© 2 0 1 8 P U B M AT I C , I N C . A L L R I G H T S R E S E R V E D 2 0 1 9 G L O B A L D I G I TA L A D T R E N D S / 4 3
Source: AdLightening, ExchangeWire
WHAT IS INVENTORY QUALITY?Inventory quality covers anything from domain spoofing to viewability to fraudulent arbitrage.
WHAT IS AD QUALITY?Ad quality covers anything from advertiser category mapping to malicious creatives.
+59%
LEADING CHALLENGES OF ADDRESSING AD QUALIT Y ISSUES
It's difficult to track down bad actors in the supply chain
+41%
Ad tech solutions don’t scan every ad for issues
+34%
Demand partners don’t do enough to resolve issues
+33%
Partners don’t respond when issues arise
+30%
Ad tech solutions don’t block bad ads
+78%
MAJOR CHALLENGES OF PROGRAMMATIC BUYING
Lack of transparency around media buys
+59%
Brand safety
+54%
Technological capabilities of third-party technology
+52%
Accessing quality data
+52%
Lack of education/understanding

PROPORTIONAL WASTED AD SPEND DUE TO COMMON FRAUD TACTICS IN 2018
As in-app ad spend balloons, challenges remain ahead. An estimated $25.8 billion worth of ad spend was wasted globally in 2018, including 42.3% linked to app install farms or SDK spoofing.
© 2 0 1 8 P U B M AT I C , I N C . A L L R I G H T S R E S E R V E D 2 0 1 9 G L O B A L D I G I TA L A D T R E N D S / 4 4
A P P I N S T A L L F A R M S O R S D K S P O O F I N G
42.3%
Source: Juniper Research
C L I C K I N J E C T I O N F R A U D
30.3%
C L I C K S P A M & A D S T A C K I N G
27.3%
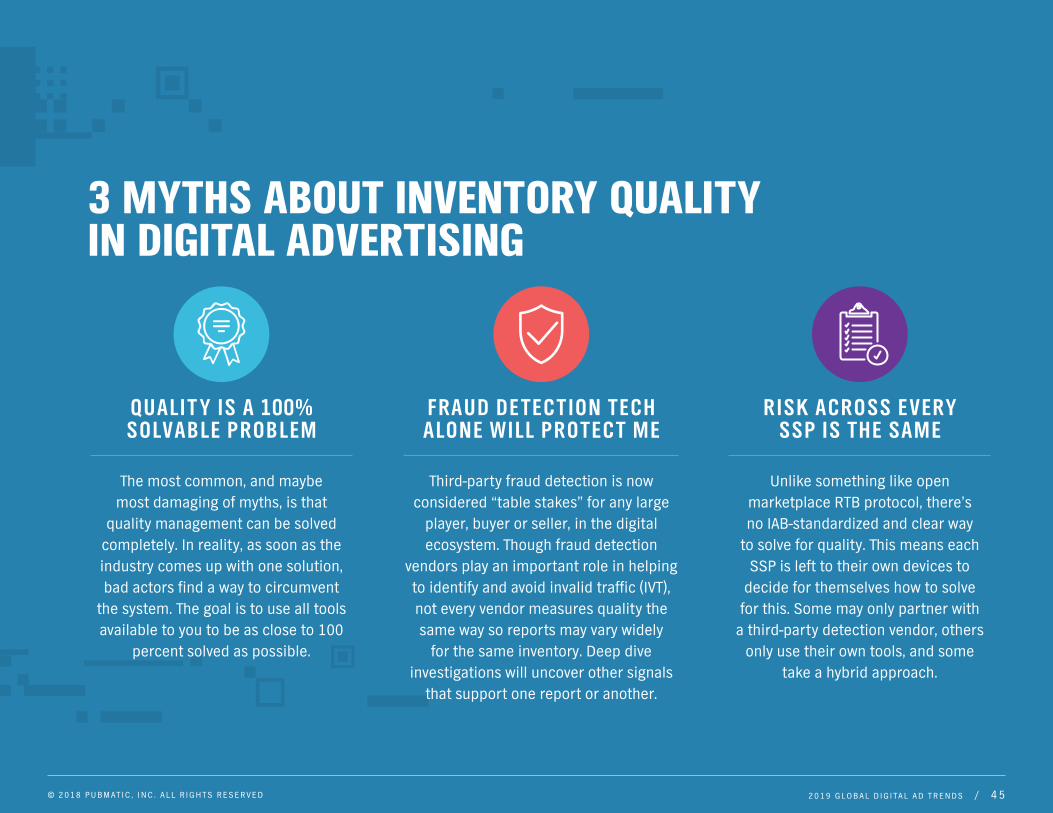
3 MYTHS ABOUT INVENTORY QUALITY IN DIGITAL ADVERTISING
© 2 0 1 8 P U B M AT I C , I N C . A L L R I G H T S R E S E R V E D 2 0 1 9 G L O B A L D I G I TA L A D T R E N D S / 4 5
QUALIT Y IS A 100% SOLVABLE PROBLEM
The most common, and maybe most damaging of myths, is that
quality management can be solved completely. In reality, as soon as the industry comes up with one solution, bad actors find a way to circumvent
the system. The goal is to use all tools available to you to be as close to 100
percent solved as possible.
FRAUD DE TECT ION TECH ALONE WILL PROTECT ME
Third-party fraud detection is now considered “table stakes” for any large
player, buyer or seller, in the digital ecosystem. Though fraud detection
vendors play an important role in helping to identify and avoid invalid traffic (IVT), not every vendor measures quality the same way so reports may vary widely
for the same inventory. Deep dive investigations will uncover other signals
that support one report or another.
RISK ACROSS E VERY SSP IS THE SAME
Unlike something like open marketplace RTB protocol, there’s no IAB-standardized and clear way
to solve for quality. This means each SSP is left to their own devices to
decide for themselves how to solve for this. Some may only partner with
a third-party detection vendor, others only use their own tools, and some
take a hybrid approach.

DIGITAL AD VIEWABILITY RATES WORLDWIDE, BY PLATFORM, FORMAT AND PURCHASE METHOD
Consumers are watching more video content and moving their viewing habits to multiple screens and devices. The engaging format remains the most viewable across devices.On the other hand, mobile display viewability remains essentially a toss-up as just over 50% of banners actually in view across apps and the mobile web in H1 2018.
© 2 0 1 8 P U B M AT I C , I N C . A L L R I G H T S R E S E R V E D 2 0 1 9 G L O B A L D I G I TA L A D T R E N D S / 4 6
71.5%MOBILE WEB VIDEO 65.2%
53.2%MOBILE APP DISPLAY 53.7%
54.5%MOBILE WEB DISPLAY 51.8%
72.4%DESK TOP VIDEO 64.3%
Source: Integral Ad Science
63.7%DESK TOP DISPLAY 61.2%
Publisher direct Programmatic

DESKTOP DISPLAY VIEWABILITY RATE IN SELECT COUNTRIESAmong major digital advertising markets in Europe and the Americas, viewability* rates have improved most in the United Kingdom and France. Germany remains the leading market in the category, with more than two-thirds of desktop display ads in view in H1 2018.
© 2 0 1 8 P U B M AT I C , I N C . A L L R I G H T S R E S E R V E D 2 0 1 9 G L O B A L D I G I TA L A D T R E N D S / 4 7
Source: Integral Ad Science; *per MRC standard
67.0%
58.1%
GERMANY
63.4%
48.0%
UK
62.1%
51.8%
FRANCE
59.9%
53.6%
US
55.0%50.1%
SPAIN
H1 2017 H1 2018
47.4%
40.8%
ITALY

DESKTOP DISPLAY AD FRAUD RATE IN SELECT COUNTRIESRoughly half of all programmatic ad spend worldwide is still devoted to the US market. At such scale, it is hardly surprising that fraudsters target this market more aggressively than any other. US-led initiatives such as TAG certification and ads.txt appeared to have a positive impact however, with ad fraud rates in the US market dropping 10% YOY in H1 2018.
© 2 0 1 8 P U B M AT I C , I N C . A L L R I G H T S R E S E R V E D 2 0 1 9 G L O B A L D I G I TA L A D T R E N D S / 4 8
Source: Integral Ad Science
0.7%
0.5%
GERMANY
0.7%
0.5%
UK
0.4%0.2%
FRANCE
1.8%
2.0%
US
0.5%
0.1%
SPAIN
H1 2017 H1 2018
0.8%
0.4%
ITALY

© 2 0 1 8 P U B M AT I C , I N C . A L L R I G H T S R E S E R V E D
PUBMATIC CONTACT
Press Contact:
BLAST [email protected]
About PubMaticPubMatic is a publisher-focused sell-side platform for an open digital media future. Featuring leading omni-channel revenue automation technology for publishers and enterprise-grade programmatic tools for media buyers, PubMatic’s publisher-first approach enables advertisers to access premium inventory at scale. Processing over 12 trillion advertiser bids per month, PubMatic has created a global infrastructure to drive publisher monetization and control over their ad inventory. Since 2006,
PubMatic’s focus on data and technology innovation has fueled the rise of the programmatic industry as a whole. Headquartered in Redwood City, California, PubMatic operates 13 offices and six data centers worldwide.
PubMatic is a registered trademark of PubMatic, Inc. Other trademarks are the property of their respective owners.
Sales Contacts:
JEFFREY HIRSCHChief Marketing Officer and
Head of US Publisher Development
CRAIG CHINNVP, Chief Customer Success
Officer
KYLE DOZEMANVP, Advertiser Solutions, US
BILL SWANSONChief Revenue Officer, EMEA
JASON BARNESChief Revenue Officer, APAC