2020 half year results presentation for personal use only
TRANSCRIPT

1
Capel, Western Australia
Iluka Resources Limited
2020 Half Year Results Presentation
Tom O’Leary, Managing DirectorAdele Stratton, Chief Financial OfficerChristian Barbier, Head of Marketing
For
per
sona
l use
onl
y

Disclaimer and Compliance Statement
This presentation has been prepared by Iluka Resources Limited (Iluka). By accessing this presentation you acknowledge that you have read and understood the following statement.
This document provides an indicative outlook for the Iluka business in the 2019 financial year. The information is provided to assist sophisticated investors with the modelling of the company, but should not be relied upon as a predictor of future performance. The current outlook parameters supersede all previous key physical and financial parameters.
This information is based on Iluka forecasts and as such is subject to variation related to, but not restricted to, economic, market demand/supply and competitive factors. It is Iluka’s approach to modify its production settings based on market demand, and this can have a significant effect on operational parameters and associated physical and financial characteristics of the company.
Forward Looking Statements
This presentation contains certain statements which constitute “forward-looking statements”. Often, but not always, forward looking statements can generally be identified by the use of forward looking words such as “may”, “will”, “expect”, “plan”, “believes”, “estimate”, “anticipate”, “outlook” and “guidance”, or similar expressions, and may include, without limitation, statements regarding plans; strategies and objectives of management; anticipated production and production potential; estimates of future capital expenditure or construction commencement dates; expected costs or production outputs; estimates of future product supply, demand and consumption; statements regarding future product prices; and statements regarding the expectation of future Mineral Resources and Ore Reserves.
Where Iluka expresses or implies an expectation or belief as to future events or results, such expectation or belief is expressed in good faith and on a reasonable basis. No representation or warranty, express or implied, is made by Iluka that the matters stated in this presentation will in fact be achieved or prove to be correct.
Forward-looking statements are only predictions and are subject to known and unknown risks, uncertainties, assumption and other important factors that could cause the actual results, performances or achievements of Iluka to differ materially from future results, performances or achievements expressed, projected or implied by such forward-looking statements. Readers are cautioned not to place undue reliance on these forward-looking statements, which speak only as of the date thereof. Such risks and factors include, but are not limited to: changes in exchange rate assumptions; changes in product pricing assumptions; major changes in mine plans and/or resources; changes in equipment life or capability; emergence of previously underestimated technical challenges; increased costs and demand for production inputs; and environmental or social factors which may affect a licence to operate, including political risk.
Capital estimates include contingency and risk allowances commensurate with international estimating classification systems.
To the extent permitted by law, Iluka, its officers, employees and advisors expressly disclaim any responsibility for the accuracy or completeness of the material contained in this presentation and exclude all liability whatsoever (including in negligence) for any loss or damage which may be suffered by a person as a consequence of any information in this presentation or any error or omission therefrom. Iluka does not undertake to release publicly any revisions to any forward-looking statement to reflect events or circumstances after the date of this presentation, or to reflect the occurrence of unanticipated events, except as may be required under applicable securities laws.
No independent third party has reviewed the reasonableness of the forward looking statements or any underlying assumptions.
Iluka cautions against reliance on any forward-looking statements or guidance, particularly in light of the current economic climate and the significant volatility, uncertainty and disruption caused by COVID-19.
Non-IFRS Financial Information
This document contains non-IFRS financial measures including cash production costs, non production costs, Mineral Sands EBITDA, Underlying Group EBITDA, EBIT, free cash flow, and net debt amongst others. Iluka management considers these to be key financialperformance indicators of the business and they are defined and/or reconciled in Iluka’s annual results materials and/or Annual report. Non-IFRS measures have not been subject to audit or review.
All figures are expressed in Australian dollars unless stated otherwise.
Mineral Resources and Ore Reserves Estimates
As an Australian company with securities listed on the Australian Securities Exchange (ASX), Iluka is subject to Australian disclosure requirements and standards, including the requirements of the Corporations Act and the ASX. Investors should note that it is a requirement of the ASX listing rules that the reporting of ore reserves and mineral resources in Australia comply with the 2012 edition of the Australasian Code for Reporting of Exploration Results, Mineral Resources and Ore Reserves (the “JORC Code”) and that the Ore Reserve and Mineral Resource estimates underpinning the production targets in this presentation have been prepared by a Competent Person in accordance with the JORC Code 2012.
Information that relates to Mineral Resources estimates has been previously announced to ASX on 21 February 2019 in 2018 Annual Report, on 24 July 2019 in Eneabba Mineral Sands Recovery Project Updated Mineral Resource Estimate, and on 20 February 2017 in Updated Mineral Resource and Ore Reserve Statement, all available at www.iluka.com/investors-media/asx-disclosures. Iluka confirms that it is not aware of any new information or data that materially affects the information included in the original market announcement and that all material assumptions and technical parameters underpinning the estimates continue to apply and have not materially changed. Iluka confirms that the form and context in which the Competent Person’s findings are presented have not been materially modified from the original market announcements.
Production outlook
Production outlook and the basis thereof are noted within the relevant disclosure. The outlook included in this presentation is indicative only and should not be construed as guidance. The information is subject to changes in market and operating conditions; political risk; and any significant unplanned operational issues.
2F
or p
erso
nal u
se o
nly

Iluka’s Commitment to Sustainability 3
Iluka’s Sustainability Approach
Key Pillars
• Health and Safety
• People
• Social Performance
• Environmental Stewardship
• Economic Responsibility and Governance
27%Reduction in Serious
Potential Injuries (H1 2020: 29 H1 2019: 40)
304hectares
rehabilitated in H1 2020
ZeroMajor environmental
incidents
3.2 TRIFRH1 2020 (2019: 2.9)
Approach
• Creating a culture that recognises all members of the workforce are leaders in promoting a safe environment
• Maintaining an engaged, diverse and capable workforce
• Use resources efficiently, leaving positive rehabilitation and closure outcomes
• Respect human rights, engage meaningfully with stakeholders and communities in which we operate
29%Board
Femalerepresentation
33%Exec. Mgt.
26%Indigenous Employment at
Jacinth-Ambrosia
Murray Basin
For
per
sona
l use
onl
y

COVID-19 Update 4
Approach and response
Health and Safety Measures
Iluka has implemented a number of health and safety measures across all sites to effectively manage the risks and impacts of the virus while maintaining operational continuity
• Roster changes, increased cleaning and site based physical distancing measures
• Site-specific risk-based Infectious Disease Management Plans in place
• Employee support programs, including mental health focus
Operational and Project Changes
Changes to operational settings have been implemented in response to the uncertain market conditions – aimed at reducing costs and preserving cash to maintain a strong balance sheet:
• Altered production settings at the Narngulu mineral separation plant from Q2 to reduce zircon production in light of market conditions
• Return from Ambrosia to mining at Jacinth from August 2020 to reduce costs and defer tailings management capital spend
• Balranald field trial has been able to commence with some easing of travel restrictions in New South Wales
• Other projects continue, focussed on progressing non-site based technical and desktop study work
Maintaining Strong Financial Position
• Focus on costs and capital discipline
• Accessed Australian Government JobKeeper payment ($6 million)
• Deferral of 2019 final tax payment to H2 2020 ($99 million)
Iluka’s first priority is the safety and wellbeing of its people, their families, and the communities in which the company operates. During this period of uncertainty, the company has maintained operations across all sites and marketing and logistics channels remain open.
For
per
sona
l use
onl
y

First Half 2020 - Key Features
Solid earnings in challenging marketUnderlying group EBITDA $225 million despite challenging business conditions, particularly in the zircon market (H1 2019: $274 million)
NPAT $113 million, down 18% (H1 2019: $137 million)
Retained strong margins
Mineral sands EBITDA margin 39%, down slightly from 43% in H1 2019
Margins supported by relatively stable pricing, with a modest decline in zircon prices of 6% following strong efforts to contain price erosion and rutile prices up 7%
AUD:USD movement partially offset reduced sales volumes
Mining Area C royalty business Mining Area C royalty EBITDA up 16% to $48 million, reflecting higher iron ore prices
Work continues towards completion of demerger in H2 2020 - booklet expected to be provided to shareholders in September
Demonstrated operational flexibilityAltered operational settings at Narngulu mineral separation plant to reduce zircon production in line with market conditions,and a return from mining at Ambrosia to Jacinth to reduce costs
Eneabba Phase 1 project delivered, Phase 2 approved
Eneabba Phase 1 operation commissioned and first shipment of monazite-zircon concentrate dispatched
Execute for Eneabba Phase 2 approved by Board - expected to deliver value accretive opportunity and next step in Iluka’s incremental approach to entering rare earth market
Strong balance sheet maintainedNet cash of $62 million as at 30 June 2020 ($43 million net cash as at 31 December 2019)
Focus on cash preservation and disciplined capital allocation - return of mining to Jacinth and deferral of 2019 final tax payment ($99 million to be paid September 2020)
5F
or p
erso
nal u
se o
nly

Demerger update 6
Iluka continues to work towards completion of the demerger in H2 2020, with Iluka to retain a 20% stake. The demerger booklet isexpected to be provided to shareholders in September. The new royalty business will be called Deterra Royalties.
Deterra Royalties Board and Key Management
• In addition to Jennifer Seabrook, Independent Chair, appointments to the Deterra Royalties Board (subject to shareholder approval of the proposed demerger) are:
‒ Graeme Devlin, Independent Non-Executive Director
‒ Joanne Warner, Independent Non-Executive Director
‒ Adele Stratton, Non-Executive Director (Iluka nominee)
• The Board reflects a diverse range of expertise in the global resources sector including mining investment, project finance, business development, capital markets, funds management and corporate governance. More detailed biographies in supplementary information.
• Brendan Ryan will be joining Deterra Royalties as CFO
‒ 30 years commercial and operational experience, including CFO and senior business development roles at BoartLongyear and Rio Tinto
September 2020Demerger booklet provided
to shareholders
October 2020Shareholder vote
Demerger timing
• Board approval to put the demerger to shareholders in the coming weeks with planned timeline, subject to final Board and other approvals:
Jennifer Seabrook
Chair
Julian Andrews
MD & CEO
Graeme Devlin
Non-Executive
Director
Joanne Warner
Non-Executive
Director
Adele Stratton
Non-Executive
Director
(Iluka nominee)
• Iluka continues to engage with the ATO and remains confident in receiving a favourable ruling
Deterra Royalties Board
For
per
sona
l use
onl
y

Financial Results
For
per
sona
l use
onl
y

Key Financial Metrics
Units H1 2020 H1 2019 % Change
Z/R/SR Production kt 287.8 323.5 (11.0) ▼
Z/R/SR Sales kt 241.6 301.8 (19.9) ▼
Mineral sands revenue $m 456.6 545.6 (16.3) ▼
Mineral sands EBITDA $m 177.0 232.7 (23.9) ▼
Mineral sands EBITDA margin % 38.8 42.7 3.9pp ▼
MAC EBITDA $m 48.0 41.2 16.5 ▲
Underlying Group EBITDA1 $m 225.1 273.9 (17.8) ▼
Profit for the period (NPAT) $m 113.2 137.2 (17.5) ▼
Operating cash flow $m 96.7 179.9 (46.2) ▼
Free cash flow2 $m 46.2 (65.2) n/a ▲
Dividend cps XX 5 XX
At 30 Jun
2020
At 31 Dec
2019
Net (debt) cash $m 62.3 43.3 43.8 ▲
Gearing ratio3 % n/a n/a n/a -
1. Underlying Group EBITDA excludes non-recurring adjustments including impairments and changes to rehabilitation provisions for closed sites which are non-cash in nature.
2. Free Cash Flow is determined as cash flow before refinance costs, proceeds/repayment of borrowings and dividends paid in the year. Free Cash Flow includes the proceeds received from IFC for their stake in Sierra Rutile.
3. Gearing ratio = Net debt / net debt + equity
8
$113m NPATH1 2020
($137m H1 2019)
$225m Group EBITDA
H1 2020($274m H1 2019)
For
per
sona
l use
onl
y

NPAT – H1 2020 versus H1 2019
Main contributors to H1 2020 results:
• Reduced sales volumes due to the impact of COVID-19 on markets
• Lower US$ exchange rate (65.7 cents versus 70.6 cents) positively impacting sales receipts
• Higher unit cost of goods sold, reflecting higher cost of synthetic rutile from Cataby ilmenite and higher COGS at Sierra Rutile
9
137
113
( 16 )
( 48 )
( 9 )
43
( 30 )
4
9 7
( 3 )
1 2
14
0
20
40
60
80
100
120
140
160
30 June2019
Price Vol Mix FX UnitCOGS
Idle Min SandOther
MAC Corp Corp &Idle Depn
Int Tax 30 June2020
$m
For
per
sona
l use
onl
y

Net Debt – 31 December 2019 to 30 June 2020 10
Main contributors to H1 2020 cash flow:
• Operational setting changes to reduce cash costs and preserve operating cash flow
• Disciplined capital allocation to progress studies (modest capex of $50 million)
• Increase royalty receipts
0
20
40
60
80
100
120
140
160
180
200
Opening netcash
31 Dec 2019
Operating cashflow
MAC royalty Exploration Interest Tax* Capex Other operatingcash flows
Dividends Other financingcash flows
Closing net debt30 June 2020
$m
97
43
42
(6) (1)
(39)
4
(33)
5
62
HY 2020 free cash inflow $46 million
(50)
* Does not include deferred 2019 final tax payment to H2 2020 ($99 million)
For
per
sona
l use
onl
y

-10
0
10
20
30
40
-200
0
200
400
600
800
1000
H1
14
H2
14
H1
15
H2
15
H1
16
H2
16
H1
17
H2
17
H1
18
H2
18
H1
19
H2
19
H1
20
Gearing %$m
Total facilities available Net debt (cash) Gearing*
Balance Sheet
* Net debt / net debt + equity
Net Debt, Gearing and Funding Headroom
• Maintained net cash position while investing $50 million in capital expenditure
‒ net cash of $62.3 million (31 Dec 2019: net cash $43.3 million)
• Significant funding headroom of $434 million undrawn facilities
11
Multi Option Facility Agreement (MOFA)
• Total facilities $523 million
• Maturity July 2024
• MOFA remains in place post demerger
For
per
sona
l use
onl
y

Mining Area C (MAC) Royalty Terms
• Royalty over iron ore from BHP’s Mining Area C in Western Australia
• Royalty terms:
‒ 1.232% of Australian denominated revenue from royalty area; and
‒ one-off payment of A$1 million per million tonne increase in annual capacity
Mining Area C Royalty 12
~$930m EBITDA
Since MAC mining commenced
$48m EBITDA
H1 2020($41m H1 2019)
H1 2020 H1 2019 % change
Sales volumes MDMT 28.6 27.8 2.9
Implied price A$/t 132.9 120.2 10.6
Net Royalty income $m 47.0 41.2 14.1
Annual capacity payments $m 1.0 - -
Iluka EBITDA $m 48.0 41.2 16.5
(mdmt = million dry metric tonnes)
South Flank Development Update
• Expansion in Mining Area C royalty area to ~145wmtpa
• Project 76% complete (as at 30 June 2020)
• Remains on schedule for first production in the middle of the 2021 calendar year
• 30+ year life Source: BHP
For
per
sona
l use
onl
y

Mineral Sands Markets
Sierra LeoneFor
per
sona
l use
onl
y

Key FeaturesZircon Market Update 14
Result
• H1 2020 sales 78kt (H1 2019: 133kt)
‒ Q2 sales of 53 kt (-21% YoY) after Q1 sales of 25kt (-62% YoY)
• Key markets significantly impacted by COVID-19 shutdowns
Pricing
• H1 2020 weighted average received zircon (premium and standard) price US$1,354/t, down 6% from H2 2019
• Pricing remains relatively stable given challenging market conditions
‒ strong effort to contain price erosion
Supply/Demand
• Widespread shutdowns of key industries during Feb-May 2020 due to COVID-19
• Tile manufacturers in China and Europe have partially restarted but operating rates remain around 50-60% of pre-pandemic previous levels
• Foundry markets impacted by reduced demand for automotive and other consumer goods and industrial parts
• Fused zirconia and zircon chemicals markets remained solid in first half but potential for softness next quarter
• Customer inventories remain low with focus on conserving cash
• Iluka has changed operational settings at Narngulu to reduce zircon output and finished goods inventory
Zircon36%
H1 2020 Z/R/SR Sales Revenue
Zircon (premium and standard) net realised FOB price US$/t
0
400
800
1200
1600
H1 16 H2 16 H1 17 H2 17 H1 18 H2 18 H1 19 H2 19 H1 20
US$/t
For
per
sona
l use
onl
y

Key FeaturesZircon Market Update 15
Sales by Region
• Chinese lockdowns of industry significantly impacted Q1 sales
• Sales to China improved in Q2 as restrictions eased and economy reopened
• Q2 sales to other regions (ex China) impacted by COVID-19 related restrictions
Half yearly zircon sales by industry
0
50
100
150
H1 19 H2 19 H1 20
kt
Ceramics Chemicals Fused zirconia
Refractories Foundry Other
Sales by industry
• Significant decline in sales to ceramics industry due to end demand and impact of lockdowns on manufacturers
• Refractory and fused zirconia remained relatively solid
Half yearly zircon sales by region
0
50
100
150
H1 19 H2 19 H1 20
kt
China EMEI Other Asia Americas
EMEI = Europe, Middle East, India
For
per
sona
l use
onl
y

Key FeaturesHigh-Grade Titanium Feedstock Market Update 16
Result
• H1 2020 sales of 163kt (H1 2019: 169kt)
• Demand slowdown occurred in 2Q in all end markets due to COVID-19 impacts
Pricing
• First half rutile price of US$1,246/t, up 7% from H2 2019
Supply/Demand
• After a solid Q1 pigment demand declined in Q2 by ~20%, despite strong performance of DIY and packaging applications
• Pigment customers reduced capacity utilisation rates and pulled forward planned maintenance in H1
• Pigment producer results show improving trend with gradual demand improvement over May, June and July
• Reports from paint producers indicate possible improvement early Q3
• Welding segment remained fairly resilient, while titanium sponge end-demand affected by downturn in aerospace market
Rutile30%
Synthetic rutile 34%
H1 2020 Z/R/SR Sales Revenue
Rutile net realised FOB price US$/t
0
400
800
1200
1600
H1 16 H2 16 H1 17 H2 17 H1 18 H2 18 H1 19 H2 19 H1 20
US$/t
For
per
sona
l use
onl
y
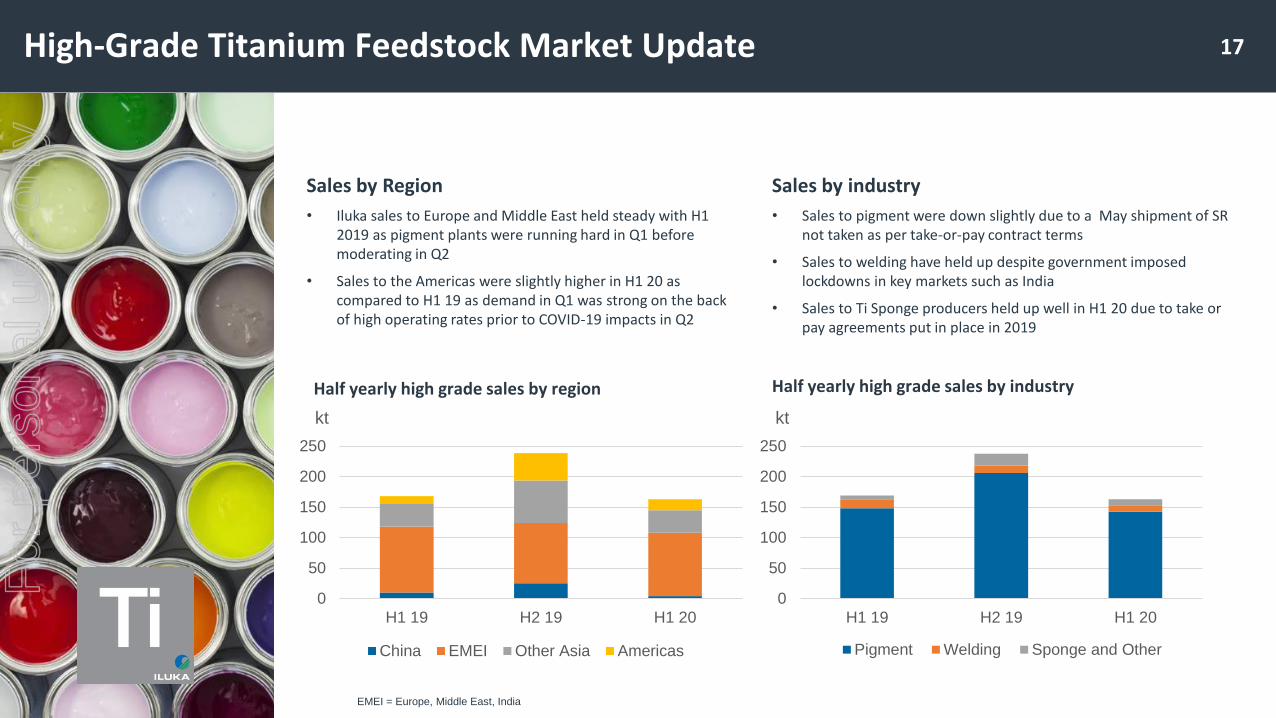
Key FeaturesHigh-Grade Titanium Feedstock Market Update 17
Sales by Region
• Iluka sales to Europe and Middle East held steady with H1 2019 as pigment plants were running hard in Q1 before moderating in Q2
• Sales to the Americas were slightly higher in H1 20 as compared to H1 19 as demand in Q1 was strong on the back of high operating rates prior to COVID-19 impacts in Q2
Half yearly high grade sales by industry
0
50
100
150
200
250
H1 19 H2 19 H1 20
kt
Pigment Welding Sponge and Other
Sales by industry
• Sales to pigment were down slightly due to a May shipment of SR not taken as per take-or-pay contract terms
• Sales to welding have held up despite government imposed lockdowns in key markets such as India
• Sales to Ti Sponge producers held up well in H1 20 due to take or pay agreements put in place in 2019
Half yearly high grade sales by region
0
50
100
150
200
250
H1 19 H2 19 H1 20
kt
China EMEI Other Asia Americas
EMEI = Europe, Middle East, India
For
per
sona
l use
onl
y

Mineral Sands Operations
Gbeni, Sierra LeoneFor
per
sona
l use
onl
y

19
Full mining rates at Cataby in 1H 2020 and synthetic rutile production at capacity
Mineral Sands Operations – Cataby / South West
Operations Overview
• Large chloride ilmenite rich mine 150km from Perth
• Ilmenite to feed synthetic rutile kiln
• Synthetic rutile offtake contracts in place
• Provides material zircon and rutile production (processed at Narngulu)
• Began operations in 2019 with 8.5 year mine life, and potential 4 year extensionZircon23kt
Rutile12kt
Synthetic rutile112kt
H1 2020 Production
H1 2020 Operational Settings and Outlook
• Mining and processing settings as planned in H1 2020
• Reduction in synthetic rutile offtake volumes as announced in June 2020
‒ 175kt of synthetic rutile subject to take or pay arrangements in 2020
‒ 78kt sold under these contracts in 1H (total sales 88kt)
‒ notice of Default issued against Chemours for failure to take scheduled shipments and proceedings commenced for breach of contract
‒ another customer has notified of reduction of 12kt shipment in September
• Production settings will be monitored in context of customer offtake levels and Iluka maintains its ability to adjust if appropriate
For
per
sona
l use
onl
y

20
Altered mining and processing settings in light of market conditions
Mineral Sands Operations – Jacinth-Ambrosia / Mid West
Operations Overview
• World’s largest zircon mine
• Iluka’s major source of zircon production
• Narngulu mineral separation plant processes Jacinth-Ambrosia material (to produce zircon, Hyti and ilmenite) and Cataby non-magnetic stream (to produce zircon and rutile)
Zircon69kt
Rutile10kt
H1 2020 Production
H1 2020 Operational Settings and Outlook
• Mining successfully returned from Ambrosia to Jacinth, with less than 2 days to safely move to the new location and restart mining on 1 August
‒ improved cash flow from lower operating costs mainly due to lower strip ratio
‒ lower unit costs (less haulage and pumping distance)
‒ expected cash cost savings ~$30m 2020-2022
‒ delayed capital spend required for tailings facilities
• Mining to continue at full rate to optimise unit costs
• Altered production settings at Narngulu to reduce zircon production
‒ if settings remained in place for 2020, zircon production would be ~170kt (~110kt less than previously guided level)
• Narngulu plant retains full flexibility to return to higher production in 24 hours
For
per
sona
l use
onl
y

21
Dry mining at Lanti and Gangama operations with processing at the operation’s mineral separation plant
Mineral Sands Operations – Sierra Rutile
Operations Overview
• Began operations 1960s
• Acquired by Iluka in December 2016
• World’s largest rutile mine
• Transition to dry mining following successful decommissioning of dredge and delivery of Gangama and Lanti expansion projects in 2019 Rutile
62kt
H1 2020 Production
H1 2020 Operational Settings and Outlook
• H1 production impacted by infrastructure moves, mining of lower grade areas and lower throughputs due to several downtime events
• COVID-19 disruptions included closed borders which impacted operations at site – some specialised skillsets typically provided by expatriate resources were not available
• Iluka providing additional assistance to manage local impacts of COVID-19
For
per
sona
l use
onl
y

22Mineral Sands Operations – Inventory Position
Inventory increase reflects operational setting changes and market uncertainty due to COVID-19
• Increase in total inventory to $560 million ($425 million at December 2019)
• Increase reflects higher work in progress (heavy mineral concentrate), zircon and synthetic rutile finished products
• Retain strong balance sheet to support inventory position
• Continue to manage operational settings and inventories in response to market conditions
0
200
400
600
800
1000
Jun
-10
De
c-1
0
Jun
-11
De
c-1
1
Jun
-12
De
c-1
2
Jun
-13
De
c-1
3
Jun
-14
De
c-1
4
Jun
-15
De
c-1
5
Jun
-16
De
c-1
6
Jun
-17
De
c-1
7
Jun
-18
De
c-1
8
Jun
-19
De
c-1
9
Jun
-20
$ million
Finished Goods Work in Progress*
Total Inventory
Normalised inventory level
* Includes ilmenite and consumables
For
per
sona
l use
onl
y

23Eneabba progresses to Phase 2
Eneabba, Western Australia
Eneabba Phase 1 Delivered
• First production in April 2020 and first shipment of 9kt monazite-zircon concentrate in June 2020
• Offtake agreement for 50ktpa for 2 years
• Pricing commercial in confidence - recognises monazite and zircon value
• Low capex ~$10 million, low opex , ~6 FTE, utilise existing water and power infrastructure, transport to Geraldton for export
• ~98% recoveries expected due to minimal processing
Eneabba Phase 2 Execute approved by Board
• Iluka Board has approved ~$35 million to progress execution of Eneabba Phase 2
• project will involve upgrading and separating mineral sands concentrate (from Phase 1) to a ~90% monazite concentrate product1
• upgraded concentrate suitable as direct feedstock for rare earth cracking and leaching plant, with additional streams of zircon,ilmenite and HyTi products
Rare Earth Elements
Eneabba monazite contains high value elements, including neodymium and praseodymium.
Key end use applications of these elements is in permanent magnets, as used in electric cars, wind turbines and advanced metal alloys.
Eneabba Rare Earths Project
Eneabba involves the extraction, processing and marketing of a high grade monazite-rich strategic stockpile. Phase 1 is operational and involves sale of monazite-zircon concentrate requiring minimal capital and processing.
Further development is being fast tracked that will see additional processing to produce a higher-value monazite product.
Iluka is actively exploring the potential for downstream processing.
The phased approach to development allows Iluka to gain an increased understanding of the market and industry and proceed in a low risk manner.
1. Refer to Supplementary Information slide for further project parameters.
For
per
sona
l use
onl
y

Projects
Drilling, New South WalesFor
per
sona
l use
onl
y

25
1. Refer to the 2019 Annual Report for additional information. The Mineral Resource (MR) information on this indicative growth pipeline summary is extracted from the company’s previously published MR statements and are available at: www.iluka.com.au . Iluka confirms that it is not aware of any new information or data that materially affects the information included in the original market announcements and, in the case of estimates of Mineral Resources or Ore Reserves, that all material assumptions and technical parameters underpinning the estimates in the relevant market announcement continue to apply and have not materially changed. Iluka confirms that the form and context in which the Competent Person’s findings are presented have not been materially modified from the original market announcement. All Mineral Resource figures are estimates. This slide should be read in conjunction with disclaimers and compliance statement on slide 2.
Project Pipeline Summary
Region Mineral Resource1 ASSESSScoping Study
SELECTPreliminary Feasibility Study
DEVELOPDefinitive Feasibility Study
EXECUTEProject execution
PRODUCINGOperate and maximise
Eucla Basin361Mt @ 4.8% HM for
17.4Mt In Situ HM
Murray Basin195Mt @ 17.2% HM for
33.4Mt In Situ HM
Mid West / South West WA
994Mt @ 5.6% HM for 55.6Mt In Situ HM
Sierra Leone739Mt @ 1.1% Rutile for
8.2Mt In Situ Rutile
Sri Lanka673Mt @ 8.1% HM for
54.6Mt In Situ HM
Stage description: Determine what it could be Determine what it should be Determine what it will be Deliver the project Grow and improve
Estimate Accuracy Range (atend of phase):
-30% to +60% -15% to +30% -10% to +15% n/a n/a
Puttalam
Sembehun GangamaLanti
Wimmera
Eneabba (Phase 1)
SR1 Kiln Restart
Atacama
Balranald
Jacinth-Ambrosia
Cataby
South West
Deposits
No Resource estimate Resource estimate Reserve estimate Other
Eneabba (Phase 2)
Iluka develops and gates projects in a disciplined manner towards execution subject to acceptable progress in the following areas: (i) confidence in satisfactory project risk-return attributes, (ii) high level of strategic alignment, and (iii) sequenced to take advantage of the economic and market lookout
For
per
sona
l use
onl
y

26Balranald field trial commenced
Balranald Project
The Balranald project comprises the West Balranald and Nepean deposits, two large, deep, high grade rutile, zircon and ilmenite rich deposits. The depth of the deposits makes conventional open-pit development challenging.
An Iluka developed directional drilling Underground Mining Technology (UMT) provides an opportunity to develop the deposit.
If able to be applied, UMT would be a significant milestone in mining technology and potentially unlock other assets within Iluka’s portfolio not feasible to access with conventional mining. There is also potential to commercialise UMT for other assets globally.
UMT is also scaleable, providing the ability to utilise infrastructure at nearby deposits to Balranald
Third Technology Trial (T3)
• A third technology trial (T3) to determine the economic viability of the technology in a continuous mining and processing environment
• Approved by Board in August 2019, trial costs of ~$40m
• Trial timing had been delayed due to travel restrictions associated with the COVID-19 pandemic. However, in close collaboration with contractors and technology partners, personnel and resources have been mobilised to site and trial activities commenced.
• Absent any further COVID-19 related delays, preliminary results of the trial are expected in Q4 2020.
For
per
sona
l use
onl
y

Summary and Outlook
Rehabilitated land, Murray BasinFor
per
sona
l use
onl
y

Summary and Outlook 28
H1 2020 Key Features
• Key markets initially impacted by COVID-19 shutdowns with subsequent restart but at reduced utilisation
• Operational settings altered in response to demonstrate discipline in market supply and reduce finished product inventory build
• Enacted measures to conserve cash flow and maintain strong balance sheet
• Delivered solid earnings and net cash
• Commencement of Phase 1 operations at Eneabba and approval of Phase 2 rare earths project execute
• Zircon pricing showed modest easing while rutile pricing increased, which supported earnings over the period given challenging market conditions
H2 2020 Areas of Focus
• Progress execution of Deterra Royalties demerger
• Continue to monitor market conditions and optimise operational settings as appropriate
• Progression of Balranald technology trial and results
• Continued focus on disciplined capital allocation
For
per
sona
l use
onl
y

Supplementary Information
Jacinth-Ambrosia, South AustraliaFor
per
sona
l use
onl
y

Biographies of Deterra Royalties Board and Management 30
JENNIFER SEABROOKIndependent Chair
• Over 30 years experience across capital markets, mergers and acquisitions and accounting advisory roles and numerous directorships
• Currently a non-executive director of BGC and Australian Rail Track Corporation
• Select previous directorships include Iluka Resources, MMG, Export Finance and Insurance Corporation and AlintaGas
JULIAN ANDREWSManaging Director &
Chief Executive Officer
• More than 20 years experience in diversified portfolio investment, project finance, capital raising and mergers and acquisitions across a range of industries including mining, energy and chemicals
• Previous roles include Head of Strategy, Planning & Business Development at Iluka Resources and prior to that held roles as General Manager, Business Development and Chief Financial Officer in Wesfarmers Chemicals, Energy & Fertilisers division
GRAEME DEVLINIndependent
Non-Executive Director
• Highly experienced mining executive, served as BHP’s head of acquisitions and divestments from 2009 to 2016
• Previous experience in variety of business development, investment evaluation, project and structured finance roles within BHP group, Rio Tinto and CRA Limited
• Instrumental in leading several global business development opportunities within BHP, including the fundamental strategic reshaping of BHP’s core asset portfolio during his tenure as head of assets and divestments, including the demerger of South32
JOANNE WARNERIndependent
Non-Executive Director
• Extensive global asset management experience in mining and energy sector, including 8 years as Head of Global Resources at Colonial First State Global Asset Management
• Currently a non-executive director of First Quantum Minerals, a globally diversified TSX-listed base metals group, and Geo40 Limited, a pioneering company focused on the extraction of silica and other minerals from geothermal fluids associated with power generation
ADELE STRATTONNon-Executive Director,
Iluka Nominee
• Joined Iluka in 2011 and was appointed Chief Financial Officer in September 2018. In the intervening period held numerous senior roles across the company, most recently General Manager Finance, Investor Relations and Corporate Affairs
• Qualified chartered accountant with 20 years’ experience working in both practice and public listed companies, including holding roles within KPMG’s assurance practice and Rio Tinto Iron Ore
BRENDAN RYANChief Financial Officer
• Over 30 years of commercial and operational experience in the global mining industry, most recently served as Chief Financial Officer and Chief Business Development Officer at Boart Longyear
• Previously held a number of senior business development roles at Rio Tinto with a focus on evaluation and delivery of investment opportunities across a range of commodities including copper, nickel, zinc and diamonds, culminating in the position of Rio Tinto’s Global Head of Business Evaluation from 2012 to 2015
For
per
sona
l use
onl
y

31Eneabba Phase 2 Project Approval Parameters
Eneabba Key Project Parameters
Notes: All values approximate. Production figures stated as estimated recovered mineral in the concentrate. Payback period
based on externally sourced long term monazite price forecast and internal mineral sands prices.
Metric
(average over project life)Comment
Life of Mine (Phase 1 and Phase 2) ~10 yearsBased on reserve and production rates assumed
below
Ore mined (Phase 1 and Phase 2) ~100ktpa
Average annual production
(Phase 1 only)
Monazite-zircon concentrate ~50ktpa Offtake contract for 50ktpa for 2 years
Average annual production
(from Phase 2)
90% monazite concentrate 16-20kpta No offtake contracts in place at present
Zircon 7-9ktpa Re-based recovery to produce Premium grade
Ilmenite ~20kpta Saleable or suitable synthetic rutile feed
HyTi90 ~1ktpa
Cash costs (from Phase 2) $35-40 million p.a.
Capital expenditure
Phase 1 (execute 2019) <$10 million
Phase 2 (execute August 2020) ~$35 million
Payback period (Phase 2 capex) <1 year Payback from first production of Phase 2
Mineral
Resource
Category
Resource
Tonnes1
In situ
HM
Tonnes4
HM
Mineral Assemblage in HM3
Zircon Monazite Xenotime Ilmenite
(Mt) (Mt) (%) (%) (%) (%) (%)
Measured 0.84 0.70 83.7 25.7 20.2 1.2 33
Indicated 0.16 0.12 77.5 7.6 15.3 1.2 37
Total 1.0 0.83 82.7 26.0 19.5 1.2 34
Notes:
1. In situ (dry) metric tonnage is reported.
2. Ore Reserves are a sub-set of Mineral Resources.
3. Mineral assemblage is reported as a percentage of HM.
4. Rounding may generate differences in the last decimal place.
5. ASX Release “Eneabba Mineral Sands Recovery Project Ore Reserve Estimate” 18 Feb 2020 available at
www.iluka.com
Ore
Reserve
Category
Reserve
Tonnes1,2
In situ
HM
Tonnes4
HM
Mineral Assemblage in HM3
Zircon Monazite Xenotime Ilmenite
(Mt) (Mt) (%) (%) (%) (%) (%)
Proved 0.81 0.68 84.4 26 20 1.2 33
Probable 0.15 0.12 78.3 28 15 1.2 37
Total 0.96 0.80 83.5 26 20 1.2 34
Eneabba Mineral Resources and Ore Reserves5
For
per
sona
l use
onl
y

H1
2020
H1
2019% change
Production
Zircon kt 92.2 159.9 (42.3)
Rutile kt 84.0 80.8 4.0
Synthetic rutile kt 111.6 82.8 34.8
Total Z/R/SR production kt 287.8 323.5 (11.0)
Ilmenite – saleable and upgradeable kt 215.4 125.0 72.3
Total production volume kt 503.2 448.5 12.2
Heavy mineral concentrate produced kt 601 480 25.2
Heavy mineral concentrate processed kt 520 456 14.1
Sales
Zircon kt 78.4 133.3 (41.2)
Rutile kt 74.7 82.9 (9.9)
Synthetic rutile kt 88.5 85.6 3.4
Total Z/R/SR kt 241.7 301.8 (19.9)
Ilmenite kt 107.1 121.5 (11.9)
Total sales volumes kt 348.8 423.3 (17.6)
Revenue and Cash Costs
Mineral sands revenue1 $m 456.6 545.6 (16.3)
Total cash cost of production $m 293.2 251.8 16.4
Unit cash production cost per tonne of Z/R/SR produced2 $/t 983 755 30.1
Unit cost of goods sold per tonne of Z/R/SR sold $/t 961 861 11.6
Revenue per tonne of Z/R/SR sold $/t 1,689 1,681 0.5
Production and Sales Volumes, Revenue and Cash Costs
Supplementary Information
1. Includes revenues derived from other materials not included in production volumes, including activated carbon products and iron concentrate. Iluka receives a royaltypayment from its Mining Area C iron ore royalty. This is not reported as part of quarterly reports but is disclosed in the financial statements.
2. Excludes ilmenite and by-products.
32F
or p
erso
nal u
se o
nly

Note 1: Zircon prices reflect the weighted average price for zircon premium and zircon standard, also with a weighted average price for all zircon materials, including zircon-in-concentrate. The prices for each product vary, as does the mix of such products sold period to period. In the first half of 2020 the split of zircon sand and concentrate by zircon sand-equivalent was approximately: 80%:20% (2019 full year: 70%:30%).
Note 2: Excluded from rutile sales prices is a lower value titanium dioxide product, HYTI that typically has a titanium dioxide content of 70 to 90%. This product sells at a lower price than rutile, which typically has a titanium dioxide content of 95%.
Note 3: Iluka’s synthetic rutile sales are, in large part, underpinned by commercial offtake arrangements. The terms of these arrangements, including the pricing arrangements are commercial in confidence and as such not disclosed by Iluka. Synthetic rutile, due to its lower titanium dioxide content than rutile, is priced lower than natural rutile.
Weighted Average Received Prices
Supplementary Information 33
1st half2019
2nd half2019
1st half2020
US$/tonne FOB
Zircon Premium and Standard 1,522 1,446 1,354
Zircon (all products, including zircon in concentrate)1 1,465 1,299 1,265
Rutile(excluding HYTI)2 1,108 1,167 1,246
Synthetic rutile Refer Note 3 Refer Note 3 Refer Note 3
For
per
sona
l use
onl
y

Summary Group Results
Supplementary Information
$m H1 2020 H1 2019 % change
Mineral sands revenue 456.6 545.6 (16.3)
Mineral sands EBITDA 177.0 232.7 (23.9)
Mineral sands EBITDA margin % 38.8 42.7 3.9pp
Mining Area C royalty EBITDA 48.0 41.2 16.5
Underlying group EBITDA* 225.1 273.9 (17.8)
Depreciation and amortisation (74.7) (64.7) 15.5
Group EBIT 174.5 216.9 (19.5)
Profit (loss) before tax 163.2 200.8 (18.7)
Tax expense (50.0) (63.6) (21.4)
Profit (loss) after tax 113.2 137.2 (17.5)
EPS (cents per share) 26.8 32.5 (63.0)
Free cash inflow (outflow) 46.2 (65.2) n/aFree cash inflow (outflow) (cents per share) 10.9 (15.5) n/aDividend – fully franked (cents per share) - 5.0 -
Net (debt) cash 62.3 (141.5) n/a
Gearing (net debt / net debt + equity) % n/a 10.7 n/a
Average AUD/USD exchange rate 65.8 70.6 (6.8)
* Underlying Group EBITDA excludes non-recurring adjustments including impairments and changes to rehabilitation provisions for closed sites which are non-cash in nature.
34F
or p
erso
nal u
se o
nly

Income Statement
Supplementary Information
H1 H1
$ million 2020 2019 % changeZ/R/SR revenue 415.9 507.2 (18.0)
Ilmenite and other revenue 40.7 38.4 6.0
Mineral Sands Revenue 456.6 545.6 (16.3)
Cash costs of production (293.2) (251.8) 16.4
Inventory movement - cash 98.1 36.8 166.6
Restructure and idle capacity charges (8.2) (11.8) (30.5)
Government royalties (9.5) (21.5) (55.8)
Marketing and selling costs (15.8) (15.2) 3.9
Asset sales and other income 6.5 (3.2) n/a
Major Projects, exploration and innovation (31.2) (19.4) 60.8
Corporate and other costs (29.3) (25.9) 13.1
Foreign exchange 3.0 (0.9) n/a
Mineral sands EBITDA 177.0 232.7 (23.9)
Mining Area C EBITDA 48.0 41.2 16.5
Underlying Group EBITDA 225.1 273.9 (17.8)
Depreciation and amortisation (74.7) (64.7) 15.5
Inventory movement - non-cash 24.5 8.0 206.3
Rehabilitation for closed sites (0.4) (0.3) 33.3
Group EBIT 174.5 216.9 (19.5)
Net interest costs and bank charges (4.0) (6.3) (36.5)
Rehabilitation unwind and other finance costs (7.3) (9.8) (25.5)
Profit (loss) before tax 163.2 200.8 (18.7)
Tax expense (50.0) (63.6) (21.4)
Profit (loss) for the period (NPAT) 113.2 137.2 (17.5)
Average AUD/USD (cents) 65.8 70.6 (6.8)
1. Freight revenue and expenses are included as a net number in marketing and selling costs.2. Underlying Group EBITDA excludes non-recurring adjustments including impairments and changes to rehabilitation provisions for closed sites which are non-cash in nature.
35F
or p
erso
nal u
se o
nly

Reconciliation of non-IFRS financial information to profit before tax
Supplementary Information
JA/MW C/SWIdle
(US/MB)SRL
Expl & Other
Mineral Sands
MAC Corp Group
Mineral sands revenue 143.2 188.6 17.7 107.1 (0.0) 456.6 - - 456.6
AASB 15 freight revenue 7.2 3.0 1.7 2.5 - 14.4 - - 14.4
Expenses (50.0) (88.6) (11.0) (86.8) (37.1) (273.5) - 5.9 (267.5)
Mining Area C - - - - - - 48.0 - 48.0
FX - - - - - - - 3.0 3.0
Corporate costs - - - - - - - (29.3) (29.3)
EBITDA 100.4 103.0 8.4 22.8 (37.1) 197.5 48.0 (20.4) 225.1
Depn & Amort (17.5) (35.8) (0.2) (19.3) (1.7) (74.5) (0.2) - (74.7)
Inventory movement - non-cash 9.7 11.0 (0.7) 4.5 - 24.5 - - 24.5
Rehabilitation for closed sites - (0.3) (0.1) - - (0.4) - - (0.4)
EBIT 92.6 77.9 7.4 8.0 (38.8) 147.1 47.8 (20.4) 174.5
Net interest costs (0.7) (0.3) (0.1) (0.1) - (1.2) - (2.8) (4.0)
Rehab unwind and other finance costs (1.3) (1.4) (3.2) (1.4) - (7.3) - 0.0 (7.3)
Profit before tax 90.6 76.2 4.1 6.5 (38.8) 138.6 47.8 (23.2) 163.2
Segment Result 90.6 76.2 4.1 6.5 (38.8) 138.6 47.8 (23.2) 225.2
36F
or p
erso
nal u
se o
nly

Capel, Western Australia
For more information contact:
Melissa Roberts, General Manager – Investor [email protected]+61 (0) 450 398 431
For
per
sona
l use
onl
y