for personal use only - asx · financial results for the half year ended 31 december 2013 19...
TRANSCRIPT

Suncorp Group Limited
Financial results for the half year ended 31 December 2013
19 February 2014
1
Suncorp Group Limited
For
per
sona
l use
onl
y

Suncorp results presentation
2
19 February 2014
Suncorp Group Limited
Agenda
Patrick Snowball Results & operational highlights
Steve Johnston CFO report
Patrick Snowball Outlook
Suncorp Leadership Team Q & A
For
per
sona
l use
onl
y

Introduction Patrick Snowball
Chief Executive Officer, Suncorp Group Limited
19 February 2014
3
Suncorp Group Limited
For
per
sona
l use
onl
y

Suncorp’s strategic priorities
4
19 February 2014
Suncorp Group Limited
Relentless execution
• Building Blocks
• Simplification
• Non-core Bank resolution
• NOHC
• Increased reinsurance (Queensland Quota-share and Life Risk)
• Exit from unfavourable markets (Life Group, Farm Insurance, Aviation etc)
Strategy
• Underlying ITR >12%
• Flat expense base
• De-risked balance sheet
• Increased ordinary dividends
• Capital returns
• Reduced volatility
Delivering
• 10%+ ROE
• Underlying ITR >12%
• Growth 7% to 9%
• $225 million Simplification benefits
• 60% to 80% dividend payout ratio
• Continue to return surplus capital
• Strategic value of 4C’s
Commitments
For
per
sona
l use
onl
y

Suncorp Group NPAT ($m)
5
19 February 2014
Suncorp Group Limited
Building Blocks delivering and Non-core resolved
780
453
724
491 548
FY10 FY11 FY12 FY13 HY14For
per
sona
l use
onl
y

15 15 20 25 35
20 20 20
30 15
20
FY10 FY11 FY12 FY13 HY14
Dividend
6
19 February 2014
Suncorp Group Limited
Interim dividend up 40%
40%
Interim dividend
Final dividend
Special dividend
For
per
sona
l use
onl
y

Top line growth
7
19 February 2014
Suncorp Group Limited
Growth across all three business lines ($m)
40,774
48,886
HY12 HY13 HY14
6.8%
693
821
HY12 HY13 HY14
10.1%
2,890
3,364
HY12 HY13 HY14
6.5%
815
938
HY12 HY13 HY14
6.7%
Short tail GWP* Long tail GWP*
Suncorp Life individual in-force business Retail and Business Bank lending
*Excluding Fire Service Levies
For
per
sona
l use
onl
y

8.0%
10.0% 10.5%
11.2% 11.1%
13.1% 13.4% 13.6% 14.0%
12.8%
6.4%
10.9%
1.9% 3.8%
11.1%
18.6%
7.8%
13.9%
1H10 2H10 1H11 2H11 1H12 2H12 1H13 2H13 1H14
Underlying and Reported ITR
8
19 February 2014
Suncorp Group Limited
Building Blocks and Simplification delivering
Underlying ITR
Reported ITR
12.0%
For
per
sona
l use
onl
y

HY14 result overview ($m)
9
19 February 2014
Suncorp Group Limited
HY14 HY13 %∆
General Insurance 470 564 (17)
Bank 105 4 large
Suncorp Life 22 51 (57)
Business line NPAT 597 619 (4)
Other profit and acquisition amortisation (49) (45) 9
NPAT 548 574 (5) For
per
sona
l use
onl
y
Financial results Steve Johnston
Chief Financial Officer, Suncorp Group Limited
For
per
sona
l use
onl
y

Suncorp’s shareholder focus
11
19 February 2014
Suncorp Group Limited
Simplified, de-risked financial services group
• Dividend payout ratio of 60% to 80% and return of surplus capital
• Organic strategy, focused exclusively in Australia and New Zealand
• De-risked and simplified business model
Yield
• Target 7% to 9% per annum growth across the business lines
• Multi-brand, multi-channel approach leveraging the Group’s 9 million customers
• Ability to recycle efficiencies into growth in low risk market segments
Growth
For
per
sona
l use
onl
y

• Deliver the benefits of Simplification
• Manage General Insurance franchise and prioritise margins
• Transition the Bank post Non-core
• De-risk and reduce capital consumption of Suncorp Life
• Balance sheet discipline
Suncorp priorities
12
19 February 2014
Suncorp Group Limited
HY14 focus
For
per
sona
l use
onl
y

General Insurance
13
19 February 2014
Suncorp Group Limited
NPAT of $470 million
$m HY14 Consensus %Δ
Gross written premium 4,380 4,486 (2)
Gross written premium (ex FSL) 4,302
Net earned premium 3,865 3,843 1
Net incurred claims (2,608) (2,578) 1
Operating expenses (899) (915) (2)
Investment income - insurance funds 179 184 (3)
Insurance trading result 537 534 1
Investment income - shareholder funds 141 142 (1)
NPAT 470 470 -
Reported ITR 13.9% 13.9% - For
per
sona
l use
onl
y

Gross Written Premium
14
19 February 2014
Suncorp Group Limited
Up 6.6% excluding Fire Service Levies
Product HY14 ($m)
%∆ Factors
Motor 1,412 4.8 Unit and premium growth in a competitive market
Home 1,230 8.9 Premium increases with some unit reduction in QLD
Commercial 1,008 6.2 Growth with continued underwriting discipline
CTP 505 8.1 Strong growth in NSW and ACT
Workers’ comp & other 147 1.4 Price increases, new business and improved retention
Total 4,302 6.6
Australia 3,734 4.5
New Zealand 568 22.4 9.0% in NZD terms For
per
sona
l use
onl
y

Claims experience
15
19 February 2014
Suncorp Group Limited
Short tail and long tail
Date Event Net costs $m
Sep 2013 NZ Canterbury storms 15
Oct 2013 Victorian wind 10
Oct 2013 NSW bushfires 63
Oct 2013 NSW Central Coast hail 23
Nov 2013 NSW/QLD storms 66
Nov 2013 Gold Coast hail 34
Other natural hazards attritional claims 120
Total 331
Less: allowance for natural hazards (282)
Natural hazards costs above allowance 49
Reserve releases:
• Net $56 million
• Broadly in-line with long-term expectation of 1.5% of NEP
• NZ earthquake strengthening of AUD$27 million
For
per
sona
l use
onl
y

Investment assets
16
19 February 2014
Suncorp Group Limited
Low yields with credit spread gains
78% of fixed interest investments rated ‘AA’ or above
Insurance funds Shareholder funds
• $9.1 billion
• Investment income $179 million
• Underlying yield 3.6%
• MTM gains of $49 million from
narrowing credit spreads
• Returns of $33 million on index linked
bonds
• $3.3 billion
• Investment income $141 million
• Underlying yield 4.1% on fixed income
• MTM gains of $21 million from
narrowing credit spreads
• Income from equities $79 million
For
per
sona
l use
onl
y

General Insurance
17
19 February 2014
Suncorp Group Limited
Overview
• General Insurance NPAT $470 million
• GWP up 6.6%
• Underlying ITR of 14.0%, Reported ITR of 13.9%
• Delivered on the ‘meet or beat’ 12% Underlying ITR target
• Natural hazard claims $49 million above allowance
• Reserve releases of $56 million
For
per
sona
l use
onl
y
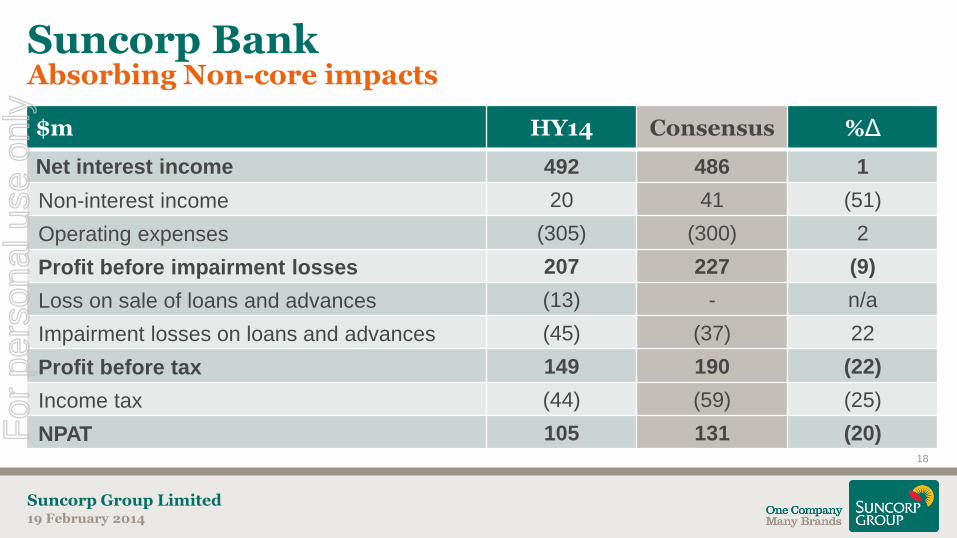
Suncorp Bank
18
19 February 2014
Suncorp Group Limited
Absorbing Non-core impacts
$m HY14 Consensus %Δ
Net interest income 492 486 1
Non-interest income 20 41 (51)
Operating expenses (305) (300) 2
Profit before impairment losses 207 227 (9)
Loss on sale of loans and advances (13) - n/a
Impairment losses on loans and advances (45) (37) 22
Profit before tax 149 190 (22)
Income tax (44) (59) (25)
NPAT 105 131 (20) For
per
sona
l use
onl
y

Lending assets of $49.2 billion
19
19 February 2014
Suncorp Group Limited
Improved geographical diversification
Geographic split Product split
Corporate & Property <1%
Housing 78%
Agribusiness 9% (up 11%)
Commercial (SME) 11% (up 7%)
Consumer 1%
SA & other 3%
WA 6%
VIC 9%
NSW 24%
QLD 58%
For
per
sona
l use
onl
y

Suncorp Majors
9%
Suncorp Majors
Suncorp market share
20
19 February 2014
Suncorp Group Limited
Opportunities to refocus on QLD market
Retail market share in QLD National market share
Source: APRA system data for total deposits and retail housing, DBM BFSM, SME Business Survey, MFI Satisfaction, Dec 2013 Source: Roy Morgan, Retail Banking, Overall Customer Satisfaction, Dec 2013
64%
3%
81%
For
per
sona
l use
onl
y

Funding and Liquidity
21
19 February 2014
Suncorp Group Limited
Conservative balance sheet
66% 68%
84%
63% 59% 57% 56%
SUN Regional 1 Regional 2 Major 1 Major 2 Major 3 Major 4
Balance sheet components Deposit to loan ratio
Dec-13 Source: Company reports for financial year 2013 Regional bank data is reported group ratios and majors data retail and business division only
100%
21%
66%
6%
25%
24%
Short-term wholesale
Long-term wholesale
Equity & other
Retail deposits
Liquid assets
Lending
Assets Liab + Equity
For
per
sona
l use
onl
y
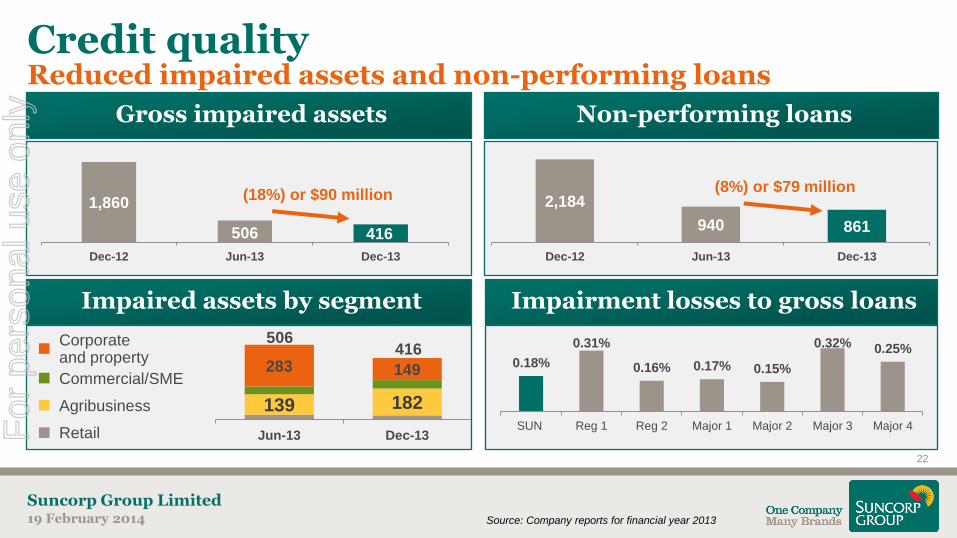
1,860
506 416
Dec-12 Jun-13 Dec-13
Credit quality
22
19 February 2014
Suncorp Group Limited
Reduced impaired assets and non-performing loans
2,184
940 861
Dec-12 Jun-13 Dec-13
139 182
283 149
Jun-13 Dec-13
0.18%
0.31%
0.16% 0.17% 0.15%
0.32% 0.25%
SUN Reg 1 Reg 2 Major 1 Major 2 Major 3 Major 4
Impairment losses to gross loans Impaired assets by segment
Non-performing loans Gross impaired assets
Source: Company reports for financial year 2013
Retail
Agribusiness
Commercial/SME
Corporate and property
506 416
(8%) or $79 million (18%) or $90 million
For
per
sona
l use
onl
y

Suncorp Bank
23
19 February 2014
Suncorp Group Limited
De-risked with growth levers
Basel II advanced accreditation
Banking platform
Maintain A+/A1 credit rating
Product split Building key differentiators
Jun-08: $55.2 billion Dec-13: $49.2 billion
Corporate & Property
Agribusiness
Agribusiness Corporate & property
Housing
Commercial/ SME
Housing
Commercial/SME For
per
sona
l use
onl
y
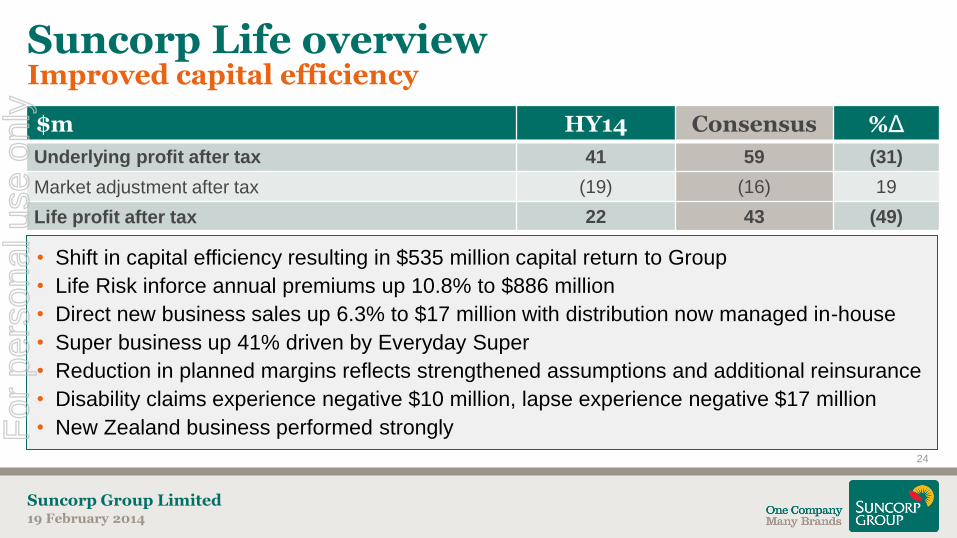
Suncorp Life overview
24
19 February 2014
Suncorp Group Limited
Improved capital efficiency
$m HY14 Consensus %Δ
Underlying profit after tax 41 59 (31)
Market adjustment after tax (19) (16) 19
Life profit after tax 22 43 (49)
• Shift in capital efficiency resulting in $535 million capital return to Group
• Life Risk inforce annual premiums up 10.8% to $886 million
• Direct new business sales up 6.3% to $17 million with distribution now managed in-house
• Super business up 41% driven by Everyday Super
• Reduction in planned margins reflects strengthened assumptions and additional reinsurance
• Disability claims experience negative $10 million, lapse experience negative $17 million
• New Zealand business performed strongly For
per
sona
l use
onl
y

Suncorp Life
25
19 February 2014
Suncorp Group Limited
Growth in Life Risk and Superannuation
35 33 32
16 17 17
9 11 13
1H13 2H13 1H14
IFA Direct NZ
131
149
185
1H13 2H13 1H14
800
845
886
1H13 2H13 1H14
Superannuation new business
($m)
Life Risk new business by
channel ($m)
Life Risk in-force annual
premium ($m)
For
per
sona
l use
onl
y

Suncorp Life capital
26
19 February 2014
Suncorp Group Limited
Contributing to the Group’s surplus
2,106
158
207 100 70
70 1,641
30-Jun-13 LAGIC Reinsurance Sub debt Capital efficiency BAU 31-Dec-13
Capital movements ($m)
For
per
sona
l use
onl
y

HY14 capital movements ($m)
27
19 February 2014
Suncorp Group Limited
Group excess to CET1 over $1.1 billion
792 847
Excess 30-June-2012 (Pre-
LAGIC)
TransitionalLAGIC/Basel III
adjustments
BAU growth &other
Non-core Bank NPAT excludingNon-core
1H2013 dividend 2H2013 dividend Excess 30-June-2013
58 116
1,123 643
45
322 801
1,585
1,135
Excess CET1 30-Jun-13 (post-div)
HY14 NPAT Life reinsurance Other Excess CET1 31-Dec-13 (pre-div)
Interim dividend Excess CET1 31-Dec-13 (post-div)
548
207
29
450
For
per
sona
l use
onl
y

Conclusion Patrick Snowball
Chief Executive Officer, Suncorp Group Limited
For
per
sona
l use
onl
y

Outlook
29
19 February 2014
Suncorp Group Limited
Focus for the remainder of 2014
• ‘Meet or beat’ 12% underlying ITR
• Balance margin and growth
• Capitalise on any market disruption from market consolidation General Insurance
• Growth 1 to 1.3 times system
• NIM heading back to target range of 1.75% to 1.85%
• Cost to income heading back to target range for FY15 Bank
• Focus on direct distribution and Everyday Super
• Manage lapse and claims challenges
• Driving industry structural reforms Life
• Dividend payout ratio range 60% to 80% of cash earnings
• Commitment to return surplus capital Capital
For
per
sona
l use
onl
y

Suncorp Group
30
19 February 2014
Suncorp Group Limited
Key commitments
Group growth of 7% to 9% per annum over the next two years 1
Simplification benefits of $225 million in the 2015 financial year 2
‘Meet or beat’ an underlying ITR of 12% through the cycle 3
60% to 80% dividend payout ratio 4
Continue to return surplus capital 5
Group ROE of at least 10% in the 2015 financial year 6 For
per
sona
l use
onl
y

Q&A session
For
per
sona
l use
onl
y

Supplementary slides
19 February 2014
Suncorp Group Limited
32
For
per
sona
l use
onl
y

The Suncorp journey
19 February 2014
Suncorp Group Limited
‘4Cs’ drive the Group’s competitive advantage
FY10 FY11 FY12 FY13 FY14 FY15 FY16
FY13 - FY16
Optimise & differentiate
FY12 - FY16
Simplification program
FY10
Stabilise business & strengthen balance sheet
• NOHC
FY10 - FY12
Building Blocks
• One pricing engine • One claims system • One general ledger • One employment agreement • One view of customer
Simplification benefits $265m
Building Block benefits $235m
33
For
per
sona
l use
onl
y

General Insurance
19 February 2014
Suncorp Group Limited
A diversified portfolio
Geographic split Product split
34
33%
29%
23%
12% 3% Motor
Home
Commerical
CTP
Workers comp
26%
28% 21%
6%
13%
6% QLD
NSW
VIC
WA
NZ
Other
For
per
sona
l use
onl
y

5.8bn
2.5bn
500m
Original cover Original cover
reinstatement Third cover
Third cover
reinstatement 250m
200m
NZ dropdown NZ dropdown Dropdown aggregate program 150m
50m
NZD 50m
NZD 25m NZ dropdown NZ dropdown
Retention
FY14 Reinsurance program
19 February 2014
Suncorp Group Limited
35
For
per
sona
l use
onl
y

FY14 Reinsurance program
19 February 2014
Suncorp Group Limited
Drop-down aggregate program
250m 50m xs
200m xs 50m 100m xs
150m xs 200m
100m xs
150m xs 300m
200m
150m
100m xs
50m xs 200m
100m xs
50m xs 300m
Erosion contributes to
aggregate dropdown
50m Retention
36
For
per
sona
l use
onl
y

-
500
1,000
1,500
2,000
2,500
3,000
3,500
4,000
4,500
5,000 NZ AUS Long Run Average
Natural hazards since 1967
19 February 2014
Suncorp Group Limited
Suncorp long-term catastrophic loss experience
Brisbane flood, Cyclone Tracy
Brisbane hailstorm
Newcastle earthquake
Sydney hailstorm
Hunter Valley storm
Melbourne & Perth hailstorms,
Christchurch earthquakes
Christchurch earthquakes, Brisbane floods, Cyclone Yasi, Melbourne hailstorm
Events greater than $100m, gross of all reinsurance
37
For
per
sona
l use
onl
y

Suncorp Bank business lending
19 February 2014
Suncorp Group Limited
Diverse portfolios
Beef 34%
Grain & Mixed
Farming 26%
Sheep & Mixed
Livestock 10%
Cotton 8%
Sugar 5%
Poultry 4%
Fruit 3%
Dairy 3%
Vegetables 3% Other
4%
Property Investment
39%
Hospitality & Accomm.
19%
Retail 8%
Construction & Dev.
8%
Manufact. & Mining
7%
Services (Inc. professional
services) 9%
Transport & Storage
4%
Health & Education
2%
Other 4%
Commercial/SME portfolio Agribusiness portfolio
38
For
per
sona
l use
onl
y

300
113
Excess Capital 30-June-2013
H1FY14 NPAT Capital instrumenttransactions
Reinsurancebenefit
Other Life capital returnsto Group (1)
Excess Capital 31-12-13
19
643
207
- $100m CET1 reduction as a result of capital rebalancing (subdebt)
- $70m excess capital return
Life Capital
19 February 2014
Suncorp Group Limited
Contributing to the Group’s surplus
(1) Life capital return breakdown:
- $158m LAGIC benefits
- $207m excess capital reinsurance benefit
100
207
535 22
19
39
For
per
sona
l use
onl
y

Suncorp Group Capital
19 February 2014
Suncorp Group Limited
$1,135 million excess to CET1 targets post dividend
A$m General
Insurance Bank Life
NOHC and other entities
Suncorp Group total
CET1 3,532 2,535 517 402 6,986
CET1 target 2,348 2,458 404 191 5,401
Excess (pre-div) 1,184 77 113 211 1,585
Dividend (450)
Excess (post-div) 1,135
CET1 ratios 1.65x 8.25% 1.65x
CET1 targets 1.10x 8% Amount equal to sum of PCA plus a target excess
40
For
per
sona
l use
onl
y

Important disclaimer
19 February 2014
Suncorp Group Limited
This report contains general information which is current as at 19 February 2014. It is information given in summary
form and does not purport to be complete.
It is not a recommendation or advice in relation to the Group or any product or service offered by Suncorp or any of its
subsidiaries. It is not intended to be relied upon as advice to investors or potential investors, and does not take into
account the investment objectives, financial situation or needs of any particular investor. These should be considered,
with or without professional advice, when deciding if an investment is appropriate.
This report should be read in conjunction with all other information concerning Suncorp filed with the Australian
Securities Exchange (ASX).
The information in this report is for general information only. To the extent that the information may constitute forward-
looking statements, the information reflects Suncorp’s intent, belief or current expectations with respect to our business
and operations, market conditions, results of operations and financial condition, capital adequacy, specific provisions
and risk management practices at the date of this report. Such forward-looking statements are not guarantees of future
performance and involve known and unknown risks and uncertainties, many of which are beyond Suncorp’s control,
which may cause actual results to differ materially from those expressed or implied.
Suncorp undertakes no obligation to update any forward-looking statement to reflect events or circumstances after the
date of this report (subject to ASX disclosure requirements).
41
For
per
sona
l use
onl
y

Contact Details Mark Ley
[email protected] +61 2 8121 1221
Andrew Dempster [email protected]
+61 7 3135 2425
Susan Duncalfe [email protected]
+61 7 3135 3729
Sam Miller [email protected]
+61 7 3135 2415
Nick Perchey [email protected]
+61 2 8121 9206
For
per
sona
l use
onl
y