2020 undergraduate student survey report webversion
TRANSCRIPT
2020 Undergraduate Student
Survey Results
March 2020
Prepared by the Office of Planning & Institutional Research

2 2020 Undergraduate Student Survey Results
Table of Contents
1. Report Summary 3
2. Demographics 5
3. Campus Experiences 7
4. General Experiences 14
5. Bus Service 27
6. Extracurricular Involvement 28
7. Educational Outcomes/Services 29
8. Likelihood of Attending/Recommending 30
9. Academic Registration Experiences 31
10. Learning about Campus Events/Social Media 32
11. Summary of Comments 35
12. Comments (about overall educational experience) 37
13. Comments (about anything else) 46
14. Questionnaire 54

3 2020 Undergraduate Student Survey Results
REPORT SUMMARY The 2020 Undergraduate Student Survey (USS) was administered to sophomores and juniors in April 2020. The USS is a complementary survey to the Graduating Student Survey (GSS) and was first administered in 2015. This survey report includes the questions’ ratings from last year. Two questions on this survey also appear on the GSS. They are:
1. If you were to start all over again, would you attend TAMU-CC? 2. Would you recommend TAMU-CC to a prospective student?
Demographics A total of 4,001 students were invited to take the survey. A total of 697 students opened the survey, but only 672 students answered at least one question and are considered respondents, for a response rate of 16% compared to 14% last year. Male students are underrepresented in the respondent population. While males are 41% of the population, only 27% responded to the survey. KEY FINDINGS General Campus Experiences The items receiving the highest ratings of combined satisfaction (Very Satisfied responses added with the Satisfied responses), above 90%, in campus experiences are as follows:
The fairness of ACADEMIC misconduct disciplinary process (93%) The fairness of student disciplinary procedures (under Code of Conduct) (94%) The quality of equipment in computer labs (96%) The accessibility of computer labs (99%) The helpfulness of the staff at the mail center (94%) The cleanliness of recreational sports facilities and equipment (63%) The overall condition of University grounds and landscaping (94%) The adequacy of sidewalks on campus (80%) The safety of recreational sports facilities (98%) The cleanliness of campus facilities (90%)
The items receiving the lowest ratings of satisfaction in general experiences, under the recommended 75%, are as follows:
The quality of the food in the Dining Hall (73%) The price of printing/copying on campus (72%) Nearly 40% of the students who live on campus are dissatisfied or very dissatisfied with the quality of
food in the Dining Hall.

4 2020 Undergraduate Student Survey Results
Campus Offices Generally, 90% of students are satisfied with campus offices. All campus offices listed below received a combined satisfaction score over 90% for Courtesy and 89% or higher for Helpfulness. Courtesy Helpfulness
Admissions & Records (94%) (99%) Veteran’s Affairs (90%) (95%) University Bookstore (93%) (97%) Cashier’s (Business) Office (97%) (11%) Financial Assistance Office (93%) (95%) University Police (91%) (90%)
Campus Services The combined satisfaction scores for campus services:
SAIL Online Portal (94%) Bell Library (97%) Campus Copies Office (72%) CASA (tutoring) (86%) Disability Services (89%) University Center (95%) Counseling Center (87%) Health Center (90%) Dining Hall (78%) Other Campus Food Businesses (89%) Recreational Sports Facilities (90%)
Campus Events The combined satisfaction scores for campus services: Student Activities and Events (86%) Islander Athletic Events (everyone) (85%) Islander Athletic Events (attendees) (94%) Strangely, 40 people who said they never attended Islander Athletic Events rated their satisfaction with it. Those people were removed for the attendee calculation.
About the response numbers:
Respondents did not necessarily answer all questions on the survey. Therefore, the total number of responses for a question will not necessarily match other questions. About percentages:
Valid percent means the percentage based on the number of people who answered the question, not the percentage of all the people who answered any question. Percentages are rounded to the nearest whole number, except when less than 1% in which case the exact percentage is reported.

5 2020 Undergraduate Student Survey Results
Demographics
Respondents Gender Student Count Valid Percent Female 101 68% Male 47 32% Non-Binary 0 0% Not Identified 0 0%
Respondents Class Level Student Count Percent Junior 59 41% Sophomore 86 59%
Entire Pool of Students Gender Student Count Percent Female 2508 62% Male 1555 38% Total 4063 100%
Respondents
College Student Count
Valid Percent
Business 19 13% Education 23 15%
Liberal Arts 38 26%
Nursing & Health Sciences 23 15%
Science & Engineering 40 27%
University College 6 4% Total 149 100%
Entire Pool of Students
College Student Count
Valid Percent
Business 690 17% Education 463 12%
Liberal Arts 941 27%
Nursing and Health Sciences 762 18%
Science and Engineering 1064 26%
Total 4063 100%
Parent graduated from college
Student Count
Valid Percent
Mother graduated 79 53%
Father graduated 71 48%
Both parents graduated 148 100%
How many years have you lived on campus (either at Miramar or Momentum campus)?
# Years # of
Students 1 28 2 19 3 10 4 1

6 2020 Undergraduate Student Survey Results
# % Race 1 1 American Indian or Alaska Native 3 2 Asian 4 3 Black or African American 77 52 Hispanic/Latino 0 0 Native Hawaiian or Other Pacific Islander 58 39 White 5 3 Multi-racial 0 0 Other
Campus Experiences The following questions were open for response to all students. The questions were constructed to ascertain satisfaction with general experiences on the TAMU-CC campus. The Very Satisfied responses have been added with the Satisfied responses to give the Combined Satisfaction score. Usage items aim to provide some general insight on how often the services are used. The question reads: Please indicate how satisfied you are with the following offices/services. Additionally, please indicate how often you use the following offices or campus services. Admissions & Records
Courtesy Helpfulness Usage # Valid % # Valid % # Valid % Very Satisfied 32 36 32 46 Never 30 26 Satisfied 52 58 37 53 1- 4 times per year 79 68 Dissatisfied 2 2 0 0 5 to 10 times per year 6 5 Very Dissatisfied 4 4 1 1 11 or more times per year 1 1 Total 90 100 70 100 116 100
Veteran’s Affairs
Courtesy Helpfulness Usage # Valid % # Valid % # Valid % Very Satisfied 8 27 10 43 Never 97 87 Satisfied 19 63 12 52 1- 4 times per year 11 10 Dissatisfied 2 7 1 4 5 to 10 times per year 2 2 Very Dissatisfied 1 3 0 0 11 or more times per year 1 1 Total 30 100 23 100 111 100

7 2020 Undergraduate Student Survey Results
Cashier’s (Business) Office Courtesy Helpfulness Usage # Valid % # Valid % # Valid % Very Satisfied 22 38 4 4 Never 41 47 Satisfied 34 59 2 7 1- 4 times per year 62 54 Dissatisfied 2 3 19 63 5 to 10 times per year 5 4 Very Dissatisfied 0 0 22 31 11 or more times per year 0 0 Total 58 100 72 100 114 100
Financial Assistance Office
Courtesy Helpfulness Usage # Valid % # Valid % # Valid % Very Satisfied 31 39 30 47 Never 29 33 Satisfied 43 54 31 48 1- 4 times per year 69 60 Dissatisfied 4 5 3 5 5 to 10 times per year 13 11 Very Dissatisfied 2 3 0 0 11 or more times per year 0 0 Total 80 100 64 100 115 100
University Police
Courtesy Helpfulness Usage # Valid % # Valid % # Valid % Very Satisfied 18 31 18 38 Never 69 61 Satisfied 35 60 25 52 1- 4 times per year 44 39 Dissatisfied 3 5 5 10 5 to 10 times per year 0 0 Very Dissatisfied 2 3 0 0 11 or more times per year 0 0 Total 58 100 48 100 113 100
University Bookstore
Courtesy Helpfulness Usage # Valid % # Valid % # Valid % Very Satisfied 37 40 32 46 Never 17 15 Satisfied 49 53 36 51 1- 4 times per year 71 62 Dissatisfied 4 4 2 3 5 to 10 times per year 20 17 Very Dissatisfied 2 2 0 0 11 or more times per year 7 6 Total 92 100 70 100 115 100

8 2020 Undergraduate Student Survey Results
SAIL Online Portal Satisfaction with the office/services Usage # Valid % # Valid % Very Satisfied 43 38 Never 0 0 Satisfied 59 52 1- 4 times per year 13 14 Dissatisfied 7 6 5 to 10 times per year 10 11 Very Dissatisfied 5 4 11 or more times per year 70 75 Total 114 100 93 100
Bell Library (ability to find materials)
Satisfaction with the office/services Usage
# Valid
% # Valid % Very Satisfied 46 43 Never 5 5 Satisfied 58 54 1- 4 times per year 21 23 Dissatisfied 1 1 5 to 10 times per year 21 23 Very Dissatisfied 3 3 11 or more times per year 46 49 Total 108 100 93 100
Campus Copies
Satisfaction with the office/services Usage
# Valid
% # Valid % Very Satisfied 126 37 Never 43 47 Satisfied 35 35 1- 4 times per year 22 24 Dissatisfied 8 12 5 to 10 times per year 6 7 Very Dissatisfied 4 6 11 or more times per year 20 22 Total 67 100 91 100
Tutoring/CASA (Center for Academic Excellence)
Satisfaction with the office/services Usage
# Valid % # Valid %
Very Satisfied 36 45 Never 30 33 Satisfied 33 41 1- 4 times per year 28 31 Dissatisfied 9 11 5 to 10 times per year 18 20 Very Dissatisfied 2 3 11 or more times per year 15 16 Total 80 100 91 100
9 2020 Undergraduate Student Survey Results
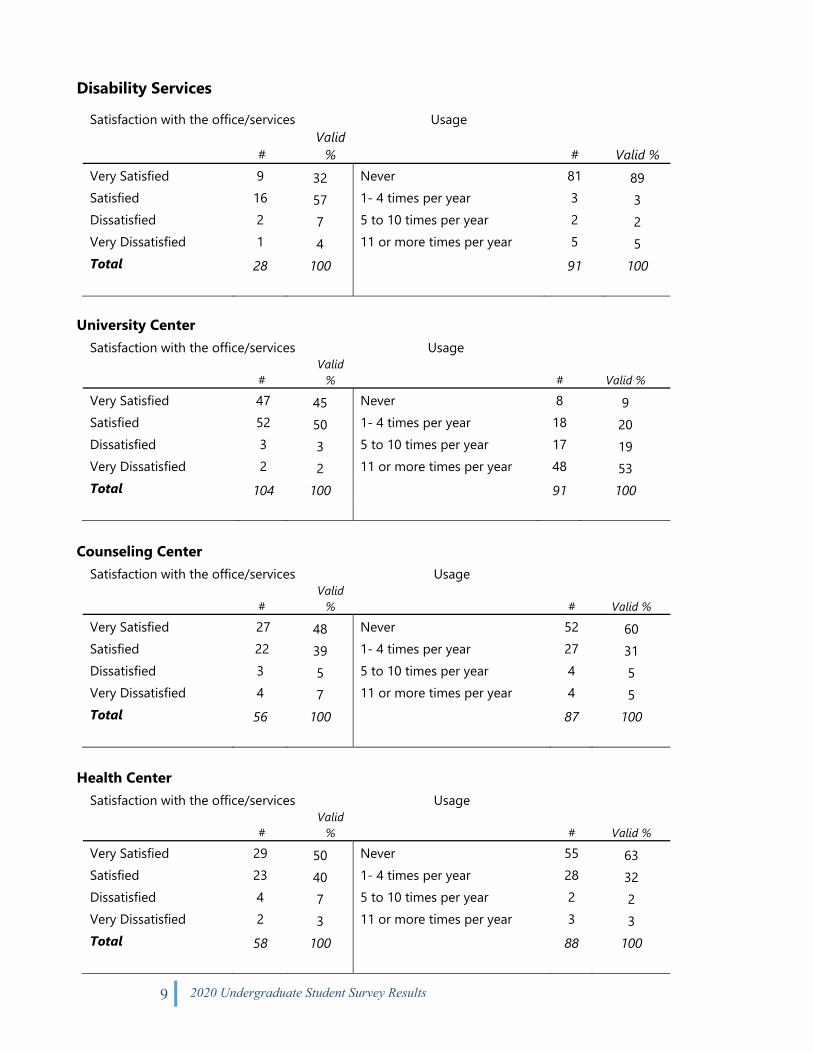
Disability Services Satisfaction with the office/services Usage
# Valid
% # Valid % Very Satisfied 9 32 Never 81 89 Satisfied 16 57 1- 4 times per year 3 3 Dissatisfied 2 7 5 to 10 times per year 2 2 Very Dissatisfied 1 4 11 or more times per year 5 5 Total 28 100 91 100
University Center
Satisfaction with the office/services Usage
# Valid
% # Valid % Very Satisfied 47 45 Never 8 9 Satisfied 52 50 1- 4 times per year 18 20 Dissatisfied 3 3 5 to 10 times per year 17 19 Very Dissatisfied 2 2 11 or more times per year 48 53 Total 104 100 91 100
Counseling Center
Satisfaction with the office/services Usage
# Valid
% # Valid % Very Satisfied 27 48 Never 52 60 Satisfied 22 39 1- 4 times per year 27 31 Dissatisfied 3 5 5 to 10 times per year 4 5 Very Dissatisfied 4 7 11 or more times per year 4 5 Total 56 100 87 100
Health Center
Satisfaction with the office/services Usage
# Valid
% # Valid % Very Satisfied 29 50 Never 55 63 Satisfied 23 40 1- 4 times per year 28 32 Dissatisfied 4 7 5 to 10 times per year 2 2 Very Dissatisfied 2 3 11 or more times per year 3 3 Total 58 100 88 100

10 2020 Undergraduate Student Survey Results
Recreational Sports Facilities Satisfaction with the office/services Usage
# Valid
% # Valid % Very Satisfied 25 42 Never 51 58 Satisfied 29 48 1- 4 times per year 13 15 Dissatisfied 3 5 5 to 10 times per year 9 10 Very Dissatisfied 3 5 11 or more times per year 15 17 Total 60 100 88 100
Dining Hall
Satisfaction with the office/services Usage
# Valid
% # Valid % Very Satisfied 18 30 Never 46 52 Satisfied 29 48 1- 4 times per year 16 18 Dissatisfied 8 13 5 to 10 times per year 3 3 Very Dissatisfied 6 10 11 or more times per year 24 27 Total 61 100 89 100
Other Campus Food Businesses
Satisfaction with the office/services Usage
# Valid
% # Valid % Very Satisfied 33 38 Never 18 20 Satisfied 44 51 1- 4 times per year 16 17 Dissatisfied 8 9 5 to 10 times per year 16 17 Very Dissatisfied 1 1 11 or more times per year 42 46 Total 86 100 92 100
Student Activities and Events
Satisfaction with the office/services Usage
# Valid
% # Valid % Very Satisfied 34 42 Never 29 32 Satisfied 36 44 1- 4 times per year 31 34 Dissatisfied 5 6 5 to 10 times per year 13 14 Very Dissatisfied 6 7 11 or more times per year 18 20 Total 81 100 91 100
11 2020 Undergraduate Student Survey Results
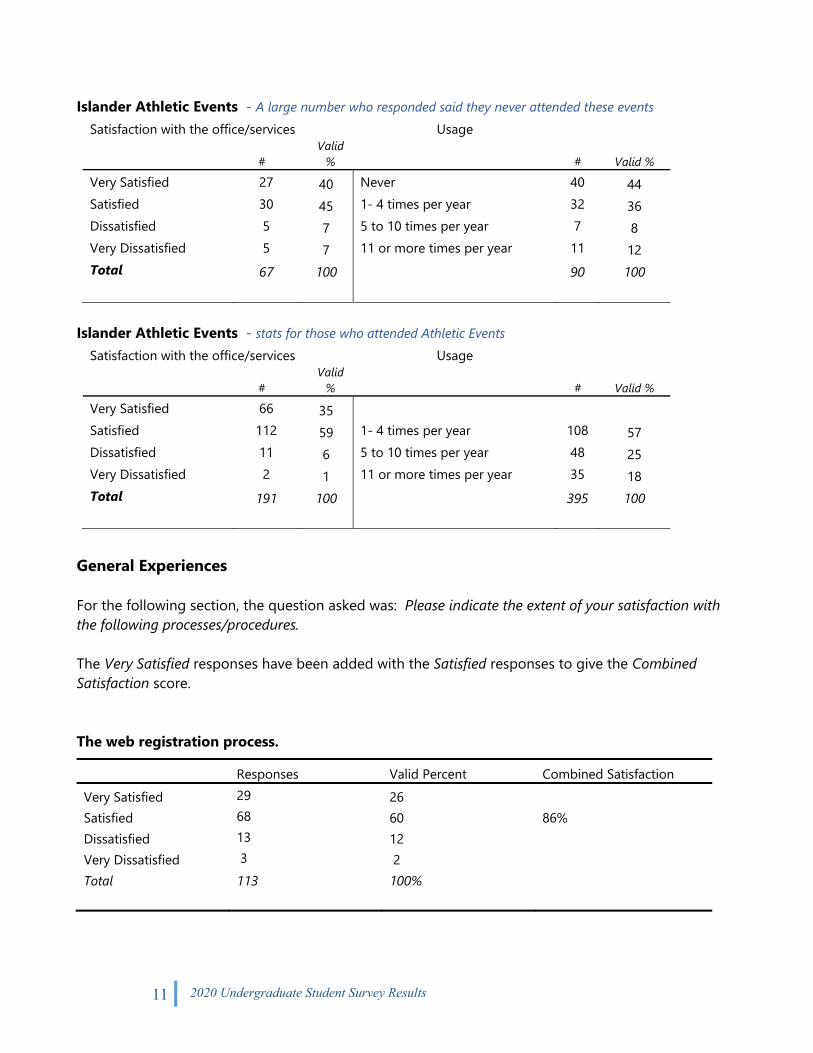
Islander Athletic Events - A large number who responded said they never attended these events
Satisfaction with the office/services Usage
# Valid
% # Valid % Very Satisfied 27 40 Never 40 44 Satisfied 30 45 1- 4 times per year 32 36 Dissatisfied 5 7 5 to 10 times per year 7 8 Very Dissatisfied 5 7 11 or more times per year 11 12 Total 67 100 90 100
Islander Athletic Events - stats for those who attended Athletic Events
Satisfaction with the office/services Usage
# Valid
% # Valid % Very Satisfied 66 35 Satisfied 112 59 1- 4 times per year 108 57 Dissatisfied 11 6 5 to 10 times per year 48 25 Very Dissatisfied 2 1 11 or more times per year 35 18 Total 191 100 395 100
General Experiences For the following section, the question asked was: Please indicate the extent of your satisfaction with the following processes/procedures. The Very Satisfied responses have been added with the Satisfied responses to give the Combined Satisfaction score. The web registration process.
Responses Valid Percent Combined Satisfaction Very Satisfied 29 26 Satisfied 68 60 86% Dissatisfied 13 12 Very Dissatisfied 3 2 Total 113 100%

12 2020 Undergraduate Student Survey Results
The walk-up registration process.
Responses Valid Percent Combined Satisfaction Very Satisfied 16 30 Satisfied 30 55 85% Dissatisfied 5 9 Very Dissatisfied 3 6 Total 54 100%
The ease of dropping/adding courses.
Responses Valid Percent Combined Satisfaction Very Satisfied 44 44 Satisfied 46 46 90% Dissatisfied 6 6 Very Dissatisfied 4 4 Total 100 100%
The fee payment process.
Responses Valid Percent Combined Satisfaction Very Satisfied 25 26 Satisfied 60 61 87% Dissatisfied 9 9 Very Dissatisfied 4 4 Total 98 100%
The billing procedures.
Responses Valid Percent Combined Satisfaction Very Satisfied 27 27 Satisfied 60 60 87% Dissatisfied 9 9 Very Dissatisfied 4 4 Total 100 100%

13 2020 Undergraduate Student Survey Results
The hours of operation of the Cashier's (Business) office.
Responses Valid Percent Combined Satisfaction Very Satisfied 22 26 Satisfied 59 70 96% Dissatisfied 3 4 Very Dissatisfied 0 0 Total 84 100%
The timeliness of financial assistance award announcements.
Responses Valid Percent Combined Satisfaction Very Satisfied 24 26 Satisfied 58 61 87% Dissatisfied 11 12 Very Dissatisfied 1 1 Total 94 100%
The First Year Learning Community program.
Responses Valid Percent Combined Satisfaction Very Satisfied 23 28 Satisfied 35 43 71% Dissatisfied 13 16 Very Dissatisfied 11 13 Total 82 100%
The overall quality of Academic Advising you have received at this campus.
Responses Valid Percent Combined Satisfaction Very Satisfied 42 39 Satisfied 43 40 79% Dissatisfied 15 14 Very Dissatisfied 8 7 Total 108 100%

14 2020 Undergraduate Student Survey Results
The effectiveness of tutoring services provided by CASA.
Responses Valid Percent Combined Satisfaction Very Satisfied 39 50 Satisfied 33 42 89% Dissatisfied 6 8 Very Dissatisfied 0 0 Total 79 100%
The hours and days of the Dining Hall food service.
Responses Valid Percent Combined Satisfaction Very Satisfied 19 32 Satisfied 28 47 79% Dissatisfied 11 18 Very Dissatisfied 2 3 Total 60 100%
The hours and days of the other campus food locations (NOT Dining Hall).
Responses Valid Percent Combined Satisfaction Very Satisfied 29 32 Satisfied 49 54 86% Dissatisfied 10 11 Very Dissatisfied 2 2 Total 90 100%
The helpfulness of the staff at the mail center.
Responses Valid Percent Combined Satisfaction Very Satisfied 27 47 Satisfied 27 47 94% Dissatisfied 3 5 Very Dissatisfied 0 0 Total 57 100%

15 2020 Undergraduate Student Survey Results
The availability of printing/copying on campus.
Responses Valid Percent Combined Satisfaction Very Satisfied 30 35 Satisfied 42 49 84% Dissatisfied 11 13 Very Dissatisfied 3 3 Total 86 100%
New in 2018 The price of printing/copying on campus.
Responses Valid Percent Combined Satisfaction Very Satisfied 20 23 Satisfied 40 46 69% Dissatisfied 16 18 Very Dissatisfied 11 13 Total 87 100%
The quality of care offered by the Counseling Center.
Responses Valid Percent Combined Satisfaction Very Satisfied 22 47 Satisfied 20 43 90% Dissatisfied 3 6 Very Dissatisfied 2 4 Total 47 100%
The quality of care offered by the Health Center.
Responses Valid Percent Combined Satisfaction Very Satisfied 26 55 Satisfied 16 34 89% Dissatisfied 2 4 Very Dissatisfied 3 6 Total 47 100%

16 2020 Undergraduate Student Survey Results
The availability of channels for expressing student complaints.
Responses Valid Percent Combined Satisfaction Very Satisfied 14 23 Satisfied 31 52 75% Dissatisfied 8 13 Very Dissatisfied 7 12 Total 60 100%
The fairness of ACADEMIC misconduct disciplinary process.
Responses Valid Percent Combined Satisfaction Very Satisfied 21 34 Satisfied 37 60 94% Dissatisfied 4 6 Very Dissatisfied 0 0 Total 62 100%
The fairness of student disciplinary procedures administered under the Student Code of Conduct.
Responses Valid Percent Combined Satisfaction Very Satisfied 22 34 Satisfied 38 59 95% Dissatisfied 3 5 Very Dissatisfied 1 2 Total 64 100%
The quality of equipment in computer labs.
Responses Valid Percent Combined Satisfaction Very Satisfied 27 30 Satisfied 59 66 96% Dissatisfied 3 3 Very Dissatisfied 1 1 Total 90 100%

17 2020 Undergraduate Student Survey Results
The accessibility of computer labs.
Responses Valid Percent Combined Satisfaction Very Satisfied 33 37 Satisfied 56 62 99% Dissatisfied 1 1 Very Dissatisfied 0 0 Total 90 100%
The ability to find materials in the library to complete class assignments.
Responses Valid Percent Combined Satisfaction Very Satisfied 24 25 Satisfied 65 68 93% Dissatisfied 2 2 Very Dissatisfied 5 5 Total 96 100%
The quality of the food in the Dining Hall.
Responses Valid Percent Combined Satisfaction Very Satisfied 10 15 Satisfied 32 48 63% Dissatisfied 13 19 Very Dissatisfied 12 18 Total 67 100%
The quality of the food in other campus dining locations.
Responses Valid Percent Combined Satisfaction Very Satisfied 30 32 Satisfied 56 60 92% Dissatisfied 6 6 Very Dissatisfied 2 2 Total 94 100%

18 2020 Undergraduate Student Survey Results
The overall condition of classrooms on campus.
Responses Valid Percent Combined Satisfaction Very Satisfied 23 22 Satisfied 69 66 88% Dissatisfied 9 9 Very Dissatisfied 3 3 Total 104 100%
The overall condition of University grounds and landscaping.
Responses Valid Percent Combined Satisfaction Very Satisfied 46 44 Satisfied 52 50 94% Dissatisfied 5 5 Very Dissatisfied 1 1 Total 104 100%
The quality of equipment in science labs.
Responses Valid Percent Combined Satisfaction Very Satisfied 17 23 Satisfied 47 64 87% Dissatisfied 6 8 Very Dissatisfied 3 4 Total 73 100%
The responsiveness of University Police.
Responses Valid Percent Combined Satisfaction Very Satisfied 15 25 Satisfied 35 58 83% Dissatisfied 8 13 Very Dissatisfied 2 3 Total 60 100%

19 2020 Undergraduate Student Survey Results
The overall safety of the campus.
Responses Valid Percent Combined Satisfaction Very Satisfied 35 34 Satisfied 53 52 86% Dissatisfied 13 13 Very Dissatisfied 1 1 Total 102 100%
The cleanliness of campus facilities (please note problem area/s.
Responses Valid Percent Combined Satisfaction Very Satisfied 37 41 Satisfied 45 49 90% Dissatisfied 5 5 Very Dissatisfied 4 4 Total 91 100%
The cleanliness of recreational sports facilities and equipment.
Responses Valid Percent Combined Satisfaction Very Satisfied 23 37 Satisfied 37 59 96% Dissatisfied 1 2 Very Dissatisfied 1 2 Total 62 100%
New in 2018
The safety of recreational sports facilities.
Responses Valid Percent Combined Satisfaction Very Satisfied 26 42 Satisfied 36 58 100% Dissatisfied 0 0 Very Dissatisfied 0 0 Total 62 100%

20 2020 Undergraduate Student Survey Results
The contribution of intercollegiate athletic programs to your sense of school spirit.
Responses Valid Percent Combined Satisfaction Very Satisfied 16 29 Satisfied 30 55 84% Dissatisfied 6 11 Very Dissatisfied 3 5 Total 55 100%
Bike lanes leading to campus.
Responses Valid Percent Combined Satisfaction Very Satisfied 9 20 Satisfied 27 59 79% Dissatisfied 6 13 Very Dissatisfied 4 9 Total 46 100%
On-campus bike pathways.
Responses Valid Percent Combined Satisfaction Very Satisfied 11 22 Satisfied 30 60 82% Dissatisfied 6 12 Very Dissatisfied 3 6 Total 50 100%
The adequacy of sidewalks on campus.
Responses Valid Percent Combined Satisfaction Very Satisfied 28 34 Satisfied 49 59 93% Dissatisfied 3 4 Very Dissatisfied 3 3 Total 96 100%

21 2020 Undergraduate Student Survey Results
Your sense of pride about the campus.
Responses Valid Percent Combined Satisfaction Very Satisfied 34 38 Satisfied 45 45 83% Dissatisfied 4 4 Very Dissatisfied 7 7 Total 90 100%
Bus Service City bus route #5 to campus.
Responses Valid Percent Combined Satisfaction Very Satisfied 8 35 Satisfied 12 52 87% Dissatisfied 1 4 Very Dissatisfied 2 9 Total 23 100%
City bus route #37 to campus.
Responses Valid Percent Combined Satisfaction Very Satisfied 9 36 Satisfied 15 60 96% Dissatisfied 0 0 Very Dissatisfied 1 4 Total 96 100%
The Wave #63 shuttle bus service.
Responses Valid Percent Combined Satisfaction Very Satisfied 5 24 Satisfied 15 71 95% Dissatisfied 0 0 Very Dissatisfied 1 5 Total 21 100%

22 2020 Undergraduate Student Survey Results
Momentum #60 shuttle bus service. Responses Valid Percent Combined Satisfaction Very Satisfied 7 27 Satisfied 17 65 94% Dissatisfied 1 4 Very Dissatisfied 1 4 Total 26 100%
Extracurricular Involvement The following questions were open for response to all students. The questions were constructed to ascertain student involvement in extracurricular activities. Are you actively involved in any student organizations at TAMU-CC? Responses Valid Percent Yes 49 48% No 53 52% Total 102 100%
Please indicate to what extent being involved in a student organization has made you feel more connected to campus. Responses Valid Percent At least a moderate amount A great deal 14 29 A lot 10 21 50% A moderate amount 11 23 A little 11 23 Not at all 2 3 Total 48 100%
If a student chose No for a response to involvement in any student organizations, they were asked: Why not? Responses Valid Percent I didn’t have time 31 61 Nothing interested me 7 14 I didn’t know about these organizations 6 12 What I wanted wasn’t offered or available 1 1 I didn’t like what I experienced when I tried it 0 0 Other 6 12
51 100% “Other” responses (shown as written by respondents)
23 2020 Undergraduate Student Survey Results
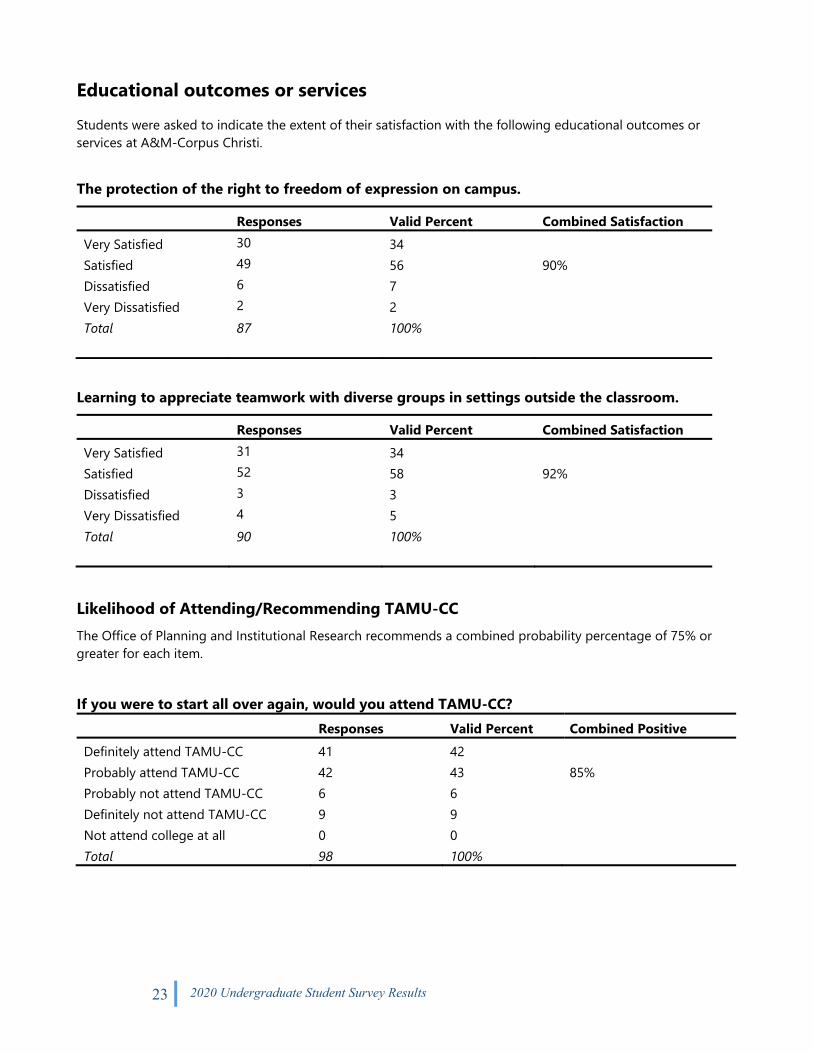
Educational outcomes or services Students were asked to indicate the extent of their satisfaction with the following educational outcomes or services at A&M-Corpus Christi. The protection of the right to freedom of expression on campus.
Responses Valid Percent Combined Satisfaction Very Satisfied 30 34 Satisfied 49 56 90% Dissatisfied 6 7 Very Dissatisfied 2 2 Total 87 100%
Learning to appreciate teamwork with diverse groups in settings outside the classroom.
Responses Valid Percent Combined Satisfaction Very Satisfied 31 34 Satisfied 52 58 92% Dissatisfied 3 3 Very Dissatisfied 4 5 Total 90 100%
Likelihood of Attending/Recommending TAMU-CC The Office of Planning and Institutional Research recommends a combined probability percentage of 75% or greater for each item. If you were to start all over again, would you attend TAMU-CC? Responses Valid Percent Combined Positive Definitely attend TAMU-CC 41 42 Probably attend TAMU-CC 42 43 85% Probably not attend TAMU-CC 6 6 Definitely not attend TAMU-CC 9 9 Not attend college at all 0 0 Total 98 100%

24 2020 Undergraduate Student Survey Results
Would you recommend TAMU-CC to a prospective student? Responses Valid Percent Combined Positive Definitely recommend 46 46 Probably recommend 38 38 84% Probably not recommend 8 8 Definitely not recommend 7 7 Total 99 100%
Academic Registration Experiences
The questions below were constructed to ascertain how often respondents encountered courses that were closed when they were registering. How frequently did you encounter closed courses IN in your major when you went to register? Responses 2020 Valid Percent Always 6 6 Often 14 13 About half the time 17 16 Sometimes 37 35 Never 33 31 Total 107 100%
How frequently did you encounter closed courses NOT in your major when you went to register? Responses 2020 Valid Percent Always 1 1 Often 15 14 About half the time 8 8 Sometimes 41 39 Never 39 38 Total 104 100%
Learning about Campus Events The students were asked three questions concerning social media. They were asked to rank order two lists about where they get information about campus events, and then about social media they do not use.
25 2020 Undergraduate Student Survey Results
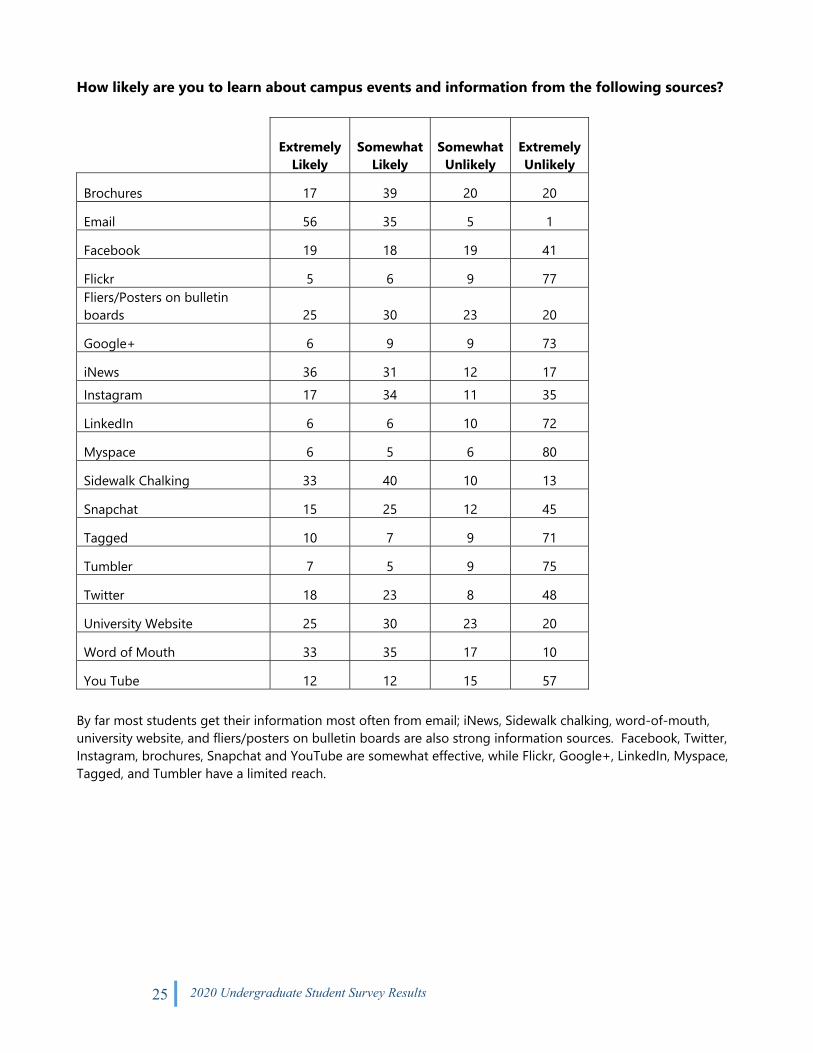
How likely are you to learn about campus events and information from the following sources?
Extremely Likely
Somewhat Likely
Somewhat Unlikely
Extremely Unlikely
Brochures 17 39 20 20
Email 56 35 5 1
Facebook 19 18 19 41
Flickr 5 6 9 77 Fliers/Posters on bulletin boards 25 30 23 20
Google+ 6 9 9 73
iNews 36 31 12 17 Instagram 17 34 11 35
LinkedIn 6 6 10 72
Myspace 6 5 6 80
Sidewalk Chalking 33 40 10 13
Snapchat 15 25 12 45
Tagged 10 7 9 71
Tumbler 7 5 9 75
Twitter 18 23 8 48
University Website 25 30 23 20
Word of Mouth 33 35 17 10
You Tube 12 12 15 57 By far most students get their information most often from email; iNews, Sidewalk chalking, word-of-mouth, university website, and fliers/posters on bulletin boards are also strong information sources. Facebook, Twitter, Instagram, brochures, Snapchat and YouTube are somewhat effective, while Flickr, Google+, LinkedIn, Myspace, Tagged, and Tumbler have a limited reach.
26 2020 Undergraduate Student Survey Results
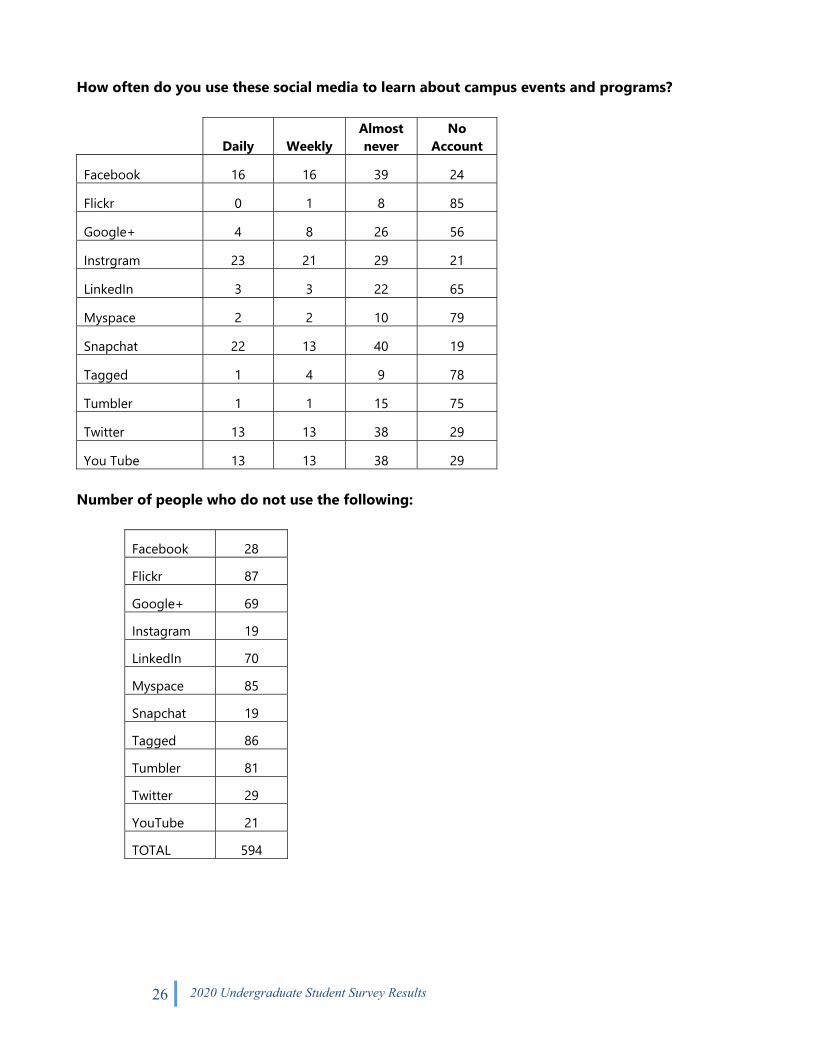
How often do you use these social media to learn about campus events and programs?
Daily Weekly Almost never
No Account
Facebook 16 16 39 24
Flickr 0 1 8 85
Google+ 4 8 26 56
Instrgram 23 21 29 21
LinkedIn 3 3 22 65
Myspace 2 2 10 79
Snapchat 22 13 40 19
Tagged 1 4 9 78
Tumbler 1 1 15 75
Twitter 13 13 38 29
You Tube 13 13 38 29 Number of people who do not use the following:
Facebook 28 Flickr 87 Google+ 69 Instagram 19 LinkedIn 70 Myspace 85 Snapchat 19 Tagged 86 Tumbler 81 Twitter 29 YouTube 21 TOTAL 594

27 2020 Undergraduate Student Survey Results
Survey Instrument
2017 USS - Undergraduate Student Survey We would appreciate getting your feedback about your experiences while at Texas A&M University – Corpus Christi. We use the data from this survey to make changes and improvements. The following questions are for data-collection and institutional research purposes only. Participation in this study is strictly voluntary and in no way affects your status at Texas A&M University-Corpus Christi. The Office of Planning & Institutional Research will ensure that your responses are completely confidential and will only be reported in the aggregate. For further information regarding this study or your confidentiality, please contact Katharine Mason in the office of Planning and Institutional Research at 825-2242, or [email protected] Q2 In this section we collect some demographic information that lets us examine if the respondents are similar to the overall population of students. For instance, does one gender respond more answer than the other? Does college or class level make a difference in responses? ... and so forth. Q3 Gender
Male (1) Female (2) Gender Non-binary (3) Prefer not to identify (4)
Q4 Race/Ethnicity
Hispanic/Latino (1) White (2) Black or African American (3) Asian (4) American Indian or Alaska Native (5) Native Hawaiian or Other Pacific Islander (6) Multi-racial (7) Other (8) ____________________
Q5 Did your mother (or female legal guardian) graduate from college?
yes (1) No (2)
Q6 Did your father (or male legal guardian) graduate from college?
yes (1) No (2)

28 2020 Undergraduate Student Survey Results
Q7 Your class level:
Sophomore (1) Junior (2)
Q8 College you are in:
Business (1) Education & Human Development (2) Liberal Arts (3) Nursing and Health Sciences (4) Science and Engineering (5)
Q9 How many years have you lived on campus (either at Miramar or Momentum campus)? 1 2 3 4 None
Display This Question: If College you are in: Business Is Selected
Q9 Department you are in: Accounting, Finance, and Business Law (1) Decision Sciences and Economics (2) Management and Marketing (3) Display This Question:
If College you are in: Business Is Selected Q10 Your Major: Accounting (1) Economics (2) Finance (3) General Business (4) Management (5) Management Information Systems (6) Marketing (7) Undecided (8)

29 2020 Undergraduate Student Survey Results
Display This Question: If College you are in: Education Is Selected
Q11 Department you are in: Educational Leadership (1) Curriculum and Instruction (2) Counseling and Educational Psychology (3) Distance Education (4) Teacher Education (5) Kinesiology (6) Military Science (7) Undecided (8) Display This Question:
If Department you are in: Kinesiology Is Selected Q12 Program you are in: Athletic Training (1) Interdisciplinary Studies (2) Kinesiology (3) Undecided (4) Display This Question:
If College you are in: Education Is Selected Q13 Your Major: Athletic Training (1) EC-6 Reading (2) EC-6 Bilingual (3) Grades 4-8 Mathematics (4) EC-12 Special Education (5) Kinesiology (6) Military Science Program (7) Undecided (8) Display This Question:
If College you are in: Liberal Arts Is Selected Q14 Department you are in: Art (1) Communication & Media (2) Dance & Theatre (3) English (4) Humanities (5) Music (6) Psychology & Sociology (7) Social Sciences (8) Undecided (10)

30 2020 Undergraduate Student Survey Results
Display This Question: If College you are in: Liberal Arts Is Selected
Q15 Your Major: Applied Sciences (1) Art (2) Communication (3) Criminal Justice (4) Economics (5) English (6) Graphic Design (17) History (7) Music (8) Philosophy (9) Political Science (10) Psychology (11) Sociology (12) Spanish (13) Theatre (14) University Studies (15) Undecided (16) Display This Question:
If College you are in: Nursing and Health Sciences Is Selected Q16 Program you are in: BSN in Nursing (1) BSHS in Health Science (2) Display This Question:
If College you are in: Science and Engineering Is Selected Q17 Department you are in: Computing Sciences (1) Engineering (2) Life Sciences (3) Mathematics & Statistics (4) Physical & Environmental Sciences (5) Display This Question:
If College you are in: Science and Engineering Is Selected Q18 Your Major:

31 2020 Undergraduate Student Survey Results
Atmospheric Sciences (18) Biology (1) Biomedical Sciences (2) Chemistry (3) Coastal & Marine System Science (4) Computer Science (5) Electrical Engineering (6) Environmental Science (7) Fisheries & Mariculture (8) Geographic Information Science (9) Geology (10) Geospatial Computing Science (19) Geospatial Surveying Engineering (11) Marine Biology (12) Mathematics (13) Mechanical Engineering (14) Mechanical Engineering Technology (15) Physics (16) Undecided (17)
Q20 How often do you utilize/contact the following offices in an average academic year?
Never (1) 1-4 times per year (2)
5-10 times per year (3)
11 or more times per year (4)
Admissions & Records (1)
Office of Veteran's Affairs (2) Cashier's
(Business) Office (3)
Financial Assistance Office
(4)
University Police (5)
University Bookstore (6)
Page 2 of 42
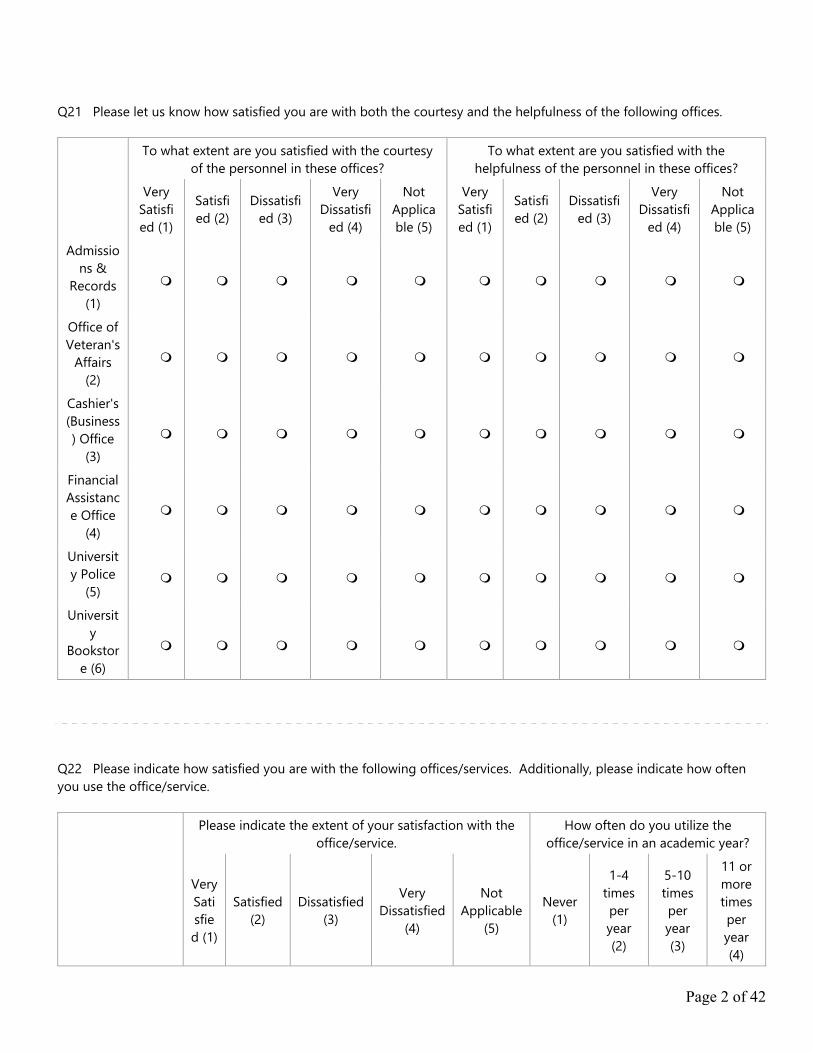
Q21 Please let us know how satisfied you are with both the courtesy and the helpfulness of the following offices.
To what extent are you satisfied with the courtesy of the personnel in these offices?
To what extent are you satisfied with the helpfulness of the personnel in these offices?
Very
Satisfied (1)
Satisfied (2)
Dissatisfied (3)
Very Dissatisfi
ed (4)
Not Applicable (5)
Very Satisfied (1)
Satisfied (2)
Dissatisfied (3)
Very Dissatisfi
ed (4)
Not Applicable (5)
Admissions &
Records (1)
Office of Veteran's
Affairs (2)
Cashier's (Business) Office
(3)
Financial Assistance Office
(4)
University Police
(5)
University
Bookstore (6)
Q22 Please indicate how satisfied you are with the following offices/services. Additionally, please indicate how often you use the office/service.
Please indicate the extent of your satisfaction with the office/service.
How often do you utilize the office/service in an academic year?
Very Satisfied (1)
Satisfied (2)
Dissatisfied (3)
Very Dissatisfied
(4)
Not Applicable
(5) Never
(1)
1-4 times per year (2)
5-10 times per year (3)
11 or more times per year (4)

Page 3 of 42
SAIL Online Portal (1)
Bell Library (2) Campus Copies (3)
Tutoring/CASA (Center for
Academic Student Achievement) (4)
Disability Services (5)
University Center (6)
Counseling Center (7)
Health Center (8) Recreational
Sports (9)
Dining Hall (10) Other campus
food businesses (13)
Student activities and events (11) Islander Athletic
events (12)

Page 4 of 42
Q23 Please indicate the extent of your satisfaction with the following processes/services/program.
Very
Satisfied (1)
Satisfied (2) Dissatisfied (3) Very Dissatisfied (4)
Not Applicable (5)
The web registration process (1)
The walk-up registration process (2)
The ease of dropping/adding courses (3)
The fee payment process (4) The billing procedures (5)
The hours of operation of the Cashier's (Business) office (6)
The timeliness of financial assistance award
announcements (7)
The First Year Learning Community program (8)
The overall quality of Academic Advising you have received at this campus (9)
The effectiveness of tutoring services provided by CASA
(10)
The hours and days of the Dining Hall food service (11) The hours and days of the
other campus food locations (NOT Dining Hall) (12)

Page 5 of 42
Q24 Please indicate the extent of your satisfaction with the following services or processes at TAMU-CC.
Very
Satisfied (1)
Satisfied (2) Dissatisfied (3) Very Dissatisfied (4)
Not Applicable (5)
The helpfulness of the staff at the mail center (2) The availability of
printing/copying on campus (9)
The price of printing/copying on campus (10)
The quality of care offered by the Counseling Center (3)
The quality of care offered by the Health Center (4)
The availability of channels for expressing student
complaints (5)
The fairness of ACADEMIC misconduct disciplinary
process (7)
The fairness of student disciplinary procedures administered under the
Student Code of Conduct (6)
Display This Question:
If Please indicate the extent of your satisfaction with the following services or processes at TAMU-CC. = The fairness of student disciplinary procedures administered under the Student Code of Conduct [ Dissatisfied is selected]
Or Please indicate the extent of your satisfaction with the following services or processes at TAMU-CC. = The fairness of student disciplinary procedures administered under the Student Code of Conduct [ Very Dissatisfied is selected ] Q25 Please explain why you were dissatisfied with the fairness of the disciplinary procedures.
________________________________________________________________
________________________________________________________________
________________________________________________________________
________________________________________________________________
________________________________________________________________
Page 6 of 42
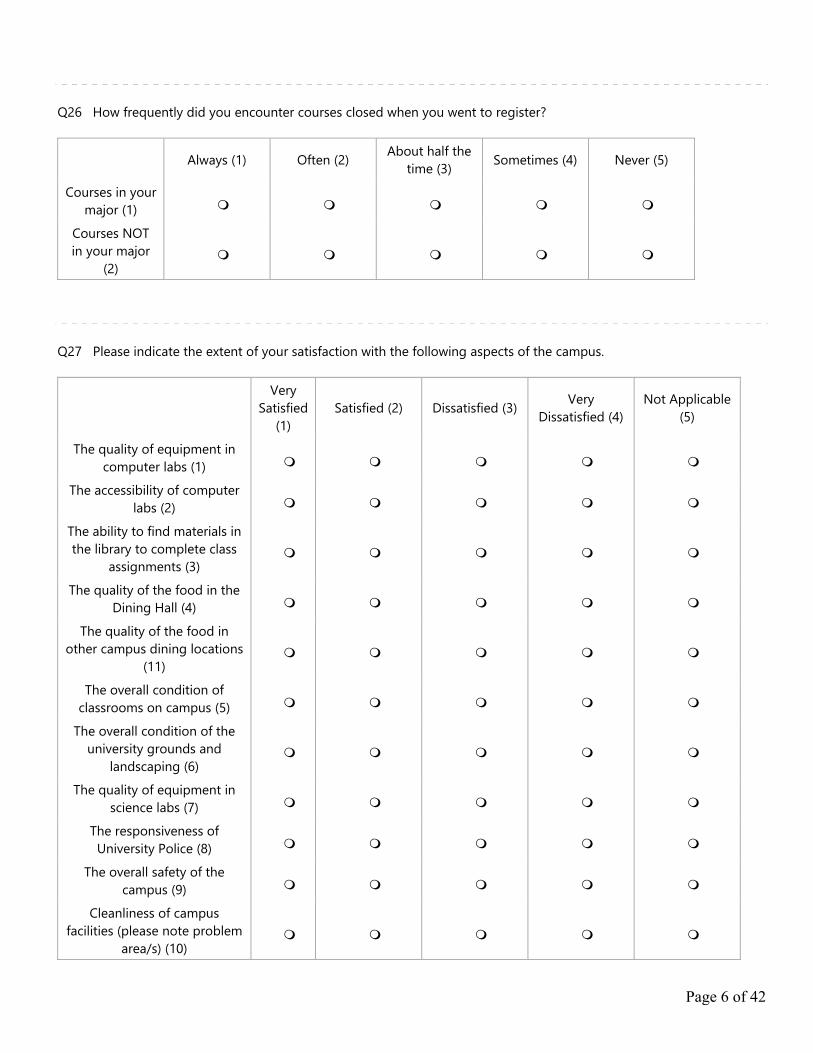
Q26 How frequently did you encounter courses closed when you went to register?
Always (1) Often (2) About half the time (3) Sometimes (4) Never (5)
Courses in your major (1)
Courses NOT in your major
(2)
Q27 Please indicate the extent of your satisfaction with the following aspects of the campus.
Very
Satisfied (1)
Satisfied (2) Dissatisfied (3) Very Dissatisfied (4)
Not Applicable (5)
The quality of equipment in computer labs (1)
The accessibility of computer labs (2)
The ability to find materials in the library to complete class
assignments (3)
The quality of the food in the Dining Hall (4)
The quality of the food in other campus dining locations
(11)
The overall condition of classrooms on campus (5)
The overall condition of the university grounds and
landscaping (6)
The quality of equipment in science labs (7)
The responsiveness of University Police (8)
The overall safety of the campus (9)
Cleanliness of campus facilities (please note problem
area/s) (10)

Page 7 of 42
Display This Question:
If Please indicate the extent of your satisfaction with the following aspects of the campus. = Cleanliness of campus facilities (please note problem area/s) [ Dissatisfied is selected ]
And Please indicate the extent of your satisfaction with the following aspects of the campus. = Cleanliness of campus facilities (please note problem area/s) [ Very Dissatisfied is selected ] Q28 What are the location/s that are not clean?
________________________________________________________________
________________________________________________________________
________________________________________________________________ Q29 Please indicate the extent of your satisfaction with the following aspects of the campus.
Very
Satisfied (1)
Satisfied (2) Dissatisfied (3) Very Dissatisfied (4)
Not Applicable (5)
The cleanliness of recreational sports facilities and equipment (1) The safety of recreational sports
facilities (2) The contribution of intercollegiate athletic programs to your sense of
school spirit (3)
Bike lanes leading to campus (4) On campus bike pathways (5) Your sense of pride about the
campus (6)
City bus route #5 to campus (7) City bus route #37 to campus (8) The Wave #63 Shuttle bus service
(9) Momentum #60 Shuttle bus
service (10) The adequacy of sidewalks on
campus (If dissatisfied, where else are they needed?) (12)
Page 8 of 42
Display This Question:
If Please indicate the extent of your satisfaction with the following aspects of the campus. = The adequacy of sidewalks on campus (If dissatisfied, where else are they needed?) [ Dissatisfied is selected]
And Please indicate the extent of your satisfaction with the following aspects of the campus. = The adequacy of sidewalks on campus (If dissatisfied, where else are they needed?) [ Very Dissatisfied is selected] Q30 Where do you thing sidewalks should be added?
________________________________________________________________
________________________________________________________________
________________________________________________________________
________________________________________________________________
________________________________________________________________ End of Block: Campus Services Start of Block: Around Campus Q31 Are you actively involved in any student organizations at TAMU-CC? (Student organizations include academic or career clubs, student government, publications, religious clubs, special interest clubs, sports clubs, Greek organizations, etc.)
Yes (1) No (2)
Display This Question:
If Are you actively involved in any student organizations at TAMU-CC? (Student organizations incl... = Yes is selected Q32 Please indicate to what extent being involvement in a student organization has made you feel more connected to campus.
A great deal (1) A lot (2) A moderate amount (3) A little (4) Not at all (5)

Page 9 of 42
Display This Question: If Are you actively involved in any student organizations at TAMU-CC? (Student organizations incl... = No is selected
Q33 If no, why not?
I don't have time (1) Nothing interested me (2) I didn't know about these organizations (3) What I was interested in wasn't offered or available (4) I didn't like what I experienced when I tried an organization (5) Other (6) ________________________________________________
Q34 Please indicate the extent of your satisfaction with the following educational outcomes at TAMU-CC.
Very Satisfied (1) Satisfied (2) Dissatisfied (3) Very
Dissatisfied (4) N/A (5)
The protection of the right to
freedom of expression on
campus (1)
Learning to appreciate
teamwork with diverse groups
in settings outside the
classroom (2)
Q35 If you were to start college all over again, would you attend TAMU-CC?
Definitely would (1) Probably would (2) Probably would not (3) Definitely would not (4) I would not attend college at all (5)

Page 10 of 42
Q36 Would you recommend TAMU-CC to a prospective student? Definitely would (1) Probably would (2) Probably would not (3) Definitely would not (4)
Q37 How likely are you to learn about campus events and information from the following sources?
Extremely likely (39)
Somewhat likely (40)
Somewhat unlikely (42)
Extremely unlikely (43)
University Website (12) Fliers/Posters on campus bulletin
boards (13)
Brochures (14) Sidewalk chalking (15) Word of mouth (16)
Email (17) iNews - (Thursday events email) (18)
Facebook (1) Flickr (2)
Google+ (3) Instagram (4) LinkedIn (5) Myspace (6) Snapchat (7) Tagged (8) Tumbler (9) Twitter (10)
YouTube (11)

Page 11 of 42
Q38 How often do you use these social media to learn about campus events and programs?
Daily (11) Weekly (13) Almost never (14) No account (16) Facebook (1)
Flickr (2) Google+ (3) Instagram (4) LinkedIn (5) Myspace (6) Snapchat (7) Tagged (8) Tumbler (9) Twitter (10)
YouTube (11) Q39 Is there a different platform that you wish had campus event information? If so please tell us where you would like to see campus event information.
________________________________________________________________ Q40 Mark social media you do not use.
Facebook (1) Flickr (2) Google+ (3) Instagram (4) LinkedIn (5) Myspace (6) Snapchat (7) Tagged (8) Tumbler (9) Twitter (10) YouTube (11)

Page 2 of 42
Q41 Please use the space below to provide any comments you would like to add about your overall educational experience at TAMU-CC.
________________________________________________________________
________________________________________________________________ Q42 Is there anything else you would like us to know?
________________________________________________________________
________________________________________________________________ Q43 This is the end of the survey. We greatly appreciate that you shared your opinions! End of Block: Around Campus