2021 apartment sales study - anderson multifamily team
TRANSCRIPT

DYLANSIMON.COM
2021APARTMENTSALES STUDYS E A T T L E & P U G E T S O U N D

01MULTIFAMILY INVESTMENT SALES SPECIALIST
Multifamily Investment Sales Specialists ....................................................................1Meet the Team ..................................................................................................................2
022020 IN REVIEW
Puget Sound Overview ................................................................................................8
03SUBMARKET BREAKDOWNS
Urban King ......................................................................................................................18North King .......................................................................................................................24East King ..........................................................................................................................26South King .......................................................................................................................28North Snohomish ..........................................................................................................30South Snohomish ..........................................................................................................32Urban Tacoma ................................................................................................................34Suburban Pierce ............................................................................................................36Kitsap ................................................................................................................................38
04NOTES & SOURCES
TABLE OF CONTENTS

Last year, in our first market research report of 2020, we welcomed clients to a new decade, predicting that a long economic expansion cycle and an election year would likely bring change. One way or another, we could not have been more accurate in predicting change on the horizon.
INTRODUCTIONFEBRUARY 2021
DYLANSIMON.COM
JERRID ANDERSON
Executive Vice President DYLAN SIMON
Executive Vice President
It’s no stretch to say that 2020 was a year of extreme challenges economically, politically, and socially. The Seattle and Puget Sound region bore the brunt of many such challenges – and at the frontlines were apartment owners, investors, and developers.
In 2020, a great majority of the apartment investment market turned its focus to maintaining operations – a massive shift from the “hurry and sell” mentality of 2019, which was markedly impacted by changes in the real estate excise tax changes approved for 2020 and beyond.
For those apartment owners and investors that chose to sell their apartment buildings in 2020, a year of uncertainty proved sales results that were far better than the market may otherwise have predicted.
The following pages analyze the sale of 227 apartment buildings across the four county Puget Sound region, spanning King, Snohomish, Pierce, and Kitsap Counties. In addition to tracking each region’s sales, this study provides an in-depth look at sales trends over the last 15 years, detailing sales data by building age, size, and location.
We provide this data and analysis to assist you in understanding our region’s apartment market and in making informed and profitable investment decisions. Please reach out to us to further discuss this study and how it directly applies to your investment strategies.
We look forward to partnering with you to put our market insights to work to achieve your investment goals in 2021 and beyond!

MULTIFAMILY INVESTMENT SALES SPECIALISTSOur goal is to help you maximize your multifamily investments, whether that means selling your apartment building faster and for more money, or providing advisory services for assets you plan to hold or want to buy.
And while anyone can promise you results, we deliver on our promises with a data-driven understanding of the market, an extensive buyer reach, and exceptional marketing that cuts through the noise.
$1.2BTOTAL VALUE SOLD & UNDER CONTRACT
9,634TOTAL UNITS SOLD & UNDER CONTRACT
1.23M SFDEVELOPMENT LAND SOLD & UNDER CONTRACT
$96MACTIVE LISTINGS & LISTINGS COMING TO MARKET
PUGET SOUND MARKET 2021 APARTMENT SALES STUDY KIDDER MATHEWS4

Dylan is a market-leading broker throughout Seattle and the Puget Sound region, specializing in the sale of apartment buildings and development land, with expertise in sales strategies, market knowledge, and industry trends.
Dylan SimonExecutive Vice President
MEET THE TEAM
Jerrid focuses on urban apartment and development land sales, and is the region’s micro-apartment expert. His entrepreneurial mindset and passion for marketing lead the innovation his clients have come to expect.
Jerrid AndersonExecutive Vice President
Alex provides debt financing services to the team's clients. He helps to source and facilitate financing for multifamily owners, investors, and developers for use in acquisitions, developments, and re-capitalizations. He has six-plus years of experience in multifamily lending, with more than ten years of experience in commercial real estate.
Alex MundyDebt & Equity Finance
Matt is an apartment broker specializing in urban and suburban apartment sales, development land sales, and off-market acquisitions. His attention to detail and excellent client service ensures smooth transactions from marketing through closing.
Matt LairdSenior Associate
Brandon is an apartment broker specializing in the sale of apartment buildings and off-market acquisitions, with an expertise in the South Puget Sound market.
Brandon LawlerAssociate Vice President
Winslow is an apartment broker specializing in sales of apartment buildings and development land across the Puget Sound, with expertise in the Snohomish County market.
Winslow LeeAssociate
KIDDER MATHEWS 2021 APARTMENT SALES STUDY PUGET SOUND MARKET 5
M U L T I F A M I L Y I N V E S T M E N T S A L E S S P E C I A L I S T S


2020 IN REVIEW
S E C T I O N 0 2
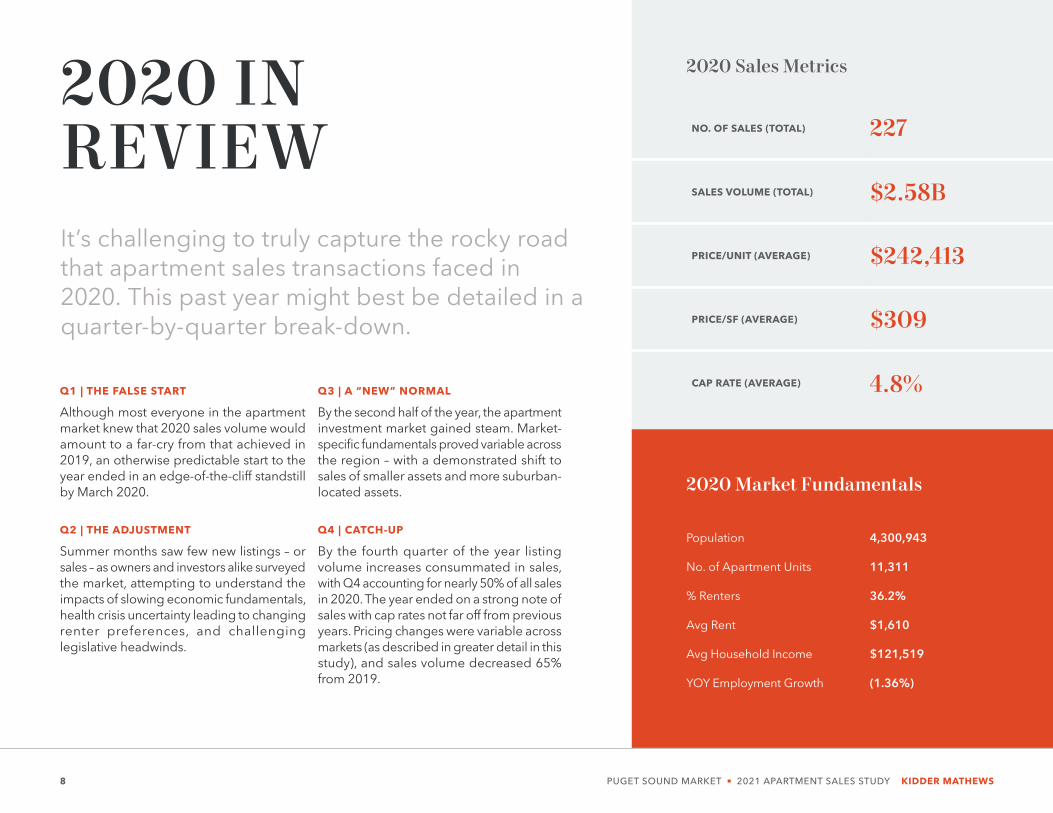
It’s challenging to truly capture the rocky road that apartment sales transactions faced in 2020. This past year might best be detailed in a quarter-by-quarter break-down.
Population 4,300,943
No. of Apartment Units 11,311
% Renters 36.2%
Avg Rent $1,610
Avg Household Income $121,519
YOY Employment Growth (1.36%)
2020 Sales Metrics
NO. OF SALES (TOTAL) 227
SALES VOLUME (TOTAL) $2.58B
PRICE/UNIT (AVERAGE) $242,413
PRICE/SF (AVERAGE) $309
CAP RATE (AVERAGE) 4.8%
2020 IN REVIEW
2020 Market Fundamentals
Q1 | THE FALSE START
Although most everyone in the apartment market knew that 2020 sales volume would amount to a far-cry from that achieved in 2019, an otherwise predictable start to the year ended in an edge-of-the-cliff standstill by March 2020.
Q2 | THE ADJUSTMENT
Summer months saw few new listings – or sales – as owners and investors alike surveyed the market, attempting to understand the impacts of slowing economic fundamentals, health crisis uncertainty leading to changing renter preferences, and challenging legislative headwinds.
Q3 | A “NEW” NORMAL
By the second half of the year, the apartment investment market gained steam. Market-specific fundamentals proved variable across the region – with a demonstrated shift to sales of smaller assets and more suburban-located assets.
Q4 | CATCH-UP
By the fourth quarter of the year listing volume increases consummated in sales, with Q4 accounting for nearly 50% of all sales in 2020. The year ended on a strong note of sales with cap rates not far off from previous years. Pricing changes were variable across markets (as described in greater detail in this study), and sales volume decreased 65% from 2019.
PUGET SOUND MARKET 2021 APARTMENT SALES STUDY KIDDER MATHEWS8

2013 2014 2015 2016 2017 2018 2019 2020
No. of Sales 293 330 380 396 308 304 353 227
Sales Volume $2.49B $3.34B $4.82B $5.66B $4.29B $4.37B $7.37B $2.58B
Avg Price/Unit $154,080 $163,751 $183,497 $196,679 $228,809 $245,709 $266,376 $242,413
Avg Price/SF $204 $227 $243 $258 $311 $343 $348 $309
Avg Cap Rate 5.3% 5.2% 4.9% 4.8% 4.6% 4.5% 4.7% 4.8%
HISTORICAL PERFORMANCEA historical look back at the last 15 years of apartment sales in the Seattle & Puget Sound region does little to demonstrate the challenges faced in the market during this past year. In a year where it was surprising that any sales were consummated, the sales market demonstrated far more velocity and vibrancy than the Great Recession years of 2009 – 2011 yet paled in comparison to the YOY sales years spanning 2015 – 2019.
A review of historical sales volume, velocity, and pricing clearly demonstrates slowed sales volume, yet consistent investor demand is evidenced by only nominal changes in cap rates over the last 6 years.
What is hidden in summary data is better illustrated in the pages of this study. Namely, sales volume and pricing were highly variable based on asset vintage, size, and location. In 2020, investors favored smaller and more suburban-located assets, and a healthy bid-ask spread slowed sales volume, yet preserved overall asset pricing.
Sales Velocity
20102011
20122013
20142015
20162017
20182019
20202008
20072009
20052006
$0B
$1B
$2B
$3B
$4B
$5B
$6B
$7B
$8B
0
100
200
300
400
500
600
ALL BUILDING AGES, ALL SALES VALUES; ALL COUNTIES — 5+ UNIT APARTMENT BUILDINGS
Sales Volume (Total) No. of Sales
Average Cap Rate
Puget Sound United States
2010
2011
2012
2013
2014
2015
2016
2017
2018
2019
2020
2008
2007
2009
2005
2006
4.5%
5.0%
5.5%
6.0%
6.5%
7.0%
7.5%
8.0%
KIDDER MATHEWS 2021 APARTMENT SALES STUDY PUGET SOUND MARKET 9
2 0 2 0 I N R E V I E W

URBAN KING
NORTH KING
SOUTH SNOHOMISH
NORTH SNOHOMISH
EAST KING
SOUTH KING
SUBURBAN PIERCE
URBAN TACOMA
KITSAP
It’s no surprise that apartment investment in the Puget Sound Region looked much different in 2020 than previous years. Although sales volume of $2.6B in 2020 is demonstrably lower than its 2019 peak, sales velocity picked up considerably at the end of the year with nearly 40% of closings occurring in Q4 alone.
URBAN KING
Urban King County yet again retains its top spot as the most active sales market, with 77 sales equating to nearly 35% of the region’s total transaction volume. This coupled with the highest average price per square foot in the region, further demonstrates investors’ willingness to “pay-up” to own in Urban King County.
SUBURBAN MARKETS
Suburban markets fared well in a tumultuous 2020, with nearly all submarkets experiencing compressing cap rates and retaining strong pricing. South King County leads the charge with $708M in transaction volume and record-setting average price per square foot. Investor demand continues its strong trend outside the urban core.
2020 SALES METRICS BY SUBMARKET
PUGET SOUND MARKET 2021 APARTMENT SALES STUDY KIDDER MATHEWS10
2 0 2 0 I N R E V I E W

RegionTotal No. of Sales
Total Sales as % of Inventory* Sales Volume Avg Price/Unit Avg Price/SF Avg Cap Rate
URBAN KING 77 2.0% $846M $309,130 $433 4.3%
NORTH KING 16 2.3% $69M $240,787 $289 3.9%
EAST KING 12 4.7% $494M $351,060 $370 4.3%
SOUTH KING 38 4.9% $708M $223,786 $262 4.8%
NORTH SNOHOMISH 11 1.8% $29M $180,672 $208 4.7%
SOUTH SNOHOMISH 6 2.0% $75M $218,019 $312 4.8%
URBAN TACOMA 12 4.2% $25M $138,271 $183 5.1%
SUBURBAN PIERCE 46 4.7% $265M $177,264 $206 5.6%
KITSAP 9 5.3% $75M $171,844 $206 5.5%
$2.58B2020 Puget Sound Total Sales Volume
KIDDER MATHEWS 2021 APARTMENT SALES STUDY PUGET SOUND MARKET 11
2 0 2 0 I N R E V I E W

King County (All) Seattle
Population 2,271,785 740,227
No. of Apartment Units 283,042 154,098
% Renters 41.2% 47.7%
Avg Rent $1,722 $1,710
Avg Household Income $135,093 $133,005
YOY Employment Growth (4.14%) (3.15%)*
YOY Wage Growth 2.83% N/A**
Urban King North King East King South King
NO. OF SALES (TOTAL) 77 16 12 38
SALES VOLUME (TOTAL) $846M $69M $494M $708M
PRICE/UNIT (AVERAGE) $308,122 $240,787 $351,060 $223,786
PRICE/SF (AVERAGE) $433 $289 $370 $262
CAP RATE (AVERAGE) 4.3% 3.9% 4.3% 4.8%
KING COUNTY 2020 SALES METRICS
**EMPLOYMENT DATA FOR SEATTLE-TACOMA-BELLEVUE MSA.
**AVERAGE WEEKLY WAGE DATA FOR THE SEATTLE METRO NOT AVAILABLE.
2020 Market Fundamentals
PUGET SOUND MARKET 2021 APARTMENT SALES STUDY KIDDER MATHEWS12
2 0 2 0 I N R E V I E W

SA
LES
VE
LOC
ITY
SA
LES
TR
EN
DS
1
While Urban King County’s sale metrics are significantly off last year’s record-setting performance, cap rates held steady at 4.3%.
2
With nearly half the sales as last year, and one fifth of the sales volume, it is apparent that market uncertainty had a greater effect on North King County more than any other King County market.
3 4
Investors continue to love East King. In 2020, this submarket had its highest number of sales in the last 4 years, and with nearly half of its transactions clocking in at over $400,000 per unit, it remained an expensive market.
Sales metrics continue to trend up in South King County, with average sales price per square foot and average cap rates maintaining records previously set in 2018.
Sales Volume
2005
2006
2019
2018
2017
2016
2015
2014
2013
2012
2011
2010
2009
2008
2007
20
20
No. of Sales
$500K
$1.00B
$1.50B
$2.00B
$2.50B
$3.00B
$3.50B
50
100
150
200
250
300
350
North King
Sales Volume
2005
2006
2019
2018
2017
2016
2015
2014
2013
2012
2011
2010
2009
2008
2007
20
20
No. of Sales
$500K
$1B
$1.5B
$2B
$2.5B
$3B
$3.5B
0
50
100
150
200
250
300
350
Sales Volume
2005
2006
2019
2018
2017
2016
2015
2014
2013
2012
2011
2010
2009
2008
2007
20
20
No. of Sales
$0M
$500K
$1B
$1.5B
$2B
$2.5B
$3B
$3.5B
50
100
150
200
250
300
350
Sales Volume
2005
2006
2019
2018
2017
2016
2015
2014
2013
2012
2011
2010
2009
2008
2007
20
20
No. of Sales
$500K
$1B
$1.5B
$2B
$2.5B
$3B
$3.B
50
100
150
200
250
300
350
East King South KingUrban King$/SF
2005
2006
2019
2018
2017
2016
2015
2014
2013
2012
2011
2010
2009
2008
2007
20
20
Cap Rate
$100
$200
$300
$400
$500
$600
1%
2%
3%
4%
5%
6%
7%
8%
$/SF20
05
2006
2019
2018
2017
2016
2015
2014
2013
2012
2011
2010
2009
2008
2007
20
20
Cap Rate
$100
$200
$300
$400
$500
$600
1%
2%
3%
4%
5%
6%
7%
8%
$/SF
2005
2006
2019
2018
2017
2016
2015
2014
2013
2012
2011
2010
2009
2008
2007
20
20
Cap Rate
$100
$200
$300
$400
$500
$600
1%
2%
3%
4%
5%
6%
7%
8%
$/SF
20
05
20
06
20
19
20
18
20
17
20
16
20
15
20
14
20
13
20
12
20
11
20
10
20
09
20
08
20
07
20
20
Cap Rate
$100
$200
$300
$400
$500
$600
0%
1%
2%
3%
4%
5%
6%
7%
8%
SALES VOLUME NO. OF SALES
PRICE/SF (AVG) CAP RATE (AVG)
1
2
4
3
KIDDER MATHEWS 2021 APARTMENT SALES STUDY PUGET SOUND MARKET 13
2 0 2 0 I N R E V I E W

Snohomish Pierce Kitsap
Population 834,034 917,565 277,559
No. of Apartment Units 55,760 70,509 12,126
% Renters 30.9% 32.0% 28.7%
Avg Rent $1,501 $1,310 $1,381
Avg Household Income $111,835 $99,077 $104,294
YOY Employment Growth (4.34%) 0.95% 3.87%*
YOY Wage Growth (4.15%) (4.37%) (1.95%)
* YOY EMPLOYMENT GROWTH FOR BREMERTON MSA. EMPLOYMENT GROWTH DATA FOR KITSAP COUNTY NOT AVAILABLE.
2020 Market Fundamentals
Snohomish Pierce Kitsap
NO. OF SALES (TOTAL) 17 58 9
SALES VOLUME (TOTAL) $104M $290M $75M
PRICE/UNIT (AVERAGE) $193,853 $169,197 $171,844
PRICE/SF (AVERAGE) $245 $201 $206
CAP RATE (AVERAGE) 4.8% 5.5% 5.5%
SNOHOMISH, PIERCE & KITSAP COUNTIES 2020 SALES METRICS
PUGET SOUND MARKET 2021 APARTMENT SALES STUDY KIDDER MATHEWS14
2 0 2 0 I N R E V I E W

$/SF
2005
2006
2019
2018
2017
2016
2015
2014
2013
2012
2011
2010
2009
2008
2007
20
20
Cap Rate
$0
$50
$100
$150
$200
$250
0%
1%
2%
3%
4%
5%
6%
7%
8%
9%
Sales Volume
20
05
20
06
20
19
20
18
20
17
20
16
20
15
20
14
20
13
20
12
20
11
20
10
20
09
20
08
20
07
20
20
No. of Sales
$200M
$400M
$600M
$800M
$1B
$1.2B
$1.4B
20
40
60
80
100
120
1 2
Pierce County continues to have banner years for volume of sales transactions, with 2020 surpassing all previous years. Pricing remained strong in 2020, maintaining growth in nearly every year since 2010.
3
Kitsap County continued a trend of value-growth in 2020, marking the second year in a row of the highest appreciation of sales values of all markets in the region. Sales volume remains low, yet value increases prove continued investor demand.
SALES VELOCITY
SALES TRENDS
Sales Volume
2005
2006
2019
2018
2017
2016
2015
2014
2013
2012
2011
2010
2009
2008
2007
20
20
No. of Sales
$200M
$400M
$600M
$800M
$1M
$1.2B
$1.4B
20
40
60
80
100
120
Pierce
Sales Volume
2005
2006
2019
2018
2017
2016
2015
2014
2013
2012
2011
2010
2009
2008
2007
20
20
No. of Sales
$200M
$400M
$600M
$800M
$1B
$1.2B
$1.4B
20
40
60
80
100
120
KitsapSnohomish$/SF
2005
2006
2019
2018
2017
2016
2015
2014
2013
2012
2011
2010
2009
2008
2007
20
20
Cap Rate
$50
$100
$150
$200
$250
1%
2%
3%
4%
5%
6%
7%
8%
9%
$/SF
2005
2006
2019
2018
2017
2016
2015
2014
2013
2012
2011
2010
2009
2008
2007
20
20
Cap Rate
$50
$100
$150
$200
$250
1%
2%
3%
4%
5%
6%
7%
8%
9%
SALES VOLUME
NO. OF SALES
PRICE/SF (AVG)
CAP RATE (AVG)
Sales volume in Snohomish remains choppy year-over-year, yet sales pricing continued to remain strong in 2020, evidenced by both increasing priced on a per-square-foot and low cap rate basis.
NO
SA
LES
NO
SA
LES
1
2 3
KIDDER MATHEWS 2021 APARTMENT SALES STUDY PUGET SOUND MARKET 15
2 0 2 0 I N R E V I E W


SUBMARKET BREAKDOWNS
S E C T I O N 0 3

HERE, Esri
2016 2017 2018 2019 2020
No. of Sales 148 125 134 146 77
Sales Volume $1.53B $1.88B $1.49B $3.19B $846M
Price/Unit (Avg) $274,739 $314,813 $313,734 $346,893 $309,130
Price/SF (Avg) $387 $460 $481 $486 $433
Cap Rate (Avg) 4.1% 4.0% 4.1% 4.3% 4.3%
Total Units* 106,331 112,960 119,957 125,067 —†
2020 posted the fewest apartment sales in Urban King County since 2010, yet cap rates held firm at 4.3%.
While the number of apartment transactions in Urban King County plummeted to Great Recession levels, cap rates were largely unaffected by market turbulence.
The last time the Urban King County apartment market saw this significant of decline in transaction volume, cap rates rose 110 basis points, reducing the value of apartments in our region by roughly 20% overnight. However, in 2020, Urban King County apartment sales averaged a 4.3% cap rate, the same as 2019, keeping values steady despite the COVID-19 pandemic.
What does this mean for apartment owners? Reduced supply of available apartment investments resulted in strong demand from investors looking to take advantage of record low interest rates. Although the short-term fundamentals (rental rates, occupancy) weakened, sellers received fair pricing for well operated properties.
Investor Tip: If you are thinking of selling in the next 2-3 years, it’s hard to argue that there's a better time than now. Limited apartments on the market with pent-up demand make 2021 a good year to sell if you plan to sell in the next several years.
Kirkland
West Bellevue
Mercer Island
SouthSeattle
WestSeattle
South Lake Union,Eastlake, Westlake
Belltown, Downtown, Pioneer Square
First Hill, Yesler Terrace
Queen Anne, Magnolia
Central District
Capitol Hill
Ballard
Fremont, Green Lake, Wallingford
University District, Roosevelt
PUGET SOUND
LAKE WASHINGTON
EAST KING
PG 28
NORTH KINGPG 26
SOUTH KING PG 30
LAKE SAMMAMISH
SALES HISTORY
URBAN KING
*TOTAL APARTMENT INVENTORY WITHIN SUBMARKET
† TOTALS STILL BEING CALCULATED
PUGET SOUND MARKET 2021 APARTMENT SALES STUDY KIDDER MATHEWS18

20102011
20122013
20142015
20162017
20182019
20202008
20072009
20052006
$/SF Cap Rate
$100
$200
$300
$400
$500
$600
$700
$800
$900
1%
2%
3%
4%
5%
6%
7%
8%
9%
5–50 Units 50+ Units
No. of Sales 66 1
Sales Volume $220M $7.48M
Price/Unit (Avg) $301,154 $146,643
Price/SF (Avg) $403 $240
Cap Rate (Avg) 4.3% —
2020 SALES BY BUILDING SIZE
Older BuildingsBuilt Pre–1995
57,397UNITS
46%OF INVENTORY
685AVG UNIT SIZE (SF)
20102011
20122013
20142015
20162017
20182019
20202008
20072009
20052006
$/SF Cap Rate
$100
$200
$300
$400
$500
$600
$700
$800
$900
1%
2%
3%
4%
5%
6%
7%
8%
9%
SALES TRENDS BY BUILDING AGE
Last CycleBuilt 1995-2010
Current CycleBuilt Post-2010
20102011
20122013
20142015
20162017
20182019
20202008
20072009
20052006
$/SF Cap Rate
$100
$200
$300
$400
$500
$600
$700
$800
$900
0%
1%
2%
3%
4%
5%
6%
7%
8%
9%
PRICE/SF (AVG)
CAP RATE (AVG)
NO CAP RATE DATA
5–50 Units 50+ Units
No. of Sales 1 2
Sales Volume $4.58M $78.6M
Price/Unit (Avg) $357,500 $543,583
Price/SF (Avg) $477 $673
Cap Rate (Avg) 4.6% 3.1%
5–50 Units 50+ Units
No. of Sales 2 5
Sales Volume $12.2M $519M
Price/Unit (Avg) $193,164 $384,193
Price/SF (Avg) $777 $603
Cap Rate (Avg) 5.3% 4.6%
46,649UNITS
37%OF INVENTORY
614AVG UNIT SIZE (SF)
21,021UNITS
17%OF INVENTORY
792AVG UNIT SIZE (SF)
U R B A N K I N G
KIDDER MATHEWS 2021 APARTMENT SALES STUDY PUGET SOUND MARKET 19

BALLARD
2016 2017 2018 2019 2020
No. of Sales 20 8 9 5 6
Sales Volume $151M $37.8M $103M $20.6M $11.3M
Avg Price/Unit $291,733 $304,883 $323,984 $338,218 $314,559
Avg Price/SF $418 $427 $492 $344 $407
Avg Cap Rate 4.2% 4.2% 4.5% 4.6% 4.2%
2016 2017 2018 2019 2020
No. of Sales 15 13 19 21 17
Sales Volume $76.1M $54.9M $74.2M $260M $44.1M
Avg Price/Unit $279,600 $326,928 $297,251 $296,468 $271,983
Avg Price/SF $386 $465 $471 $493 $413
Avg Cap Rate 4.1% 3.7% 4.4% 4.4% 4.1%
2016 2017 2018 2019 2020
No. of Sales 12 16 17 7 5
Sales Volume $40.0M $336M $104M $36.5M $16.9M
Avg Price/Unit $232,599 $312,517 $290,623 $273,256 $217,622
Avg Price/SF $403 $510 $508 $440 $367
Avg Cap Rate 3.8% 4.2% 3.8% 4.8% 4.8%
SALES BY NEIGHBORHOOD
FREMONT, GREEN LAKE, WALLINGFORD
UNIVERSITY DISTRICT, ROOSEVELT
CAPITOL HILL
UNIVERSITY OF WASHINGTON
PUGET SOUND MARKET 2021 APARTMENT SALES STUDY KIDDER MATHEWS20
U R B A N K I N G

SALES BY NEIGHBORHOOD
QUEEN ANNE, MAGNOLIA
SOUTH LAKE UNION, EASTLAKE, WESTLAKE
BELLTOWN, DOWNTOWN, PIONEER SQUARE
QUEEN ANNE
LOWER QUEEN ANNE
2016 2017 2018 2019 2020
No. of Sales 14 24 18 25 8
Sales Volume $107M $126M $147M $271M $61.7M
Avg Price/Unit $327,997 $312,445 $304,247 $386,094 $298,886
Avg Price/SF $411 $427 $455 $482 $439
Avg Cap Rate 4.0% 3.9% 3.4% 4.2% 3.9%
2016 2017 2018 2019 2020
No. of Sales 7 10 7 17 3
Sales Volume $299M $285M $35.5M $473M $325M
Avg Price/Unit $393,454 $406,909 $352,666 $375,768 $555,572
Avg Price/SF $486 $518 $474 $505 $653
Avg Cap Rate 4.1% 3.9% 3.8% 4.1% 3.9%
2016 2017 2018 2019 2020
No. of Sales 6 4 2 6 1
Sales Volume $227M $259M $18.7M $428M $66.5M
Avg Price/Unit $320,788 $337,162 $192,350 $396,849 $359,211
Avg Price/SF $513 $566 $450 $545 $591
Avg Cap Rate 3.9% 3.9% 4.6% 4.1% 4.4%
KIDDER MATHEWS 2021 APARTMENT SALES STUDY PUGET SOUND MARKET 21
U R B A N K I N G

SALES BY NEIGHBORHOOD
GASWORKS PARK | FREMONT
ALKI BEACH | WEST SEATTLE
FIRST HILL, YESLER TERRACE
CAPITOL HILL
CENTRAL DISTRICT
2016 2017 2018 2019 2020
No. of Sales 1 1 4 7 0
Sales Volume $35.0M $6.33M $120M $569M —
Avg Price/Unit $282,539 $395,313 $285,006 $451,409 —
Avg Price/SF $475 $459 $503 $667 —
Avg Cap Rate 5.2% 4.4% 4.6% 4.4% —
2016 2017 2018 2019 2020
No. of Sales 22 8 20 15 9
Sales Volume $171M $59.0M $240M $242M $43.8M
Avg Price/Unit $286,904 $352,512 $351,105 $360,307 $308,828
Avg Price/SF $455 $521 $552 $597 $449
Avg Cap Rate 3.9% 3.5% 4.2% 4.2% 3.7%
2016 2017 2018 2019 2020
No. of Sales 7 7 5 10 2
Sales Volume $48.5M $40.7M $15.1M $161M $2.80M
Avg Price/Unit $250,970 $299,337 $299,686 $308,252 $233,333
Avg Price/SF $335 $584 $446 $508 $370
Avg Cap Rate 4.2% 4.4% 3.2% 4.3% 4.0%
PUGET SOUND MARKET 2021 APARTMENT SALES STUDY KIDDER MATHEWS22
U R B A N K I N G

SALES BY NEIGHBORHOOD
GREENLAKE
PIKE PLACE MARKET | DOWNTOWN
WEST SEATTLE
SOUTH SEATTLE
WEST BELLEVUE, MERCER ISLAND
KIRKLAND
2016 2017 2018 2019 2020
No. of Sales 24 16 19 16 14
Sales Volume $77.9M $123M $220M $137M $45.3M
Avg Price/Unit $234,944 $249,373 $289,466 $285,858 $224,522
Avg Price/SF $314 $382 $433 $367 $366
Avg Cap Rate 4.4% 4.1% 4.4% 4.4% 5.0%
2016 2017 2018 2019 2020
No. of Sales 10 8 6 6 3
Sales Volume $16.8M $20.4M $19.0M $25.2M $13.1M
Avg Price/Unit $110,423 $203,227 $225,956 $247,523 $202,817
Avg Price/SF $181 $322 $408 $342 $287
Avg Cap Rate 5.0% 4.3% 4.4% 4.9% 5.0%
2016 2017 2018 2019 2020
No. of Sales 2 6 3 6 5
Sales Volume $100M $516M $116M $360M $105M
Avg Price/Unit $528,833 $412,596 $426,118 $482,263 $635,267
Avg Price/SF $536 $489 $476 $558 $691
Avg Cap Rate 4.0% 3.7% 3.2% 4.0% 4.3%
2016 2017 2018 2019 2020
No. of Sales 8 4 5 5 4
Sales Volume $182M $12.9M $277M $206M $110M
Avg Price/Unit $302,355 $335,929 $482,380 $359,161 $403,149
Avg Price/SF $351 $458 $529 $400 $450
Avg Cap Rate 3.7% 2.5% 4.1% 4.0% 4.3%
KIDDER MATHEWS 2021 APARTMENT SALES STUDY PUGET SOUND MARKET 23
U R B A N K I N G

HERE, Esri
2016 2017 2018 2019 2020
No. of Sales 38 30 31 31 16
Sales Volume $204M $307M $447M $331M $68.5M
Price/Unit (Avg) $183,187 $241,887 $253,258 $268,706 $240,787
Price/SF (Avg) $247 $330 $336 $353 $289
Cap Rate (Avg) 4.6% 4.4% 4.5% 4.7% 3.9%
Total Units* 20,255 20,826 21,736 22,410 —†
SALES HISTORY
SOUTH SNOHOMISHPG 34
EAST KING
PG 28
URBAN KINGPG 20
NORTH SEATTLE
SHORELINE
BOTHELL
PUGET SOUND
LAKE WASHINGTON
Sales volume and pricing dropped in 2020 – yet cap rates held – demonstrating investor demand, yet shaky asset operations.
North King sales volume remained consistent for the last three years, then 2020 saw a sharp decline in sales volume. Transaction volume was reduced nearly in half, and the size of the average sale equally dropped from $10M down to $4.3M.
Average cap rates at 3.9% demonstrate continued desire for investors to own in North King even though the returns today may not be as exciting as they were the last couple of years. The sales that occurred in North King in 2020 were generally clustered in pockets in Greenwood and Lake City, with 4 sales and 5 sales, respectively
NORTH KING
*TOTAL APARTMENT INVENTORY WITHIN SUBMARKET
† TOTALS STILL BEING CALCULATED
PUGET SOUND MARKET 2021 APARTMENT SALES STUDY KIDDER MATHEWS24

20102011
20122013
20142015
20162017
20182019
20202008
20072009
20052006
$/SF Cap Rate
$100
$200
$300
$400
$500
$600
$700
$800
$900
1%
2%
3%
4%
5%
6%
7%
8%
9%
5–50 Units 50+ Units
No. of Sales 13 0
Sales Volume $54.9M —
Price/Unit (Avg) $229,170 —
Price/SF (Avg) $267 —
Cap Rate (Avg) 3.8% —
2020 SALES BY BUILDING SIZE
Older BuildingsBuilt Pre–1995
14,123UNITS
63%OF INVENTORY
782AVG UNIT SIZE (SF)
20102011
20122013
20142015
20162017
20182019
20202008
20072009
20052006
$/SF Cap Rate
$100
$200
$300
$400
$500
$600
$700
$800
$900
1%
2%
3%
4%
5%
6%
7%
8%
9%
SALES TRENDS BY BUILDING AGE
Last CycleBuilt 1995-2010
Current CycleBuilt Post-2010
20102011
20122013
20142015
20162017
20182019
20202008
20072009
20052006
$/SF Cap Rate
$100
$200
$300
$400
$500
$600
$700
$800
$900
1%
2%
3%
4%
5%
6%
7%
8%
9%
PRICE/SF (AVG)
CAP RATE (AVG)
NO CAP RATE DATA
5–50 Units 50+ Units
No. of Sales 1 0
Sales Volume $2.48M —
Price/Unit (Avg) $247,500 —
Price/SF (Avg) $326 —
Cap Rate (Avg) 3.6% —
5–50 Units 50+ Units
No. of Sales 2 0
Sales Volume $11.2M —
Price/Unit (Avg) $312,938 —
Price/SF (Avg) $414 —
Cap Rate (Avg) 4.8% —
5,328UNITS
24%OF INVENTORY
725AVG UNIT SIZE (SF)
2,959UNITS
13%OF INVENTORY
798AVG UNIT SIZE (SF)
N O R T H K I N G
NO
SA
LES
NO
SA
LES
NO
SA
LES
NO
SA
LES
798
KIDDER MATHEWS 2021 APARTMENT SALES STUDY PUGET SOUND MARKET 25

HERE, Esri
2016 2017 2018 2019 2020
No. of Sales 14 8 7 11 12
Sales Volume $662M $389M $303M $684M $494M
Price/Unit (Avg) $282,645 $297,501 $335,832 $380,603 $351,06
Price/SF (Avg) $321 $367 $366 $441 $370
Cap Rate (Avg) 4.6% 4.6% 4.4% 4.4% 4.3%
Total Units* 27,057 28,339 30,198 31,576 —†
SALES HISTORY
EAST KING
URBAN KING
PG 20
NORTH KING
PG 26
LAKE WASHINGTON
REDMOND
BELLEVUE
NEWCASTLE
ISSAQUAH
SAMMAMISH
NORTH BEND
SNOQUALMIE
LAKE SAMMAMISH
This new darling apartment investment market of the Northwest offers investors a safe haven, yet likely low returns in the near-term.
If East King County is your greener pasture for apartment investing in 2021, you’ll need to demonstrate patience. Less than 12 apartment buildings sold each year in East King for the past decade. While the idea of owning in this high-end suburban market sounds great, you’ll have to sacrifice near term cash-flow.
With an average of one transaction per month for the last 10 years, it’s a tough market to penetrate. What the data doesn’t show is that there were many more apartment buildings brought to market in East King County in 2020 than sold. Why? Because the asking prices based on in-place income were in the 3.0% cap rate range, a very low return with little ability to raise rents in sight.
Investor Tip: If you have the long-term staying power to weather the short-term low return of East King apartment investing, you will likely reap rewards with above market appreciation over time due to constrained new supply and limited investment opportunities.
*TOTAL APARTMENT INVENTORY WITHIN SUBMARKET
† TOTALS STILL BEING CALCULATED
PUGET SOUND MARKET 2021 APARTMENT SALES STUDY KIDDER MATHEWS26

HERE, Esri
20102011
20122013
20142015
20162017
20182019
20202008
20072009
20052006
$/SF Cap Rate
$100
$200
$300
$400
$500
$600
$700
$800
$900
1%
2%
3%
4%
5%
6%
7%
8%
9%
5–50 Units 50+ Units
No. of Sales 6 0
Sales Volume $52.9M —
Price/Unit (Avg) $303,186 —
Price/SF (Avg) $317 —
Cap Rate (Avg) 4.3% —
2020 SALES BY BUILDING SIZE
Older BuildingsBuilt Pre–1995
16,709UNITS
53%OF INVENTORY
883AVG UNIT SIZE (SF)
20102011
20122013
20142015
20162017
20182019
20202008
20072009
20052006
$/SF Cap Rate
$100
$200
$300
$400
$500
$600
$700
$800
$900
1%
2%
3%
4%
5%
6%
7%
8%
9%
SALES TRENDS BY BUILDING AGE
Last CycleBuilt 1995-2010
Current CycleBuilt Post-2010
20102011
20122013
20142015
20162017
20182019
20202008
20072009
20052006
$/SF Cap Rate
$100
$200
$300
$400
$500
$600
$700
$800
$900
1%
2%
3%
4%
5%
6%
7%
8%
9%
PRICE/SF (AVG)
CAP RATE (AVG)
NO CAP RATE DATA
5–50 Units 50+ Units
No. of Sales 0 2
Sales Volume — $97.1M
Price/Unit (Avg) — $404,523
Price/SF (Avg) — $426
Cap Rate (Avg) — 4.1%
5–50 Units 50+ Units
No. of Sales 0 4
Sales Volume — $344M
Price/Unit (Avg) — $396,141
Price/SF (Avg) — $421
Cap Rate (Avg) — 4.4%
8,905UNITS
28%OF INVENTORY
857AVG UNIT SIZE (SF)
5,962UNITS
19%OF INVENTORY
1,076AVG UNIT SIZE (SF)
E A S T K I N G
NO
SA
LES
NO
SA
LES
53%
KIDDER MATHEWS 2021 APARTMENT SALES STUDY PUGET SOUND MARKET 27

HERE, Esri
2016 2017 2018 2019 2020
No. of Sales 73 59 55 62 38
Sales Volume $1.07B $773M $1.15B $1.17B $708M
Price/Unit (Avg) $127,296 $147,658 $181,083 $186,501 $223,786
Price/SF (Avg) $152 $186 $229 $224 $262
Cap Rate (Avg) 5.6% 5.2% 4.7% 5.2% 4.8%
Total Units* 54,363 54,749 55,433 55,999 —†
SALES HISTORY
PUGET SOUND
URBAN TACOMA
PG 36
EAST KING
PG 28
WHITE CENTER
BURIEN
DES MOINES
FEDERAL WAY
AUBURN
KENT
RENTON
MAPLE VALLEY
BLACK DIAMOND
KITSAPPG 40
South King apartment values continue their upward trend as investors bid-up assets for the prospect of stability and investment returns, by owning apartments outside of Urban King.
In 2020, South King could not keep up with its 2019 sales volume, yet per-transaction value was almost identical, boosted by larger, institutional transactions.
We continue to see the trend of out-of-state investors targeting the outer rim of Seattle, attracted by higher returns and a continuation of renter demand in Suburban King. The sale of Knol Apartment in August, and the TruAmerica Portfolio in December, demonstrates capital from across the county targeting South King.
South King continues to experience impressive value-growth. Average pricing-per-square-foot of $262 NRSF is exactly double that of 2015, and the 17% appreciation year-over-year on a per-square-foot basis is the highest in any Puget Sound submarket.
We predict continually strong renter demand in South King and appreciation of asset value will follow. Also on the horizon, an increase in sales of “post-value-add” buildings as more apartments are renovated, stabilized, and sold. In South King, pricing metrics remain at a peak, making 2021 an ideal time to sell should market fundamentals falter – or interest rates increase – in years to come.
SOUTH KING
*TOTAL APARTMENT INVENTORY WITHIN SUBMARKET
† TOTALS STILL BEING CALCULATED
PUGET SOUND MARKET 2021 APARTMENT SALES STUDY KIDDER MATHEWS28

HERE, Esri
20102011
20122013
20142015
20162017
20182019
20202008
20072009
20052006
$/SF Cap Rate
$100
$200
$300
$400
$500
$600
$700
$800
$900
1%
2%
3%
4%
5%
6%
7%
8%
9%
5–50 Units 50+ Units
No. of Sales 20 14
Sales Volume $52.7M $578M
Price/Unit (Avg) $199,984 $225,223
Price/SF (Avg) $267 $247
Cap Rate (Avg) 4.7% 4.8%
2020 SALES BY BUILDING SIZE
Older BuildingsBuilt Pre–1995
46,632UNITS
83%OF INVENTORY
848AVG UNIT SIZE (SF)
20102011
20122013
20142015
20162017
20182019
20202008
20072009
20052006
$/SF Cap Rate
$100
$200
$300
$400
$500
$600
$700
$800
$900
0%
1%
2%
3%
4%
5%
6%
7%
8%
9%
SALES TRENDS BY BUILDING AGE
Last CycleBuilt 1995-2010
Current CycleBuilt Post-2010
20102011
20122013
20142015
20162017
20182019
20202008
20072009
20052006
$/SF Cap Rate
$100
$200
$300
$400
$500
$600
$700
$800
$900
1%
2%
3%
4%
5%
6%
7%
8%
9%
PRICE/SF (AVG)
CAP RATE (AVG)
NO CAP RATE DATA
5–50 Units 50+ Units
No. of Sales 2 1
Sales Volume $17.7M $56.5M
Price/Unit (Avg) $318,424 $319,209
Price/SF (Avg) $303 $288
Cap Rate (Avg) 5.2% 4.4%
5–50 Units 50+ Units
No. of Sales 1 0
Sales Volume $3.16M —
Price/Unit (Avg) $395,000 —
Price/SF (Avg) $267 —
Cap Rate (Avg) 4.9% —
3,364UNITS
6%OF INVENTORY
825AVG UNIT SIZE (SF)
6,003UNITS
11%OF INVENTORY
920AVG UNIT SIZE (SF)
S O U T H K I N G
NO
SA
LES
NO
SA
LES
NO
SA
LES
KIDDER MATHEWS 2021 APARTMENT SALES STUDY PUGET SOUND MARKET 29

2016 2017 2018 2019 2020
No. of Sales 43 39 21 26 11
Sales Volume $660M $320M $171M $481M $28.6M
Price/Unit (Avg) $136,274 $136,613 $174,216 $183,812 $180,672
Price/SF (Avg) $163 $161 $206 $202 $208
Cap Rate (Avg) 5.5% 5.4% 5.7% 5.3% 4.7%
Total Units* 24,987 25,371 25,419 25,659 —†
SALES HISTORY
NORTH SNOHOMISH
SOUTH SNOHOMISH PG 34
PUGET SOUND
POSSESSION SOUND
PORT SUSAN
EVERETT
LAKE STEVENS
MARYSVILLE
ARLINGTON
CAMANO ISLAND
WHIDBEY ISLAND
SNOHOMISH
GRANITE FALLS
After Snohomish County hit over a billion dollars in sales volume in 2019, sales volume came back down to earth in 2020.
Everett led North Snohomish with 6 sales in 2020. Most of the sales last year took place in and around Paine Field. Boeing contemplating a major move had investors questioning where they want to invest in North Snohomish.
Despite a sharp decline in sales volume year-over-year, cap rates held strong, with average cap rates in the 4.7% to 4.8% range. Pricing on a per-square-foot basis increased year-over-year– demonstrating that fewer sales did not necessarily result in a reduction in asset value.
All eyes are on the suburbs of Seattle, with many apartment investors looking to focus on suburban submarkets. North Snohomish faces headwinds with the fate of Boeing in the balance, but the market could be buoyed by renters and investors alike looking outside of urban markets to place their dollars.
*TOTAL APARTMENT INVENTORY WITHIN SUBMARKET
† TOTALS STILL BEING CALCULATED
PUGET SOUND MARKET 2021 APARTMENT SALES STUDY KIDDER MATHEWS30

20102011
20122013
20142015
20162017
20182019
20202008
20072009
20052006
$/SF Cap Rate
$100
$200
$300
$400
$500
$600
$700
$800
$900
1%
2%
3%
4%
5%
6%
7%
8%
9%
5–50 Units 50+ Units
No. of Sales 9 1
Sales Volume $14.2M $12.8M
Price/Unit (Avg) $170,048 $190,299
Price/SF (Avg) $211 $171
Cap Rate (Avg) 4.8% 4.1%
2020 SALES BY BUILDING SIZE
Older BuildingsBuilt Pre–1995
17,966UNITS
70%OF INVENTORY
860AVG UNIT SIZE (SF)
20102011
20122013
20142015
20162017
20182019
20202008
20072009
20052006
$/SF Cap Rate
$100
$200
$300
$400
$500
$600
$700
$800
$900
1%
2%
3%
4%
5%
6%
7%
8%
9%
SALES TRENDS BY BUILDING AGE
Last CycleBuilt 1995-2010
Current CycleBuilt Post-2010
20102011
20122013
20142015
20162017
20182019
20202008
20072009
20052006
$/SF Cap Rate
$100
$200
$300
$400
$500
$600
$700
$800
$900
0%
1%
2%
3%
4%
5%
6%
7%
8%
9%
PRICE/SF (AVG)
CAP RATE (AVG)
NO CAP RATE DATA
5–50 Units 50+ Units
No. of Sales 1 0
Sales Volume $1.60M —
Price/Unit (Avg) $266,667 —
Price/SF (Avg) $220 —
Cap Rate (Avg) 4.8% —
5–50 Units 50+ Units
No. of Sales 0 0
Sales Volume — —
Price/Unit (Avg) — —
Price/SF (Avg) — —
Cap Rate (Avg) — —
2,083UNITS
8%OF INVENTORY
895AVG UNIT SIZE (SF)
5,610UNITS
22%OF INVENTORY
929AVG UNIT SIZE (SF)
N O R T H S N O H O M I S H
NO
SA
LES
NO
SA
LES
NO
SA
LES
NO
SA
LES
8%
KIDDER MATHEWS 2021 APARTMENT SALES STUDY PUGET SOUND MARKET 31

HERE, Esri
2016 2017 2018 2019 2020
No. of Sales 34 14 6 21 6
Sales Volume $660M $188M $121M $728M $75.0M
Price/Unit (Avg) $164,762 $212,317 $220,637 $248,710 $218,019
Price/SF (Avg) $190 $229 $240 $272 $312
Cap Rate (Avg) 4.7% 4.9% 4.4% 4.4% 4.8%
Total Units* 15,961 16,024 16,024 16,545 —†
SALES HISTORY
NORTH SNOHOMISH
PG 32
NORTH KING
PG 26
EAST KING
PG 28
PUGET SOUND
MILL CREEK
MARTHA LAKE
LYNNWOOD
MOUNTLAKE TERRACE
MONROE
MALTBY
It’s hard to beat a record-breaking year – which was 2019 for South Snohomish – and it’s even harder to do it during a Pandemic!In any year it would be hard for South Snohomish to compete with the sales volume it experienced in 2019. With over $728M in sales volume that year, South Snohomish was on a roll with investors targeting Edmonds and Lynnwood. Things cooled down markedly in 2020, transactions were sparse as investors played a game of wait-and-see.
Changing overall market dynamics are also impacting investor sentiment in South Snohomish. Significant new apartment development is taking place around Alderwood Mall, Lynnwood Place, and Northline Village – all in preparation for the 2024 opening of the Lynnwood’s Light Rail. As the light-rail opens, and if renters continue to prefer more suburban markets, we could see more apartment owners take advantage of investor demand and decide to sell.
SOUTH SNOHOMISH
*TOTAL APARTMENT INVENTORY WITHIN SUBMARKET
† TOTALS STILL BEING CALCULATED
PUGET SOUND MARKET 2021 APARTMENT SALES STUDY KIDDER MATHEWS32

20102011
20122013
20142015
20162017
20182019
20202008
20072009
20052006
$/SF Cap Rate
$100
$200
$300
$400
$500
$600
$700
$800
$900
1%
2%
3%
4%
5%
6%
7%
8%
9%
5–50 Units 50+ Units
No. of Sales 4 2
Sales Volume $15.2M $59.8M
Price/Unit (Avg) $210,186 $233,685
Price/SF (Avg) $314 $308
Cap Rate (Avg) 5.0% 4.0%
2020 SALES BY BUILDING SIZE
Older BuildingsBuilt Pre–1995
11,136UNITS
67%OF INVENTORY
858AVG UNIT SIZE (SF)
20102011
20122013
20142015
20162017
20182019
20202008
20072009
20052006
$/SF Cap Rate
$100
$200
$300
$400
$500
$600
$700
$800
$900
1%
2%
3%
4%
5%
6%
7%
8%
9%
SALES TRENDS BY BUILDING AGE
Last CycleBuilt 1995-2010
Current CycleBuilt Post-2010
20102011
20122013
20142015
20162017
20182019
20202008
20072009
20052006
$/SF Cap Rate
$100
$200
$300
$400
$500
$600
$700
$800
$900
1%
2%
3%
4%
5%
6%
7%
8%
9%
PRICE/SF (AVG)
CAP RATE (AVG)
NO CAP RATE DATA
5–50 Units 50+ Units
No. of Sales 0 0
Sales Volume — —
Price/Unit (Avg) — —
Price/SF (Avg) — —
Cap Rate (Avg) — —
5–50 Units 50+ Units
No. of Sales 0 0
Sales Volume — —
Price/Unit (Avg) — —
Price/SF (Avg) — —
Cap Rate (Avg) — —
2,307UNITS
14%OF INVENTORY
913AVG UNIT SIZE (SF)
3,102UNITS
19%OF INVENTORY
999AVG UNIT SIZE (SF)
S O U T H S N O H O M I S H
NO
SA
LES
NO
SA
LES
NO
SA
LES
NO
SA
LES
NO
SA
LES
NO
SA
LES
NO
SA
LES
NO
SA
LES
KIDDER MATHEWS 2021 APARTMENT SALES STUDY PUGET SOUND MARKET 33

2016 2017 2018 2019 2020
No. of Sales 7 2 2 12 12
Sales Volume $62.0M $10.1M $15.1M $127M $24.6M
Price/Unit (Avg) $131,657 $178,171 $316,518 $178,940 $138,271
Price/SF (Avg) $151 $154 $238 $245 $183
Cap Rate (Avg) 5.4% 4.5% 4.5% 4.6% 5.1%
Total Units* 6,311 6,450 6,622 6,590 —†
SALES HISTORY
OLD TOWN
HILLTOP
STADIUM DISTRICT
S Y
AK
IMA
AV
E
PA
CIF
IC A
VE
S 11TH ST
S S
PR
AG
UE
AV
E
DIVIS
ION A
VE
6TH AVE
S 12TH ST
N I ST
N TACOMA AVE
N 30TH ST
N U
NIO
N S
T
University of Puget Sound
NORTH END
CENTRAL TACOMA
COMMENCEMENT BAY
URBAN TACOMA
The crown jewel of South Puget Sound, Urban Tacoma proves an incredibly hard market to enter as few apartment buildings sell each year.
If you have not visited Tacoma’s Downtown recently, you may be surprised – in a good way! It is not the downtown that you experienced a few years back. The sun sparkling off classic brick buildings, light-rail lines throughout downtown, clean streets, and a phenomenal view of Commencement Bay all support its urbanization. The story of “Techoma” continues to come into focus as tech companies weigh the benefits of leaving other downtowns. In addition, increasing enrollment at the liberal arts college, University of Puget Sound, pushes renter demand and urbanization.
As East King is to Urban King, investors’ patience in the growth of Urban Tacoma may well be richly rewarded as renters and investors gain confidence in this thriving downtown.
From 2016 to 2018 the market had only 11 apartment sales, yet in 2019 and 2020 it experienced 12 transactions each. However, the only apartment sale over 15 units was our sale of the 63-unit Bayside Garden Apartments.
What's next for Urban Tacoma? Although pricing metrics subsided compared to 2019, we maintain confidence in Urban Tacoma as a hot investment market. It remains at the top of investors' wish lists for Pierce County, and apartment owners should take advantage in 2021.
*TOTAL APARTMENT INVENTORY WITHIN SUBMARKET
† TOTALS STILL BEING CALCULATED
PUGET SOUND MARKET 2021 APARTMENT SALES STUDY KIDDER MATHEWS34

20102011
20122013
20142015
20162017
20182019
20202008
20072009
20052006
$/SF Cap Rate
$100
$200
$300
$400
$500
$600
$700
$800
$900
1%
2%
3%
4%
5%
6%
7%
8%
9%
5–50 Units 50+ Units
No. of Sales 11 1
Sales Volume $12.7M $11.9M
Price/Unit (Avg) $133,670 $188,889
Price/SF (Avg) $180 $220
Cap Rate (Avg) 5.3% 4.0%
2020 SALES BY BUILDING SIZE
Older BuildingsBuilt Pre–1995
4,908UNITS
74%OF INVENTORY
721AVG UNIT SIZE (SF)
20102011
20122013
20142015
20162017
20182019
20202008
20072009
20052006
$/SF Cap Rate
$100
$200
$300
$400
$500
$600
$700
$800
$900
1%
2%
3%
4%
5%
6%
7%
8%
9%
SALES TRENDS BY BUILDING AGE
Last CycleBuilt 1995-2010
Current CycleBuilt Post-2010
20102011
20122013
20142015
20162017
20182019
20202008
20072009
20052006
$/SF Cap Rate
$100
$200
$300
$400
$500
$600
$700
$800
$900
1%
2%
3%
4%
5%
6%
7%
8%
9%
PRICE/SF (AVG)
CAP RATE (AVG)
NO CAP RATE DATA
5–50 Units 50+ Units
No. of Sales 0 0
Sales Volume — —
Price/Unit (Avg) — —
Price/SF (Avg) — —
Cap Rate (Avg) — —
5–50 Units 50+ Units
No. of Sales 0 0
Sales Volume — —
Price/Unit (Avg) — —
Price/SF (Avg) — —
Cap Rate (Avg) — —
854UNITS
13%OF INVENTORY
785AVG UNIT SIZE (SF)
828UNITS
13%OF INVENTORY
809AVG UNIT SIZE (SF)
U R B A N T A C O M A
NO
SA
LES
NO
SA
LES
NO
SA
LES
NO
SA
LES
NO
SA
LES
NO
SA
LES
NO
SA
LES
NO
SA
LES
NO
SA
LES
NO
SA
LES
NO
SA
LES
NO
SA
LES
KIDDER MATHEWS 2021 APARTMENT SALES STUDY PUGET SOUND MARKET 35

HERE, Esri
2016 2017 2018 2019 2020
No. of Sales 30 22 41 38 46
Sales Volume $658M $279M $586M $392M $265M
Price/Unit (Avg) $120,018 $135,595 $144,048 $152,748 $177,264
Price/SF (Avg) $138 $156 $174 $182 $206
Cap Rate (Avg) 5.8% 5.5% 5.5% 5.5% 5.6%
Total Units* 47,002 47,676 47,989 48,773 —†
SALES HISTORY
CARR INLET
TACOMA
UNIVERSITY PLACE
LAKEWOOD
DUPONTSPANAWAY
PARKLAND
PUYALLUP
SUMNER
BONNEY LAKE
FIFE
GRAHAM
SUBURBAN PIERCE
In search for investment returns south of Seattle, apartment investors have a limited time to find good deals as asset values continue to get bid-up.
Sales metrics in 2020 smashed expectations, carried by marquee sales in Puyallup and South Tacoma. Evidenced by higher pricing metrics – on a price-per-unit and price-per-square foot basis – the market continued to surpass previous peaks
These record-breaking sale figures were achievable due to rent and vacancy stability in Pierce County compared to the rest of Puget Sound – bolstering investor confidence. Although sales metrics skyrocketed, Suburban Pierce continues to provide investment returns that are simply unachievable in other Puget Sound investment markets.
What does the future hold for Suburban Pierce? Investors continue to search for investment returns outside of Seattle in 2021, providing a healthy pool of buyers. We forecast a healthy sales market for apartment owners as a serious amount of capital is available for Pierce County apartment opportunities, and we don’t see that trend abating anytime soon.
*TOTAL APARTMENT INVENTORY WITHIN SUBMARKET
† TOTALS STILL BEING CALCULATED
PUGET SOUND MARKET 2021 APARTMENT SALES STUDY KIDDER MATHEWS36

HERE, Esri
20102011
20122013
20142015
20162017
20182019
20202008
20072009
20052006
$/SF Cap Rate
$100
$200
$300
$400
$500
$600
$700
$800
$900
1%
2%
3%
4%
5%
6%
7%
8%
9%
5–50 Units 50+ Units
No. of Sales 29 1
Sales Volume $65.8M $11.9M
Price/Unit (Avg) $143,665 $99,167
Price/SF (Avg) $187 $135
Cap Rate (Avg) 5.8% —
2020 SALES BY BUILDING SIZE
Older BuildingsBuilt Pre–1995
35,283UNITS
72%OF INVENTORY
789AVG UNIT SIZE (SF)
20102011
20122013
20142015
20162017
20182019
20202008
20072009
20052006
$/SF Cap Rate
$100
$200
$300
$400
$500
$600
$700
$800
$900
1%
2%
3%
4%
5%
6%
7%
8%
9%
SALES TRENDS BY BUILDING AGE
Last CycleBuilt 1995-2010
Current CycleBuilt Post-2010
20102011
20122013
20142015
20162017
20182019
20202008
20072009
20052006
$/SF Cap Rate
$100
$200
$300
$400
$500
$600
$700
$800
$900
1%
2%
3%
4%
5%
6%
7%
8%
9%
PRICE/SF (AVG)
CAP RATE (AVG)
NO CAP RATE DATA
5–50 Units 50+ Units
No. of Sales 4 4
Sales Volume $13.3M $113M
Price/Unit (Avg) $160,863 $251,641
Price/SF (Avg) $138 $238
Cap Rate (Avg) 5.4% 4.9%
5–50 Units 50+ Units
No. of Sales 7 1
Sales Volume $33.5M $27.6M
Price/Unit (Avg) $280,434 $275,639
Price/SF (Avg) $293 $365
Cap Rate (Avg) 5.3% —
5,738UNITS
12%OF INVENTORY
972AVG UNIT SIZE (SF)
7,752UNITS
16%OF INVENTORY
1,037AVG UNIT SIZE (SF)
S U B U R B A N P I E R C E
NO
SA
LES
NO
SA
LES
72%
KIDDER MATHEWS 2021 APARTMENT SALES STUDY PUGET SOUND MARKET 37

HERE, Esri
2016 2017 2018 2019 2020
No. of Sales 9 9 7 6 9
Sales Volume $148M $143M $80.8M $270M $75.1M
Price/Unit (Avg) $114,332 $125,916 $138,911 $225,135 $171,844
Price/SF (Avg) $126 $133 $143 $238 $206
Cap Rate (Avg) 6.1% 6.0% 5.5% 5.6% 5.5%
Total Units* 8,195 8,440 8,606 8,720 —†
SALES HISTORY
BREMERTON
SEATTLE
SILVERDALE
ERLANDS POINT-KITSAP
LAKE
TRIKKALA
SINCLAIR INLET
PORT ORCHARD
BAINBRIDGE ISLAND
PUGET SOUND
URBAN KING
PG 20
NORTH KING
PG 26
KITSAP COUNTY
Kitsap County continues its streak as a sweetheart investment market, with apartment investors large and small putting their dollars to work across the peninsula.
While Kitsap County couldn’t quite keep up with last year’s record-setting performance, it posted respectable sales figures in 2020 with average price-per-square-foot holding steady above the $200 NRSF benchmark, and average cap rates compressing to the historic low of 5.5%.
As predicted in our 2020 Sales Market Study, we saw more sales of smaller apartment buildings (50 units or less) in Kitsap County in 2020 than in the previous four years combined. Private investors caught wind of what institutional investors have known for years and invested in this high-upside market.
The two large apartment building sales in Kitsap County were notable in that one was a diamond-in-the-rough, 100-unit, value-add property in Silverdale that our team sold to a great local client, and the other was a 91-unit, new construction property in Poulsbo that sold for a record breaking $297,000/unit and nearly $350 per square foot.
Our prediction for 2021: Expect to see more stabilized post-value-add properties hit the market, with the ones featuring well-executed, full-renovation programs achieving top-of-market pricing as investors continue to allocate dollars in Puget Sound suburban markets.
*TOTAL APARTMENT INVENTORY WITHIN SUBMARKET
† TOTALS STILL BEING CALCULATED
PUGET SOUND MARKET 2021 APARTMENT SALES STUDY KIDDER MATHEWS38

HERE, Esri
20102011
20122013
20142015
20162017
20182019
20202008
20072009
20052006
$/SF Cap Rate
$100
$200
$300
$400
$500
$600
$700
$800
$900
1%
2%
3%
4%
5%
6%
7%
8%
9%
5–50 Units 50+ Units
No. of Sales 3 1
Sales Volume $7.01M $16.2M
Price/Unit (Avg) $135,578 $162,000
Price/SF (Avg) $218 $217
Cap Rate (Avg) 5.5% 4.7%
2020 SALES BY BUILDING SIZE
Older BuildingsBuilt Pre–1995
7,038UNITS
81%OF INVENTORY
853AVG UNIT SIZE (SF)
20102011
20122013
20142015
20162017
20182019
20202008
20072009
20052006
$/SF Cap Rate
$100
$200
$300
$400
$500
$600
$700
$800
$900
1%
2%
3%
4%
5%
6%
7%
8%
9%
SALES TRENDS BY BUILDING AGE
Last CycleBuilt 1995-2010
Current CycleBuilt Post-2010
20102011
20122013
20142015
20162017
20182019
20202008
20072009
20052006
$/SF Cap Rate
$100
$200
$300
$400
$500
$600
$700
$800
$900
1%
2%
3%
4%
5%
6%
7%
8%
9%
PRICE/SF (AVG)
CAP RATE (AVG)
NO CAP RATE DATA
5–50 Units 50+ Units
No. of Sales 3 0
Sales Volume $14.7M —
Price/Unit (Avg) $137,579 —
Price/SF (Avg) $114 —
Cap Rate (Avg) 5.9% —
5–50 Units 50+ Units
No. of Sales 1 1
Sales Volume $10.2M $27.0M
Price/Unit (Avg) $268,421 $296,703
Price/SF (Avg) $294 $346
Cap Rate (Avg) 4.9% 5.5%
859UNITS
10%OF INVENTORY
825AVG UNIT SIZE (SF)
823UNITS
9%OF INVENTORY
919AVG UNIT SIZE (SF)
K I T S A P C O U N T Y
NO
SA
LES
NO
SA
LES
NO
SA
LES
NO
SA
LES
NO
SA
LES
9%10%
KIDDER MATHEWS 2021 APARTMENT SALES STUDY PUGET SOUND MARKET 39


NOTES & SOURCES
S E C T I O N 0 4

NOTES & DATA SOURCES DATA SOURCES
2020 & HISTORICAL SALES
CoStar
Real Capital Analytics
Commercial Brokers Association
Dupre & Scott
King County Registrar
Snohomish County Registrar
Pierce County Planning & Public Works Department
Kitsap County Application Services
MARKET FUNDAMENTALS
Esri
CoStar
Washington State Employment Security Department
U.S. Bureau of Labor Statistics
NOTES
Sales data for the Puget Sound region is inclusive of all 5+ unit market-rate apartment buildings in King, Snohomish, Pierce, and Kitsap Counties.
Year-over-year employment growth is calculated as the change in employment from December 2019 to December 2020 by county, utilizing data provided by the Washington State Employment Security Department.
Year-over-year wage growth is calculated as the change in average weekly wages from June 2019 to June 2020 by county, utilizing data provided by the U.S. Bureau of Labor Statistics Quarterly Census of Employment and Wages.
PUGET SOUND MARKET 2021 APARTMENT SALES STUDY KIDDER MATHEWS42

Dylan SimonExecutive Vice President
206.414.8575
Jerrid AndersonExecutive Vice President
206.499.8191
Alex MundyDebt & Equity Finance
206.747.4725
Matt LairdSenior Associate
425.736.5516
Brandon LawlerAssociate Vice President
206.484.8114
Winslow LeeAssociate
206.205.0216
KIDDER MATHEWS 2021 APARTMENT SALES STUDY PUGET SOUND MARKET 43

2021 APARTMENT SALES STUDY
KIDDER.COMDYLANSIMON.COM