20320130406022 2
TRANSCRIPT
International Journal of Civil Engineering and Technology (IJCIET), ISSN 0976 – 6308
(Print), ISSN 0976 – 6316(Online) Volume 4, Issue 6, November – December (2013), © IAEME
214
A COMPARATIVE TECHNICAL AND ECONOMICAL STUDY TO
DIFFERENT OPTIONS LOCATION FOR BRIDGE AND ITS APPROACHES
Abdul Kareem Naji Abbood
Collage of Engineering, Civil Department University of Babylon
ABSTRACT
The process of site selection of highways and bridges should be subjected to a number of technical standard and economic feasibility factors away from random to ensure the implementation of the project according to the planning requirements. The site of the bridge and approaches have been chosen by comparing and evaluating three alternatives proposal, according to the length of path location and smooth in traffic flow in addition to reducing the trip time and construction costs , so the first alternative was chosen. This alternative conducted economic and technical feasibility depending on traffic study and origin & destination survey. Expected benefits due to vehicle operation cost has been calculated which results from reducing travel time, fuel, oil, tire, as well as the benefit arising from the residual value of the project after the design life time (salvage value).Study compared discount benefit and discount costs with adaption of discount rate of (8%) according to the following economic criteria: 1. Benefit-Cost Ratio (B/C). 2. Net Present Value (NPV). 3. Internal Rate of Return (IRR). 4. Break Evan Point (BEP). The (B/C) for discount rate (8%) equal to (4.5940695) which indicates that the project is economically acceptable (B/C ≥1 acceptable). The value of NPV =79655270997 ID agreed the acceptance of the project. On the other hand the rate (IRR=27.65%) which is greater than the discount rate (8%) approved that the project is acceptable form economically and engineering aspects, the study concluded also that the (Break Even Point) of the project indicate that the benefits higher than costs started from the end of sixth year, so this project is an attractive investment and encouraging that a short payback period compared to the design life of the project (20) years.
INTERNATIONAL JOURNAL OF CIVIL ENGINEERING AND
TECHNOLOGY (IJCIET)
ISSN 0976 – 6308 (Print)
ISSN 0976 – 6316(Online)
Volume 4, Issue 6, November – December, pp. 214-229
© IAEME: www.iaeme.com/ijciet.asp
Journal Impact Factor (2013): 5.3277 (Calculated by GISI)
www.jifactor.com
IJCIET
©IAEME

International Journal of Civil Engineering and Technology (IJCIET), ISSN 0976 – 6308
(Print), ISSN 0976 – 6316(Online) Volume 4, Issue 6, November – December (2013), © IAEME
215
Key Word: Economic of Technical Feasibility, Benefit Cost Ratio. 1. INTRODUCTION
The studies of economic and technical feasibility of the most important tools that use by the decision maker to implementation of projects in general and road and bridge projects in particular, it’s away indispensable to reach the best investment of economic resources in accordance with the planning of systematic progress and strategic , as well as it works to avoid indiscriminate , adventure , improvisation and allows the parties to determine relevant to priority in the implementation of projects in accordance with the resources available . The adoption of economic feasibility studies and technical projects of roads and bridges get the benefit to the road users and national income by reducing travel time thus reduce vehicle operating costs. The choice of site path of the road leading to the bridge proposal and approaches, is not a random process or improvised, but it is subject studying a comparison range of alternatives according to scientific bases with standard methodology to provide three key elements, namely, (effort, time, cost) then the decision is made due to economic and technical feasibility of the establishment of the project or not. Adoption of the draft was a project of Musayyib new bridge and approaches (in Iraq) as a field study and methodology to achieve the requirements of the research aims. Musayyib one of the districts of the of Babylon city in Iraq , where is located north-west of it, at a distance of 50 km south-west of the capital, Baghdad, 65 km , due to the proportion to the flow of the Euphrates River , which passes the center of Al-Musayyib district , it consists of two sides , left part represents the ancient city , which represents the diversity of the different land uses ( government , educational and service , religious and health ... etc. ) , while The right side represents the new residential neighborhoods and abandoned orchards and Lands. Pass in the left pane of the district main road coming from Baghdad toward Karbala city while passing in the left part of it the main road coming from the Babylon city,in this district two bridges on the Euphrates river, a concrete bridge located in the north carried a traffic volume in two directions, while thesecond which is located in the district center iron Old, narrow and have many failures unable to carry traffic volume through it. Figure (1). 2. STUDY PROBLEM Because the iron bridge in the district have many frailer in function and construction to absorb the traffic volumes passers- through and the concrete bridge located far away from the center of district, so many traffic problem has been appeared , prompting the relevant authorities think about constructing another bridge would contribute to provide some solutions to the problems of traffic , therefore the study is trying to hold the process of comparing scientific based on a study of economic and traffic volume according to economical and technical criteria followed ,so that the decision-maker can choose the site of the bridge and approaches on according to the results of these studies away from the randomness and improvisation that would contribute to the providing solutions for traffic and reduce waste in material and human resources . 3. OBJECTIVES OF THE STUDY This study aimed to achieve the following objectives: 3-1- a comparative study between technical alternatives proposed , in terms with location , travel time , smoothness of traffic flow , Conflicts points ,hydraulic effectiveness of river in proposed site ,Physicist examination of the soil site and construction costs.

International Journal of Civil Engineering and Technology (IJCIET), ISSN 0976 – 6308
(Print), ISSN 0976 – 6316(Online) Volume 4, Issue 6, November – December (2013), © IAEME
216
3-2- data collection, according to a traffic study , include counting the reality of the traffic volume, vehicles classification and traffic forecasting as a result of the establishment of the project with determining the number of lanes (No. Of Lanes) of the bridge and approaches using the program (Highway Capacity System HCS 2000) for the proposed alternative. 3-3- Costs study: which is assigned to construction and maintenance, as well as benefits created expected from the project and the implications for reducing the disbursements of fuel oils and the tire of the vehicle as well as the time value of goods and passengers according to the alternative proposed. 3-4- Compared the costs to benefits of the proposed alternative according to standard and economic criteria adopted. 4. THE IMPORTANCE OFTHE STUDY
The importance of this study lies in being one of the studies of the few that go in to the field of the study of technical and economic feasibility or the establishment and site selection projects, roads and bridges, according to scientific approach to justify the establishment of the projector not, according to the results of technical analysis and economic based on the basis of the comparison according to economic criteria followed. 5. RESEARCHES AND PREVIOUS STUDIES 5-1-Feasibility Study for the (Cairo-Assiut) Highway (Arab Republic of Egypt: 1987)
This study was prepared by the United States Agency for Development in collaboration with the Consultative Group on Egypt in the framework of agreements of technical cooperation with the Arab Republic of Egypt to the economic feasibility study for the establishment of the Cairo - Assiut way investment total length of the current path (365 Km), which through the two-lanes with a large area of failures asphalt layer as well as the absence of road shoulders in some sections, the study tried to discuss the options available are concentrated in the development of the current path or set up a second lane. The study concluded that the establishment of a new road parallel to the current roadway economically feasible than it is to make some improvements on some sections of the existing road, the fact that the establishment of passage of a second by the current will lead to reduced flight time and service of agricultural land, which represents 60% of the territory served by The way. 5-2-Feasibility study for the (Bhatiapara-Benapole) highway in Bangladesh (ESCA: 2007)
This study was conducted by the Economic and Social Commission for Asia and the Pacific of the United Nations, the study formatted , the economic feasibility of a (Bhatiapara-Benopole) highway in Bangladesh and the statement of the need to improve in terms of engineering, economic and social, so exploratory study have been done included analysis of the current situation of the road with the bridge in terms of present and future traffic volume and (origin &destination survey) in order to estimate the traffic volume which is expected to use the proposed roadway with study growth rates and the expected costs of the project on the basis of design lifetime, taking into consideration the construction years.

International Journal of Civil Engineering and Technology (IJCIET), ISSN 0976 – 6308
(Print), ISSN 0976 – 6316(Online) Volume 4, Issue 6, November – December (2013), © IAEME
217
6. DEFINITION OF STUDY AREA
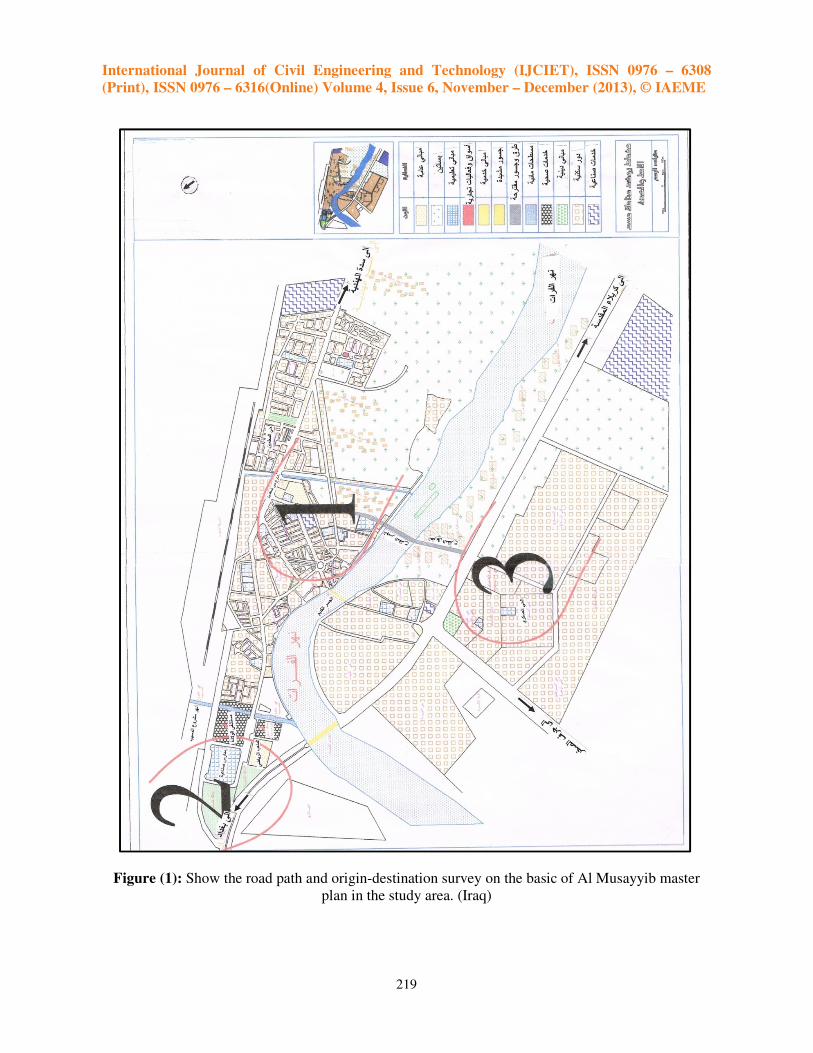
The study area represents the diversity of the various events according to land use, start from (Al-Moalemeen) area in the left bank of Euphrates River till the Baghdad–Karbala highway. (Figure 1), through the path of the garage of internal transport and Al-Sadda old roadway .It has been showed through the survey diversity of the traffic volumes these uses roads and intersections as well as having many of the traffic problems and the difficulty of moving from the district center to the other side of the river to reach the different targets, so the study conducted surveys traffic and analytical studies to get to the best site for the bridge, roadway and approaches.
6-1- Evaluation and Choose the Best Alternatives The basic objectives of the study is to make the process of a technical study of the proposed alternatives include a comprehensive description for each alternative through the conduct of the poll and the field survey and evaluate the alternatives on the basis of a scientific comparison between them in order to reach technical decision to choose the best option. (Nicholas J.Garber:2002).
Table (1): shows the description of the proposed alternatives in the study area Elementsof comparison
Alternative No.1 Alternative No.2 Alternative No.
Location
Located south of Iron Bridge while its approaches in the districts center traffic provide traffic facilities for all trips in the district.
Located south of the first alternative, its approaches outside the district center
Located south of the second alternative and far from the district center.
Length
The bridge lengths about (286m) while the length of the approaches (1214m).
The bridge lengths about (295m) while the length of the approaches (1635m).
The bridge lengths about (260m) while the length of the approaches (1850m).
Hydraulic effectiveness of river
Good and not hampered by obstacles while the banks case is good
Good and not hampered by obstacles while the banks case is good.
Traffic smooth flow
Provides as mooth traffic flow and works as a substitute for the old bridge.
Serve the future expansion of the area.
Far from the center requires need establishment of the collectors roads and in trisections to carry traffic volumes
Soil type
From the physical examination the soil is silt clay soil could be treated and construction them.
From the physical examination the soil is silt clay soil could be treated and construction them.
From the physical examination the soil is silt clay soil could be treated and construction them.
Conflicts
Conflict with the proposal alternative residential land agricultural area
Conflict with the proposal alternative large number of residential land agricultural area
Conflict with the proposal alternative some of residential land agricultural area
Travel time (5-7)min. (8-10)min. (13-15)min.
Construction costs 21368875000ID 24273205000 ID 22985750000 ID

International Journal of Civil Engineering and Technology (IJCIET), ISSN 0976 – 6308
(Print), ISSN 0976 – 6316(Online) Volume 4, Issue 6, November – December (2013), © IAEME
218
Reference to the table (1), after a process of evaluating alternatives the study has been chosen the first alternative according to the following reasons: 6-1-1- Implementation of the first alternative provides the shortest travel time trip Compared to the other two alternatives. 6-1-2- The first alternative provides smooth traffic flow, reduce delay and obstacles between the activities of different traffic especially at peak hours. 6-1-3- The construction cost of the first alternative is less than the cost of the two other alternatives. 6.2 Origin & Destination Survey The basic purpose of preparing the study of traffic is conducting census and classification of the vehicles through the stations count congestion in the study area also the study content axle loads, no. of axels for heavy vehicles, which is expected to use the bridge and approaches and using origin &destination conducted this survey in work day through a questionnaire survey sites count the traffic identified in Figure (1) and by asking the driver about his destination and the trip starting, the purpose of conducting this survey is to count the traffic flow that will use the bridge and approaches with vehicle classification in both directions (Highway Design Manual: 2005). The number of vehicles that have been identified through the matrix shown in Table (2) Table (2): Show the traffic volumes and classified according to original and destination survey in the
study area
Destination
3 2 1
B Truck PC B Truck PC B Truck PC
Type2-S2 Type3
Type2
Type2-S2 Type3
Type2
Type2-S2 Type3
Type2
1 45 6 11 36 399 11 4 6 8 80 - - - - -
2 - - -- - 69 - - - - - 16 3 9 14 277
3 - - - - - - - - - 81 29 15 18 23 379
It is clear from Table (2) and Figure (1) that the total of traffic volume coming from the
district center to the direction of the Baghdad–Karbala roadway (1-3) = 497 (Veh / hr.), While the total of those traffic volumes coming from Karbala–Baghdad roadway to the district center (3-1) = 464 (Veh / hr.).
International Journal of Civil Engineering and Technology (IJCIET), ISSN 0976 – 6308
(Print), ISSN 0976 – 6316(Online) Volume 4, Issue 6, November – December (2013), © IAEME
219
Figure (1): Show the road path and origin-destination survey on the basic of Al Musayyib master
plan in the study area. (Iraq)

International Journal of Civil Engineering and Technology (IJCIET), ISSN 0976 – 6308
(Print), ISSN 0976 – 6316(Online) Volume 4, Issue 6, November – December (2013), © IAEME
220
7. ECONOMIC FEASIBILITY STUDY OF THE PROPOSED ALTERNATIVE After it was evaluating alternatives and choose thebe stone, feasibility study for the proposed project by comparing the costs with the expected benefits. 7-1- The Costs
Representing the total costs required to set up and maintenance during the design life of the project that the construction cost as follows: The bridge cost= (11,303,000,000) ID, while the cost of conflicts facilities = (4,400,000,000) ID, and the cost of approaches= (5,665,875,000) ID thus the total= (21,368,875,000) ID. 7-2- The Benefits
It returns arising from (Road User Cost), namely: 7-2-1- (Vehicles Operation Cost)which represents the amounts spent on fuel, oil, tire and maintenance of vehicles. 7-2-2- Time cost spent by the passengers, vehicles and goods. 7-2-3- The remaining costs (Salvage Value) for the project after the end of design life. 7-3- Economic criteria approved: It has been approved economic criteria (Economic Parameters) show the feasibility of the project economically or not, through the comparison between cost sand revenues (benefits) using a rate of discount from the constructed years to the design life of project they are:- 7-3-1-Net Present Value NPV: -the standard economic evaluation depend on the difference between the total discounted benefits or revenues and costs so, the project is economically feasible whenever the difference between them is a positive value. 7-3-2-Benefit Cost Ratio B / C: - The comparison shall be made in this standard on the basis of the proportion of revenues to the discounted costs so, the project is economically justified if the ratio is greater than (1.0). 7-3-3-Internal Rate of Return IRR:- represents the standard discount rate, when discounted costs and benefits is equal, as the difference from the discount rate adopted this project is economically feasible. 7-4-The length of the proposed alternative
`Through the study of traffic and reconnaissance it was found that the length of the proposed alternative path (1500 m).while the length of exist roadway path (3000m). Based on the analysis of the data on the basis of the level of service (LOS C), using the program (Highway Capacity System 2000), has decided to be a road with four lanes, by two lanes in each direction, class (A4/25.5). (Highway Design Manual: 2005). 7-5- The proportion and classification of heavy vehicles
Through what has been deduced from the traffic study and the original-destination survey, the following percentages of heavy vehicles under the table (3):
International Journal of Civil Engineering and Technology (IJCIET), ISSN 0976 – 6308
(Print), ISSN 0976 – 6316(Online) Volume 4, Issue 6, November – December (2013), © IAEME
221
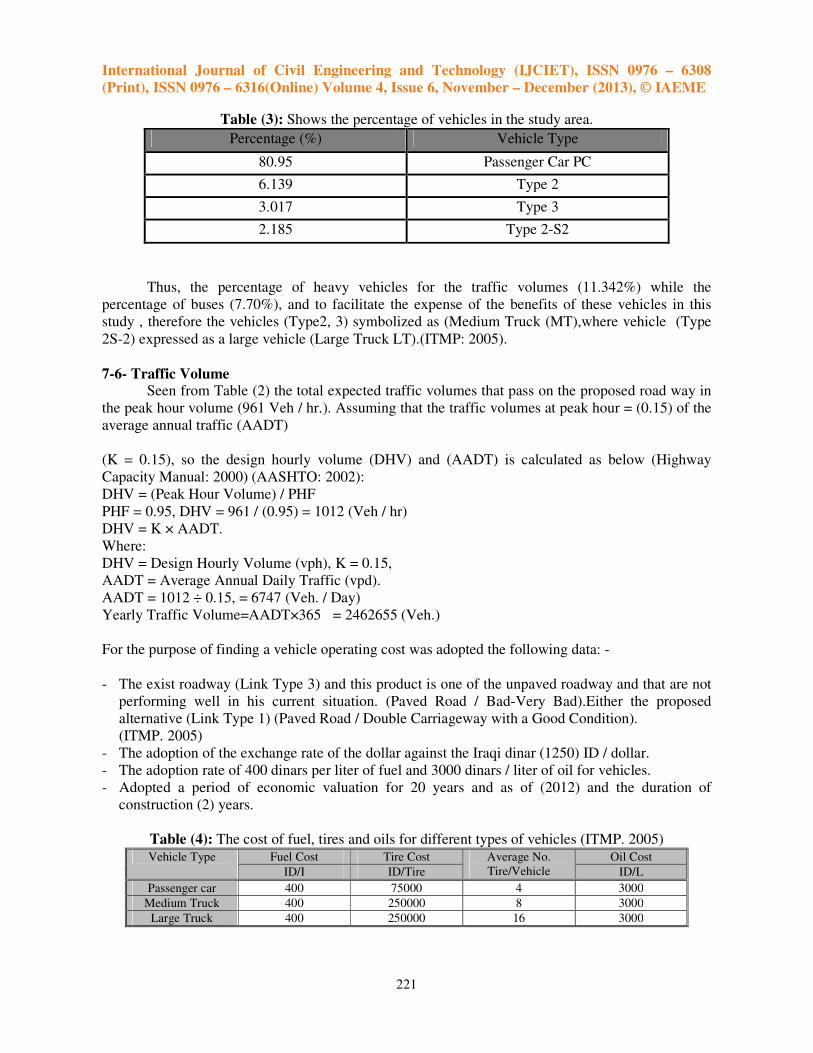
Table (3): Shows the percentage of vehicles in the study area.
Vehicle Type Percentage (%)
Passenger Car PC 80.95
Type 2 6.139
Type 3 3.017
Type 2-S2 2.185
Thus, the percentage of heavy vehicles for the traffic volumes (11.342%) while the percentage of buses (7.70%), and to facilitate the expense of the benefits of these vehicles in this study , therefore the vehicles (Type2, 3) symbolized as (Medium Truck (MT),where vehicle (Type 2S-2) expressed as a large vehicle (Large Truck LT).(ITMP: 2005). 7-6- Traffic Volume
Seen from Table (2) the total expected traffic volumes that pass on the proposed road way in the peak hour volume (961 Veh / hr.). Assuming that the traffic volumes at peak hour = (0.15) of the average annual traffic (AADT)
(K = 0.15), so the design hourly volume (DHV) and (AADT) is calculated as below (Highway Capacity Manual: 2000) (AASHTO: 2002): DHV = (Peak Hour Volume) / PHF PHF = 0.95, DHV = 961 / (0.95) = 1012 (Veh / hr) DHV = K × AADT. Where: DHV = Design Hourly Volume (vph), K = 0.15, AADT = Average Annual Daily Traffic (vpd). AADT = 1012 ÷ 0.15, = 6747 (Veh. / Day) Yearly Traffic Volume=AADT×365 = 2462655 (Veh.) For the purpose of finding a vehicle operating cost was adopted the following data: - - The exist roadway (Link Type 3) and this product is one of the unpaved roadway and that are not
performing well in his current situation. (Paved Road / Bad-Very Bad).Either the proposed alternative (Link Type 1) (Paved Road / Double Carriageway with a Good Condition).
(ITMP. 2005) - The adoption of the exchange rate of the dollar against the Iraqi dinar (1250) ID / dollar. - The adoption rate of 400 dinars per liter of fuel and 3000 dinars / liter of oil for vehicles. - Adopted a period of economic valuation for 20 years and as of (2012) and the duration of
construction (2) years.
Table (4): The cost of fuel, tires and oils for different types of vehicles (ITMP. 2005) Oil Cost Average No.
Tire/Vehicle Tire Cost Fuel Cost Vehicle Type
ID/L ID/Tire ID/I
3000 4 75000 400 Passenger car
3000 8 250000 400 Medium Truck
3000 16 250000 400 Large Truck

International Journal of Civil Engineering and Technology (IJCIET), ISSN 0976 – 6308
(Print), ISSN 0976 – 6316(Online) Volume 4, Issue 6, November – December (2013), © IAEME
222
The tables below show the costs for the use different vehicles type (passenger car, medium and heavy vehicles) by the current and proposed roadway.
Table (5): The estimated cost for the use of passenger car (ITMP.2005) Oil
Consumption [L*1000 km]
Tire Life [1000km]
Fuel Consumption
[L/km]
Average IRI Influenced
Speed [km/h]
Average Free Speed
[km/h]
Pavement Condition
Link Type
2.15 40.7 0.075 100 100 Good 1
3.05 11.5 0.105 46 100 Bad-Very Bad
3
Table (6): The estimated cost for the use of a medium Truck (ITMP.2005)
Oil Consumption [L*1000 km]
Tire Life [1000km]
Fuel Consumption
[L/km]
Average IRI Influenced
Speed [km/h]
Average Free Speed
[km/h]
Pavement Condition
Link Type
3.63 40.7 0.143 80 80 Good 1
4.75 11.5 0.231 37 80 Bad-Very Bad
3
Table (7): The estimated cost for the use of a heavy vehicle load (ITMP.2005)
Oil Consumption [L*1000 km]
Tire Life [1000km]
Fuel Consumption
[L/km]
Average IRI Influenced Speed
[km/h]
Average Free Speed [km/h]
Pavement Condition
5.75 40.7 0.160 60 60 Good
6.65 11.5 0.301 28 60 Bad-Very Bad
Table (8): The value of time for passengers (ITMP.2005)
TIME VALUE YEAR
ID/HOUR US$/HOUR
1308 1.0464 2012
1594 1.2752 2017
1815 1.4519 2022
2088 1.6701 2027
2417 1.9332 2032
2696 2.1567 2037
Table (9): The value of time for goods (ITMP. 2005)
TIME VALUE YEAR
ID/TON-HOUR US$/ TON-HOUR
23.25 0.0186 2012
23.0 0.0184 2017
21.875 0.0175 2022
20.625 0.0165 2027
19.25 0.0154 2032
20.50 0.0164 2037

International Journal of Civil Engineering and Technology (IJCIET), ISSN 0976 – 6308
(Print), ISSN 0976 – 6316(Online) Volume 4, Issue 6, November – December (2013), © IAEME
223
7-7- Vehicles operation costs Costs of different vehicle types (PC, Type2, Type3, Type2S-2) on the basis of the cost of
fuel, oil , the tire changer, and maintenance for these vehicles whom using exist roadway , compared to reduce these costs when creating proposal alternative through reduce the trip travel time resulting benefit steroid users. The form below show to calculate the operating cost for passenger car. So operating costs have been calculated for other types of vehicles based on the same principle applied for pc For the proposed alternative (Link Type1):- The cost of fuel 400 * 0.075 = 30 ID / km - pc The cost of the tire changer = (75000 * 4) / 40700 = 3.686 ID / km-pc the cost of oil = (2.15 * 3000) / 1000 = 6.450 ID / km- pc. Assuming the vehicles price of 12000000 dinars and that the cost of maintenance= 0.15* vehicle cost and that the vehicle is going 250,000 km before disappearing. Maintenance cost = (12000000 * 0.15) / 250000 = 7, 20 dinars / km-pc
∴the total cost to operate the passengers car vehicle = 47.336 dinars / km- pc. For the Exits roadway (Link Type3):- The cost of fuel 400 * 0.105 = 42.0 ID / km – pc The cost of the tire changer = (4.0 * 75000/11500 = 13.043 ID / km- pc The cost of oil = (3.05 * 3000) / 1000 = 9.15 ID / km -pc Assuming the price of the vehicle 12000000 ID, The cost of the maintenance = 0.30*vehicle price, and that the vehicle traveling 250,000 km before they disappear. Maintenance cost = (12000000 * 0.3) / 25000 = 14.40 ID / km- pc
∴ the total cost a passenger car vehicle = 78.593 ID / km- pc.
Table (10): The vehicle operation cost to different vehicle types
Vehicle Operation Cost
( Bus) (Type 2S-2) ا (Type) (Type 2) PC(
Exist New Exist New Exist New Exist New Exist New
80.0 40.0 121.0 64.0 92.40 59.20 92.40 59.20 42.0 30.0 Fuel
Consumption
65.21 18.42 347.826 98.280 173.91 49.14 173.91 49.14 13.043 3.686 Tire Cost
9.15 6.45 19.95 17.25 14.25 11.01 14.25 11.01 9.15 6.450
Oil
Consumption
Cost
12.0 6.0 36.0 18.0 36.00 18.00 36.00 18.00 14.40 7.20 Maintenance
Cost
166.36 70.87 524.776 197.53 316.62 137.35 316.62 137.35 78.593 47.336 Total ID/km-
Veh.

International Journal of Civil Engineering and Technology (IJCIET), ISSN 0976 – 6308
(Print), ISSN 0976 – 6316(Online) Volume 4, Issue 6, November – December (2013), © IAEME
224
Table (11): The rate of benefits arising from the vehicles operation Vehicle Types PC Type2 Type3 Type2S-2 Buses
percentage 0.895 0.06139 0.03017 0.02185 0.077
Vehicle operation
cost
New roadway 42.365 8.431 4.143 4.3160 5.456
Exist roadway 70.340 19.433 9.552 11.466 12.809
Table (12): The cost and benefit of vehicle operation
Roadway type Average vehicle operation cost (ID/Km-veh.)
Path length (Km)
Average vehicle operation cost (ID/Km-veh.)
New roadway 64.711 1.50 97.066
Exist roadway 123.60 3.0 370.80
Average vehicle operation benefits=237.734(ID/Km-veh.)
Table (13): Travel time for vehicles using exist roadway and new roadway in the study area.
Vehicle Type PC Type2 Type3 Type2S-2 Buses
Travel time exist roadway(Min.) 17.0 30.0 30.0 30.0 30.0
Vehicle Type PC Type2 Type3 Type2S-2 Type3S-2
Travel time new roadway(Min.) 4.0 7.0 7.0 7.0 7.0
Travel time difference(hr.) 0.216 0.383 0.383 0.383 0.383
Vehicle Percentage (%) 0.895 0.0613 0.03017 0.02185 0.077
7-8- The benefits of time value The benefit of reducing the travel time is divided into two sections: 7-8-1- The time benefit for passengers It was assumed that the vehicle capacity type (PC) (2.0) passengers, while the truck (1.0) passenger so the benefit resulting from reduced travel time for passengers are shown in the table (14).
Table (14): The passenger's benefits for the years (2012-2039) PC Type2 Type3 Type2S-2 Bus
No. of persons in vehicle
2.0 1.0 1.0 1.0 20 Time benefits of passengers
Year $ ID
2012-2014 0.4045 0.02455 0.01209 0.0087 0.617 1.0656 1332
2015-2019 0.4930 0.02993 0.01473 0.0106 0.752 1.3002 1626
2020-2024 0.5613 0.0340 0.01677 0.0121 0.8563 1.4803 1851
2025-2029 0.6457 0.0392 0.01929 0.0139 0.985 1.7019 2127
2030-2034 0.7474 0.0453 .02233 0.016 1.1402 1.9705 2464
2035-2039 0.8338 0.0506 0.0249 0.0180 1.272 2.1993 2749
7-8-2 the interest rate of the fright
The reducing of travel time resulting benefit in vehicles frights. In this study, and according to the technical specifications of the General Authority for Roads and Bridges (Highway Design Manual 2005). The: Type 2 18 tons Type 3 24 tons Type 2S-2 36 tons

International Journal of Civil Engineering and Technology (IJCIET), ISSN 0976 – 6308
(Print), ISSN 0976 – 6316(Online) Volume 4, Issue 6, November – December (2013), © IAEME
225
Accordingly, the interest arising from reducing flight time for the load in the case of the use of the proposed road instead of the current path illustrated in the table (15).
Table (15): The goods benefits for the years (2012-2039) Vehicle type PC Type2 Type3 Type2S-2 Fright time benefit
Fright(ton) 0 18 24 36 $ ID
2012-2014 0.0078 0.005 .0056 0.0184 23
2015-2019 0.0077 0.0051 0.0055 0.0183 22.80
2020-2024 0.0073 0.0048 .0052 0.0173 21.625
2025-2029 0.0069 0.0045 0.0049 0.0163 20.375
2030-2034 0.0065 0.0042 0.0046 0.0153 19.125
2035-2039 0.0061 .00410 0.00439 0.0145 18.125
Table (16): The total annual benefits resulting from time interest for the passenger's goods and vehicle operation
year Rate of increase
Vehicles No,(study year)
No. of Veh.(operation
year)
Passenger
benefits (ID/Veh
.)
Frights benefits
(ID/Veh.)
Operation benefits
(ID/Veh.)
benefits (ID/Veh.)
Total benefits (ID/Veh.)
2011 0.000 0.00 0.00 0.0000 0.0000 0.0000 0.000 0.0000
2012 1.060 2462655 2610414.3 0.0000 0.0000 0.0000 0.000 0.0000
2013 1.124 2462655 2768024.22 0.0000 0.0000 0.0000 0.000 0.0000
2014 1.191 2462655 2933022.105 1332 23.0 273.734 1914.369 5614886594
2015 1.262 2462655 3107870.61 1626 22.80 273.734 2208.169 6862703537
2016 1.338 2462655 3295032.39 1626 22.80 273.734 2208.169 7275988378
2017 1.419 2462655 3494507.445 1626 22.80 273.734 2208.169 7716463010
2018 1.504 2462655 3703833.12 1626 22.80 273.734 2208.169 8178689477
2019 1.594 2462655 3925472.07 1626 22.80 273.734 2208.169 8668105735
2020 1.689 2462655 4159424.295 1851 21.625 273.734 2431.994 10115694929
2021 1.791 2462655 4410615.105 1851 21.625 273.734 2431.994 10726589472
2022 1.898 2462655 4674119.19 1851 21.625 273.734 2431.994 11367429825
2023 2.012 2462655 4954861.86 1851 21.625 273.734 2431.994 12080140125
2024 2.133 2462655 5252843.115 1851 21.625 273.734 2431.994 12774882939
2025 2.261 2462655 5568062.955 2127 20.375 273.734 2706.744 15071320995
2026 2.397 2462655 5902984.053 2127 20.375 273.734 2706.744 15977866619
2027 2.540 2462655 6255143.700 2127 20.375 273.734 2706.744 16931072679
2028 2.693 2462655 6631929.915 2127 20.375 273.734 2706.744 17950936506
2029 2.854 2462655 7028417.37 2127 20.375 273.734 2706.744 19024126546
2030 3.026 2462655 7451994.03 2464 19.125 273.734 3042.494 22672647124
2031 3.207 2462655 7897734.585 2464 19.125 273.734 3042.494 24028810088
2032 3.400 2462655 8373027 2464 19.125 273.734 3042.494 25474884409
2033 3.604 2462655 8875408.62 2464 19.125 273.734 3042.494 27003377474
2034 3.820 2462655 9407342.1 2464 19.125 273.734 3042.494 28621781895

International Journal of Civil Engineering and Technology (IJCIET), ISSN 0976 – 6308
(Print), ISSN 0976 – 6316(Online) Volume 4, Issue 6, November – December (2013), © IAEME
226
Table (17): The achieved (Benefits) for multiple discount rates. Yea
r R=8% R=12% R=I5% R=20% R=25% ا���ا ا�����
0.000 0.000 0.000 0.000 0.000 0.000
0 0.000 0.000 0.000 0.000 0.000 0.000
1 0.000 0.000 0.000 0.000 0.000 0.000
2 4842278710 4095604274 3808285097 3612183611 3317439462 3057352208
3 6044037585 4743137253 4252877667 3928650885 3457747057 3059193301
4 6408020831 4656275785 4025887423 3621949207 3054982543 2594738914
5 6795950343 4572368474 3812149165 3340187122 2699937860 2201455616
6 7203036868 4487277285 3607591075 3078494612 2384723128 1866660604
7 7634069659 4403516544 3413813268 2837141773 2106188312 1582689895
8 9020031859 4823314094 3605715083 2918454085 2076278561 1497805717
9 9564758473 4735738626 3413809796 2691045006 1834722174 1270607479
10 10136187371 4646913535 3230144269 2479840468 1620278563 1077214068
11 10744999468 4561131616 3057283169 2285902333 1431331431 913532014.5
12 11391194764 4477253947 2893880023 2107282253 1264508757 774776853.7
13 13604598556 4956894295 3089471437 2191021073 1259976022 741119618.8
14 14422920317 4865790154 2924378853 2019836366 1113136715 628558595.9
15 15283361491 4774141656 2766822465 1861161362 982953430.4 532845666.6
16 16203973423 4686775838 2619183387 1715887555 868469024.9 451953820.6
17 17172721927 4599049058 2478366329 1581279350 766991767.9 383178968.8
18 20709665213 5141140281 2671545928 1660068185 771657575.4 370089546.9
19 21948412537 5045053022 2527985965 1529882661 681511854 313781144
20 23269286756 4952470947 2392966357 1410393310 602104849.7 266131809
21 24665443961 4860758522 2264771731 1300014703 531859283.9 225679774.1
22 26143728061 4770444762 2143310016 1198199142 469779519.2 191364425.5
Sv* 1559464679.911 700599173.55 391667436.778 153556678.67 62538730.52
Sum 100415000000 65700837676 49760542500 33450134570 24063268771
Sv*= (Salvage Value) = (0.75*11303000000) = (0.75*Bridge Cost)/ (1+r) n.
Table (18): The project construction costs adopted by discount rates Year Construction cost Maintenance
cost Total cost R=8% R=12% R=15% R=20% R=25%
2011 0.0 0.0 0.0
2012 10684437500 0.0 10684437500 10684437500 10684437500 10684437500 10684437500 10684437500
2013 10684437500 0.0 10684437500 9892997685 9539676339 9290815217 8903697917 8547550000
2014 170951000 170951000 146562928.7 136281090.6 129263516.1 118715972.2 109408640
2015 170951000 170951000 135706415.4 121679545.1 112403057.5 98929976.85 87526912
2016 170951000 170951000 125654088.4 108642451 97741789.09 82441647.38 70021529.6
2017 170951000 170951000 116346378.1 97002188.41 84992860.08 68701372.81 56017223.68
2018 170951000 170951000 107728127.9 86609096.8 73906834.85 57251144.01 44813778.94
2019 170951000 170951000 99748266.56 77329550.71 64266812.91 47709286.68 35851023.16
2020 170951000 170951000 92359506.07 69044241.71 55884185.14 39757738.9 28680818.52
2021 170951000 170951000 85518061.18 61646644.38 48594943.6 33131449.08 22944654.82
2022 170951000 170951000 79183389.98 55041646.77 42256472.7 27609540.9 18355723.86
2023 170951000 170951000 73317953.69 49144327.47 36744758.87 23007950.75 14684579.08
2024 170951000 170951000 67886994.15 43878863.81 31951964.23 19173292.29 11747663.27
2025 170951000 170951000 62858327.92 39177556.98 27784316.72 15977743.58 9398130.614
2026 170951000 170951000 58202155.48 34979961.59 24160275.41 13314786.31 7518504.491
2027 170951000 170951000 53890884.71 31232108.56 21008935.14 11095655.26 6014803.593
2028 170951000 170951000 49898967.32 27885811.21 18268639.25 9246379.385 4811842.874
2029 170951000 170951000 46202747.52 24898045.73 15885773.26 7705316.154 3849474.299
2030 170951000 170951000 42780321.78 22230397.97 13813715.88 6421096.795 3079579.44
2031 170951000 170951000 39611409.05 19848569.62 12011926.85 5350913.996 2463663.552
2032 170951000 170951000 36677230.6 17721937.16 10445153.79 4459094.996 1970930.841
2033 170951000 170951000 33960398.71 15823158.18 9082742.422 3715912.497 1576744.673
2034 170951000 170951000 31444813.62 14127819.8 7898036.889 3096593.748 1261395.738
Sum 22162974552
21378338853
20913619428
20284948281 19773985117

International Journal of Civil Engineering and Technology (IJCIET), ISSN 0976
(Print), ISSN 0976 – 6316(Online) Volume 4, Issue 6, November
Table (19): The discounted
IRR (%)
NPV
27.65
79227025448
45220630447
34193527155
13575598302
4575921875
Table (20):year Cumulative Costs
1 10684437500
2 20577435185
3 20723998113.7
4 20859704529.1
5 20985358617.5
6 21101704995.6
7 21209433123.5
8 21309181390.06
9 21401540896.13
10 21487058957.31
11 21566242347.29
12 21639560300.98
13 21707447295.13
14 21770305623.05
15 21828507778.53
16 21882398663.24
17 21932297630.56
18 21978500378.08
19 22021280699.86
20 22060892108.91
21 22097569339.51
22 22131529738.22
23 22162974551.84
Figure (2): Project Years and
-E+
-E+
E+
E+
E+
E+
E+
Cum.benefits-Cum.Costs)
International Journal of Civil Engineering and Technology (IJCIET), ISSN 0976
6316(Online) Volume 4, Issue 6, November – December (2013), © IAEME
227
benefits and discounted costs for different discount rates
B/C discounted costs discountedbene
fits Discount
4.5747 22162974552 100415000000
3.1152 21378338853 65700837676
2.6349 20913619428 49760542500
1.6692 20284948261 20284948281
1.2314 19773985117 24063268771
Table (20): The break-Even Point for the project Cumulative Costs Cumulative Benefits (Cum.Benefit-Cum.Cost)
10684437500 0 -10684437500
20577435185 0 -20577435185
20723998113.7 4095604274 -16628393840
20859704529.1 8838741527 -12020963002
20985358617.5 13495017313 -7490341305
21101704995.6 18067385786 -3034319210
21209433123.5 22554663072 1345229948
21309181390.06 26958179615 5648998225
21401540896.13 31781493709 10379952813
21487058957.31 36517232335 15030173378
21566242347.29 41164145870 19597903523
21639560300.98 45725277486 24085717185
21707447295.13 50202531434 28495084139
21770305623.05 55159425729 33389120106
21828507778.53 60025215883 38196708104
21882398663.24 64799357539 42916958876
21932297630.56 69486133377 47553835746
21978500378.08 74085182436 52106682058
22021280699.86 79226322716 57205042016
22060892108.91 84271375738 62210483629
22097569339.51 89223846686 67126277346
22131529738.22 94084605208 71953075470
22162974551.84 98855049970 76692075418
Years and the value of benefits higher than the costs
y = E+x -E+
R²
Years
International Journal of Civil Engineering and Technology (IJCIET), ISSN 0976 – 6308
December (2013), © IAEME
different discount rates Discount
rates (r (%)
8
12
15
20
25
Cum.Cost)
costs

International Journal of Civil Engineering and Technology (IJCIET), ISSN 0976
(Print), ISSN 0976 – 6316(Online) Volume 4, Issue 6, November
8. CONCLUSIONS Through economic and technical analysis of the data and theproposed site selection for the bridge and the approaches the following conclusions has been conducted: - 8-1- In accordance with the technical study, which was conducted on the basis of a traffic study and reconnaissance survey that the first option (Alternative no.1) installer in Figure (1) , represents the best alternatives , after conducting the evaluation and comparison of the alternatives in accordance with the length of the path , location , smooth flow of traffic provireduce of the travel time , the suitable of construction cost and conflicts points compared to other alternatives , so this alternative provides safety , efficiency and convenience for road users . 8-2- By counting traffic volumes according to original based on the analysis of these data on the basis of the level of service (LOS C), using the program (Highway Capacity System 2000it was decided to study to be a roadway with four lanes,each direction class (A4/25.5) under the technical specifications of the General Authority for Roads and Bridges. 8-3- Through economic analysis of the data for the proposed alternative and compared with the economic approved shows the followi 8-3-1- when comparing discounted costs, with discounted benefits to the discount rate adopted (8%) and the rest of the discount rates indicate that the value of (Benefit Cost Ratio B / C) = (4.5940695) ,thus this standard to justify the economic feas(B / C> 1) . 8-3-2- the second economic criterion (Net Present Value NPV) = (79655270997 ID) approved for the discount rate (8%) , and this value as gives positive indicated economic justification foconstructed of the project where the project is economically justified whenever this value is positive.
8-3-3- (Internal Rate of Return IRR = 27.65%) confirmed the high rate of profitability of the project, where the project is economically feasible adopted a proportion (8%).
-E+
-E+
E+
E+
E+
E+
E+
Cum.benefits-Cum.Costs)
International Journal of Civil Engineering and Technology (IJCIET), ISSN 0976
6316(Online) Volume 4, Issue 6, November – December (2013), © IAEME
228
Through economic and technical analysis of the data and the study of alternatives to the proposed site selection for the bridge and the approaches the following conclusions has been
In accordance with the technical study, which was conducted on the basis of a traffic study and vey that the first option (Alternative no.1) installer in Figure (1) , represents the
best alternatives , after conducting the evaluation and comparison of the alternatives in accordance with the length of the path , location , smooth flow of traffic provided the proposed alternativereduce of the travel time , the suitable of construction cost and conflicts points compared to other alternatives , so this alternative provides safety , efficiency and convenience for road users .
lumes according to original – destination survey in the study area and based on the analysis of these data on the basis of the level of service (LOS C), using the program (Highway Capacity System 2000it was decided to study to be a roadway with four lanes,each direction class (A4/25.5) under the technical specifications of the General Authority for Roads
Through economic analysis of the data for the proposed alternative and compared with the economic approved shows the following: -
costs, with discounted benefits to the discount rate adopted (8%) and the rest of the discount rates indicate that the value of (Benefit Cost Ratio B / C) = (4.5940695) ,thus this standard to justify the economic feasibility of the constructed of the project the fact that
the second economic criterion (Net Present Value NPV) = (79655270997 ID) approved for the discount rate (8%) , and this value as gives positive indicated economic justification foconstructed of the project where the project is economically justified whenever this value is positive.
Internal Rate of Return IRR = 27.65%) confirmed the high rate of profitability of the project, where the project is economically feasible whenever this percentage is greater than the discount rate
y = E+x -E+
R²
Years
International Journal of Civil Engineering and Technology (IJCIET), ISSN 0976 – 6308
December (2013), © IAEME
study of alternatives to the proposed site selection for the bridge and the approaches the following conclusions has been
In accordance with the technical study, which was conducted on the basis of a traffic study and vey that the first option (Alternative no.1) installer in Figure (1) , represents the
best alternatives , after conducting the evaluation and comparison of the alternatives in accordance ded the proposed alternative,
reduce of the travel time , the suitable of construction cost and conflicts points compared to other alternatives , so this alternative provides safety , efficiency and convenience for road users .
destination survey in the study area and based on the analysis of these data on the basis of the level of service (LOS C), using the program (Highway Capacity System 2000it was decided to study to be a roadway with four lanes, two lanes in each direction class (A4/25.5) under the technical specifications of the General Authority for Roads
Through economic analysis of the data for the proposed alternative and compared with the
costs, with discounted benefits to the discount rate adopted (8%) and the rest of the discount rates indicate that the value of (Benefit Cost Ratio B / C) = (4.5940695)
ibility of the constructed of the project the fact that
the second economic criterion (Net Present Value NPV) = (79655270997 ID) approved for the discount rate (8%) , and this value as gives positive indicated economic justification for the constructed of the project where the project is economically justified whenever this value is positive.
Internal Rate of Return IRR = 27.65%) confirmed the high rate of profitability of the project, whenever this percentage is greater than the discount rate

International Journal of Civil Engineering and Technology (IJCIET), ISSN 0976 – 6308
(Print), ISSN 0976 – 6316(Online) Volume 4, Issue 6, November – December (2013), © IAEME
229
8-4- It was been showed from table (20) that the value of benefits higher than the costs will start from the end of the sixth year and the beginning of the seventh year through the design life of the project so the Break Even Point will be in the sixth year of the life of the project. Thus this project is attractive and favorable investment because it is contend short payback period compared to the design life of the project (20) years. 9. RECOMMENDATION
9-1- It is very necessary to follow scientific criteria in the selection process of bridge site and approaches away from randomly based on , evaluation and comparison a range of alternatives according to technical and economical studies , in order to take the suitable decision about the best alternative to be done . 9-2- The study recommended that the highway and bridges projects must be included economic and technical feasibility studies justify constructed the project or not, based on a study of present and future traffic volume, land use, the conflicts path of the proposed compared to the data according to the economic criteria to provide a database of technical and economic which they help decision-makers in the implementation of projects. 10. REFERENCES
1. A Policy on Geometric Design of Highways and Streets. AASHTO, (1994), 444 North Capital
Street. N.W., Suite, Washington D.C. 20001, (202). 2. Arab Republic of Egypt, Ministry of Transportation and Communication and Marine
Transport Road and Bridge Authority. (1987). "Cairo - Assuit Highway Feasibility Study" Main Report USA i.D Project No. 263-0181.
3. Nicholas J. Garber & Lester A. Hole. (2002). "Traffic & Highway Engineering". Thomson Learning.
4. Republic of Iraq, Ministry of Housing & Reconstruction, Organization of Road & Bridges "Highway Design Manual", (2005).
5. Republic of Iraq, Ministry of Planning, (2005). "Iraq Transportation Master Plan (ITMP)". By Group of Italian Companies.
6. Transportation Research Board (2000), "Highway Capacity Manual", Special Report (209). 7. U. S. Department of Transportation. Federal Highway Administration. (2013). "Economic
Analysis Primer Benefit - Cost Analysis, Washington, DC, 20590. 8. United Nations Economic and Social Commission for Asia and the Pacific. 9. (ESCAP), (2007). Promotion and Development of the Asian Highway Priority Routes
feasibility study of AH1: Bhatiapara - Benapole Road in Bangladesh. 10. Prof. P.T. Nimbalkar and Mr.Vipin Chandra, “Estimation of Bridge Pier Scour for Clear
Water & Live Bed Scour Condition”, International Journal of Civil Engineering & Technology (IJCIET), Volume 4, Issue 3, 2013, pp. 92 - 97, ISSN Print: 0976 – 6308, ISSN Online: 0976 – 6316.
11. Bant Singh and Dr. Srijit Biswas, “Effect of E-Quality Control on Tolerance Limits in Wmm & Dbm in Highway Construction - A Case Study”, International Journal of Advanced Research in Engineering & Technology (IJARET), Volume 4, Issue 2, 2013, pp. 33 - 45, ISSN Print: 0976-6480, ISSN Online: 0976-6499.
12. Hameedaswad Mohammed, “The Influence of Road Geometric Design Elements on Highway Safety”, International Journal of Civil Engineering & Technology (IJCIET), Volume 4, Issue 4, 2013, pp. 146 - 162, ISSN Print: 0976 – 6308, ISSN Online: 0976 – 6316.