23.07.2012 quantifying the costs of regulatory inefficiency, olin mcgill
TRANSCRIPT

Quantifying the Costs
of Regulatory Inefficiency
July, 2012
Ulaanbaatar, Mongolia
Olin McGill
Business Environment Reform Advisor
Working Documents On Competitiveness And Business Enabling Environment -- Mongolia
Methodology Seminar:
“How much in value
will this project
actually deliver?”
-- Kakha Bendookidze,
State Minister on
Reforms Coordination
The $100 Million Question:

Georgia’s Unprecedented Rise on Doing Business
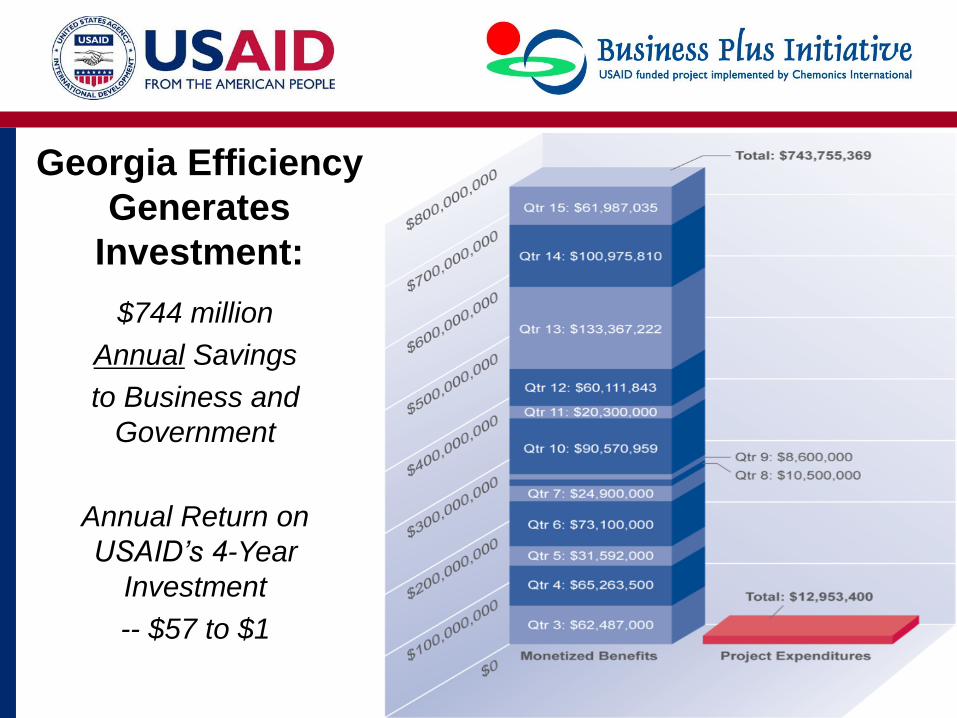
$744 million
Annual Savings
to Business and
Government
Annual Return on
USAID’s 4-Year
Investment
-- $57 to $1
Georgia Efficiency
Generates
Investment:

• Based on methodology by The Netherlands to quantify
administrative burdens on business.
• Monetizing Benefits v. Quantifying Costs
• Benefits /Costs to business = Costs X Quantity
Costs = financial (fees, bribes(?), etc.) + compliance
Quantity = number of businesses X frequency of
obligations/year
• Benefits/Costs to government = Administrative Savings
Savings = hourly rate of government employees X hours saved
Other = rental space, storage space, retrieval time, etc.
Methodology of calculations
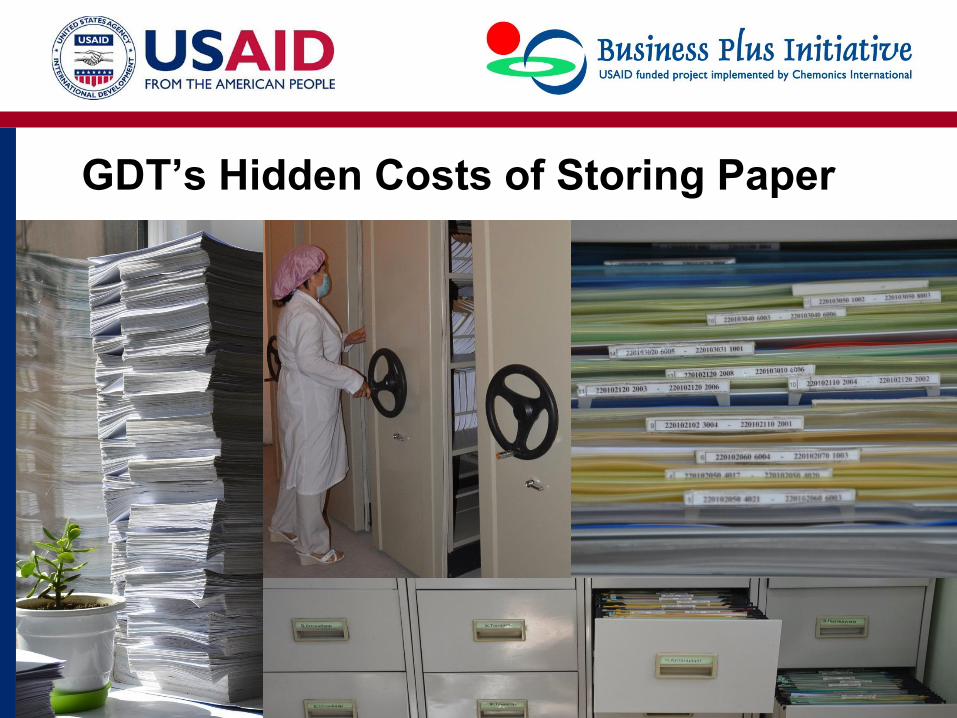
GDT’s Hidden Costs of Storing Paper

Methodology Strengths and Weaknesses
• Strengths:
– Disaggregates impact of USAID assistance on a specific
reform
– Useful order of magnitude estimate of impacts
– Helps generate political will
– Good for prioritizing
• Weaknesses:
– Too time-consuming to capture all impacts
– Relies on inaccurate, incomplete government statistics
– Some things are difficult to measure – electricity privatization
– Apples + Oranges = Fruit (Savings, transfers, fees)
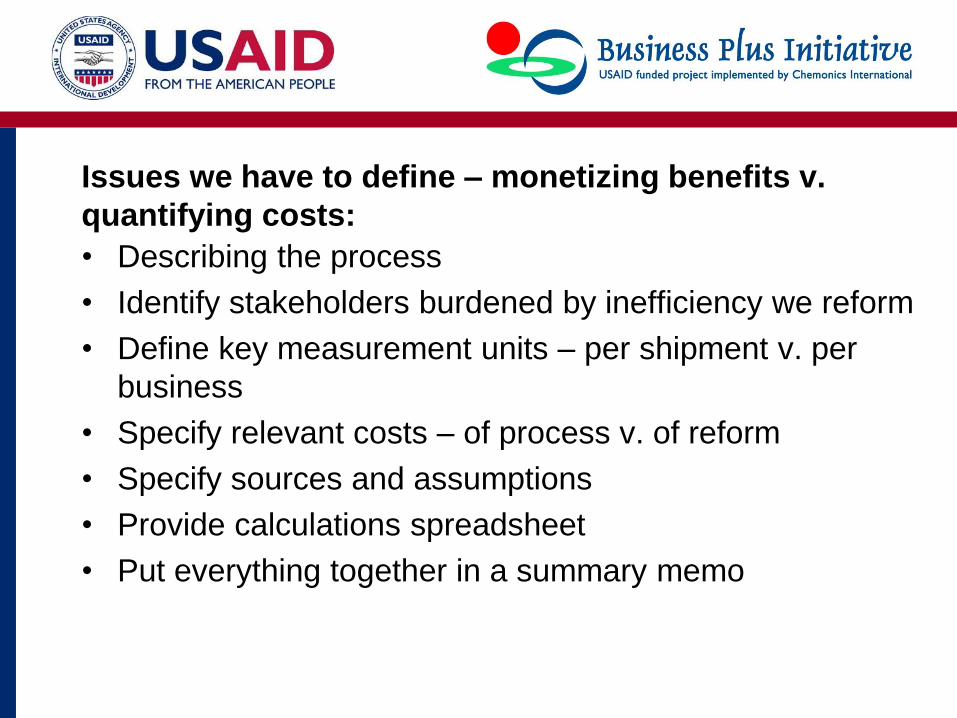
Issues we have to define – monetizing benefits v.
quantifying costs:
• Describing the process
• Identify stakeholders burdened by inefficiency we reform
• Define key measurement units – per shipment v. per
business
• Specify relevant costs – of process v. of reform
• Specify sources and assumptions
• Provide calculations spreadsheet
• Put everything together in a summary memo

Prioritizing Doing Business Reforms
Starting a business
All procedures to open a business
Total days to complete all procedures
Official fees as % of per capita income
Paid-in capital as % of per capita income
Protecting investors
Legal protections provided to minority shareholders
against related-party transactions by company
owners/managers
Dealing with construction permits
All procedures to complete standard building
Total days to complete all procedures
Official fees as % of per capita income
Paying taxes
Total number of payments/reports a year
Total time required to make payments and reports
Total tax rate as % of profits
Getting electricity
All procedures to connect a standard building
Total days to complete all procedures
Official fees as % of per capita income
Trading across borders
All procedures to import and export
Total days to complete all procedures
Official fees for all procedures
Registering property
All procedures to transfer property
Total days to complete all procedures
Official fees as % of property value
Enforcing contracts
All procedures from filing to enforcement
Total days to complete all procedures
Total costs of lawyers, court, enforcement
Getting credit
Effectiveness of legal regime for secured lending
and protecting borrowers and lenders
Availability of credit information
Resolving insolvency
The time and cost required to resolve bankruptcy

Where Georgia started:
3-day line to cross border

Lower transit costs increased Georgia’s trade
Process 2006
# Trucks
Days
Saved Cost per Day Savings
Import 42,000 1 $288 $ 12.096 million
Export 17,000 1 $288 $ 4.896 million
Transit 40,000 2 $288 $ 23.040 million
Annual Benefit
2006 $ 39.992 million
2008 +$133.367 million
Increased Trade Volume 2006-08 333 percent growth

Number of Days to Export
54
13
0
10
20
30
40
50
60
2005 Year 2006 Year
Number of days to import
52
15
0
10
20
30
40
50
60
2005 Year 2006 Year
Georgia Traders’ Reduced time to clear goods …
… Increases velocity of capital:
365 / 52 = 7 turns a year
365 / 15 = 24 turns a year

Georgia Customs Streamlining – Opportunity Costs
• 15% = average annual opportunity cost
• 0.04% = average daily opportunity cost
• Import: 37 days (52-15) X 0.04% X $2.491 billion
= $36.8 million
• Export: 41 days (54-13) X 0.04% X $866.7 million
= $14.2 million
Totals: $51 million opportunity costs
+$40 million trucking savings
=$91 million total savings

Increase in imports/exports
Exports increased by 21.6 % Imports increased by 56.8 %
$524 Million
$638 Million
$0
$100
$200
$300
$400
$500
$600
$700
In USD
Millions
Export in
January-August 2005
Export in
January-August 2006
Total Exports
$1.4
Billion
$2.25
5 Billion
$0
$500
$1,000
$1,500
$2,000
$2,500
Import in
January-August 2005
Import in
January-August 2006
Total ImportsIn USD
Millions

Now only 15 minutes at border
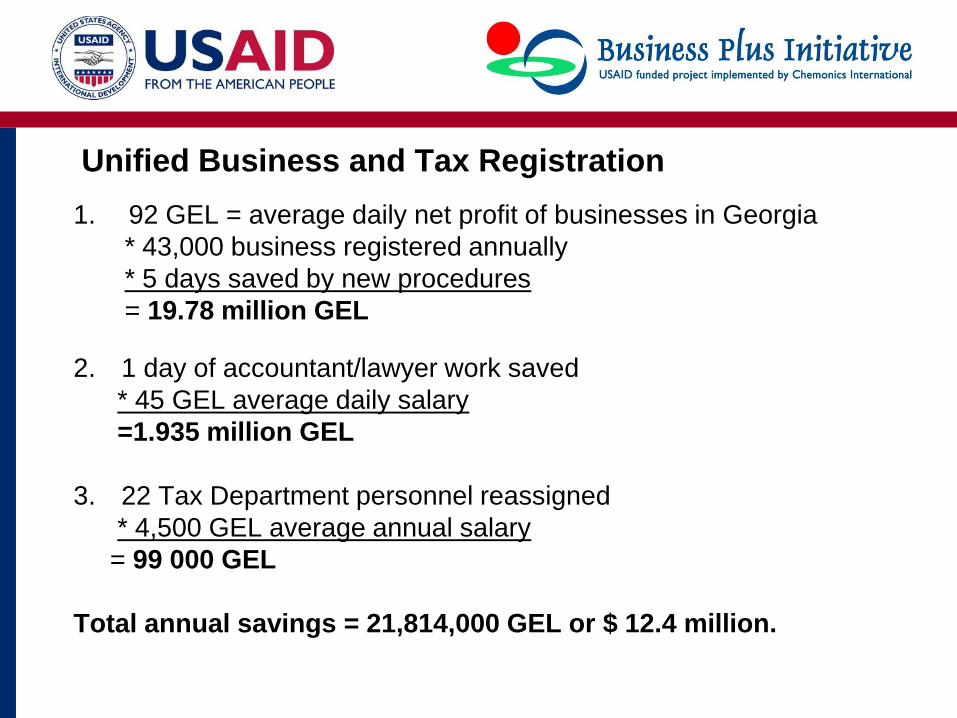
Unified Business and Tax Registration
1. 92 GEL = average daily net profit of businesses in Georgia
* 43,000 business registered annually
* 5 days saved by new procedures
= 19.78 million GEL
2. 1 day of accountant/lawyer work saved
* 45 GEL average daily salary
=1.935 million GEL
3. 22 Tax Department personnel reassigned
* 4,500 GEL average annual salary
= 99 000 GEL
Total annual savings = 21,814,000 GEL or $ 12.4 million.
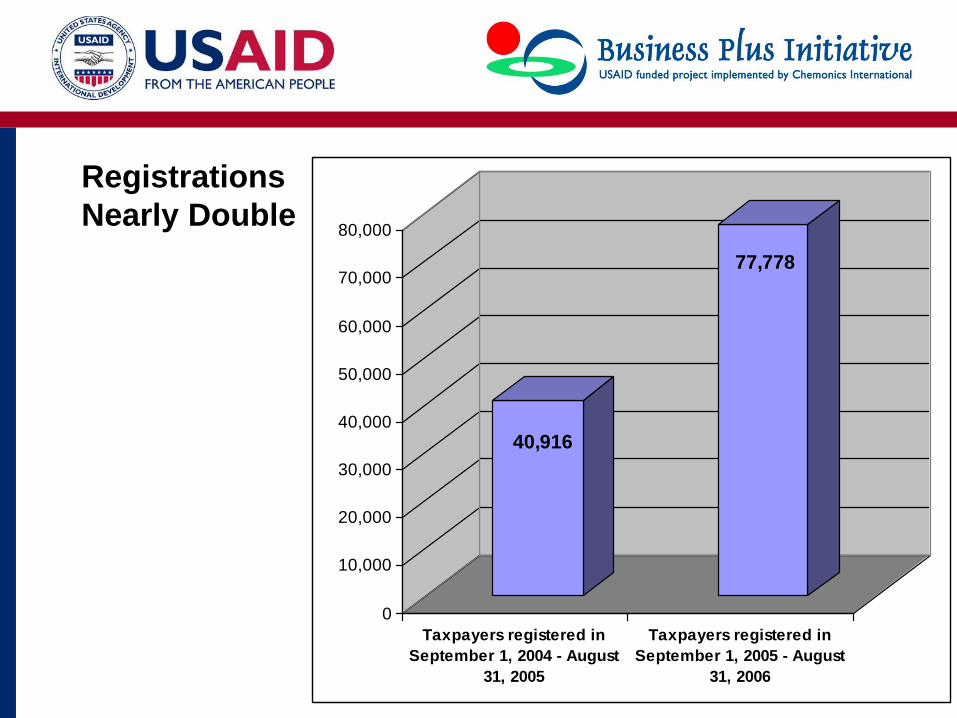
Registrations
Nearly Double
40,916
77,778
0
10,000
20,000
30,000
40,000
50,000
60,000
70,000
80,000
Taxpayers registered in
September 1, 2004 - August
31, 2005
Taxpayers registered in
September 1, 2005 - August
31, 2006

Simplified Registration of Individual Taxpayers
1. 11 GEL = average daily salary
* 78,000 annual individual registrations
* 1 day saved by new procedures
= 858,000 GEL
2. 5 GEL notary fee eliminated
* 78,000 annual individual registrations
= 390,000 GEL
3. 0.50 needed to serve each applicant
* 78,000 annual applications
* 18 GEL average Tax Department employee salary
= 88,000 GEL
Total annual savings = 1.336 million GEL or $763,500 USD.

Registrations
Increase 4X
7,114
28,077
0
5000
10000
15000
20000
25000
30000
Natural Persons registered in April, May, June (25 days) of 2006
Natural Persons registered in July, August, September (25 days) of 2006

Exhibit 14: Reductions in Payments, Time, and Costs Allocated by Reform
Reform Agency Tax Comment Payments Time Costs (billion
MNT)
Totals by Reform
Payments Time Costs
E-
Signature
GDT
VAT Eliminates filing 12
paper reports -12 -34.5 -1,8
-32 -102.6 -15,3
Corporate Income
Tax
Eliminates filing 12
paper reports -4 -22.0 -4,6
MOF Quarterly Financial
Reporting
Eliminates filing 4
paper reports -4 -24.2 -5,3
SID Social Insurance Eliminates filing 12
paper reports -12 -21.9 -3,6

Exhibit 14: Reductions in Payments, Time, and Costs Allocated by Reform
Reform Agency Tax Comment Payments Time Costs (billion
MNT)
Totals by Reform
Paymen
ts Time Costs
True E-
Filing
GDT
VAT
Reduces Payments count
from 12 to 1; Reduces time
and cost to calculate, prepare,
pay, and submit report.
-11 -86.4 -4,5
-36.0 -275.8 -43,6
Corporate
Income Tax
Reduces Payments count
from 12 to 1; Reduces time
and cost to calculate, prepare,
pay, and submit e-report.
-11 -21.0 -4,4
MOF
Quarterly
Financial
Reporting
Reduces Payments count
from 4 to 1; Reduces time
and cost to calculate, prepare,
pay, and submit e-report.
-3 -129.5 -28,3
SID Social Insurance
Reduces Payments count
from 4 to 1; Reduces time
and cost to calculate, prepare,
pay, and submit e-report.
-11 -38.9 -6,4

Exhibit 14: Reductions in Payments, Time, and Costs Allocated by Reform
Reform Agency Tax Comment Payments Time
Costs
(billion
MNT)
Totals by Reform
Payments Time Costs
Combine
Employee
Withholding
and Social
Insurance
GDT &
SID
Social Insurance +
Employee
Withholding
Combining social
insurance and employee
withholding eliminate
all burdens with one tax.
Calculations Employee
withholding eliminated
because times involved
are greater.
-24 -78.4 -13 -24 -78.4 -13
Make Vehicle
Tax Annual GDT Vehicle Tax
Switch from quarterly to
annual eliminates 3
payments -3 N/A N/A -3 N/A N/A
TOTALS BEFORE REFORM 101 592.8 93,5
SAVINGS FROM REFORMS -95 -456.8 -71,9
TOTALS AFTER REFORMS 6 136.0 21,5

Reforming Mongolia’s High Cost of Paying Taxes
Tax or Mandatory
Contribution
Payments Total Hours per Firm Total Annual Cost for All
Firms (Billion MNT)
Before
Reform
After
Reform
Before
Reform
After
Reform
Before
Reform
After
Reform
Annual
Savings
Employer paid- Social
insurance contributions 24 1 80.4 19.6 13.2 3.2 10
Value added tax (VAT) 24 1 163.1 42.2 8.5 2.2 6.3
Quarterly Financial
Reports to MOF 8 1 215.8 62.1 47.3 13.6 33.7
Corporate income tax 16 1 55.1 12.1 11.5 2.5 9.0
Employee Withholding** 24 0 78.4 0.0 13.0 0 13.0
Property Tax 1 1 N/A N/A N/A N/A N/A
Vehicle Tax 4 1 N/A N/A N/A N/A N/A
BPI Totals 101 6 592.8 136.0 93.5 21.5 72

GDT Calculates savings for CIT e-filers
• 5 hours to file paper returns (to and from office)
• X 3,405 MNT average hourly wage of an accountant MNT
(monthly 600,000 MNT) = 17,025 MNT ($13)
• + 6 km average round trip to tax office X 700 MNT taxi per km
= 4,200 MNT
• + 8 MNT per return X 8 pages each return = 64 MNT
• = 21,289 MNT ($16.25) per return
• X 4 time per year = 85,156 MNT ($65) per taxpayer per year
• X 55,331 CIT electronic filers per year
• = 4.7 billion MNT ($3.6 million) per year savings

Test Case: Paper work Cripples Mongolia Meat Exporters:
Agency Purpose Required Documents
Mongolian Taxation Agency To certify meat exporter doesn’t owe taxes - Copy of State Registration Certificate
MNCCI Certificate of Origin
- Copy of State Registration Certificate
- Copy of Sales Contract
- Invoice
- Packing list
GASI and the Central
Laboratory test results
- Copy of Certificate of Origin
- Copy of State Registration Certificate
- Copy of Sales Contract
- Application form
GASI Conformity Certificate
- Copy of State Registration Certificate
- Certification of Origin
- Test Results
- Invoice
- Application form
NARTAM & Railway Admin. CMR transport documentation - Copy of Sales Contract
- Copy of State Registration Certificate
MCGA customs clearance
- Sale of Goods Contract
- Copy of State Registration Certificate
- Conformity Certificate
- CMR
- Certification of Origin
- Taxation Certificate
- Export Certificate