2.c.5.b lead production gb2009 · • battery breaking and processing (scrap ... together with lead...
TRANSCRIPT
2.C.5.b Lead production
EMEP/EEA emission inventory guidebook 2009 1
Category Title
NFR: 2.C.5.b Lead production
SNAP: 040309b Lead production
ISIC: 2720 Manufacture of basic precious and non-ferrous metals
Version Guidebook 2009
Coordinator Jeroen Kuenen Contributing authors (including to earlier versions of this chapter) Jan Berdowski, Pieter van der Most, Chris Veldt, Jan Pieter Bloos, Jozef M. Pacyna, Otto Rentz, Dagmar Oertel, Ute Karl, Tinus Pulles and Wilfred Appelman

2.C.5.b Lead production
EMEP/EEA emission inventory guidebook 2009 2
Contents 1 Overview...................................................................................................................................3 2 Description of sources...............................................................................................................3
2.1 Process description ..............................................................................................................3 2.2 Techniques ..........................................................................................................................5 2.3 Emissions ............................................................................................................................5 2.4 Controls ...............................................................................................................................7
3 Methods.....................................................................................................................................8 3.1 Choice of method ................................................................................................................8 3.2 Tier 1 default approach........................................................................................................9 3.3 Tier 2 technology-specific approach .................................................................................11 3.4 Tier 3 emission modelling and use of facility data............................................................19
4 Data quality.............................................................................................................................21 4.1 Completeness ....................................................................................................................21 4.2 Avoiding double counting with other sectors....................................................................21 4.3 Verification........................................................................................................................21 4.4 Developing a consistent time series and recalculation ......................................................21 4.5 Uncertainty assessment .....................................................................................................22 4.6 Inventory quality assurance/quality control (QA/QC) ......................................................22 4.7 Gridding ............................................................................................................................22 4.8 Reporting and documentation............................................................................................22
5 Glossary ..................................................................................................................................22 6 References...............................................................................................................................23 7 Point of enquiry.......................................................................................................................24
2.C.5.b Lead production
EMEP/EEA emission inventory guidebook 2009 3
1 Overview This chapter presents information on atmospheric emissions during primary and secondary lead production.
The main air pollutants emitted during the production of lead are sulphur dioxide (SO2), nitrogen oxides (NOx), carbon monoxide (CO) and carbon dioxide (CO2). Since these are assumed to originate mainly from combustion activities, emissions of these pollutants are addressed in chapter 1.A.2.b. The most important process emissions are heavy metals (particularly lead) and dust.
2 Description of sources
2.1 Process description
2.1.1 Primary lead production
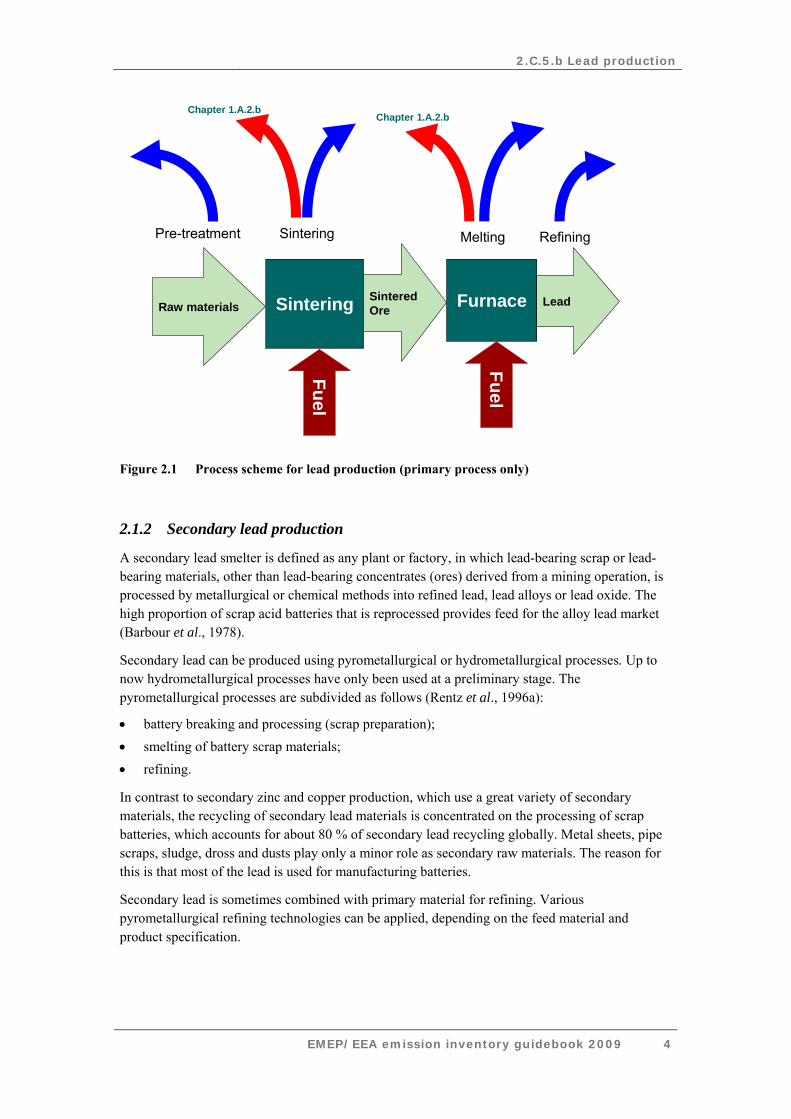
This process contains the classical steps of ore pretreatment and concentration, sintering, smelting, and product refining. Most primary lead smelters also produce other metals to a certain extent. The process route is based on sintering, reduction of sinter in a shaft furnace and refining of bullion, either pyrometallurgically or hydrometallurgically.
In the sintering process fine particles of metal ores are agglomerated into nodules, briquettes, sinter, or pellets. The sintering process is more extensively discussed in chapter 2.C.1 (Iron and Steel Production). Also a roasting process is involved in which lead sulphide is converted into lead oxide. Dust emissions result from handling and stockpiling of raw materials or intermediate products. Abatement methods are the use of bag filters, wet scrubbers or electrofilters.
In the smelting process ore, coke, and flux compounds are heated either in a shaft furnace or an electric furnace. Dust abatement can be provided by bag filters or electrofilters. Improved abatement is encapsulation or evacuation of the process.
The refining process is mainly directed at the removal of copper, silver, zinc, and bismuth. Dust emissions mainly occur at the treatment of the different by-product streams.
Several improved processes are either in the pilot stage or being used at a single plant. However, no general applicable information is available yet.
2.C.5.b Lead production
EMEP/EEA emission inventory guidebook 2009 4
SinteringRaw materialsSinteredOre Furnace Lead
RefiningMelting
Fuel
Chapter 1.A.2.b
Sintering
Fuel
Pre-treatment
Chapter 1.A.2.b
Figure 2.1 Process scheme for lead production (primary process only)
2.1.2 Secondary lead production
A secondary lead smelter is defined as any plant or factory, in which lead-bearing scrap or lead-bearing materials, other than lead-bearing concentrates (ores) derived from a mining operation, is processed by metallurgical or chemical methods into refined lead, lead alloys or lead oxide. The high proportion of scrap acid batteries that is reprocessed provides feed for the alloy lead market (Barbour et al., 1978).
Secondary lead can be produced using pyrometallurgical or hydrometallurgical processes. Up to now hydrometallurgical processes have only been used at a preliminary stage. The pyrometallurgical processes are subdivided as follows (Rentz et al., 1996a):
• battery breaking and processing (scrap preparation); • smelting of battery scrap materials; • refining.
In contrast to secondary zinc and copper production, which use a great variety of secondary materials, the recycling of secondary lead materials is concentrated on the processing of scrap batteries, which accounts for about 80 % of secondary lead recycling globally. Metal sheets, pipe scraps, sludge, dross and dusts play only a minor role as secondary raw materials. The reason for this is that most of the lead is used for manufacturing batteries.
Secondary lead is sometimes combined with primary material for refining. Various pyrometallurgical refining technologies can be applied, depending on the feed material and product specification.

2.C.5.b Lead production
EMEP/EEA emission inventory guidebook 2009 5
2.2 Techniques
2.2.1 Primary lead production
The main techniques for the smelting process are the shaft furnace and the electric furnace processes. For refining, the main techniques are pyrometallurgical refining and hydrometallurgical refining. Several direct smelting technologies have been under development or are being developed. Information about the emissions of these techniques is not yet available.
2.2.2 Secondary lead production
In general, for the production of secondary lead from battery scrap two basic process routes are possible. One route is based on breaking up and dismantling old batteries, and separating the paste, metals and organic substances. Melting and reduction is carried out afterwards in different types of furnaces with an additional refining step. The other route is characterised by the direct treatment of complete and non-dismantled batteries with or without sulphuric acid inside in various smelting furnaces, also with an additional refining step. In detail, in the various stages of pyrometallurgical processing the following technologies are used worldwide (Rentz et al., 1996a):
• Battery scrap preparation. For battery scrap preparation various processes are possible, which can be differentiated by the degree of separation of single battery components. On an industrial scale, the Penneroya process, the MA process, the Tonolli-CX, and Contibat process are used. Generally heavy metal emissions from battery scrap preparation play a minor role compared to the smelting operation. The Varta and the Bergsoe processes are smelting processes carried out without an initial separation, so that the batteries are directly smelted in a furnace.
• Smelting. For the industrial production of secondary lead, various kinds of smelting furnaces are employed. The short rotary furnace is the most extensively used furnace for smelting separated battery scrap materials, while long rotary kilns and reverberatory furnaces are only used in a few applications. In contrast to the short rotary kiln, the long rotary kiln is operated continuously. Reverberatory furnaces may also be used for smelting a lead-rich slag, which has been recovered in a primary furnace. Shaft furnaces are typically used for smelting unprepared battery scrap, together with lead cable scrap, furnace slag and filter dusts.
• Refining. The lead bullion from secondary lead production contains various impurities, mainly copper, antimony and tin, which may require elimination or adjustment by refining. Generally the operations necessary for secondary lead refining are limited compared to those necessary for primary lead refining. Pre-decopperising is not necessary and only final decopperising is carried out. In addition, a removal and adjustment of antimony and the elimination of tin may be necessary.
•
2.3 Emissions
2.3.1 Primary lead production
The main emissions during primary lead production are dust emissions.
2.C.5.b Lead production
EMEP/EEA emission inventory guidebook 2009 6
Pollutants released are sulphur oxides (SOx), NOx, volatile organic compounds (non-methane VOC and methane (CH4)), CO, CO2, and nitrous oxide (N2O). According to CORINAIR90 the main relevant pollutants is SO2.
The most relevant step with regard to SO2 emissions is the sintering process (covered by chapter 2.C.1). However, only about 7 % of the total sulphur in the ore is emitted as SO2. The remainder is captured by the slag. The concentration of this SO2 stream can vary from 1.4 to 7.2 g/m3, depending on the amount of dilution air injected to oxidise the carbon monoxide and to cool the stream before baghouse particulate removal (EPA, 1990).
Nearly 85 % of the sulphur present in the lead ore concentrate is eliminated in the sintering operation (see chapter 2.C.1). In handling process off-gases, either a single weak stream is taken from the machine hood at less than 2 % SO2, or two streams are taken, a strong stream (5–7 % SO2) from the feed end of the machine and a weak stream (less than 0.5 % SO2) from the discharge end. Single stream operation has been used if there is little or no market for recovered sulphur, so that the uncontrolled, weak SO2 stream is emitted to the atmosphere.
When sulphur removal is required, however, dual stream operation is preferred. The strong stream is sent to a sulphuric acid plant, and the weak stream is vented to the atmosphere after removal of particulate (EPA, 1990).
Sulphur oxides are also generated in blast furnaces during the smelting process from small quantities of residual lead sulphide and lead sulphates in the sinter feed. The quantity of these emissions is a function not only of the sinter’s residual sulphur content, but also of the sulphur captured by copper and other impurities in the slag (EPA, 1990).
The energy requirement for the different lead and zinc processes varies to a large extent. It depends on the quality of the feed and the products, the use of latent or waste heat and the production of by-products. Refer to the Best Available Techniques Reference (BREF) document for additional information (European Commission, 2001).
2.3.2 Secondary lead production
In the secondary lead production process various direct and fugitive heavy metal emission sources are present (Rentz et al., 1996a):
From battery scrap preparation only small amounts of particulate heavy metals are emitted as direct emissions if single preparation devices are equipped with a special waste gas cleaning facility.
For the smelting process, depending on the type of furnace various kinds of fuels are used. Generally short rotary furnaces and long rotary kilns are equipped with natural gas/air burners or sometimes with oxy-fuel burners, while shaft furnaces use coke as fuel. With the generated waste gas, irrespective of which kind of furnace is used, considerable amounts of heavy metals contained in the dust are released, as well as certain amounts of gaseous heavy metals, depending on the melting temperature and the vapour pressure.
For refining and alloying, several kettles are installed depending on the required lead quality. Because of the reactions in the waste gas from the refining and alloying kettles, various amounts of heavy metals in particulate and gaseous form may be emitted.
Fugitive emissions from secondary lead smelting are released with almost all stockpiling, transferring, charging, and discharging processes The amount and composition greatly depends

2.C.5.b Lead production
EMEP/EEA emission inventory guidebook 2009 7
on the process configuration and operation mode. Values concerning the magnitude of unabated and abated emissions have not been revealed. The smelting furnaces are connected with fugitive emissions during the charging of raw materials and the discharging of slag and lead bullion. Also the furnace openings may be an emission source. Fugitive emissions from refining operations arise mainly during charging, discharging and metal transfer operations. Refining vessels not covered with primary hoods may be a further emission source.
As in many plants, direct emission sources are preferably equipped with emission reduction measures and fugitive emissions released into ambient air in secondary lead production are generally much higher than direct emissions.
By far the most important SO2 and NOx emission source during secondary lead production is smelting furnaces. The amount of SO2 formed is mainly determined by the amount of sulphur contained in the raw materials and in the fuel used. Although a major part of the sulphur remains in the slag formed during the smelting process, a considerable share is also converted to SO2.
SO2 concentrations in the off-gas from reverberatory furnaces and blast furnaces are only available on a volume percentage basis. During tests carried out at a reverberatory furnace using natural gas as a fuel, the concentration of SO2 in the off-gas was measured at about 0.1 % v/v. At a blast furnace using coke as fuel an even smaller off-gas concentration in the range of about 0.03 % v/v was measured (Rentz et al., 1996b).
The formation of polychlorinated dioxins and furans depends on a number of factors such as scrap composition, process type and temperature.
2.4 Controls
2.4.1 Primary lead production
Dust emissions can be abated using fabric filters, wet scrubbers or electro-filters. Improvement can be achieved by using encapsulation or evacuation. New approaches are under development.
Emissions containing SO2 are often used as input for sulphuric acid plants. Here, emissions from combustion and from other process steps are reconciled. Single stage sulphuric acid plants can attain sulphur oxide levels of 5.7 g/m3, and dual stage plants can attain levels of 1.6 g/m3. Typical efficiencies of dual stage plants in removing sulphur oxides can exceed 99 %. Other technically feasible SO2 control methods are elemental sulphur recovery plants and dimethylamine and ammonia absorption processes (EPA, 1990).
2.4.2 Secondary lead production
Most secondary lead smelters are equipped with dust removing installations, such as baghouses for the control of direct emissions. The control efficiency of these installations is often very high and can reach 99.9 %. In secondary lead production for most processes it is possible to carry out final dust removal with fabric filters. In this way clean gas dust loads in general below 5 mg/m3 (STP) are achieved. For covering direct emissions from the refining and alloying kettles, primary suction hoods are arranged above the refining and melting kettles. These hoods are also linked to fabric filters. Waste gases from the furnace and the refining kettles may be dusted together in one filter. Electrostatic precipitators or wet scrubbers may be in use for special raw gas conditions. Wet scrubbers are sometimes in place for the control of SO2. Fugitive particulate emissions can be

2.C.5.b Lead production
EMEP/EEA emission inventory guidebook 2009 8
collected by local systems like hoods and other suction facilities or by partial or complete enclosures (Rentz et al., 1996a).
Primary measures for the control of SO2 aim to reduce the sulphur content in the fuel and in the raw materials used. Accordingly lower SO2 emissions occur when using natural gas instead of heavy fuel oil for short rotary, long rotary and reverberatory furnace firing. Within blast furnace operation, the use of coke with low sulphur content reduces emissions.
Oxy-fuel burners have been used in short rotary furnaces resulting in a significant reduction of the fuel input. Accordingly, a smaller pollutant mass flow is observed, although the concentration in the off-gas may be higher than in conventional firing technologies.
Significantly lower emissions occur during secondary lead production if desulphurisation of the lead paste is carried out prior to thermal treating. Within the Engitec-CX process, for example, sulphur is removed from the electrode paste by adding NaOH or Na2CO3. According to an operator, a reduction of SO2 emissions in excess of 90 % can be achieved by this means (Rentz et al., 1996b).
3 Methods
3.1 Choice of method Figure 3.1 presents the procedure to select the methods for estimating process emissions from the lead production industry. The basic idea is as follows.
• If detailed information is available: use it. • If the source category is a key category, a Tier 2 or better method must be applied and
detailed input data must be collected. The decision tree in Figure 3.1 directs the user in such cases to the Tier 2 method, since it is expected that it is more easy to obtain the necessary input data for this approach than to collect facility level data needed for a Tier 3 estimate.
• The alternative of applying a Tier 3 method, using detailed process modelling is not explicitly included in this decision tree. However, detailed modelling will always be done at the facility level and results of such modelling could be seen as ‘facility data’ in the decision tree.

2.C.5.b Lead production
EMEP/EEA emission inventory guidebook 2009 9
Start
Facility dataAvailable?
All productioncovered
Use Tier 3Facility data
only
Technology Stratificationavailable?
Use Tier 2technology specific
activity data and EFs
Key source?
Get technology stratified
activity data and EFs
Apply Tier 1default EFs
Yes Yes
Yes
Yes
No
No
No
No
Use Tier 3Facility data &extrapolation
Figure 3.1 Decision tree for source category 2.C.5.b Lead production
3.2 Tier 1 default approach
3.2.1 Algorithm The Tier 1 approach for process emissions from lead production uses the general equation:
pollutantproductionpollutant EFARE ×= (1)
Where:
Epollutant = the emission of the specified pollutant
ARproduction = the activity rate for the lead production
EFpollutant = the emission factor for this pollutant
This equation is applied at the national level, using annual national total lead production. Information on the production of lead, suitable for estimating emissions using the simpler estimation methodology (Tier 1 and 2), is widely available from United Nations statistical yearbooks or national statistics.
Tier 1 emission factors assume an ‘averaged’ or typical technology and abatement implementation in the country and integrate all sub-processes in lead production from inputting the raw material to the final shipment off the facilities.

2.C.5.b Lead production
EMEP/EEA emission inventory guidebook 2009 10
In cases where specific abatement options are to be taken into account, a Tier 1 method is not applicable and a Tier 2 or Tier 3 approach must be used.
3.2.2 Default emission factors
The Tier 1 approach needs emission factors for all relevant pollutants, which integrate all sub-processes within the industry from inputting raw materials to the final shipment of the products off site. The default emission factors given in Table 3.1 have been derived from all available data and information. Particulate emission factors are from the Coordinated European Particulate Matter Emission Inventory Programme (CEPMEIP) study (Visschedijk et al., 2004) and are applicable to the least abated lead production plants (older plant; limited control of fugitive sources). In contrast to copper and zinc production, the share of secondary lead in the total lead production is much higher. For deriving the Tier 1 default emission factors, it has been assumed that 40 % of all lead production is primary lead production and 60 % is secondary lead production (Kakareka, 2008). However, this figure may vary significantly between countries.
Emission factors in BREF documents are mostly given in ranges. Where these emission factors are used in the tables below, the range is interpreted at the 95 % confidence interval, while the geometric mean of this range is chosen as the value for the emission factor.
Emissions of NOx, SOx and CO are assumed to originate mainly from combustion and are discussed in chapter 1.A.2.b. All other emissions are assumed to originate primarily from the process and are therefore discussed in the present chapter.
Table 3.1 Tier 1 emission factors for source category 2.C.5.b Lead production
CodeNFR Source Category 2.C.5.bFuelNot applicable
Not estimated
Lower UpperTSP 500 g/Mg lead 170 1500 Visschedijk et al. (2004)PM10 400 g/Mg lead 130 1200 Visschedijk et al. (2004)PM2.5 200 g/Mg lead 67 600 Visschedijk et al. (2004)Pb 260 g/Mg lead 93 360 Theloke et al. (2008)Cd 0.69 g/Mg lead 0.46 1.8 Theloke et al. (2008)Hg 0.37 g/Mg lead 0.3 0.44 Theloke et al. (2008)As 2.1 g/Mg lead 1.3 3.1 Theloke et al. (2008)Zn 70 g/Mg lead 40 120 European Commission (2001)PCB 1.9 g/Mg lead 0.66 5.8 Theloke et al. (2008)PCDD/F 5 μg I-TEQ/Mg lead 0.38 49 UNEP (2005)
Reference
NA
Tier 1 default emission factorsName
Pollutant
Lead production
Aldrin, Chlordane, Chlordecone, Dieldrin, Endrin, Heptachlor, Heptabromo-biphenyl, Mirex, Toxaphene, HCH, DDT, PCP, SCCPNOx, CO, NMVOC, SOx, NH3, Cr, Cu, Ni, Se, Benzo(a)pyrene, Benzo(b)fluoranthene, Benzo(k)fluoranthene, Indeno(1,2,3-cd)pyrene, Total 4 PAHs, HCB
Value Unit 95% confidence interval
3.2.3 Activity data
Information on the production of lead, suitable for estimating emissions using the simpler estimation methodology (Tier 1 and 2), is widely available from United Nations statistical yearbooks or national statistics.
Further guidance is provided in the 2006 IPCC Guidelines for National Greenhouse Gas Inventories, volume 3 on Industrial Processes and Product Use (IPPU), chapter 4.6.2.3 ‘Choice of activity data’ (IPCC, 2006).

2.C.5.b Lead production
EMEP/EEA emission inventory guidebook 2009 11
3.3 Tier 2 technology-specific approach
3.3.1 Algorithm
The Tier 2 approach is similar to the Tier 1 approach. To apply the Tier 2 approach, both the activity data and the emission factors need to be stratified according to the different techniques that may occur in the country.
The Tier 2 approach is as follows:
Stratify the lead production in the country to model the different product and process types occurring in the national lead industry into the inventory by:
• defining the production using each of the separate product and/or process types (together called ‘technologies’ in the formulae below) separately; and
• applying technology specific emission factors for each process type:
∑ ×=estechnologi
,pollutanttechnologytechnologyproductionpollutant EFARE , (2)
where:
ARproduction,technology = the production rate within the source category, using this specific technology
EFtechnology,pollutant = the emission factor for this technology and this pollutant
A country where only one technology is implemented will result in a penetration factor of 100 % and the algorithm reduces to:
,pollutanttechnologyproductionpollutant EFARE ×= (3)
where:
Epollutant = the emission of the specified pollutant
ARproduction = the activity rate for the lead production
EFpollutant = the emission factor for this pollutant
The emission factors in this approach will include all sub-processes within the industry from inputting raw materials until the produced lead is shipped to the customers.
3.3.2 Technology-specific emission factors
This subsection provides technology-specific emission factors for primary and secondary lead production. Typical technologies represent typical emission factors for both primary and secondary lead production, while specific technology tables include abatement and regional aspects. Information on abatement of heavy metals is available from Theloke et al. (2008). However, no data are available on the abatement of particulates in those particular situations and the typical emission factors for PM are presented in these tables. Since in reality PM and heavy metal emissions will be correlated, inconsistencies between the tables do exist and these emission factors should be handled with care.
Additionally, it must be mentioned that emission factors from various sources have been combined to derive the set of emission factors for each technology and control technology. These

2.C.5.b Lead production
EMEP/EEA emission inventory guidebook 2009 12
data are not always consistent with each other, for instance when the BAT emission factor is higher than an emission factor which is not BAT. This is another reason why the selection of appropriate emission factors from the present subsection must be undertaken with care.
As for the Tier 1 approach, emissions of NOx, SOx and CO are assumed to originate mainly from combustion and are discussed in chapter 1.A.2.b. All other emissions are assumed to originate primarily from the process and are therefore discussed in the present chapter.
Region-specific emission factors are available for Eastern Europe, Caucasus and Central Asia (EECCA) countries from Kakareka (2008).
3.3.2.1 Primary lead production
Typical abatement
Table 3.2 Tier 2 emission factors for source category 2.C.5.b Lead production, primary lead production
CodeNFR Source Category 2.C.5.bFuelSNAP (if applicable) 040309bTechnologies/PracticesRegion or regional conditionsAbatement technologiesNot applicable
Not estimated
Lower UpperTSP 500 g/Mg lead 170 1500 Visschedijk et al. (2004)PM10 400 g/Mg lead 130 1200 Visschedijk et al. (2004)PM2.5 200 g/Mg lead 67 600 Visschedijk et al. (2004)Pb 13 g/Mg lead 8.4 17 Theloke et al. (2008)Cd 0.067 g/Mg lead 0.05 0.1 Theloke et al. (2008)Hg 0.93 g/Mg lead 0.74 1.1 Theloke et al. (2008)As 0.015 g/Mg lead 0.005 0.02 Theloke et al. (2008)PCDD/F 0.5 μg I-TEQ/Mg lead 0.2 2 UNEP (2005)
Tier 2 emission factorsNameLead production
NALead production
Primary lead production
Aldrin, Chlordane, Chlordecone, Dieldrin, Endrin, Heptachlor, Heptabromo-biphenyl, Mirex, Toxaphene, HCH, DDT, PCB, PCP, SCCPNOx, CO, NMVOC, SOx, NH3, Cr, Cu, Ni, Se, Zn, Benzo(a)pyrene, Benzo(b)fluoranthene, Benzo(k)fluoranthene, Indeno(1,2,3-cd)pyrene, Total 4 PAHs, HCB
Pollutant Value Unit 95% confidence interval Reference

2.C.5.b Lead production
EMEP/EEA emission inventory guidebook 2009 13
BAT production technology
Table 3.3 Tier 2 emission factors for source category 2.C.5.b Lead production, primary lead production with BAT technologies
CodeNFR Source Category 2.C.5.bFuelSNAP (if applicable) 040309bTechnologies/PracticesRegion or regional conditionsAbatement technologiesNot applicable
Not estimated
Lower UpperTSP 29 g/Mg lead 9.7 87 Visschedijk et al. (2004)PM10 28 g/Mg lead 9.3 84 Visschedijk et al. (2004)PM2.5 20 g/Mg lead 6.7 60 Visschedijk et al. (2004)Pb 140 g/Mg lead 47 420 Theloke et al. (2008)Cd 0.72 g/Mg lead 0.24 2.2 Theloke et al. (2008)Hg 1 g/Mg lead 0.33 3 Theloke et al. (2008)As 0.16 g/Mg lead 0.053 0.48 Theloke et al. (2008)Cr 2.3 g/Mg lead 0.77 6.9 Theloke et al. (2008)PCDD/F 0.5 μg I-TEQ/Mg lead 0.2 2 UNEP (2005)
Tier 2 emission factorsNameLead production
NALead production
Primary lead production
BAT production technologiesAldrin, Chlordane, Chlordecone, Dieldrin, Endrin, Heptachlor, Heptabromo-biphenyl, Mirex, Toxaphene, HCH, DDT, PCB, PCP, SCCPNOx, CO, NMVOC, SOx, NH3, Cu, Ni, Se, Zn, Benzo(a)pyrene, Benzo(b)fluoranthene, Benzo(k)fluoranthene, Indeno(1,2,3-cd)pyrene, Total 4 PAHs, HCB
Pollutant Value Unit 95% confidence interval Reference
Electrostatic precipitator
Table 3.4 Tier 2 emission factors for source category 2.C.5.b Lead production, primary lead production with electrostatic precipitator
CodeNFR Source Category 2.C.5.bFuelSNAP (if applicable) 040309bTechnologies/PracticesRegion or regional conditionsAbatement technologiesNot applicable
Not estimated
Lower UpperTSP 29 g/Mg lead 9.7 87 Visschedijk et al. (2004)PM10 28 g/Mg lead 9.3 84 Visschedijk et al. (2004)PM2.5 20 g/Mg lead 6.7 60 Visschedijk et al. (2004)Pb 23 g/Mg lead 7.7 69 Theloke et al. (2008)Cd 0.12 g/Mg lead 0.04 0.36 Theloke et al. (2008)Hg 0.95 g/Mg lead 0.32 2.9 Theloke et al. (2008)As 0.028 g/Mg lead 0.018 0.037 Theloke et al. (2008)Cr 0.4 g/Mg lead 0.13 1.2 Theloke et al. (2008)PCDD/F 0.5 μg I-TEQ/Mg lead 0.2 2 UNEP (2005)
dry ESPAldrin, Chlordane, Chlordecone, Dieldrin, Endrin, Heptachlor, Heptabromo-biphenyl, Mirex, Toxaphene, HCH, DDT, PCB, PCP, SCCPNOx, CO, NMVOC, SOx, NH3, Cu, Ni, Se, Zn, Benzo(a)pyrene, Benzo(b)fluoranthene, Benzo(k)fluoranthene, Indeno(1,2,3-cd)pyrene, Total 4 PAHs, HCB
Pollutant Value Unit 95% confidence interval Reference
NALead production
Primary lead production
Tier 2 emission factorsNameLead production

2.C.5.b Lead production
EMEP/EEA emission inventory guidebook 2009 14
Fabric filters, state of the art
Table 3.5 Tier 2 emission factors for source category 2.C.5.b Lead production, primary lead production with fabric filters
CodeNFR Source Category 2.C.5.bFuelSNAP (if applicable) 040309bTechnologies/PracticesRegion or regional conditionsAbatement technologiesNot applicable
Not estimated
Lower UpperTSP 29 g/Mg lead 9.7 87 Visschedijk et al. (2004)PM10 28 g/Mg lead 9.3 84 Visschedijk et al. (2004)PM2.5 20 g/Mg lead 6.7 60 Visschedijk et al. (2004)Pb 0.015 g/Mg lead 0.005 0.045 Theloke et al. (2008)Cd 0.00008 g/Mg lead 0.000027 0.00024 Theloke et al. (2008)Hg 0.9 g/Mg lead 0.3 2.7 Theloke et al. (2008)As 0.000018 g/Mg lead 0.000006 0.000054 Theloke et al. (2008)Cr 0.00026 g/Mg lead 0.000087 0.00078 Theloke et al. (2008)PCDD/F 0.5 μg I-TEQ/Mg lead 0.2 2 UNEP (2005)
FF state-of-the-art.Aldrin, Chlordane, Chlordecone, Dieldrin, Endrin, Heptachlor, Heptabromo-biphenyl, Mirex, Toxaphene, HCH, DDT, PCB, PCP, SCCPNOx, CO, NMVOC, SOx, NH3, Cu, Ni, Se, Zn, Benzo(a)pyrene, Benzo(b)fluoranthene, Benzo(k)fluoranthene, Indeno(1,2,3-cd)pyrene, Total 4 PAHs, HCB
Pollutant Value Unit 95% confidence interval Reference
NALead production
Primary lead production
Tier 2 emission factorsNameLead production
Virgin activated carbon injection, fabric filters and flue gas desulphurisation
Table 3.6 Tier 2 emission factors for source category 2.C.5.b Lead production, primary lead production with abatement
CodeNFR Source Category 2.C.5.bFuelSNAP (if applicable) 040309bTechnologies/PracticesRegion or regional conditionsAbatement technologiesNot applicable
Not estimated
Lower UpperTSP 29 g/Mg lead 9.7 87 Visschedijk et al. (2004)PM10 28 g/Mg lead 9.3 84 Visschedijk et al. (2004)PM2.5 20 g/Mg lead 6.7 60 Visschedijk et al. (2004)Pb 0.015 g/Mg lead 0.005 0.045 Theloke et al. (2008)Cd 0.00008 g/Mg lead 0.0000267 0.00024 Theloke et al. (2008)Hg 0.1 g/Mg lead 0.0333 0.3 Theloke et al. (2008)As 0.000018 g/Mg lead 0.000006 0.000054 Theloke et al. (2008)Cr 0.00026 g/Mg lead 0.0000867 0.00078 Theloke et al. (2008)PCDD/F 0.5 μg I-TEQ/Mg lead 0.2 2 UNEP (2005)
virgin activated carbon injection (SIC)+FF+FGDAldrin, Chlordane, Chlordecone, Dieldrin, Endrin, Heptachlor, Heptabromo-biphenyl, Mirex, Toxaphene, HCH, DDT, PCB, PCP, SCCPNOx, CO, NMVOC, SOx, NH3, Cu, Ni, Se, Zn, Benzo(a)pyrene, Benzo(b)fluoranthene, Benzo(k)fluoranthene, Indeno(1,2,3-cd)pyrene, Total 4 PAHs, HCB
Pollutant Value Unit 95% confidence interval Reference
NALead production
Primary lead production
Tier 2 emission factorsNameLead production

2.C.5.b Lead production
EMEP/EEA emission inventory guidebook 2009 15
Specific emission factors for EECCA countries
Table 3.7 Tier 2 emission factors for source category 2.C.5.b Lead production, primary lead production with limited abatement, EECCA countries
CodeNFR Source Category 2.C.5.bFuelSNAP (if applicable) 040309bTechnologies/PracticesRegion or regional conditionsAbatement technologiesNot applicable
Not estimated
Lower UpperTSP 2.5 kg/Mg lead 0.8 7.5 Kakareka (2008)PM10 2 kg/Mg lead 0.7 6 Kakareka (2008)PM2.5 1.6 kg/Mg lead 0.53 4.8 Kakareka (2008)Pb 1500 g/Mg lead 900 2100 Kakareka (2008)Cd 50 g/Mg lead 30 70 Kakareka (2008)Hg 3 g/Mg lead 1.8 4.2 Kakareka (2008)As 15 g/Mg lead 9 21 Kakareka (2008)Cu 25 g/Mg lead 15 35 Kakareka (2008)Zn 150 g/Mg lead 90 210 Kakareka (2008)PCDD/F 0.5 μg I-TEQ/Mg lead 0.2 2 UNEP (2005)
Tier 2 emission factorsNameLead production
NALead production
Primary lead production, traditional methodEECCA countriesESP, limited controlAldrin, Chlordane, Chlordecone, Dieldrin, Endrin, Heptachlor, Heptabromo-biphenyl, Mirex, Toxaphene, HCH, DDT, PCB, PCP, SCCPNOx, CO, NMVOC, SOx, NH3, Cr, Ni, Se, Benzo(a)pyrene, Benzo(b)fluoranthene, Benzo(k)fluoranthene, Indeno(1,2,3-cd)pyrene, Total 4 PAHs, HCB
Pollutant Value Unit 95% confidence interval Reference
Table 3.8 Tier 2 emission factors for source category 2.C.5.b Lead production, primary lead production with ESP abatement, EECCA countries
CodeNFR Source Category 2.C.5.bFuelSNAP (if applicable) 040309bTechnologies/PracticesRegion or regional conditionsAbatement technologiesNot applicable
Not estimated
Lower UpperTSP 0.5 kg/Mg lead 0.2 1.5 Kakareka (2008)PM10 0.4 kg/Mg lead 0.1 1.2 Kakareka (2008)PM2.5 0.3 kg/Mg lead 0.1 1 Kakareka (2008)Pb 200 g/Mg lead 120 280 Kakareka (2008)Cd 5 g/Mg lead 3 7 Kakareka (2008)Hg 1 g/Mg lead 0.6 1.4 Kakareka (2008)As 1 g/Mg lead 0.6 1.4 Kakareka (2008)Cu 5 g/Mg lead 3 7 Kakareka (2008)Zn 20 g/Mg lead 12 28 Kakareka (2008)PCDD/F 0.5 μg I-TEQ/Mg lead 0.2 2 UNEP (2005)
Tier 2 emission factorsNameLead production
NALead production
Primary lead production, traditional methodEECCA countriesESP, >99% efficiencyAldrin, Chlordane, Chlordecone, Dieldrin, Endrin, Heptachlor, Heptabromo-biphenyl, Mirex, Toxaphene, HCH, DDT, PCB, PCP, SCCPNOx, CO, NMVOC, SOx, NH3, Cr, Ni, Se, Benzo(a)pyrene, Benzo(b)fluoranthene, Benzo(k)fluoranthene, Indeno(1,2,3-cd)pyrene, Total 4 PAHs, HCB
Pollutant Value Unit 95% confidence interval Reference

2.C.5.b Lead production
EMEP/EEA emission inventory guidebook 2009 16
3.3.2.2 Secondary lead production
Typical abatement
Table 3.9 Tier 2 emission factors for source category 2.C.5.b Lead production, secondary lead production
CodeNFR Source Category 2.C.5.bFuelSNAP (if applicable) 040309bTechnologies/PracticesRegion or regional conditionsAbatement technologiesNot applicable
Not estimated
Lower UpperTSP 500 g/Mg lead 170 1500 Visschedijk et al. (2004)PM10 400 g/Mg lead 130 1200 Visschedijk et al. (2004)PM2.5 200 g/Mg lead 67 600 Visschedijk et al. (2004)Pb 430 g/Mg lead 150 590 Theloke et al. (2008)Cd 1.1 g/Mg lead 0.73 2.9 Theloke et al. (2008)As 3.5 g/Mg lead 2.2 5.1 Theloke et al. (2008)PCB 3.2 g/Mg lead 1.1 9.6 Theloke et al. (2008)PCDD/F 8 μg I-TEQ/Mg lead 0.5 80 UNEP (2005)
Aldrin, Chlordane, Chlordecone, Dieldrin, Endrin, Heptachlor, Heptabromo-biphenyl, Mirex, Toxaphene, HCH, DDT, PCP, SCCPNOx, CO, NMVOC, SOx, NH3, Hg, Cr, Cu, Ni, Se, Zn, Benzo(a)pyrene, Benzo(b)fluoranthene, Benzo(k)fluoranthene, Indeno(1,2,3-cd)pyrene, Total 4 PAHs, HCB
Pollutant Value Unit 95% confidence interval Reference
NALead production
Secondary lead production
Tier 2 emission factorsNameLead production
BAT production technology
Table 3.10 Tier 2 emission factors for source category 2.C.5.b Lead production, secondary lead production with BAT technologies
CodeNFR Source Category 2.C.5.bFuelSNAP (if applicable) 040309bTechnologies/PracticesRegion or regional conditionsAbatement technologiesNot applicable
Not estimated
Lower UpperTSP 29 g/Mg lead 9.7 87 Visschedijk et al. (2004)PM10 28 g/Mg lead 9.3 84 Visschedijk et al. (2004)PM2.5 20 g/Mg lead 6.7 60 Visschedijk et al. (2004)Pb 5200 g/Mg lead 1730 15600 Theloke et al. (2008)Cd 13 g/Mg lead 4.33 39 Theloke et al. (2008)As 42 g/Mg lead 14 126 Theloke et al. (2008)Cr 2.3 g/Mg lead 0.767 6.9 Theloke et al. (2008)PCB 0.0031 g/Mg lead 0.00103 0.0093 Theloke et al. (2008)PCDD/F 8 μg I-TEQ/Mg lead 0.5 80 UNEP (2005)
BAT production technologiesAldrin, Chlordane, Chlordecone, Dieldrin, Endrin, Heptachlor, Heptabromo-biphenyl, Mirex, Toxaphene, HCH, DDT, PCP, SCCPNOx, CO, NMVOC, SOx, NH3, Hg, Cu, Ni, Se, Zn, Benzo(a)pyrene, Benzo(b)fluoranthene, Benzo(k)fluoranthene, Indeno(1,2,3-cd)pyrene, Total 4 PAHs, HCB
Pollutant Value Unit 95% confidence interval Reference
NALead production
Secondary lead production
Tier 2 emission factorsNameLead production
2.C.5.b Lead production
EMEP/EEA emission inventory guidebook 2009 17
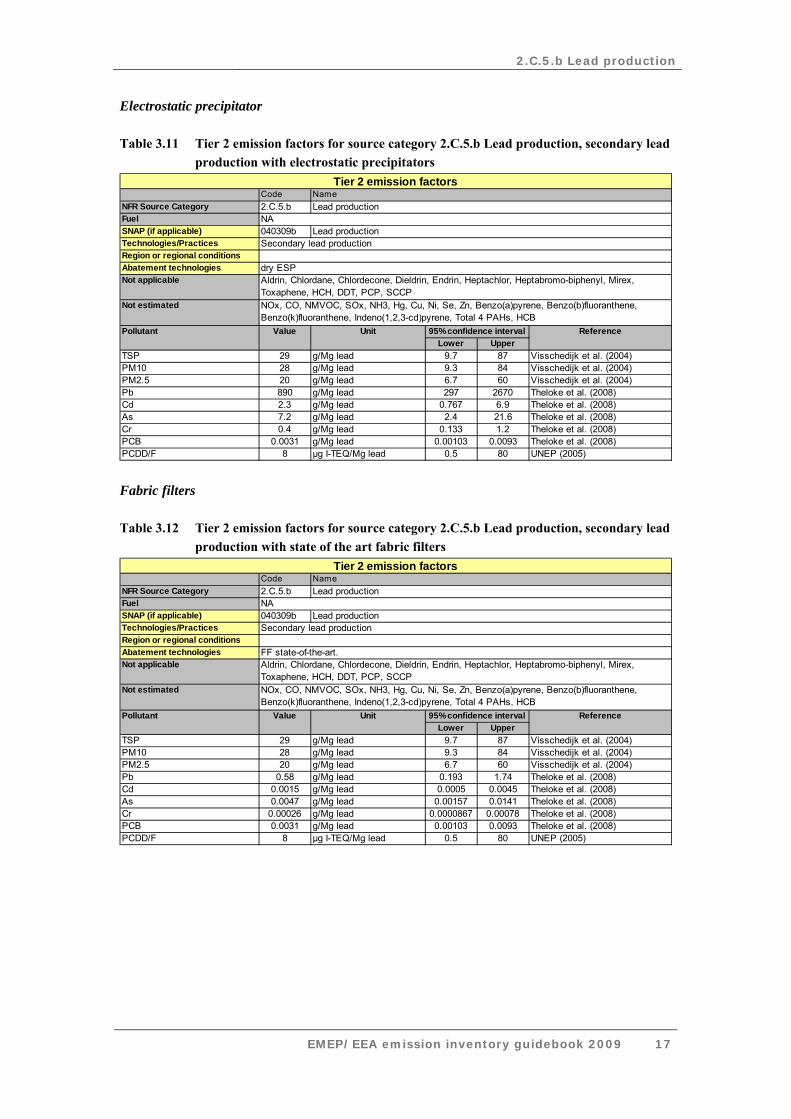
Electrostatic precipitator
Table 3.11 Tier 2 emission factors for source category 2.C.5.b Lead production, secondary lead production with electrostatic precipitators
CodeNFR Source Category 2.C.5.bFuelSNAP (if applicable) 040309bTechnologies/PracticesRegion or regional conditionsAbatement technologiesNot applicable
Not estimated
Lower UpperTSP 29 g/Mg lead 9.7 87 Visschedijk et al. (2004)PM10 28 g/Mg lead 9.3 84 Visschedijk et al. (2004)PM2.5 20 g/Mg lead 6.7 60 Visschedijk et al. (2004)Pb 890 g/Mg lead 297 2670 Theloke et al. (2008)Cd 2.3 g/Mg lead 0.767 6.9 Theloke et al. (2008)As 7.2 g/Mg lead 2.4 21.6 Theloke et al. (2008)Cr 0.4 g/Mg lead 0.133 1.2 Theloke et al. (2008)PCB 0.0031 g/Mg lead 0.00103 0.0093 Theloke et al. (2008)PCDD/F 8 μg I-TEQ/Mg lead 0.5 80 UNEP (2005)
dry ESPAldrin, Chlordane, Chlordecone, Dieldrin, Endrin, Heptachlor, Heptabromo-biphenyl, Mirex, Toxaphene, HCH, DDT, PCP, SCCPNOx, CO, NMVOC, SOx, NH3, Hg, Cu, Ni, Se, Zn, Benzo(a)pyrene, Benzo(b)fluoranthene, Benzo(k)fluoranthene, Indeno(1,2,3-cd)pyrene, Total 4 PAHs, HCB
Pollutant Value Unit 95% confidence interval Reference
NALead production
Secondary lead production
Tier 2 emission factorsNameLead production
Fabric filters
Table 3.12 Tier 2 emission factors for source category 2.C.5.b Lead production, secondary lead production with state of the art fabric filters
CodeNFR Source Category 2.C.5.bFuelSNAP (if applicable) 040309bTechnologies/PracticesRegion or regional conditionsAbatement technologiesNot applicable
Not estimated
Lower UpperTSP 29 g/Mg lead 9.7 87 Visschedijk et al. (2004)PM10 28 g/Mg lead 9.3 84 Visschedijk et al. (2004)PM2.5 20 g/Mg lead 6.7 60 Visschedijk et al. (2004)Pb 0.58 g/Mg lead 0.193 1.74 Theloke et al. (2008)Cd 0.0015 g/Mg lead 0.0005 0.0045 Theloke et al. (2008)As 0.0047 g/Mg lead 0.00157 0.0141 Theloke et al. (2008)Cr 0.00026 g/Mg lead 0.0000867 0.00078 Theloke et al. (2008)PCB 0.0031 g/Mg lead 0.00103 0.0093 Theloke et al. (2008)PCDD/F 8 μg I-TEQ/Mg lead 0.5 80 UNEP (2005)
FF state-of-the-art.Aldrin, Chlordane, Chlordecone, Dieldrin, Endrin, Heptachlor, Heptabromo-biphenyl, Mirex, Toxaphene, HCH, DDT, PCP, SCCPNOx, CO, NMVOC, SOx, NH3, Hg, Cu, Ni, Se, Zn, Benzo(a)pyrene, Benzo(b)fluoranthene, Benzo(k)fluoranthene, Indeno(1,2,3-cd)pyrene, Total 4 PAHs, HCB
Pollutant Value Unit 95% confidence interval Reference
NALead production
Secondary lead production
Tier 2 emission factorsNameLead production

2.C.5.b Lead production
EMEP/EEA emission inventory guidebook 2009 18
Specific emission factors for EECCA countries
Table 3.13 Tier 2 emission factors for source category 2.C.5.b Lead production, secondary lead production, EECCA countries
CodeNFR Source Category 2.C.5.bFuelSNAP (if applicable) 040309bTechnologies/PracticesRegion or regional conditionsAbatement technologiesNot applicable
Not estimated
Lower UpperTSP 1.5 kg/Mg lead 0.5 4.5 Kakareka (2008)PM10 1.2 kg/Mg lead 0.4 3.6 Kakareka (2008)PM2.5 1 kg/Mg lead 0.32 29 Kakareka (2008)Pb 750 g/Mg lead 450 1100 Kakareka (2008)Cd 25 g/Mg lead 15 35 Kakareka (2008)Hg 1 g/Mg lead 0.6 1.4 Kakareka (2008)As 10 g/Mg lead 6 14 Kakareka (2008)Cu 15 g/Mg lead 9 21 Kakareka (2008)Zn 100 g/Mg lead 60 140 Kakareka (2008)PCDD/F 20 μg I-TEQ/Mg lead 12 28 Kakareka (2008)
Tier 2 emission factorsNameLead production
NALead production
Secondary lead production, traditional methodEECCA countriesESP, limited controlAldrin, Chlordane, Chlordecone, Dieldrin, Endrin, Heptachlor, Heptabromo-biphenyl, Mirex, Toxaphene, HCH, DDT, PCB, PCP, SCCPNOx, CO, NMVOC, SOx, NH3, Cr, Ni, Se, Benzo(a)pyrene, Benzo(b)fluoranthene, Benzo(k)fluoranthene, Indeno(1,2,3-cd)pyrene, Total 4 PAHs, HCB
Pollutant Value Unit 95% confidence interval Reference
3.3.3 Abatement
A number of add-on technologies exist that are aimed at reducing the emissions of specific pollutants. The resulting emission can be calculated by replacing the technology specific emission factor with an abated emission factor as given in the formula:
unabatedtechnologyabatementabatedtechnology EFEF ,, ×=η (4)
where:
EF technology, abated = the emission factor after implementation of the abatement
η abatement = the abatement efficiency
EF technology, unabated = the emission factor before implementation of the abatement
This subsection presents default abatement efficiencies for particulates. Abatement efficiencies for particulates are presented in Table 3.14. These efficiencies are related to the older plant technology, using the CEPMEIP emission factors (Visschedijk et al., 2004). These abatement efficiencies are used to estimate the particulate emission factors in the Tier 2 tables above.

2.C.5.b Lead production
EMEP/EEA emission inventory guidebook 2009 19
Table 3.14 Abatement efficiencies (ηabatement) for source category 2.C.5.b Lead production for particulate matter
CodeNFR Source Category 2.C.5.bFuel NASNAP (if applicable) 040309b
Efficiency
Default Value
Lower Upper
particle > 10 μm 98.8% 96.4% 99.6% Visschedijk et al. (2004)10 μm > particle > 2.5 μm 96.2% 88.6% 98.7% Visschedijk et al. (2004)
2.5 μm > particle 90.0% 70.0% 96.7% Visschedijk et al. (2004)particle > 10 μm 95.0% 80.0% 98.8% Visschedijk et al. (2004)
10 μm > particle > 2.5 μm 86.7% 46.7% 96.7% Visschedijk et al. (2004)2.5 μm > particle 66.7% 0.0% 91.7% Visschedijk et al. (2004)
Conventional installation: ESP, settlers, scrubbers; moderate control of fugive sources
Modern plant (BAT): fabric filters for most emission sources
ReferenceLead production
Abatement technology Particle size 95% confidence interval
Tier 2 Abatement efficiencies
Lead productionnot applicable
Name
3.3.4 Activity data
Information on the production of lead, suitable for estimating emissions using the simpler estimation methodology (Tier 1 and 2), is widely available from United Nations statistical yearbooks or national statistics. This information is satisfactory to estimate emissions with the use of the simpler estimation methodology.
For a Tier 2 approach these data need to be stratified according to technologies applied. Typical sources for this data might be industrial branch organisations within the country or specific questionnaires submitted to the individual lead works.
Further guidance is provided in the 2006 IPCC Guidelines for National Greenhouse Gas Inventories, volume 3 on Industrial Processes and Product Use (IPPU), chapter 4.6.2.3 ‘Choice of activity statistics’ (IPCC, 2006).
3.4 Tier 3 emission modelling and use of facility data
3.4.1 Algorithm
There are two different emission estimation methods that go beyond the technology-specific approach described above:
• detailed modelling of the lead production process;
• facility-level emission reports.
3.4.1.1 Detailed process modelling
A Tier 3 emission estimate, using process details will make separate estimates for the consecutive steps in the production process of lead.
3.4.1.2 Facility-level data
Where facility-level emission data of sufficient quality (see the guidance chapter on QA/QC in Part A of the Guidebook) are available, it is good practice to use these data. There are two possibilities:

2.C.5.b Lead production
EMEP/EEA emission inventory guidebook 2009 20
• facility reports cover all lead production in the country; • facility-level emission reports are not available for all lead plants in the country.
If facility level data are covering all lead production in the country, it is good practice to compare the implied emission factors (reported emissions divided by national lead production) with the default emission factor values or technology-specific emission factors. If the implied emission factors are outside the 95 % confidence intervals for the values given below, it is good practice to explain the reasons for this in the inventory report
If the total annual lead production in the country is not included in the total of the facility reports, it is good practice to estimate the missing part of the national total emissions from the source category, using extrapolation by applying:
EFProductionProductionNationalEEFacilities
FacilityFacilities
pollutantFacilitypollutantTotal ×⎟⎠
⎞⎜⎝
⎛−+= ∑∑ ,,
(5)
where:
Etotal,pollutant = the total emission of a pollutant for all facilities within the source category
Efacility,pollutant = the emission of the pollutant as reported by a facility
Productiontotal = the production rate in the source category
Productionfacility = the production rate in a facility
EFpollutant = the emission factor for the pollutant
Depending on the specific national circumstances and the coverage of the facility-level reports as compared to the total national lead production, it is good practice to choose the emission factor (EF) in this equation from the following possibilities, in decreasing order of preference:
• technology-specific emission factors, based on knowledge of the types of technologies implemented at the facilities where facility level emission reports are not available;
• the implied emission factor derived from the available emission reports:
∑∑
=
FacilitiesFacility
FacilitiespollutantFacility
Production
EEF
,
(6)
• the default Tier 1 emission factor. This option should only be chosen if the facility-level emission reports cover more than 90 % of the total national production.
3.4.2 Tier 3 emission modelling and use of facility data
Lead production plants are major industrial facilities and emissions data for individual plants might be available through a pollutant release and transfer registry (PRTR) or another emission reporting scheme. When the quality of such data is assured by a well developed QA/QC system and the emission reports have been verified by an independent auditing scheme, it is good practice to use such data. If extrapolation is needed to cover all lead production in the country, either the implied emission factors for the facilities that did report or the emission factors as provided above could be used.

2.C.5.b Lead production
EMEP/EEA emission inventory guidebook 2009 21
No generally accepted emission models are available for the lead production industry. Such models could be developed, however, and used in national inventories. If this happens, it is good practice to compare the results of the model with a Tier 1 or Tier 2 estimate to assess the credibility of the model. If the model provides implied emission factors that lie outside the 95 % confidence intervals indicated in the tables above, it is good practice to include an explanation for this in the documentation with the inventory and preferably reflected in the Informative Inventory Report.
3.4.3 Activity data
Since PRTRs generally do not report activity data, such data in relation to the reported facility-level emissions are sometimes difficult to find. A possible source of facility level activity might be the registries of emission trading systems.
In many countries national statistics offices collect production data at the facility level but these are in many cases confidential. However, in several countries national statistics offices are part of the national emission inventory systems and the extrapolation, if needed, could be performed at the statistics office, ensuring that confidentiality of production data is maintained.
4 Data quality
4.1 Completeness Care must be taken to include all emissions, from combustion as well as from processes. It is good practice to check whether the emissions reported as ‘included elsewhere’ (IE) under source category 2.C.5.b are indeed included in the emission reported under combustion in source category 1.A.2.b.
4.2 Avoiding double counting with other sectors Care must be taken that the emissions are not double counted in processes and combustion. It is good practice to check that the emissions reported under source category 2.C.5.b are not included in the emission reported under combustion in source category 1.A.2.b.
4.3 Verification
4.3.1 Best Available Technique emission factors
BAT emission limit values are available from the BREF document for the non-ferrous metal industry (European Commission, 2001).
The BREF document describes the technologies necessary to achieve BAT emission levels. For lead production, no generic emission concentrations are given that may be compared against the Tier 1 estimate. However, some numbers for different techniques and processes are available from the BREF document (European Commission, 2001) and may be used for verification purposes.
4.4 Developing a consistent time series and recalculation No specific issues.

2.C.5.b Lead production
EMEP/EEA emission inventory guidebook 2009 22
4.5 Uncertainty assessment No specific issues.
4.5.1 Emission factor uncertainties
No specific issues. The quality of the emission factors presented is rated as ‘B’. The guidance chapter on uncertainties in Part A of the Guidebook gives information on how to interpret this quality rating.
4.5.2 Activity data uncertainties
No specific issues
4.6 Inventory quality assurance/quality control (QA/QC) No specific issues
4.7 Gridding No specific issues
4.8 Reporting and documentation No specific issues
5 Glossary AR production, technology The production rate within the source category, using a specific
technology
AR production, technology The production rate within the source category, using a specific technology
ARproduction The activity rate for the lead production
Combustion process with contact
A process in which the hot flue gases from a combustion process are directly injected into the reactor where the chemistry and physics take place converting the raw materials into the product. Examples are: • Primary iron and steel • Cement • …
E facility, pollutant The emission of the pollutant as reported by a facility
E pollutant The emission of the specified pollutant
E total, pollutant The total emission of a pollutant for all facilities within the source category
EF country, pollutant A country-specific emission factor
EF pollutant The emission factor for the pollutant

2.C.5.b Lead production
EMEP/EEA emission inventory guidebook 2009 23
EF technology, abated The emission factor after implementation of the abatement
EF technology, pollutant The emission factor for this technology and this pollutant
EF technology, unabated The emission factor before implementation of the abatement
ESP Electrostatic precipitator: dust emissions abatement equipment
FF Fabric filters: dust emissions abatement equipment
Penetration technology The fraction of production using a specific technology
Production facility The production rate in a facility
Production total The production rate in the source category
ηabatement The abatement efficiency
6 References Barbour, A.K., Castle, J.F. and Woods, S.E., 1978. ‘Production of non-ferrous metals’. In: Industrial Air Pollution Handbook, A. Parker (ed.). Mc Graw-Hill Book Comp. Ltd., London.
EPA, 1990. AIR Facility Subsystem. United States Environment Protection Agency Doc. 450/4-90-003. Research Triangle Park, NC, USA.
European Commission, 2001. Integrated Pollution Prevention and Control (IPPC), Reference Document on Best Available Techniques in the Non-Ferrous Metal Industries, December 2001.
IPCC, 2006. 2006 IPCC Guidelines for National Greenhouse Gas Inventories. Prepared by the National Greenhouse Gas Inventories Programme, Eggleston H.S., Buendia L., Miwa K., Ngara T. and Tanabe K. (eds). IGES, Japan.
Kakareka, 2008. Personal communication. Institute for problems of use of natural resources and ecology, Belarusian National Academy of Sciences, Minsk.
Rentz, O., Sasse, H., Karl, U., Schleef, H.-J. and Dorn, R., 1996a. Emission Control at Stationary Sources in the Federal Republic of Germany, Volume II, Heavy Metal Emission Control. Umweltforschungsplan des Bundesministers für Umwelt, Naturschutz und Reaktorsicherheit, Luftreinhaltung, 204 02 360.
Rentz, O., Schleef, H.-J., Dorn, R., Sasse, H. and Karl, U., 1996b. Emission Control at Stationary Sources in the Federal Republic of Germany, Volume I, Sulphur Oxide and Nitrogen Oxide Emission Control. Umweltforschungsplan des Bundesministers für Umwelt, Naturschutz und Reaktorsicherheit, Luftreinhaltung, 204 02 360.
Theloke, J., Kummer, U., Nitter, S., Geftler, T. and Friedrich, R., 2008. Überarbeitung der Schwermetallkapitel im CORINAIR Guidebook zur Verbesserung der Emissionsinventare und der Berichterstattung im Rahmen der Genfer Luftreinhaltekonvention. Report for Umweltbundesamt, April 2008.
UNEP, 2005. PCDD/PCDF Toolkit 2005. United Nations Environmental Programme, Nairobi.

2.C.5.b Lead production
EMEP/EEA emission inventory guidebook 2009 24
Visschedijk, A.J.H., Pacyna, J., Pulles, T., Zandveld, P. and Denier van der Gon, H., 2004. ‘Cooordinated European Particulate Matter Emission Inventory Program (CEPMEIP)’. In: Dilara, P. et. al (eds), Proceedings of the PM emission inventories scientific workshop, Lago Maggiore, Italy, 18 October 2004. EUR 21302 EN, JRC, pp 163–174.
7 Point of enquiry Enquiries concerning this chapter should be directed to the relevant leader(s) of the Task Force on Emission Inventories and Projection’s expert panel on Combustion and Industry. Please refer to the TFEIP website (www.tfeip-secretariat.org) for the contact details of the current expert panel leaders.