2d seismic survey offshore south east greenland
TRANSCRIPT
March 2015 v1
2D SEISMIC SURVEY OFFSHORE SOUTH
EAST GREENLAND EIA Report

PROJECT 2D seismic survey offshore South East Greenland
EIA report v1
Prepared by TA
Verified by IGP
Approved by IGP
Cover page image: seismic survey vessel

2D seismic survey offshore South East Greenland
EIA report v1
CONTENTS IKKE TEKNISK RESUMÉ
TEKNIKKITIGUUNNGITSUMIK EQIKKAANEQ
NON-TECHNICAL SUMMARY
1 Introduction .............................................................................................. 1
1.1 Overview .................................................................................................... 1
1.2 Companies involved ................................................................................... 3
1.3 Purpose of the Project ............................................................................... 3
2 Description of activities .......................................................................... 4
2.1 Overview and Programme ......................................................................... 4
2.2 Seismic Survey .......................................................................................... 5
2.3 Logistics ..................................................................................................... 9
2.3.1 Vessels proposed ...................................................................... 9
2.3.2 Anticipated energy requirements ............................................. 10
2.3.3 Use of Chemicals ..................................................................... 10
2.3.4 Waste Handling ........................................................................ 10
2.3.5 Air Emissions ........................................................................... 10
2.3.6 Discharges to Water ................................................................ 11
2.3.7 Alternative Project Options ...................................................... 11
2.3.8 Built in mitigation ...................................................................... 11
3 Physical Environment ........................................................................... 13
3.1 Climate ..................................................................................................... 13
3.2 Bathymetry ............................................................................................... 13
3.3 Oceanography ......................................................................................... 14
3.4 Ice Conditions .......................................................................................... 16
3.5 Baseline Chemical and Pollution Levels .................................................. 19
4 PROTECTED AREAS AND VALUED ECOSYSTEM COMPONENTS .. 20
4.1 Protected Areas ....................................................................................... 20
4.2 Summary of Valued Ecosystem Components (VECs) ............................ 20
5 Biological Environment ......................................................................... 24
5.1 Benthic ecology ........................................................................................ 24
5.2 Pelagic ecology ........................................................................................ 24
5.3 Fish and shellfish ..................................................................................... 26
5.4 Seabirds ................................................................................................... 34
5.5 Marine mammals ..................................................................................... 37
5.5.1 Overview .................................................................................. 37
5.5.2 Polar Bear ................................................................................ 38
5.5.3 Pinnipeds ................................................................................. 39
5.5.4 Bowhead whale (Balaena mysticetus) ..................................... 40
5.5.5 Minke whale (Balaenoptera acutorostrata) .............................. 42

2D seismic survey offshore South East Greenland
EIA report v1
5.5.6 Humpback whales (Megaptera novaeangliae) ........................ 42
5.5.7 Other large cetaceans .............................................................. 42
5.5.8 Northern Atlantic Right Whale (Eubalaena glacialis) ............... 43
5.5.9 Narwhal (Monodon monoceros) .............................................. 45
5.5.10 Beluga or white whale (Delphina pterusleucas)....................... 47
5.5.11 Other odontocete species ........................................................ 48
6 Human activities .................................................................................... 50
6.1 Fishing ..................................................................................................... 50
6.2 Hunting ..................................................................................................... 52
6.3 Tourism .................................................................................................... 55
7 Impact assessment ................................................................................ 57
7.1 Assessment methodology ........................................................................ 57
7.2 Noise generated by the survey ................................................................ 63
7.3 Biological Environment ............................................................................ 69
7.3.1 Benthic ecology ........................................................................ 69
7.3.2 Pelagic ecology ........................................................................ 71
7.3.3 Fish and shellfish ..................................................................... 74
7.3.4 Seabirds ................................................................................... 77
7.3.5 Marine mammals ..................................................................... 80
7.4 Human activities ....................................................................................... 94
7.4.1 Fishing...................................................................................... 94
7.4.2 Hunting ..................................................................................... 96
7.4.3 Tourism .................................................................................... 97
8 Cumulative impacts ............................................................................... 97
9 MITIGATION & Monitoring .................................................................... 98
9.1 Key Built-in Mitigation .............................................................................. 98
9.2 Proposed Monitoring .............................................................................. 100
10 References ............................................................................................ 102

2D seismic survey offshore South East Greenland
EIA report v1
NON-TECHNICAL SUMMARY
Proposed Project
TGS-NOPEC Geophysical Company ASA (TGS) proposes to undertake a two dimensional (2D)
seismic survey in the western Greenland Sea off South East Greenland between 5 July and 31 Octo-
ber 2015. The Survey Area (Figure A) lies largely to the south of the Arctic Circle, with the proposed
survey lines overlying the continental shelf. The survey will take place at least 12nm offshore at all
times and for the most part well beyond this distance
2D seismic surveys such as this contrast with more intensive 3D surveys where survey lines are much
more closely spaced and very detailed information is collected, but over smaller areas. This is an
important point in relation to the assessment since it means that any environmental effects from 2D
surveys at a given location will be very short term. In contrast, the survey will take place over a rela-
tively large area and thus has potential to affect a wider area, albeit less intensively.
The purpose of the project is to acquire geophysical and geological data that will be used by various
clients (exploration companies) to prospect for hydrocarbon resources. The data acquired by the sur-
vey will contribute to a more accurate and advanced understanding of the geology and hydrocarbon
potential of the area. Conducting the survey as a multi-client project will eliminate (or significantly
reduce) the need for the various different exploration companies to acquire the same data inde-
pendently and thereby limit the overall impact to the environment.
Figure A: location of proposed SEG15 Survey Area in relation to the Greenland coast.
Seismic surveys acquire data on seabed geology using subsurface acoustic (sound) reflections to
identify boundaries between different geological layers. The acoustic source is provided by an array

2D seismic survey offshore South East Greenland
EIA report v1
of airguns towed approximately 250m behind a ‘source’ vessel which also tows an array of hydro-
phones to ‘listen’ to the reflected sound. The hydrophone arrays are known as streamers and will be
solid (not fluid filled) and towed around 8km behind the source vessel. The survey lines will be widely
spaced (12-25km apart). Up to 1,000km of lines will be surveyed. The source vessel will be assisted
by another vessel, a support vessel. A helicopter will be available to assist but is not expected to be
used frequently.
The airgun array will have a total (maximum) active volume of 5,025 cubic inches, although it is more
likely that a volume of 3,350 cubic inches will be used. Use of the larger array would be recorded and
reported to the authorities. As with all such technology, the array generates considerable levels of
underwater noise which this assessment seeks to understand and wherever possible mitigate (i.e.
reduce the environmental impacts).
The vessel will conduct the survey whilst travelling at 5 knots with a firing interval of 10 seconds (ap-
proximately every 25m). The survey vessel is intended to be operational 24 hours a day except in
periods where weather does not allow for data acquisition.
Whilst there may be some drift ice present no ice breaker will be used and the survey will not be able
to enter into any areas of densely packed or fast ice that may be present in coastal areas.
Following submission of a Scoping Document which outlined the proposed survey specifications, the
Environment Agency for the Mineral Resources Activities (EAMRA) via the Mineral Licence and Safe-
ty authority (MLSA) together with its scientific advisors National Centre for Energy and Environment
(DCE) and Green-land Institute of Natural Resources (GINR) have advised TGS that an Environmen-
tal Impact Assessment (EIA) should be prepared. Comments have been received from MSLA and its
technical advisers which have been taken into account in the EIA.
The EIA has been prepared by Centre for Marine and Coastal Studies Ltd (CMACS), informed by
underwater noise modelling completed by NIRAS Greenland. CMACS is a specialist marine and
coastal environmental survey and consultancy company. NIRAS Greenland, part of the NIRAS
Group, is an engineering consultancy company with over 50 years of involvement in Greenland.

2D seismic survey offshore South East Greenland
EIA report v1
Ecology of the Area and Human Activities
The biological environment is strongly influenced by short lived phytoplankton blooms which occur
after the break-up of sea ice in the spring. This fuels a period of intense biological production.
The EIA summarises the various human activities and natural environment features that could poten-
tially be affected by the survey. The natural environment includes seabed communities which in shal-
low areas, especially below 100m, are important areas of production supporting wider marine species.
Although there is less fishing activity than off South West Greenland the South East is believed to
support a higher abundance and diversity of fish than seas to the north off the east coast of Green-
land and this sustains some commercial and subsistence fishing activity. There is some hunting of
marine mammals, focused in coastal waters inshore of the Survey Area.
Coastal areas are also of considerable importance to seabirds over summer months, some of which
will pass through or may forage in the survey area.
A wide range of marine mammal species occur off South East Greenland and may be present in or
around the Survey Area. Northern right whale and narwhal are identified as being of particular im-
portance and potential sensitivity in relation to the proposed seismic survey; there are protection
zones for narwhal in the Licence Area although the seismic survey will not enter these areas. Bow-
head whale are also recognised as a key species but the survey is unlikely to encounter them as the
species is associated with ice conditions and is expected to be present well north of the Survey Area.
A wide range of other marine mammal species could be encountered or be present around the Sur-
vey Area over summer months.
Table A: Potential Impacts
Effect Receptors Considered Potential Impact(s)
Underwater noise of
airgun array
Fish, Marine Mammals,
Fishing Activity
Physical injury
Disturbance/displacement
Accidental oil/fuel spills Fish, Birds, Marine
Mammals, Benthic Habi-
tats
Direct/indirect impacts through
contamination of the marine
environment as discussed
Attraction to vessels Birds Collisions/interference with
normal behaviour, potentially
fatal to individuals.
Conflicts with survey
vessels
Fishing activity, hunting,
tourism,
Marine mammals, birds
Lost time and income
Death/injury for individuals
The underwater noise expected to be generated by the survey has been modelled to support the EIA.
In summary:
sound propagation from the seismic survey is expected to be much greater for lower frequen-
cy components of the sound spectrum;

2D seismic survey offshore South East Greenland
EIA report v1
there will be rapid attenuation (noise reduction) over short distances (the first few hundred
metres), especially of higher frequency sound;
levels of noise that could injure marine mammals are not expected to be present more than
1,000m from the airgun array (potentially dangerous levels of noise may be present closer to
the airguns)
levels of noise that may disturb marine mammals are expected for some tens of kilometeres
around the survey.
Mitigation
Mitigation includes elements built in to survey planning, such as the presence of trained and experi-
ence marine mammal and seabird observers (MMSOs) with Passive Acoustic Monitoring (PAM)
equipment. The MMSOs, PAM operators and survey technicians will together implement current
Greenlandic marine mammal mitigation protocols that set out appropriate responses if marine mam-
mals approach the airguns before or during airgun firing. Furthermore, additional elements following
EIA (such as an increased Mitigation Zone based on the results of noise modelling) will be imple-
mented.
The following detailed mitigation is explained in the EIA:
smaller volume seismic array to be used wherever possible;
a mitigation gun will be available if needed, this is a single gun of low output;
airguns will not be used unnecessarily at far distances from the transect line;
at least four qualified marine mammal and seabird observers (MMSO) including PAM opera-
tors will be present on the source vessel with a minimum of one observer monitoring visually
and one PAM operator monitoring acoustically during pre-firing watches;
Passive Acoustic Monitoring (PAM) will be deployed at all times during pre-firing watches by
one of two PAM operators;
MMSO and PAM Operators should be experienced in both visual and acoustic techniques to
allow individuals to rotate duties efficiently as watches will be long during ~24 hour daylight
conditions.
Implementation of current Greenlandic marine mammal mitigation protocols that set out ap-
propriate responses if marine mammals approach the airguns before or during airgun firing
through the use of MMSOs and PAM equipment.

2D seismic survey offshore South East Greenland
EIA report v1
TEKNIKKITIGUUNNGITSUMIK EQIKKAANEQ
Suliniut siunnersuutigineqartoq
TGS-NOPEC Geophysical Company ASA (TGS) siunnersuuteqarpoq marloqiusamik sammivilimmik
(2D) sajupillatsitsisarluni misissuiniarluni immallu naqqaniit misissugassanik katersiniarluni Grønland-
shavip kiterpasissuani Kalaallit Nunaata Kujataata Kangiani piffissami juunip aallaqqaataata (1) ok-
tobarillu 30-iata akornnani 2015-imi. Misissuivissaq (Takussutissiaq A) tamangajammi qaasuitsup
kujataata tungaaniippoq. Misissuinerit annertunerpaartaatigut imartani ikkannerusuni pissaapput,
itissutsit 200-300 meterisut ititigisuni nunap toqqaviata qaavani. Misissuinissaq pffissaq tamaat inger-
lanneqassaaq minnerpaamik nunami 12 sømilit avammut annerusumillu ungasissuseq tamanna
qaangingaatsiarlugu.
2D-mik sajuppillatsitsilluni misissuinerit pineqartut sukumiinerusumik misissuinernut 3D-nut illuatungi-
upput, titarnerit qaninnerullutik paasissutissallu sukumiinerujussuit katersorneqarlutik nalingin-
naasumik sumiiffimmit annertunngitsumiit. Taanna sammisaavoq pingaarutilik nalilersuinissamut,
imak isumaqarluni, tassa avatangiisinut sunniutaasinnaasut sumiifiimmi aalajangersimasumi sivikit-
tuinnarmik pissallutik. Taassuma akerlianik una misissuineq sumiiffimmi annertungaatsiartumi pissaaq
taamaalillunilu annertungaatiartumik sunniuteqarnissaminut pisinnaalluni, taamaattoq sunniutaa anni-
kinnerulluni.
Pilersaarutip siunertaraa geofysikkimik geologiimillu paasissutissanik pigisaqalernissaq, sullitanit as-
sigiinngitsunit atorneqarsinnaasunik (suliffeqarfiit misissueqqissaarnermik suliallit) kul-
brinteqarsinnaaneranik misissuinerminni. Paasissutissat, misissuinermit pissarsiarineqarsimasut
eqqornerusumik pitsaanerusumillu paasissutissiissapput sumiiffimmi geologiimik kulbrinteqarneranillu
ilimanaateqarneranik. Pilersaarutip arlariinnik sullitassalerlugu ingerlaneqarnerata peersissavaa (mil-
lisilluguluunniit) suliffeqarfiit misissuinermik suliallit paasissutissat assigiit immineerlutik pis-
sarsiarinissaanut taamaalilluni avatangiisinut sunniutissat tamakkiisumik annikillisillugit.
2D seismic survey offshore South East Greenland
EIA report v1
Takussutissiaq A: SEG15 sajuppillatsitsisarluni misissuivissatut siunnersuutaasup inissinnera
Kalaallit Nunaata sineriianut naleqqiullugu.
Sajuppillatsitsisarluni misissuinermit immap naqqata qanoq issusaannik paasis-sutissanik pissarsivi-
ussapput nunap iluanut (nipinik) aporartitsinikkut akisuatitsil-luni geologiip qaleriiaarnerisa killeqarfii
assigiinngitsut sumiissusersiornerani. Nipimik aallakaatitsissut silittumik inissitsiterneqarsimasunik
silaannarmik qamutilittaatinik umiarsuup aquanit 250 meterinik ungasitsigisumit kalinneqartunit immap
iluanit immiussissutitalimmik akisuanernik tigooqqaassutilimmik (hydrofo-ner). Akisuanermik
tigooqqaassut aamma ilisimaneqarpoq streamer-itut aallaavianiit taanna umiarsuup aquanit 8 km-
erisut ungasitsigisumiit kalinneqassaaq. Misissuinermi titarnerit avissaangatsinneqassapput (12-
25km-isut ungasitsigalutik). Titarneq 1000 km-it tikillugit misissorneqassapput. Aallaaviusumik an-
gallat allamik umiarsuarnik ikiorteqassaaq, angallat ikorfartuut. Qulimiguulik aamma ikiuutissalluni
piareersimassaaq kisiannili atorneqakulanissaa naatsorsuutigineqanngilaq.
Silaannarmik qamutilittaat tamakkiisumik (annerpaaffissaq) atorsinnasoq anner-tussuseqassaaq 5025
kubik torminik, ilimanarnerullunili 3350 kubik tormit an-gullugit annertussuseqartoq atorneqassasoq.
Teknikkikkut atortut taamaattut, qamutilittaat immap iluani nipiliorsinnaavoq sakkortungaatsiartumik
tamanna misissuinerup massuma paasiniarpaa qanorlu innarliinaveersaartinnissaa angune-
qarsinnaanersoq (tassa imaappoq, avatangiisinut sunniutai annikillisar-niarlugit).
Umiarsuup misissuinini ingerlatissavaa 5 knob-imik sukkassuseqarluni 10 sekun-tikkaarluni nipimik
issuttarluni (25 meterikkaarluni). Umiarsuaq misissuut ulloq unnuarlu ingerlaarnissaminut sanaajuvoq,
silamik peqquteqarluni paasissutissanik katersisinnaannginnera peqqutaalluni uninngatinne-
qarsinnaanera eqqaassanngikkaanni.

2D seismic survey offshore South East Greenland
EIA report v1
Sikorsuit tamaaniissinnaapput taamaattoq sikusiummik atuisoqarnavianngilaq, misissuinerlu sikor-
suarnut eqimasuunut isertersinnaanavianngilaq soorluttaaq ukiup sikuanut sinerissap qanittuaniit-
tumut isertersinnaanngitsoq.
Sumiiffimmi killiliinerup, tassa misissuinissatut siunnersuutigineqartup immikkoortitaakkanik
nalunnarsuiffii pingaarnersiorlugit eqqartorneqartut uppernarsaataata nassiunneqarnerata kingorna,
Aatsitassanut Ikummatissanullu Aqutsisoqarfik (MLSA, siornatigut ilisimaneqartoq Aatsitassanut
Ikumma-tissanulluPisortaqarfik (BMP)), National Center for Energi og Miljø (DCE) kiisalu
Pinngortitaleriffik (GINR) TGS-imut innersuussutigisimavaat Avatangiisinut Sunniutaasinnaasunik
Nalilersuinerit (ASN) suliarineqassasoq. Oqaaseqaatit MLSA-mit taassumalu teknikkikkullu
siunnersortaanit tiguneqarsimapput uunga qinnuteqaammut tunngasut uunga ASN-mut ilanngullugit
isumaliutersuu-taasimallutik.
ASN-i suliarineqarsimavoq Center for Marine and Coastal Ltd (CMACS), paasissuserneqarsimallutik
immap iluani nipiliorluni siulittuinernik NIRAS Green-landimit naammassineqarsimasunik. CMACS
immap sinerissallu avatangiisaanik misissuinernik immikkut ilisimasaliuvoq aamma
siunnersuisoqarfittut suliffe-qarfiulluni. NIRAS Greenland, NIRAS Group-imut ilaasoq, suliffeqarfiuvoq
inginiøritut siunnersuinermik suliffeqarfik ukiut 50-it sinnerlugit Kallaallit Nunaanni suliaqarsimalluni.
Sumiiffimmi pinngortitami pissuseqatigiinneq aamma Inuit suliaat
Pinngortitami uumasoqatigiit avatangiisaat tappiorannartunik pinngorartunik sivikitsumik inuunilinnik
sunnerteqqasorujussuuvoq, upernaakkut sikup aattu-lernerani avissaalerneranilu pinngorartartunik.
Taassuma malitsigisarpaa piffissap pineqartup nalaa uummassusilinnik annertuumik pinngo-
rartoqarnera.
ASN-imi inuit sammisaat assigiinngitsut pinngortitallu immineq pissusai misis-suinermit at-
tuallaneqarsinnaasut eqikkarlugit nalunaarsorneqarput. Pinngortitaq pineqartoq tassaavoq immap
naqqani uumasoqatigiit pissuseqatigiinnerat, ikkattuni, ingammik 100 meterimit ikkannerniittuni, sumi-
iffiupput pingaarutillit erniortunut ikorfartuutit imarmiunut. Kalaallit Nunaata Kujataata kitaanut sanil-
liullugu aalisarneq tamaani annikinnerugaluartoq, kujataata kangia isumaqarfigineqarpoq assigiinngis-
itaarnerusunik aalisakkanik peqartoq Kalaallit Nunaata kangiata avannaparsinnerusuaniit
tamassumanilu aalisarneq aningaasarsiorfiusoq inuuniutaasorlu attanneqarpoq. Imaani miluumasut
piniarneqartarput kitaani sineriaallu qanittuani pipput misissuiviup nalaani.
Sineriaat aamma aasaanerata nalaani annertuumik pingaaruteqarput timmissanut imarmiunut, ilaa-
tigut timmissat ilaat saneqqutiinnanngikkunik misissuiviup nalaani neriniarsinnaallutik.
Imaani miluumasut suussutsit assigiinngitsut Kalaallit Nunaata tunuata kujataani piupput, misissuivi-
ullu nalaaniissinnaallutik eqqaaniluunniit. Arfiviit ilaqutaat Qilalugarlu immikkut pingaarutilittut suus-
susersineqarput malussarissuseqarsin-naallutillu sajupillatsitsilluni misissuinermi. Qilalukkanut iller-
suiffiusunik peqarpoq akuersissuteqarfiup nalaani, sajupillatsitsisarlunilu misissuinerit tamakkunani
illersukkani pisussaanngillat. Arfivik aamma pingaarutilittut suussusersineqarsimavoq ilimananngilarli
misissuinermi takuneqassasoq tassa uumasut taakku sikunut qanittuummata ilimanarlunilu misis-
suiffissap avannarpasinnerungaatsiartuaniissasoq. Imaani uumasut amerlasuut allat
siumorneqartarsinnaapput imaluunniit aasaaraneranu misissuiffisap iluaniillutik.

2D seismic survey offshore South East Greenland
EIA report v1
Nalunaarsuiffik A: Sunniutaasinnaasut
Sunniutip suussusaa Sunnerneqarsinnaasut Sunniutaasinnaasut
Immap iluatigut nipiliortitsineq
silaannaq atorlugu
qamutilittaatinit
Aalisakkat, imaani miluumasut
aalisarnerillu
Timikkut innarliinerit, Ajoqusi-
inerit/illikartitsinerit
Naatsorsuutanngitsumik
uuliakoorneq/ ikummatissamik
aniasoorneq
Aalisakkat, timmissat, imaani
miluumasut, immap naqqani
uumasoqarfiit
Toqqaannartumi(ngittumik)
sunniinerit imaq avatangiisaasoq
aqqutigalugu soorlu
oqallisigineqareersoq
Timikkut ajoqusersuinerit
immap naqqanit katersisunit Immap naqqani uumasoqarfiit
Uumasoqarfiit ajortiasut
ajoquserneqarneri
Angallatinut soqutiginninerit Timmissat
Apornerit/ajoqusersuinerit naling-
innaasumik pissusaannut,
ataasiakkaanut toqqutaasin-
naasumik
Misissuinermi umiarsuit qulimi-
iguullillu isumaqatigiinnginerat
Aalisarnerit, piniarnerit, ta-
kornariqarnerit, imaani milu-
umasut timmissallu
Immap iluani ilimagineqartutut nipiliornerit misissuinermit pilersinneqartut naatsorsugaasimapput
ASN-i ilassuserniarlugu. Eqikkarneri:
nipip siaruarnera sajuppillatsitsisarluni misissuinermit naatsorsuutaavoq frekvensini appasin-
nerusuni annertunerujussuussasoq nipit assigiinngisitaarneranni maligaasakinnerni;
sukkasuumik nipikillisaateqassaaq (nipiliorneq millisillugu) isorartussutsit naatsuni (100 meter-
it siulliit marluk), ingammik maligaasani naannerni;
nipiliortut qaffasissusaanni, imaani miluumasunik ajoqusiisinnaasut natsorsuutaanngilaq 1000
m-imiit silaannarmik qamutilittaatimit qaninnerunnginnissaat naatsorsuutaavoq (illuatungaan-
iilli nassuerutaavoq, nipit ulorianarsinnaasut silaanarmik qamutilittaatit eqqaani issinnaasut);
nipiliortut qaffasissusaanni, imaani miluumasunut ajoqusersuisinnaasut misissuiffimmiit 10
km-ikkaartut arlallit kaajallallugu ilimagineqarput.
Innarliinaveersaarneq
Innarliinaveersaarnermut ilaapput paasissutissat misissuinissamut pilersaarusiornermut ilaareersit,
soorlu ilinniarsimasunik misilittagaqareersunillu imaani miluumasunik timmissanillu nakkutilliisut
(MMSO) aamma Passiv Akustisk Monitering (PAM) atortorissaarutai. MMSO-ut, PAM-inik ingerlatsisut
aamma misissuinermi teknikerit ataatsimoorlutik Kalaallit Nunaanni imaani miluumasunut innali-
inaveersaarnermi malittarissasat iliuusissanik eqqortunik imallik atortuulersissavaat imaani milu-
umasut silaannarmik qamutilittaatit aallartilernerinni imaluunniit aallartinnerini qanillissagaluarpata.

2D seismic survey offshore South East Greenland
EIA report v1
Ilutigalugu, ilassutit ASN-I malillugu (soorlu annertunerusumik innarliinaveersaarluni illersuiffiit al-
lineqarneri nipiliornermi naatsorsuutit inerneri tunngavigalugit) atortuulersinneqassapput.
Makku innarliinaveersaarnerit sukumiisut ASN-imi sukumiisumik nassuiarneqarput:
sajuppillatsitsisarluni aaqqissuussinerit annikinnerit atorneqassapput, periarfissaatillugu;
innarliinaveersaarnnissamut qamutilittaat piareersimasuutigineqassaaq, silaannarmik annikit-
tumik ataatsimik qamutilittaatitalik pisariaqartinneqalissagaluarpat;
silaannarmik qamutilittaatit pisariaqanngitsumik atorneqassanngillat timmisartumik inger-
laarfinniit;
minnerpaamik angallammi aallaaviusumi imaani miluumasunik timmissanillu nakkutilliisut
(MMSO) piukkunnartut najuutissapput ilagalugit Passiv Akustisk Monitering (PAM) inger-
latsisut, annikinnerpaamik isigalutik nakkutilliisallutik aammalu PAM-imik ingerlatsisoq
ataaseq nipinik tusarnaarluni malittarinnilluni sissuertuussalluni aallaariartoqalertinnnagu;
Passiv Akustisk Monitering (PAM) piffissaq tamaat atuutinneqassaaq aallaariartoqal-
ersinnagulu PAM ingerlatsisoq ataaseq marlulluunnit atuutissallutik;
MMSO-t aamma PAM-imik ingerlatsisut misigisartuujussapput isigaluni nipimillu tusarnaarluni
periaatsinik, taamaalillutik nikittaalluni sulisinnaaneq uummarissumik ingerlanneqarsinnaaler-
sillugu, tassami nakkutilliinerit takissammata ullup unnuallu qaamanerisa nalaanni.
Kalaallit Nunaani imaani miluumasunut innarliinarveersaarluni malittarisassanik eqqortumik
iliuuseqarnissanik imallik imaani miluumasut silaannarmik qamutilittaatit aallaalernerini ima-
luunniit aallaareernerini maanna attuuttunik MMSO-t aamma PAM-ip atortorissaarutai atorlu-
git atortuulersitsineq.

2D seismic survey offshore South East Greenland
EIA report v1
IKKE TEKNISK RESUMÉ
Foreslået projekt
TGS-NOPEC Geophysical Company ASA (TGS) foreslår, at der foretages en todimensionel (2D)
seismisk undersøgelse i det vestgrønlandske hav ud for Sydøstgrønland mellem 5. juli og 31. oktober
2015. Størstedelen af undersøgelsesområdet (Figur A) befinder sig syd for den nordlige polarkreds.
Undersøgelsen vil hovedsagelig finde sted på lavt vand på ca. 200-300 meters dybde oven for
kontinentalsoklen. Undersøgelsen vil finde sted mindst 12 nm ud for kysten på alle tidspunkter og for
det meste godt over denne afstand.
2D seismiske undersøgelser som denne kontrasterer mere intensive 3D-undersøgelser, hvor
undersøgelseslinjerne befinder sig meget tættere sammen, og der indsamles detaljerede
informationer, men over mindre områder. Dette er en meget vigtig pointe i relation til vurderingen, da
det betyder, at eventuelle miljøpåvirkninger fra 2D-undersøgelser på et givet sted vil være meget
kortvarige. I modsætning hertil vil undersøgelsen finde sted over et relativt stort område og har derfor
potentiale til at påvirke et større område, dog mindre intensivt.
Formålet med undersøgelsen er at skaffe data, der skal bruges af forskellige klienter
(undersøgelsesselskaber), der vil søge efter kulbrinteressourcer. De data, der opnås via
undersøgelsen, vil bidrage til en mere nøjagtig og avanceret forståelse af områdets geologi og
kulbrintepotentiale. Gennemførelse af projektet som et projekt med flere klienter vil eliminere (eller
betydeligt reducere) behovet for, at de forskellige undersøgelsesselskaber skaffer de samme data
uafhængigt, og dermed begrænse den overordnede påvirkning på miljøet.
Figure A: Placering af foreslåede SEG15 undersøgelses område i relation til det Grønlandske
kyst.

2D seismic survey offshore South East Greenland
EIA report v1
Seismiske undersøgelser skaffer data om havbundsgeologi ved hjælp af akustiske (lyd) refleksioner i
undergrunden med henblik på at identificere grænser mellem forskellige geologiske lag. Den
akustiske kilde leveres af en opstilling af luftkanoner, der slæbes ca. 250 m bag et
undersøgelsesfartøj, som også slæber en opstilling af hydrofoner, der opfanger den reflekterede lyd.
Opstillingen af hydrofoner kendes som streamers og slæbes 8 km bag undersøgelsesfartøjet. Der vil
være stor afstand mellem undersøgelseslinjerne (12-25 km). Op til 1000 km linjer vil blive undersøgt.
Undersøgelsesfartøjet assisteres af et andet fartøj, et støttefartøj. En helikopter vil være til rådighed til
assistance, men den forventes ikke at blive benyttet ofte.
Luftkanonerne vil have en total (maksimum) aktiv volumen på 5025 kubik tom-mer, selvom det er
mere volumen sandsynligt at envolumen på 3350 kubik-tommer vil blive brugt. Som med al sådan
teknologi betydelige mængder un-dervandsstøj, hvilket denne vurdering søger at belyse og, hvor det
er muligt, nedsætte (dvs. reducere miljøpåvirkningerne).
Fartøjet vil foretage undersøgelsen med en hastighed på 5 knob og med et affyringsinterval på 10
sekunder (ca. for hver 25 m). Det er hensigten, at undersøgelsesfartøjet skal være i drift 24 timer i
døgnet undtagen i perioder, hvor vejret ikke muliggør fremskaffelse af data.
Selvom der kan være nogle drivis tilstede vil der ikke anvendes en isbryder og undersøgelsen vil ikke
være istand til at komme ind på områder med tætpakket is eller fastis, der kan være tilstede i
kystområder.
Efter indsendelse af en områdeafgrænings dokument, der skitserede de foreslåede
undersøgelsesspecifikationer, har Råstofstofstyrelsen (MLSA, tidligere kendt som Råstofdirektoratet
(BMP)), National Center for Energi og Miljø (DCE) og Grønlands Naturinstitut (GINR) anbefalet TGS,
at der udarbejdes en Vurdering af Virkninger på Miljøet (VVM). Der er modtaget kommentarer fra
MLSA og dets tekniske rådgivere, som er blevet taget i betragtning i VVM’en.
VVM’en er udarbejdet af Centre for Marine and Coastal Studies Ltd (CMACS) og er informeret med
undervandsstøj modellering afsluttet af NIRAS Greenland. CMACS er et konsulentfirma, der er
specialiseret i hav- og kystmiljøundersøgel-ser. NIRAS Greenland, som er en del af NIRAS Gruppen,
er et rådgivende inge-niørfirma med over 50 års engagement i Grønland.
Områdets økologi og menneskelige aktiviteter
Det biologiske miljø er stærkt påvirket af kortlivede opblomstringer af fytoplankton, som indtræder
efter opbrud af havisen i foråret. Dette medfører en periode med intens biologisk produktion.
VVM'en opsummerer de forskellige menneskelige aktiviteter og de naturlige miljøegenskaber, der
potentielt kunne blive berørt af undersøgelsen. Det naturlige miljø omfatter havbundssamfund, der i
lavvandede områder, især under 100 m, er vigtige områder for produktion af betydning for andre
havdyrarter. Selvom der er mindre fiskeriaktivitet end ud for Sydvestgrønland, menes Sydøst at
understøtte en større overflod og diversitet af fisk end havene nord for Grønlands østkyst, og dette
fastholder nogen fiskeriaktivitet til erhverv eller underhold. Der forefindes nogen jagt på havpattedyr,
fokuseret i kystnære vande i undersøgelsesområdet.

2D seismic survey offshore South East Greenland
EIA report v1
Kystområderne er også af væsentlig betydning for havfugle i løbet sommermånederne, hvoraf nogle
vil passere gennem eller fouragere i undersøgelsesområdet.
En bred vifte af havpattedyrarter forekommer ud for Sydøstgrønland og kan være til stede i eller
omkring undersøgelsesområdet. Nordlig rethval og narhval er identificeret som værende særligt
betydningsfulde og potentielt følsomme i forhold til den foreslåede seismiske undersøgelse. Der er
beskyttelseszoner for narhval i licensområdet, selvom den seismiske undersøgelse ikke vil gå ind i
disse områder. Grønlandshval anerkendes også som en nøgleart, men undersøgelsen vil
sandsynligvis ikke støde på den, da arten forbindes med isforhold og forventes at være til stede et
godt stykke nord for undersøgelsesområdet. En lang række øvrige havpattedyrarter kan forefindes
omkring undersøgelsesområdet i sommermånederne.
Tabel A. Potentielle påvirkninger
Effekt Omfattede receptorer Potentiel(le) påvirkning(er)
Undervandsstøj fra
luftkanonopstilling
Fisk, Havpattedyr,
Fiskeriaktiviteter
Fysiske skader
Forstyrrelse/forflytning
Utilsigtet olie-/brændselsudslip Fisk, Fugle, Havpattedyr,
Bundhabitater
Direkte/indirekte påvirkninger
igennem forurening af havmiljøet
som diskuteret
Fysisk forstyrrelse fra
havbundsprøvetagning
Bundhabitater Skade på sårbare habitater
Tiltrækning til fartøjer Fugle Kollisioner/interferens med
normal adfærd, potentielt fatalt
for individer
Konflikter med
undersøgelsesfartøjer og
helikopter
Fiskeriaktiviteter, Jagt,
Turisme
Havpattedyr, Fugle
Mistet tid og indtægt
Død/skade for individer
Den undervandsstøj, der forventes genereret af undersøgelsen, er modelleret til at understøtte
VVM’en og opsummeres:
Lydforplantningen fra den seismiske undersøgelse forventes at være meget større for
lavfrekvente komponenter i lydspektret
Der vil være hurtig dæmpning (støjreduktion) over korte afstande (de første par hundrede
meter), især af støj med højere frekvens
Støjniveauer, der kunne skade havpattedyr, forventes ikke at være til stede mere end 1000 m
fra luftkanonopstillingen (potentielt farlige støjniveauer kan være til stede tæt på
luftkanonerne)
Støjniveauer, der kan forstyrre havpattedyr, forventes nogle snese kilometer omkring
undersøgelsen

2D seismic survey offshore South East Greenland
EIA report v1
Afværgeforanstaltning
Afværgeforanstaltning omfatter elementer, der er indbygget i planlægningen af undersøgelsen, såsom
tilstedeværelsen af uddannede og erfarne observatører af havpattedyr og havfugle (MMSO) med
passiv-akustisk moniteringsudstyr (PAM). MMSO’erne, PAM-operatørerne og undersøgelsens
teknikere vil sammen implementere gældende grønlandske protokoller til afværgeforanstaltninger i
forbindelse med havpattedyr. Disse protokoller udstikker relevant respons, hvis havpattedyr nærmer
sig luftkanonerne før eller under affyring. Desuden vil der blive implementeret yderligere elementer,
der følger VVM (såsom en øget afværgezone baseret på resultaterne af støjmodelleringen).
Følgende detaljerede afværgeforanstaltninger forklares i VVM’en:
Mindre seismiske opstillinger, der vil blive anvendt, hvor det er muligt
En afværgekanon vil være til rådighed, hvis der er behov for det. Denne er en enkelt kanon
med lavt output
Luftkanoner vil ikke blive anvendt unødvendigt på lang afstand af transektlinjerne
Mindst fire kvalificerede havpattedyr og havfugle observatører (MMSO) herunder PAM-
operatører vil være til stede på undersøgelsesfartøjet med mindst én observatør monitere
visuelt og en PAM-operatør akustisk monitere under præ-affyringsvagter
Passiv Akustisk Monitering (PAM) vil blive anvendt hele tiden underpræ-affyringsvagter af en
ud af to PAM-operatører
MMSO og PAM-operatører skal være erfarne i både visuelle og akustiske teknikker til at
tillade individuelle skifteholds rotationer gennemføres effektivt da vagterne vil blive lange
under forhold med ~24 timers dagslys
Implementering af gældende grønlandske protokoller til afværgeforanstaltninger i forbindelse
med havpattedyr, som udstikker relevant respons, hvis havpattedyr nærmer sig luftkanonerne
før eller under affyring, ved hjælp af MMSO og PAM-udstyr
1 2D seismic survey offshore South East Greenland
EIA report v1
1 INTRODUCTION
1.1 Overview
TGS-NOPEC Geophysical Company ASA (TGS) propose to undertake seismic survey off South East
Greenland between 05 July and 31 October, 2015 (Figure 1-1). The survey is named ‘SEG15’. Up to
1,000 line kilometres of 2D survey is planned. It is likely that the planned survey lines will likely take
less than the 4 month survey period proposed. However this survey will be undertaken in conjunction
with a 2D survey off North East Greenland (NEG15), with the same vessel being used for both sur-
veys (Figure 1-1). It is likely that SEG15 will be undertaken after NEG15 is complete or when the pres-
ence of pack ice prevents further survey operations. This report focuses on the potential environ-
mental impacts of the SEG15 survey. The NEG15 survey will be subject to a separate assessment.
Figure 1-1: TGS planned seismic survey area off SE Greenland in 2015.

2 2D seismic survey offshore South East Greenland
EIA report v1
Figure 1-2: TGS planned seismic survey areas off Greenland in 2015 (bathymetric data from
IOC, IHO and BODC, 2003).
The program covers the same area that was applied for in 2011, 2012, 2013 and 2014 (SEG11,
SEG12, SEG13 and SEG14). The 2014 survey application was for up to 5,000 line kilometres. The
2015 application is for the same overall area, but with a reduced number of survey lines. TGS also
propose to use multibeam echo sounder and sub-bottom profiler equipment to support this year’s
survey. A summary of work completed in previous years is provided in Section 2.1.
Having reviewed the Scope of the proposed survey, the Mineral Licence and Safety Authority (MLSA),
National Centre for Energy and Environment (DCE) and Greenland Institute of Natural Resources
(GINR) advised TGS that the survey was considered ‘to have potential for significant impacts on the
environment’ and that an Environmental Impact Assessment (EIA) should be prepared.
This report has been prepared to meet MLSA’s requirements as set out in EIA Guidelines prepared by
DCE (Kyhn et al., 2011). The EIA focusses on potential impacts of the proposed survey together with
planned mitigation measures (both in-built (Section 2) and informed by a description of anticipated
effects (Section 7). Background information has been collated in sections 3to 6 to inform this work as
well as to support future activities by MMSOs (Marine Mammal and Seabird Observers) offshore.

3 2D seismic survey offshore South East Greenland
EIA report v1
Noise modelling has been undertaken to support this assessment1,2
. The results are summarised in
Section 7.2.
1.2 Companies involved
TGS provides global geoscientific data products and services to the oil and gas industry to assist with
licensing rounds and the preparation of regional data programs. TGS invests in multi-client data pro-
jects in frontier, emerging and mature markets worldwide that make up a data library of seismic imag-
ing, well data and interpretive products and services. The company’s financial base is in Norway with
offices in Norway, England, North America, Brazil and Australia.
TGS have undertaken 2D and 3D seismic surveys in North and South America, Europe, Africa, Asia
and the Arctic, including previous surveys off Greenland.
Several other companies are providing professional services along with TGS in order to conduct the
SEG15 survey off northeast Greenland. These are as follows:
Sevmorneftegeofizika (SMNG) is the largest marine geophysical company in Russia. It ren-
ders a wide range of marine geophysical services worldwide including: 2D/3D marine seismic
acquisition, navigation positioning, data processing and integrated interpretation of seismic
data. SMNG are expected to be used as the survey vessel supplier; TGS will operate the
seismic vessel under a charter agreement with the owners (e.g. SMNG). TGS will be respon-
sible for maritime and seismic operations together with the owners.
Kvitbjorn is a North Norwegian company who provide offshore support services for seismic
survey operations in the arctic. Kvitbjorn will provide and operate the chase / support vessel
during the SEG15 survey.
This EIA has been prepared by Centre for Marine and Coastal Studies Ltd (CMACS), informed by
underwater noise modelling completed by NIRAS Greenland. CMACS is a specialist marine and
coastal environmental survey and consultancy company. NIRAS Greenland, part of the NIRAS
Group, is an engineering consultancy company with over 50 years of involvement in Greenland.
NIRAS Greenland and CMACS completed an Environmental Impact Assessment (EIA) for an equiva-
lent survey in 2013 which has been used as the basis for this assessment.
1.3 Purpose of the Project
The overall purpose of the project is to acquire multi-client seismic data and other geophysical and
geological data that will be used by various exploration companies in relation to hydrocarbon resource
prospecting. The data acquired by the survey will contribute to a more accurate and advanced un-
derstanding of the geology and hydrocarbon potential of the area. By conducting the project as a
multi-client project, it will eliminate (or significantly reduce) the need for the various exploration com-
panies to acquire the same data independently and thereby limit the overall impact to the environ-
ment.
1 http://www.tgs.com/media/investor-webcast/External-
links/NIRAS%202013%20(SE%20Greenland%20noise%20modelling).pdf
2 http://www.tgs.com/media/investor-webcast/External-
links/NIRAS%202014%20(appendix%20to%20SE%20Greenland%202013%20noise%20modelling).pdf
4 2D seismic survey offshore South East Greenland
EIA report v1
2 DESCRIPTION OF ACTIVITIES
2.1 Overview and Programme
The SEG survey is one of two surveys planned by TGS in Greenland waters in 2015. The other is off
North East Greenland and would be undertaken between July and October. Although separate as-
sessments are being made the two surveys are not independent of each other; the same acquisition
vessel (the Akademik Shatskiy (ice class) or a similar vessel) is expected to work in each area. The
intention is to develop a flexible programme, particularly to allow data to be collected to the south if
the northern area is closed by ice conditions. Key dates for the SEG15 survey are provide in Table
2-1.
Table 2-1: key dates in survey program.
Activity Date
Date of arrival in Greenland waters
(earliest) 05/07/2015
Date of start of seismic acquisition
(earliest) 05/07/2015
Date of seismic works completion
(latest) 31/10/2015
The program covers the same area that was applied for in 2011, 2012, 2013 and 2014 (SEG11,
SEG12,SEG13 and SEG14). Although 5000 line km had been applied for in previous years very little
survey data has been acquired, with only 968 line km being completed, entirely in 2012. As in previ-
ous years, the actual total survey distance will depend on conditions at the time of survey and pro-
gress of the overall programme.
5 2D seismic survey offshore South East Greenland
EIA report v1
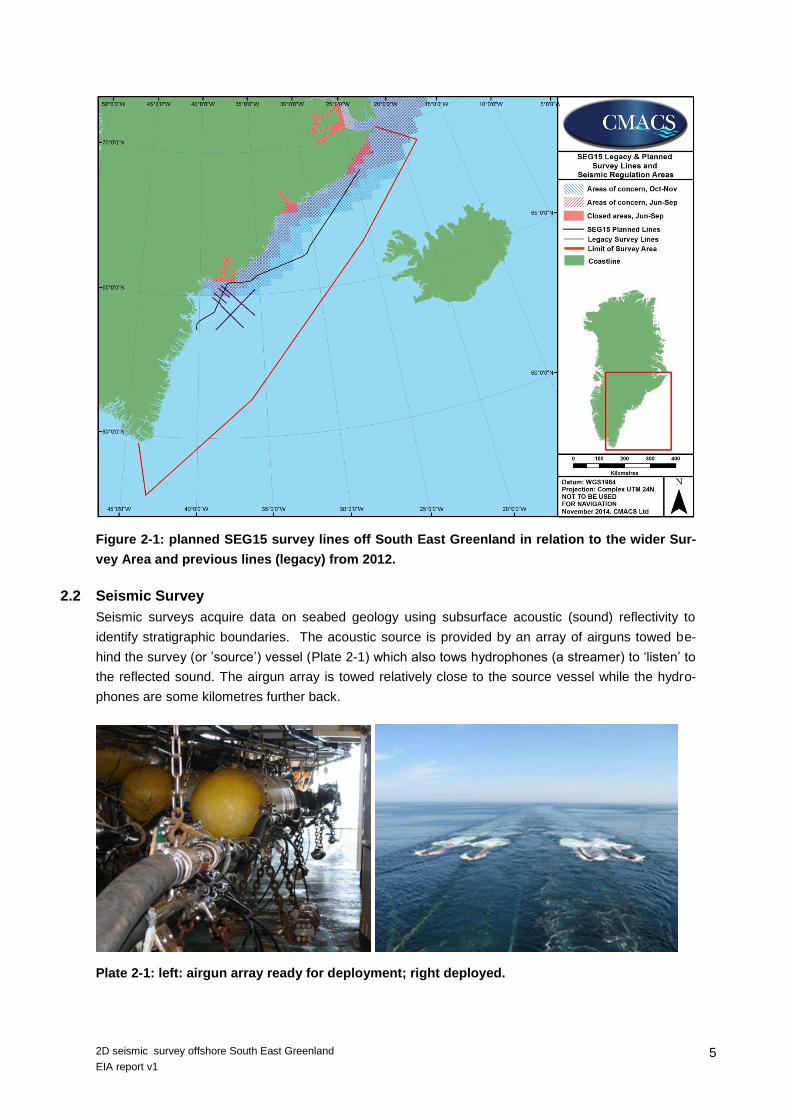
Figure 2-1: planned SEG15 survey lines off South East Greenland in relation to the wider Sur-
vey Area and previous lines (legacy) from 2012.
2.2 Seismic Survey
Seismic surveys acquire data on seabed geology using subsurface acoustic (sound) reflectivity to
identify stratigraphic boundaries. The acoustic source is provided by an array of airguns towed be-
hind the survey (or ’source’) vessel (Plate 2-1) which also tows hydrophones (a streamer) to ‘listen’ to
the reflected sound. The airgun array is towed relatively close to the source vessel while the hydro-
phones are some kilometres further back.
Plate 2-1: left: airgun array ready for deployment; right deployed.

6 2D seismic survey offshore South East Greenland
EIA report v1
There are a number of types of seismic survey. The one proposed off South East Greenland is
termed a two-dimensional (2D) survey. In this type of survey, seismic data (i.e. information on seabed
geology, here relating in particular to hydrocarbon resource potential) is acquired from a series of
relatively widely spaced survey lines. This type of survey contrasts with more intensive surveys such
as 3D and Vertical Seismic Profiling (VSP). This is an important point in relation to the EIA since it
means that any environmental effects at a given location will be very short term and not repeated. In
contrast, the survey will take place over a relatively large area and thus has potential to affect a wider
area, albeit less intensively.
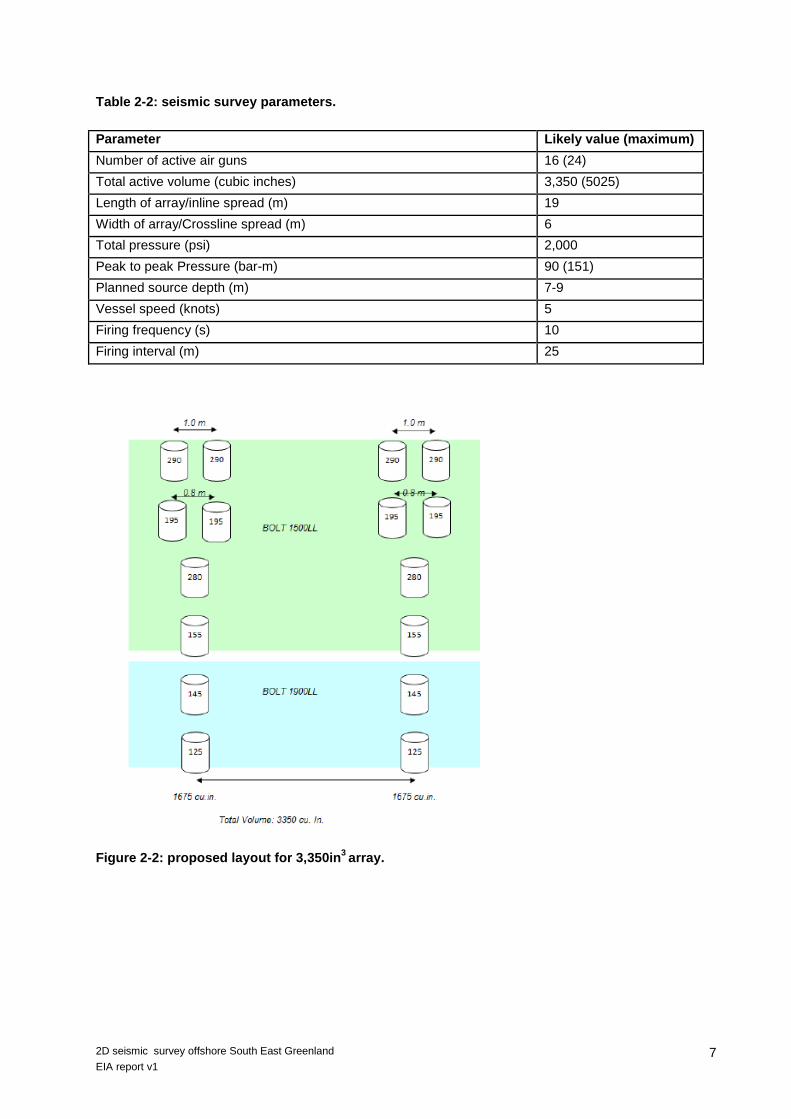
Key parameters for the airgun array are provided in Table 2-2. TGS intend to conduct the survey
using an array of 16 bolt guns totalling 3,350 cubic inches and with a total pressure of 2000psi, each
gun having equal pressure. A smaller 1,675 cubic inch array will also be available during the survey
and could potentially be simultaneously deployed providing a total of 5,025 cubic inches. The planned
layout for the main array is a double string, each line having 8 individual guns (Figure 2-2). A break-
down of the individual gun volumes is provided in Table 2-3.
The source array will be deployed from the stern of the vessel, usually at less than 250m distance,
with the depth of the source between 8-12m from the surface. The signals are received by the hydro-
phones in streamers that are also deployed from the seismic vessel. Streamers are up to 8km in
length. Only one streamer will be used and this will be solid (not fluid filled).
Reflected sound from the airguns that is received by the hydrophones will be analysed to provide
information on geological targets between 500 and 10,000m below the seabed. This is relatively
deep seismic imaging but the SEG15 and other surveys planned off Greenland are regional and one
of their main goals is to map sedimentary basins. These basins are very deep, so deep seismic imag-
ing is necessary.
The vessel will conduct the survey whilst transiting at approximately 5 knots with a firing interval of 10
seconds (approximately every 25m). The survey vessel is intended to be operational 24 hours a day
except in periods when weather or ice conditions do not allow for data acquisition.
7 2D seismic survey offshore South East Greenland
EIA report v1
Table 2-2: seismic survey parameters.
Parameter Likely value (maximum)
Number of active air guns 16 (24)
Total active volume (cubic inches) 3,350 (5025)
Length of array/inline spread (m) 19
Width of array/Crossline spread (m) 6
Total pressure (psi) 2,000
Peak to peak Pressure (bar-m) 90 (151)
Planned source depth (m) 7-9
Vessel speed (knots) 5
Firing frequency (s) 10
Firing interval (m) 25
Figure 2-2: proposed layout for 3,350in3 array.

8 2D seismic survey offshore South East Greenland
EIA report v1
Figure 2-3: Layout for 1675in3 array.
Table 2-3: individual gun volumes for 3,350in3 array.
String 1 String 2
Gun Volume (in3) Gun Volume (in
3)
1.1 250 2.1 250
1.2 250 2.2 250
1.3 195 2.3 195
1.4 195 2.4 195
1.5 280 2.5 280
1.6 155 2.6 155
1.7 145 2.7 145
1.8 125 2.8 125

9 2D seismic survey offshore South East Greenland
EIA report v1
2.3 Logistics
2.3.1 Vessels proposed
The vessels identified below and in Plate 2-2 are those considered most likely to be used at this stage
of survey planning. Alternative vessels may be used but this would not result in significant change to
identified survey parameters.
The proposed acquisition vessel (i.e. towing the airgun and hydrophone arrays) is the M/V Akademik
Shatskiy. This primary vessel will be supported by another vessel (e.g. M/V Kvitbjørn).
Plate 2-2: proposed survey vessels: top, Akademik Shatskiy (source vessel); bottom, Kvitbjørn
(chase vessel).
The vessels all have comprehensive safety systems and are required to meet stringent standards to
work for leading companies in the oil industry.
10 2D seismic survey offshore South East Greenland
EIA report v1
The initial port of mobilisation is planned to be Tromsø in Norway. There will be the option to use
Bergen (Norway), Longyearbyen (Svalbard) or Reykjavik (Iceland) if the vessel requires a port at any
stage. There are no initial plans for crew change but if one is required this will be done in either Long-
yearbyen or Rekjavik depending on logistics and availability. Any crew changes will be facilitated by
the MSV Kvitbjorn. A helicopter will be available during the project but is expected to be used rarely.
No bunkering (refuelling) or resupplying arrangements are currently planned; it is believed that the
vessels will be sufficiently supplied to complete the survey.
2.3.2 Anticipated energy requirements
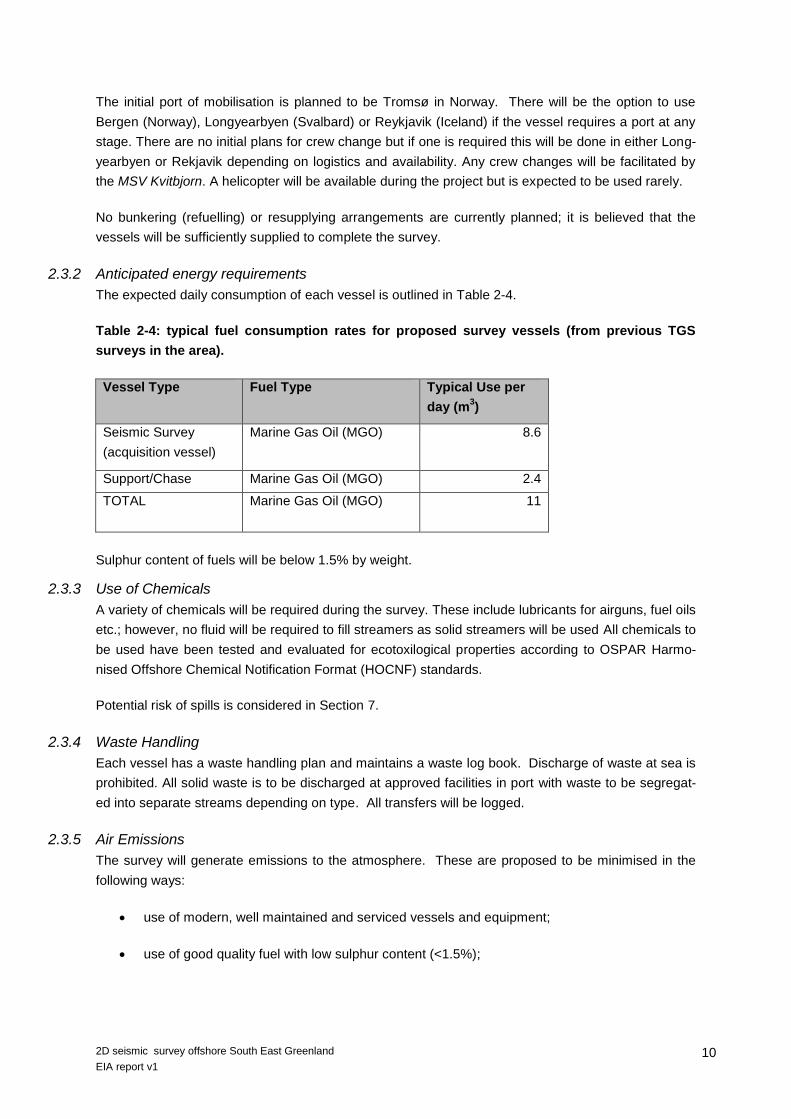
The expected daily consumption of each vessel is outlined in Table 2-4.
Table 2-4: typical fuel consumption rates for proposed survey vessels (from previous TGS
surveys in the area).
Vessel Type Fuel Type Typical Use per
day (m3)
Seismic Survey
(acquisition vessel)
Marine Gas Oil (MGO) 8.6
Support/Chase Marine Gas Oil (MGO) 2.4
TOTAL Marine Gas Oil (MGO) 11
Sulphur content of fuels will be below 1.5% by weight.
2.3.3 Use of Chemicals
A variety of chemicals will be required during the survey. These include lubricants for airguns, fuel oils
etc.; however, no fluid will be required to fill streamers as solid streamers will be used All chemicals to
be used have been tested and evaluated for ecotoxilogical properties according to OSPAR Harmo-
nised Offshore Chemical Notification Format (HOCNF) standards.
Potential risk of spills is considered in Section 7.
2.3.4 Waste Handling
Each vessel has a waste handling plan and maintains a waste log book. Discharge of waste at sea is
prohibited. All solid waste is to be discharged at approved facilities in port with waste to be segregat-
ed into separate streams depending on type. All transfers will be logged.
2.3.5 Air Emissions
The survey will generate emissions to the atmosphere. These are proposed to be minimised in the
following ways:
use of modern, well maintained and serviced vessels and equipment;
use of good quality fuel with low sulphur content (<1.5%);

11 2D seismic survey offshore South East Greenland
EIA report v1
minimising vessel speed (outside of survey which will be limited to 5 knots) wherever possible
to maximise fuel economy;
minimising use of engine while at berth during any port calls (although none are planned in
Greenland).
2.3.6 Discharges to Water
Oil discharge to water is expected to be minimal and oil leak management systems are in place.
Specific communications procedures will be in place to report any oil spill events to local coastal au-
thorities.
Potential risk of fuel and oil spills is considered in Section 7. Sewage is only discharged in compliance
with MARPOL (Annex IV Prevention of Pollution by Sewage from Ships).
Bilge water is only discharged in compliance with MARPOL (Annex I Regulations for the Prevention of
Pollution by Oil).
Any ballast discharges will comply with IMO (Resolution MEPC.127(53)) and OSPAR (D1 Ballast
Water Exchange) guidelines.
2.3.7 Alternative Project Options
There are no viable alternatives for collection of seismic data from this location.
The lower volume (and quieter) airgun array will be used wherever this is sufficient to obtain data of
the required quality.
The data collected will be utilised by multiple clients. This in itself represents a potentially significant
environmental benefit by minimising replicated surveys.
2.3.8 Built in mitigation
In addition to the good environmental practice detailed in sections 2.3.3 to 2.3.7 the following mitiga-
tion detailed in Table 2-5 will be followed and is assumed when environmental effects of the proposed
operations are considered in Section 7.
12 2D seismic survey offshore South East Greenland
EIA report v1
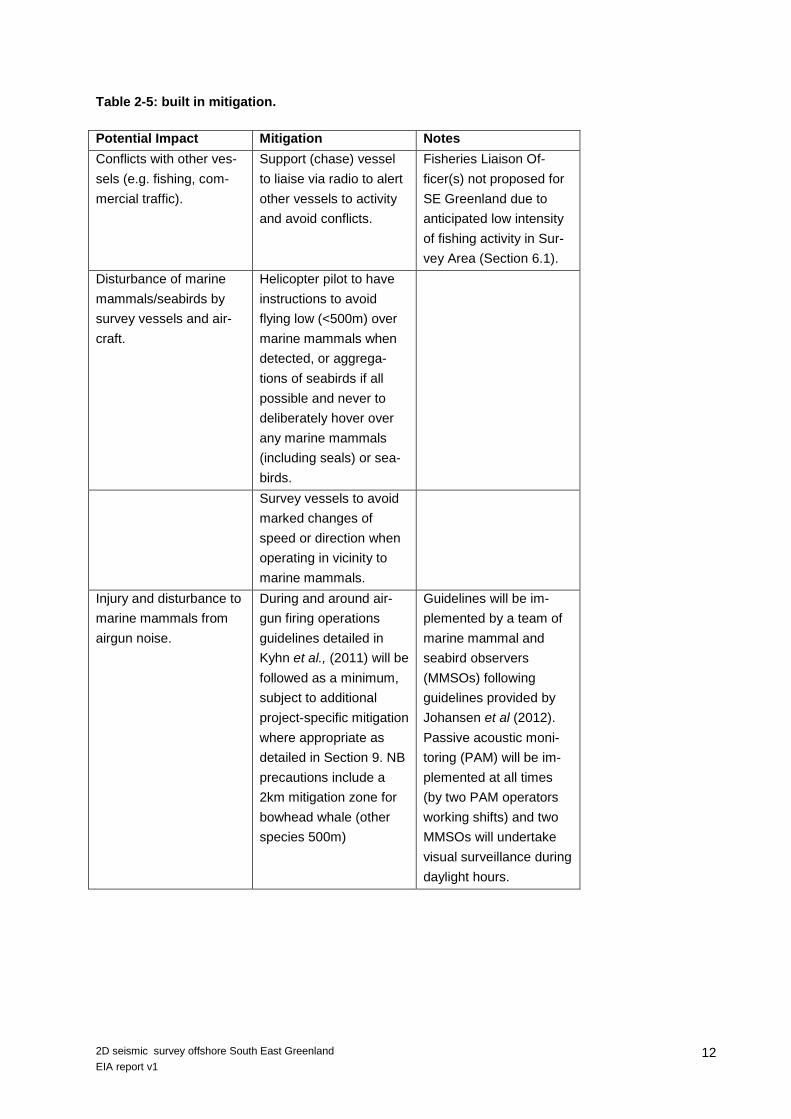
Table 2-5: built in mitigation.
Potential Impact Mitigation Notes
Conflicts with other ves-
sels (e.g. fishing, com-
mercial traffic).
Support (chase) vessel
to liaise via radio to alert
other vessels to activity
and avoid conflicts.
Fisheries Liaison Of-
ficer(s) not proposed for
SE Greenland due to
anticipated low intensity
of fishing activity in Sur-
vey Area (Section 6.1).
Disturbance of marine
mammals/seabirds by
survey vessels and air-
craft.
Helicopter pilot to have
instructions to avoid
flying low (<500m) over
marine mammals when
detected, or aggrega-
tions of seabirds if all
possible and never to
deliberately hover over
any marine mammals
(including seals) or sea-
birds.
Survey vessels to avoid
marked changes of
speed or direction when
operating in vicinity to
marine mammals.
Injury and disturbance to
marine mammals from
airgun noise.
During and around air-
gun firing operations
guidelines detailed in
Kyhn et al., (2011) will be
followed as a minimum,
subject to additional
project-specific mitigation
where appropriate as
detailed in Section 9. NB
precautions include a
2km mitigation zone for
bowhead whale (other
species 500m)
Guidelines will be im-
plemented by a team of
marine mammal and
seabird observers
(MMSOs) following
guidelines provided by
Johansen et al (2012).
Passive acoustic moni-
toring (PAM) will be im-
plemented at all times
(by two PAM operators
working shifts) and two
MMSOs will undertake
visual surveillance during
daylight hours.
13 2D seismic survey offshore South East Greenland
EIA report v1
3 PHYSICAL ENVIRONMENT
Sea ice is present in the Survey Area along the coast during the year, with winter ice beginning to
form in the northern region of the Licence Area in October/November and being present until
June/July. Fast ice usually forms in coastal areas along most of the south east coast of Greenland for
part of the winter but ice formation is later and breakup earlier than in more northern areas. Icebergs
and drift ice are present throughout the Survey Area all year round. The physical conditions that occur
as a result of sea ice break-up create a relatively stable water column allowing short but intense levels
of primary production to fuel the higher biological processes in the area (Boertmann & Mosbech (eds),
2011).
In this region the East Greenland Current (EGC) brings cold, low salinity waters from the Arctic down
into the North Atlantic along the south east coast of Greenland (Boertmann & Mosbech (eds), 2011;
Frederiksen et al., 2012). This current also transports icebergs south and is responsible for well strati-
fied surface water columns created due to a strong salinity based gradient (Coachmann & Aagaard,
1974).
3.1 Climate
Due to the proximity to the High Arctic, with some of the survey being within this zone, temperatures
in the northern region of the Survey Area (around Ittoqqortoormiit) do not generally rise above 5-6oC
in the summer and winter temperatures in the north of the survey area drop below -20oC (Danish
Meterological Institute, 2012). At Uummannarsuaq the summer maximum temperature is average
around 14oC in July with the average winter minimum temperature being in the region of -8
oC .
In winter a strong area of high pressure usually exists over most of North Greenland, resulting in pre-
vailing northerly winds over parts of Greenland. A low pressure area spreading from Newfoundland,
across Greenland and Iceland, to the Norwegian Sea causes an area of frequent cyclonic activity;
during such winter storms wind speeds can reach 110mph (Przybylak, 2003; Hansen et al., 2004).
These winds tend to approach from the south and bring warmer air and precipitation (Hansen et al.,
2004).
In summer the pressure gradient around Greenland is low and there are no substantial prevailing
winds. April tends to have the most settled weather but cyclones can occur anywhere in the Green-
land area during periods of low pressure. The North Atlantic wind patterns also influence much of the
east coast of Greenland’s weather patterns, more southerly regions are subject to cyclone activity and
strong storms (Hansen et al., 2004).
3.2 Bathymetry
There is little specific bathymetric data available for the area around South East Greenland. The con-
tinental shelf varies in width; to the north around Ittoqqortoormiit the shelf extends less than 100km
from the coastline while further to the south the Greenland Shelf and the Iceland Shelf extend to meet
each other to form the Iceland-Greenland ridge (Figure 3-1: ). This results in a shelf between the Arc-
tic Ocean and the North Atlantic which substantially affects water flow between these two oceans.
Here the Greenland Shelf extends to almost 300km from the coast.
Towards Uummannarsuaq, in the southern extent of the Survey Area, the continental shelf becomes
much narrower, less than 50km wide in places.

14 2D seismic survey offshore South East Greenland
EIA report v1
Figure 3-1: bathymetry of the south east coastline, the northern yellow box shows the Iceland-
Greenland Shelf, the southern yellow box shows an area of sea mounts and the red outline
designates the Survey Area.
The Survey Area is mainly within the shallower water overlying continental shelf around 64oN
37o30’W. The eastern most extent of the survey area extends beyond the continental slope and over
a small area of the abyssal plain (General Bathymetric Chart of the Oceans, 2008) (cf. Figure 3-1: ).
3.3 Oceanography
The waters around Greenland, particularly north Greenland, are important areas of surface cooling
that create a cold dense mass of water known as the North Atlantic Deep Water (NADW). This water
sinks and it is understood to be the origin of a major thermohaline circulation system referred to as the
global ocean conveyor belt. This system helps to provide the deep abyssal areas with oxygenated
water and the movements prevent the oceans becoming permanently stratified and turning stagnant
(Knauss, 1996).
Many of the surface layer oceanographic processes in the Greenland coastal region occur due to the
presence of the East Greenland Current (EGC). This is a current that is formed in the Arctic by the
cooling of warmer northerly flowing North Atlantic Water (NAW) that is taken into the Arctic by the
Norwegian Atlantic Current. Warmer water enters the Greenland Sea Gyre where it undergoes cool-
ing through contact with the Arctic Ocean and associated sea ice. Cold fresh-water run-off from sea
ice creates stratified low salinity surface waters (Polar Surface Water), whilst cooled higher saline
waters sink to create the cold deep water mass of the NADW (Boertmann & Mosbech (eds), 2011).

15 2D seismic survey offshore South East Greenland
EIA report v1
Water from the North Pacific also enters the Arctic through the Bering Strait and intermingles before
being incorporated into the EGC. The low salinity, cold waters of the EGC are then transported south
along the east coast of Greenland before entering the North Atlantic (Bacon et al., 2002).
The Greenland-Iceland ridge lies within the Survey Area. It is an area where the two continental
shelves meet forming a rise of the seafloor between Iceland and Greenland. This has a substantial
influence on ocean currents, particularly on deep water flowing between the Arctic Ocean basin and
the North Atlantic. The maximum depth is 300m and a substantial change in deep water temperatures
results. To the North of the ridge bottom water temperature has been reported as -1oC while to the
south it is around +8oC (Bolshaya Sovetskaya Entsiklopediya, 1979).
Surveys off the south east coast of Greenland have suggested that around here the EGC is 15km
wide, 100m deep and centred roughly 10km offshore with salinity around 4 psu lower than surround-
ing waters (Bacon et al., 2002). Sea temperature differences between water off the west coast of Ice-
land and the EGC have been demonstrated to change by as much 7oC over short distances (Hanna
et al., 2002), thus setting up a steep thermal gradient.
The EGC and Irminger currents are important influences in the oceanographic conditions of the area
(Figure 3-2). The Irminger Current is a branch of the North Atlantic Current that separates and travels
to the west of Iceland due to a seabed ridge. Here, the Irminger Current branches into separate nor-
therly and southerly flows. The southern branch follows the EGC parallel to the Greenland coast back
to the North Atlantic whilst the North current is incorporated into the southward flowing EGC
(Frederiksen et al., 2012).
The Irminger current has a higher salinity (around 34 psu) and higher temperature (4-6oC) than the
EGC this creates a definitive front between the two water masses (Gyory et al., 2008).
Freshwater runoff from sea ice melt and terrestrial sources along the coast of Greenland in summer
months add to the cold, low salinity nature of the Greenland coastal waters. These waters become
stratified and relatively stable, particularly around the ice edges, and create a stable oceanographic
surface layer for phytoplankton blooms to occur, protected from mixing by the severity of the gradients
and sea ice. It is likely that at hydrodynamic discontinuities regions such as the EGC/ Irminger front,
upwelling occurs bringing nutrients into the surface waters from colder, more nutrient rich deep water,
allowing phytoplankton blooms to occur (Boertmann & Mosbech (eds), 2011).

16 2D seismic survey offshore South East Greenland
EIA report v1
Figure 3-2: major sea surface currents around Greenland (Boertmann & Mosbech (eds), 2011)
3.4 Ice Conditions
Sea ice formation and depletion is an important feature in the Arctic, resulting in crucial oceanograph-
ic processes both regionally and globally. In winter, when sea ice forms in the region, the freezing of
surface waters creates a hypersaline layer of cold dense water that then sinks to form NADW, which
then forms the major thermohaline current that drives global deep water movements through all the
world’s oceans.
Regionally, biological processes in and around the Arctic Circle have adapted to cope with long peri-
ods of ice cover. Some species of seals and the polar bear are dependent on sea ice formation for
breeding and for hunting, whilst many species are dependent on the spring break-up. The formation
and depletion of sea ice also has important impacts on the coastal oceanographic process by altering
thermohaline profiles, stabilising the water column by creating hydrographical discontinuities and cre-
ating localised areas of upwelling, which are important for local biological production. The sea ice
physically stabilises the underlying water by preventing/reducing the effects of wind driven mixing on
the surface layers (Boertmann & Mosbech (eds), 2011; National Snow & Ice Data Center, 2013).

17 2D seismic survey offshore South East Greenland
EIA report v1
Two main ice conditions may occur in the Survey Area: fast ice and drift ice. Fast ice forms in coastal
areas, this is ice that forms off the land and is a stable (anchored) platform (Boertmann & Mosbech
(eds), 2011). Fast ice is permanent in some areas of Northern Greenland but in the Survey Area it
tends to begin around September in the north while to the south ice formation will more likely occur
later in the year, probably in October or November. Fast ice conditions could therefore potentially
occur towards the end of the survey period; however, no ice breaker is planned and such ice for-
mation would restrict the survey in affected areas.
The second type of ice is drift ice, comprising various types of ice, mainly sea ice transported south
from the Arctic on the EGC. Icebergs are also transported southwards from various calving grounds.
Drift ice is dynamic as it moves with surface currents, tending to run along the edge of any fast ice.
The density of drift ice is dependent on the volume of sea ice being transported or formed, and cur-
rents (Boertmann & Mosbech (eds), 2011). It is likely some form of drift ice will be present in the Sur-
vey Area throughout the year although there can be marked annual variability in conditions.
Shear zones can form between the more stable, permanent fast ice and drift ice. These zones tend to
manifest as large cracks in the ice coverage that create areas of open water. These areas can be
significant in terms of biological production, acting in a similar way to polynyas. In these areas the
water column tends to be stable for phytoplankton production. It provides areas where marine mam-
mals can breathe in otherwise ice covered areas of water (Boertmann & Mosbech (eds), 2011).
Polynyas are areas where local currents move the water sufficiently to prevent the surface from freez-
ing and are often the sites of fluvial inputs. They are important both biologically and oceanographical-
ly. In terms of local oceanographic processes they are thought to be important areas of thermal loss
as sea ice is not present to act as an insulator, and because they are often sites of freshwater input
the temperature and salinity differences can cause localised water movements. In some polynyas, ice
formation never occurs, but where it does it is usually later in the year and the ice breaks up earlier
the following spring. This extends the time of biological productivity in the polynya, especially its use
by marine mammals whereas winter ice forms the polynyas become important areas for marine
mammals as they provide access to the surface for breathing (Boertmann & Mosbech (eds), 2011;
National Snow & Ice Data Center, 2013). The only major polynya in the area is the Ittoqqortoormiit
Sound which borders the northern limit of the Survey Area.
Within the Survey Area itself the majority of ice near to the coast is drift ice, with some areas of very
close drift ice and some coastal patches of open drift ice. Between the close drift ice and the open
waters an area of very open drift ice is often present (Norwegian Meteorological Institute, 2013). The
coastal areas of open drift ice enclosed by closed drift ice are likely to act in a similar way to polynyas
and shear zones in that they create areas that marine mammal can breathe in otherwise ice covered
areas. Ice conditions as of 15 August 2012 are shown in Figure 3-3.

18 2D seismic survey offshore South East Greenland
EIA report v1
Figure 3-3: Monthly sea ice cover in 2010. Red and magenta indicates dence sea ice. Yellow
incidates loose sea ice (DCE, 2012).

19 2D seismic survey offshore South East Greenland
EIA report v1
3.5 Baseline Chemical and Pollution Levels
There have been various studies into baseline pollution levels in the Greenland marine environment.
Dietz et al., (1996) concluded that lead levels in marine organisms were low but mercury, cadmium
and selenium, levels exceeded Danish food standard limits, although no conclusion as to geographic
sources could be drawn (Boertmann & Mosbech (eds), 2011) except that in general cadmium levels
were higher in Northwest Greenland.
An increasing trend of heavy metal contamination has been found in some animals, this is highest in
marine mammals in Central West and North West of Greenland (Dietz, 2008). Due to metals accumu-
lating through the environment, the top trophic levels tend to accumulate heavy metals in their tissues;
this includes humans consuming contaminated animals.
Persistent Organic Pollutant (POPs) tend to be lower in Arctic waters than in more temperate regions,
presumably due to the reduced level of industry and boat traffic, however, accumulations could still be
a potential risk to higher trophic predators (Boertmann & Mosbech (eds), 2011). Higher levels of
POPs have been recorded in polar bears, Greenland halibut and Greenland sharks (Somniosus mi-
crocephalus). PCBs are a major element to those POPs recorded in higher trophic levels.
Specific contaminant knowledge in the proposed survey area is limited although it does show that
there tends to be higher levels of contaminants, particularly heavy metals, on the western side of
Greenland, possibly reflecting a higher level of industry on this side.

20 2D seismic survey offshore South East Greenland
EIA report v1
4 PROTECTED AREAS AND VALUED ECOSYSTEM COMPONENTS
In the following, the protected areas near and within the Survey Area is presented, followed by the
identified value ecosystem components (VEC) assumed to be present within the Survey Area.
4.1 Protected Areas
There are protected areas within the Survey Area for narwhal (Monodon monoceros) and Bowhead
whale (Balaenoptera mysticetus) as well as important areas for seabirds with numerous breeding and
moulting sites. The breeding and moulting areas are important for several species including eider
(Somateria ssp.), ivory gull (Pagophila eburnea) and fulmar (Fulmarus ssp.). Polynyas and ice edges
are likely to be important areas but no specific protection areas have been designated (Figure 4-1).
Figure 4-1: SEG15 Survey Area in relation to protected areas (including narwhal closed areas)
for wildlife (marine mammals and birds).
4.2 Summary of Valued Ecosystem Components (VECs)
In order to identify potential interactions between petroleum activities and ecosystem components the
concept of valued ecosystem components (VEC) has been developed. VECs have not been specifi-
cally identified in the South East Greenland Area. The following assessment is based on sensitivities
and criteria from the NERI SEIA for East Greenland, 2011 (Boertmann & Mosbech (eds), 2011).
VECs can be species, population, biological events or other environmental features that are important
to the human population (not only economically), have a national or international profile, can act as
indicators of environmental change or can be the focus of management or other administrative efforts.
The VECs selected are species which potentially can be impacted by hydrocarbon related activities in
the assessment area including exploration activities like seismic surveys and drilling. They also in-
21 2D seismic survey offshore South East Greenland
EIA report v1
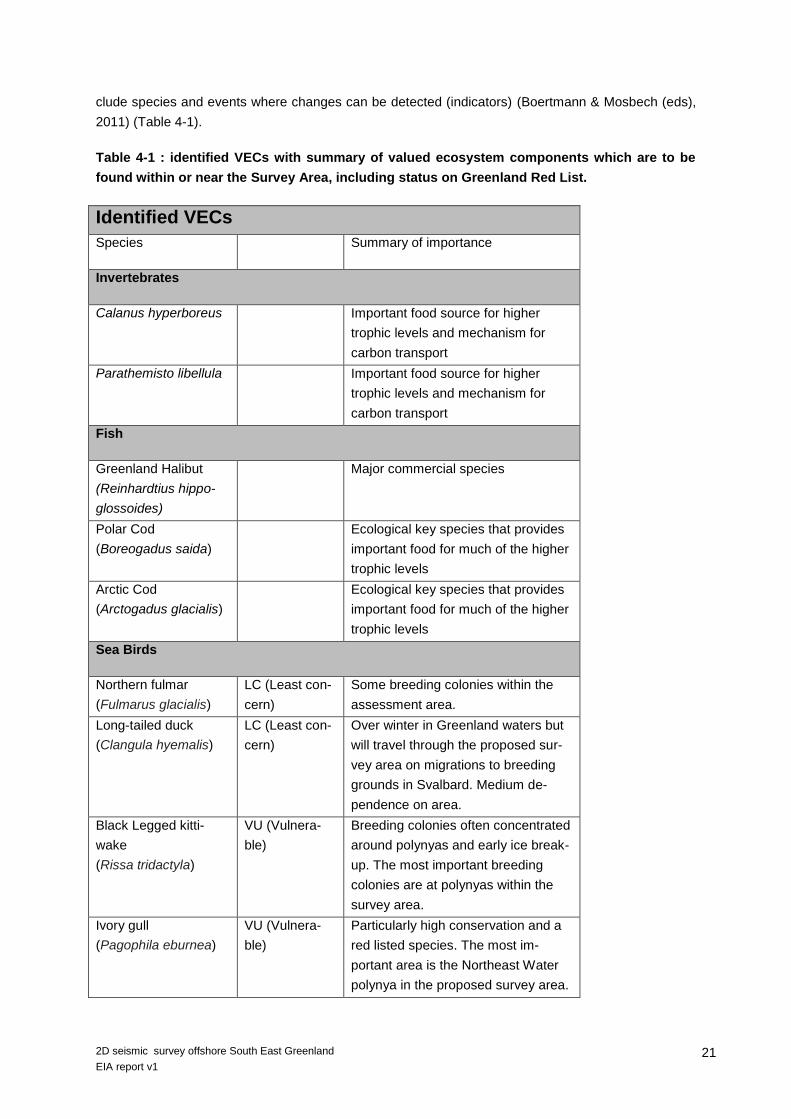
clude species and events where changes can be detected (indicators) (Boertmann & Mosbech (eds),
2011) (Table 4-1).
Table 4-1 : identified VECs with summary of valued ecosystem components which are to be
found within or near the Survey Area, including status on Greenland Red List.
Identified VECs
Species Summary of importance
Invertebrates
Calanus hyperboreus Important food source for higher
trophic levels and mechanism for
carbon transport
Parathemisto libellula Important food source for higher
trophic levels and mechanism for
carbon transport
Fish
Greenland Halibut
(Reinhardtius hippo-
glossoides)
Major commercial species
Polar Cod
(Boreogadus saida)
Ecological key species that provides
important food for much of the higher
trophic levels
Arctic Cod
(Arctogadus glacialis)
Ecological key species that provides
important food for much of the higher
trophic levels
Sea Birds
Northern fulmar
(Fulmarus glacialis)
LC (Least con-
cern)
Some breeding colonies within the
assessment area.
Long-tailed duck
(Clangula hyemalis)
LC (Least con-
cern)
Over winter in Greenland waters but
will travel through the proposed sur-
vey area on migrations to breeding
grounds in Svalbard. Medium de-
pendence on area.
Black Legged kitti-
wake
(Rissa tridactyla)
VU (Vulnera-
ble)
Breeding colonies often concentrated
around polynyas and early ice break-
up. The most important breeding
colonies are at polynyas within the
survey area.
Ivory gull
(Pagophila eburnea)
VU (Vulnera-
ble)
Particularly high conservation and a
red listed species. The most im-
portant area is the Northeast Water
polynya in the proposed survey area.

22 2D seismic survey offshore South East Greenland
EIA report v1
Identified VECs
Arctic tern
(Sterna paradisaea)
NT (Near
threatened)
Breeding colonies along the coast.
Marine Mammals
Polar Bear
(Ursus maritimus)
VU (Vulnera-
ble) National
responsibility
species
Significant proportion of the global
population occur within/near the as-
sessment area and the species has a
high national and international con-
servation value. They are globally
endangered and globally and nation-
ally endangered. They are also of
high value for local hunters within the
survey area. Areas of particular im-
portance are ice edges and polynyas.
Walrus
(Odobenus rosmarus)
NT (Near
threatened)
No specific important areas within the
assessment area but species proba-
bly has a medium dependency on
this area. It is an important resource
for local communities and has a fa-
vourable conservation status.
Hooded seal
(Cystophora cristata)
LC (Least con-
cern)
Whelping patches on drift ice within
the area between March and April.
Outside this period no important are-
as are known.
Harp seal
(Pagophilus groen-
landicus)
LC (Least con-
cern)
Whelping patches on drift ice within
the proposed survey area between
March and April. Outside this no spe-
cific areas of importance are known.
Bearded seal
(Erignathus barbatus)
DD (Data defi-
cient)
Whelping on drifting ice in April/May.
Ringed seal
(Pusa hispida)
LC (Least con-
cern)
Ecological key species within the
proposed survey area. There are no
areas of particular importance but it
is an important resource to the town
of Ittoqqortoormiit.
Bowhead whale
(Balaena mysicetus)
NT (Near
threatened)
Extreme rarity and vulnerability to
significant population disturbance.
They are known to be present in the
proposed survey area but no specific
areas of concentration are known.
Critically endangered and red listed
species.

23 2D seismic survey offshore South East Greenland
EIA report v1
Identified VECs
Blue whale
(Balaenoptera muscu-
lus)
DD (Data defi-
cient)
Despite some signs of recovery blue
whales are globally endangered. The
proposed area is a known area used
by blue whales but frequency and
density is unknown.
Narwhal
(Monodon monoceros)
DD (Data defi-
cient)
Globally endangered and general
conservation concern for the popula-
tion. An important socio-economic
species for Greenland for indigenous
hunting and eco-tourism.
White Whale
(Delphinapterus leu-
cas)
CR (Critically
endangered)
Critically endangered and specialized
habitats mean that this species is
vulnerable to disturbance.
North Atlantic Right
Whale
(Eubalaena glacialis)
CR (Critically
endangered)
Critically endangered, thought to
have some dependence on the area.
Habitats
Halibut fishing grounds Important for commercial fishing rea-
sons
Arctic Char rivers Important environment due to socio-
economic and conservation value of
Arctic char.
Polynyas Highly important environments
providing food and breathing holes
for numerous elements of the regions
ecology.
Recurring ice edges Important from an ecological point of
view as facilitates migrations, breed-
ing and predation.
Marginal Ice Zone Important area for productivity, ani-
mal movements and predation.

24 2D seismic survey offshore South East Greenland
EIA report v1
5 BIOLOGICAL ENVIRONMENT
5.1 Benthic ecology
Benthic communities are composed of both flora (plant life) and fauna (animals). The latter includes
those that live within seabed sediments (infauna), those of the seabed surface (epifauna) and those
between individual substrate particles (interstitial fauna). The Arctic benthic community is affected by
a multitude of different biological and physical parameters; with temperature, depth, food input, sedi-
ment composition, disturbance level (e.g. ice scouring) and hydrographical regime being the most
prominent (e.g. Piepenburg 2005).
Benthic flora is restricted to shallow, sunlit waters and is ecologically important for a numbers of rea-
sons: provision of substrate, shelter and protection and as a direct food source (Bertness et al., 1999,
Lippert et al., 2001). Faunal communities do not rely on sunlight so directly and so tend to be more
widespread and are often heterogeneous on both local and regional scales. There is often an expo-
nential decline with depth associated with this zonation along a shelf-slope-basin gradient (Piepen-
burg, 2005). The dominant groups of infauna in Greenlandic waters are polychaetes and bivalves
whilst tunicates, sea anemones and bryozoans dominate sedentary epifauna and shrimp, crabs and
echinoderms dominate free-living epifauna (Greenland Institute of Natural Resources, 2003).
The benthic communities of the Greenland Shelf have been shown to be rich in terms of both biomass
and diversity (Brandt and Piepenburg 1994, Piepenburg and von Juterzenka 1994). It is thought that
rich communities in the area are sustained by seasonal primary production and the regeneration of
nitrogen and organic carbon via pelagic-benthic coupling (Brandt 1995, Carey 1991 and Graf 1992).
The spring phytoplankton bloom therefore, is important for benthic communities. The low tempera-
tures within the region reduces energy demand of benthic species and decomposition of organic con-
tent is slow allowing for a relatively high biomass to exist despite the high seasonality of primary pro-
duction (Sejr and Christensen, 2007). Benthic biomass has been found to be higher in areas of open
water surrounded by sea ice, called polynyas (Piepenburg et al, 1997).
Shallow coastal regions are likely to be of particular importance as these areas with high densities of
benthos, particularly those in shallow waters are often important feeding grounds for marine mammals
and seabirds e.g. walrus (Odobenus rosmarus) (Born et al. 2003), bearded seal (Erignathus barbatus)
(Hobson et al. 2002) and eider (Somateria ssp.) (Richman and Lovvorn 2003).
There have been very few direct studies and so there is little specific knowledge on the benthic com-
munities within the Survey Area along the south east coast of Greenland. Most of the proposed Sur-
vey Area is in the sub-Arctic, below 66º 33’ latitude which marks the Arctic Circle. It is reasonable to
assume that there is not a distinct change between the two areas in coastal regions but it is likely that
there will be a latitudinal transition in benthic communities influenced by temperature and ice cover.
Typical benthic communities in the Arctic regions are dominated in the main by polychaete worms and
bivalves with bivalves most notable at depths of 0-50m (e.g. species belonging to the genuses Ma-
coma and Astarte) (Greenland Institute of Natural Resources, 2003).
5.2 Pelagic ecology
The pelagic communities off south east Greenland are highly seasonal, constrained by seasonal ice
coverage driven by temperature and strong hydrographic regimes. Cold waters from the Arctic Basin

25 2D seismic survey offshore South East Greenland
EIA report v1
are transported along the southeast coast of Greenland by the East Greenland Current (EGC) which
flows south over the Greenland shelf into the North Atlantic (UNEP, 2004). Warmer waters are trans-
ported to the area from the south by a branch of the North Atlantic Current, the Irminger Current. The
most important permanent stratification mechanism is a strong salinity gradient (Carmack &
Wassmann, 2006).
Sea ice plays a decisive role for marine productivity and life in Arctic Greenland (e.g., Rysgaard et al.,
2003). Rather than controlling pelagic production directly, temperature acts indirectly to affect sea ice
cover and therefore the length of the productive open sea water period (Rysgaard et al., 1999). Such
oceans generally have a brief and intense phytoplankton bloom immediately after ice break-up, char-
acterized by high (transient) biomass and a grazing food web dominated by large copepods.
Phytoplankton are the primary producers in the food web and provide the energetic input for annual
growth through photosynthesis in the epipelagic zone. The seasonal phytoplankton bloom is a crucial
element driving the local food web of southeast Greenland, as with other Arctic regions. The spring
bloom typically commences by late April, on the start of ice melt, and develops throughout May and
June (Boertmann et al., 2009a; Söderkvist et al., 2006). The spring bloom can often occur earlier at
the edges of the sea-ice than in open water, where the ice cover has resulted in a more stable water
column. The spring bloom generally moves from the south to the north as the ice melts. It has been
shown that, following a phytoplankton bloom, growth rates of pelagic secondary producers normally
become food limited (Kiørboe & Nielsen 1994). Thus, prolonged ice-free periods and ensuing high
rates of pelagic primary production are expected to lengthen the growth season of secondary produc-
ers and thereby increase production and abundance.
The spring bloom is typically dominated by diatoms (Richardson et al., 2005), while flagellates includ-
ing Phaeocystis tend to be more abundant later in the summer - recorded at up to 98% of the phyto-
plankton biomass (Bauerfeind et al., 1994). In the period from May to August, subsurface phytoplank-
ton peaks are a persistent feature and up to 90% of total water column particulate production is esti-
mated to occur in association with these peaks (Richardson et al., 2005). After the spring bloom
where silicate or nitrate become depleted from the surface layer due to stratification, phytoplankton
biomass is reduced and dominated by autotrophic flagellates (Boertmann et al., 2009a).
Zooplankton has an important role within marine food webs since it provides the principal pathway to
transfer energy from primary producers (phytoplankton) to consumers at higher trophic levels (e.g.
fish and marine mammals). Regeneration of nitrogen through excretion by zooplankton is crucial for
bacterial and phytoplankton production and the seasonal input of organic carbon has a direct effect on
benthic communities via pelagic-benthic coupling (Graf, 1992 and Carey, 1991). Grazing zooplankton
communities are expected to mirror phytoplankton populations but with a slight time lag. As ice re-
cedes in spring the zooplankton biomass will increase in response to the phytoplankton blooms at the
ice edge as it breaks up.
Generally, zooplankton concentrations are expected to be highest in the upper 500m where food
source is high. However, the predominating Calanus species show large scale seasonal vertical mi-
grations from surface to deeper layers for overwintering (Mumm et al. 1998). Zooplankton in the re-
gion is mainly composed of grazing copepods which comprise about 86% of the zooplankton bio-
mass, with 84% of these belonging to species of the genus Calanus, one of the key species groups
(Møller et al., 2006, Boertmann et al., 2009a; Greenland Institute of Natural Resources, 2003).

26 2D seismic survey offshore South East Greenland
EIA report v1
The region of the Survey Area is known to be dominated by the three Calanus species, C. glacialis, C.
Hyperboreus and C. finmarchicus (Rysgaard & Nielsen 2006). C. hyperboreus has a three year life
cycle, reproducing at depth early in the year (November to March) and C. glacialis has a two year life
cycle, reproducing during spring and summer in the upper water column (Boertmann et al., 2009a).
Calanus spp. dominates the copepod community during the spring bloom (Møller et al., 2006) and
abundances peak in the upper water column in midsummer after which it undergoes vertical migration
to overwinter at depth (Swalethorp et al., 2011). Other copepods found in the western Greenland Sea
include Metridia longa and smaller species Cithona similis, Pseudocalanus spp. and Microcalanus
pygmaeus (Boertmann et al., 2009a). Although it is considered that copepods represent the greatest
biomass of zooplankton, larvaceans and predatory species such as chaetognaths, ctenophores and
cnidarians may considerably increase the rate of organic matter exported to benthic communities
(Boertmann et al., 2009a).
Grazing impact by zooplankton on primary production in the region is generally low due to low zoo-
plankton biomass in polynyas (large areas of open water, surrounded by ice) and low ingestion rates
in other areas (Hirche et al., 1991). Zooplankton in these arctic regions have adapted to their highly
seasonal lifestyle being able to avoid starvation and continue gamete production through the months
of little or no energetic input. Many species, especially copepods such as Calanus are capable of
storing and concentrating lipids from phytoplankton, turning phytoplankton biomass with a content of
10-20% lipids into copepod biomass of 50-70% lipids (Falk-Pedersen et al. 2007 and 2009).
It must be noted that zooplankton also includes species that are pelagic for part of their life cycle,
mainly larvae of barnacles, crabs and shrimp (Greenland Institute of Natural Resources, 2003). Ich-
thyoplankton (fish eggs and larvae) are important components of the plankton in the pelagic ecosys-
tem as they provide food for higher trophic levels and have the potential to develop into important fish
stocks. There is however, little information on the specific distribution and movements of fish larvae in
the Survey Area.
Krill (Euphausiacea), a macro plankton species is another important crustacean in the pelagic ecosys-
tem playing an important link in transferring primary production to higher trophic levels (Dalpadado
and Skjoldal, 1991). Krill are predominantly herbivorous, feeding primarily on phytoplankton, in partic-
ular diatoms, but some species are carnivorous feeding on small zooplankton (Saether et al., 1986).
Two krill species Meganyctiphanes norvegica and Thysanoessa longicaudata, are dominant both
numerically and in terms of biomass in the northern North Atlantic (Saunders et al., 2007) however
detailed information on krill species in the region, as with the wider northern North Atlantic, is limited.
5.3 Fish and shellfish
In 2010 the list of marine fish species in Greenland was updated and a total of 57 new species was
added to the previous list from 1996. The known marine fish species listed today include 269 species
in all Greenland waters. Whether the increase in species derives from changes in the climate or from
improved methods of fishing is unknown (Greenland Institute of Natural Resources 2013).
The distribution and abundance of fish species in the Survey Area, or the Greenland Sea in general,
have not been intensively studied. Available data suggest that the diversity of fish in the sea off South
East Greenland is higher than the diversity in regions further north; the number of species in the south
east region is similar to that of the commercially important South west area (Boertmann & Mosbech

27 2D seismic survey offshore South East Greenland
EIA report v1
(eds), 2011). The information on the abundance and distribution of fish in the Survey Area is rather
sparse and information has been collated using the best available sources.
A total of 47 fish species are known from the sea NE of Greenland (down to about 66°N) and 182
species from the sea SE of Greenland (from about 66°N to Nunap Isua) (Figure 5-1).

28 2D seismic survey offshore South East Greenland
EIA report v1
Figure 5-1: number of species and distribution in the four major regions in Greenland waters,
November 2009 (from Møller et al., 2010).

29 2D seismic survey offshore South East Greenland
EIA report v1
Important species present in the Survey Area include polar cod (Boreogadus saida), Atlantic cod (Ga-
dus morhua) Greenland halibut (Reinhardtius hippoglossoides), capelin (Mallotus villosus) and Arctic
char (Salvelinus alpinus) (Boertmann & Mosbech, 2011); (Møller et al., 2010) and redfish (S. mentel-
la) (Greenland Institute of Natural Resources, 2013).
Polar cod is present in coastal waters around Greenland all year round. It tends to inhabit full salinity
waters but has been found in inshore brackish and almost fresh water river mouths. In the Arctic
Ocean the species tends to be associated with ice covered waters, with temperatures ranging be-
tween 0-4 ºC, although lower temperatures can be tolerated. Spawning occurs in the winter under ice
where the eggs remain protected during a long incubation period until the ice begins to break up.
Hatching then occurs once the seasonal plankton bloom begins (Cohen, 1990).
Atlantic cod (Gadus morhua) distribution ranges from the east and northeast coasts of America,
around the southern tip of Greenland, the coast of Iceland, throughout European waters to the Bay of
Biscay and the Barents Sea. This fish is an important part of the food chain in the Greenland Sea as
the species constitutes a resource for marine mammals and seabirds. In particular, ringed seal (Pusa
hispida), harp seal (Pagophilus groenlandicus), thick-billed murre (Uria lomvia), northern fulmar (Ful-
marus glacialis), black legged kittiwake (Rissa tridactyla), ivory gull (Pagophila eburnean) and Ross
gull (Rhodostethia rosea). Spawning in Atlantic cod is known to occur between April and May off East
Greenland in water depths ranging between 170 and 400m (Ribergaard & Sandø, 2004). Previous
surveys have found the banks of Skjoldungen (62-30º) and Kleine Banke (64-30º) to be major areas
contributing to total spawning biomass (ICES 2011). Ratz and Lloret (2005) provide an indication of
the main spawning grounds aswell as the expected pelagic drift of cod larvae and movement patterns
of adult fish (Figure 5-2).

30 2D seismic survey offshore South East Greenland
EIA report v1
Figure 5-2: location of the main spawning grounds (shaded areas) of Atlantic cod (Gadus
morhua) off Greenland. Dashed line indicates pelagic drift of eggs and larvae, solid line shows
movement patterns of adult fish.
Both Polar cod and Atlantic cod are expected to be present within the Survey Area during the survey
period. However with regard to spawing and nursery grounds there is a lack of information relating to
Polar cod life history patterns for the Survey Area. Although Atlantic cod are known to spawn within
the Survey Area (ICES, 2011), it is thought that spawning is likely to be over by the start of the pro-
posed survey period. The distribution of cod biomass as estimated in 2012 is shown in Figure 5-3.

31 2D seismic survey offshore South East Greenland
EIA report v1
Figure 5-3: survey of cod biomass pr. station with proposed areas for experimental fishery
(Guldbæk, 2013).
Capelin (Mallotus villosus) is present in the Survey Area and is an important commercial and ecologi-
cal species. The species has notably been pursued by Icelandic fishing vessels since the collapse of
herring stocks after the Second World War (Icelandic Fisheries, 2013).
A stock of capelin is known to spawn in shallow coastal waters south and west of Iceland. The stock
inhabits the area between Iceland, East Greenland, and the island of Jan Mayen. Juveniles are pre-
sent at the continental shelf off North Iceland and off East Greenland, and adults feed in the deeper
seas of the area. (Vilhjálmsson, 2002). Feeding areas, nursery areas and migratory routes are all
present in the north of the proposed survey area, with spawning areas being close by. The drift of the
Irminger current also brings fish spawn into the area of the survey; see Figure 5-4 from (Boertmann &
Mosbech (eds), 2011).

32 2D seismic survey offshore South East Greenland
EIA report v1
Figure 5-4: likely distribution and migration routes of capelin around the proposed Survey
Area. Green= Feeding area, Light blue = Nursery area, Red= Main spawning ground, Lighter
Red= Less important spawning grounds, Light blue arrows = larval drift, Dark green arrows=
feeding migrations and Dark red arrows = spawning areas.
Greenland halibut is an important species present within the Survey Area and represents one of the
most significant commercial species, although little commercial activity is reported within the proposed
survey area (Section 6.1). It is an epi-benthic species that tends to be found in a wide range of depths
but mainly in cold water between -1 and 10oC (Mjelle, 2006). It is reported as being widespread
(Figure 5-5), however, abundance and distribution of the species is poorly described in this region.
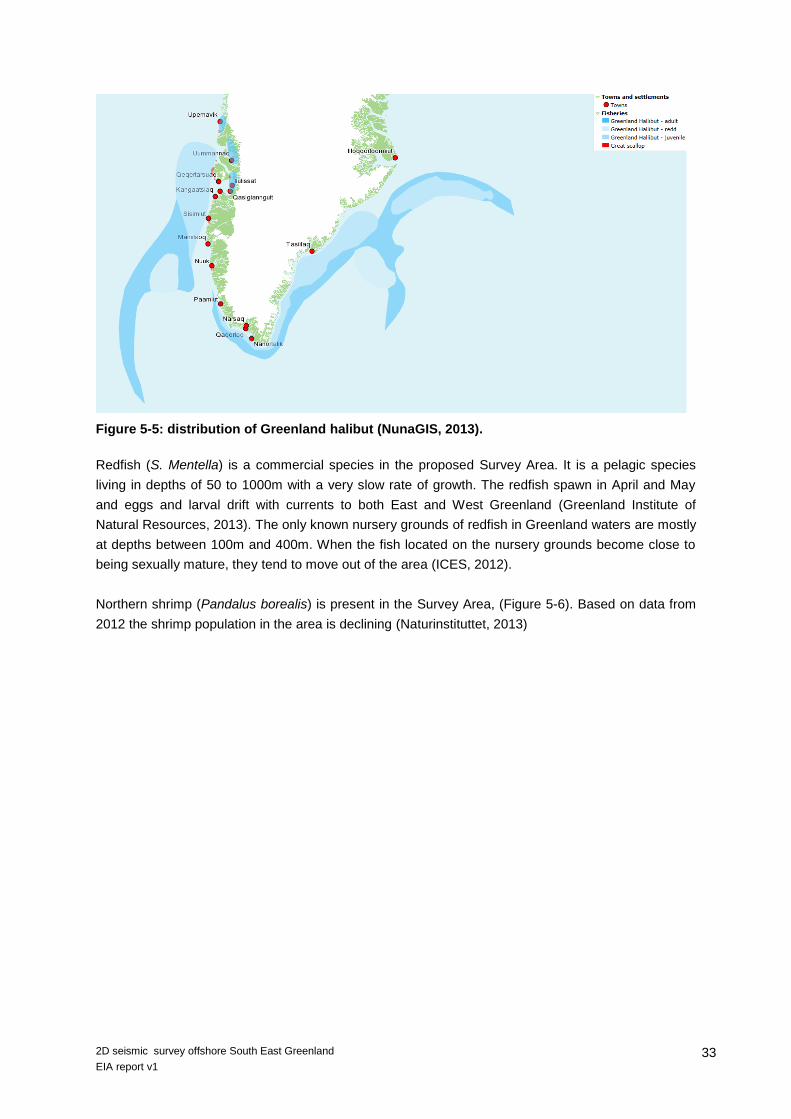
33 2D seismic survey offshore South East Greenland
EIA report v1
Figure 5-5: distribution of Greenland halibut (NunaGIS, 2013).
Redfish (S. Mentella) is a commercial species in the proposed Survey Area. It is a pelagic species
living in depths of 50 to 1000m with a very slow rate of growth. The redfish spawn in April and May
and eggs and larval drift with currents to both East and West Greenland (Greenland Institute of
Natural Resources, 2013). The only known nursery grounds of redfish in Greenland waters are mostly
at depths between 100m and 400m. When the fish located on the nursery grounds become close to
being sexually mature, they tend to move out of the area (ICES, 2012).
Northern shrimp (Pandalus borealis) is present in the Survey Area, (Figure 5-6). Based on data from
2012 the shrimp population in the area is declining (Naturinstituttet, 2013)

34 2D seismic survey offshore South East Greenland
EIA report v1
Figure 5-6: northern shrimp mean annual catch figures (NERI Technical Report no. 785, 2010)
The Arctic char (Salvelinus alpines) is known to spawn and winter in river outlets in South East
Greenland and utilise the coastal areas, but no comprehensive reviews have been published
(Boertmann & Mosbech (eds), 2011). Arctic char are classed as being of least concern on the IUCN
red list and are abundant throughout Greenland and Iceland. They are an important fish in Greenland
providing a food resource for Greenlanders. They are also important in terms of socio-economic value
as they are of interest to tourism with anglers and fly fishing enthusiasts travelling to Greenland.
5.4 Seabirds
An extensive aerial survey in summer 2008 showed that seabird density in the southeast of Green-
land (Western Greenland Sea) was highest in the area between Qulleq and Umiivik and along the
northern part of Blosseville Coast. These two areas, together with the area around Tasiilaq were iden-
tified as having the highest species diversity (Merkel, et al., 2010).
The most common breeding seabirds in southeast and south Greenland were the common eider
(Somateria mollissima) (18,530 individuals recorded), Iceland gull (Larus glaucoides) (1,285 individu-
als recorded), black guillemot (Cepphus grylle) (971 individuals) and glaucous gull (Larus hyperbo-
reus) (603 individuals) (Merkel, et al., 2010).

35 2D seismic survey offshore South East Greenland
EIA report v1
Northern fulmar (Fulmarus glacialis), great cormorant (Phalacrocorax carbo), barnacle goose (Branta
leucopsis), great back-blacked gull (Larus marinus), lesser back-blacked gull (Larus fuscus), black-
legged kittiwake (Rissa tridactyla) and Arctic tern (Sterna paradisaea) were also recorded breeding,
but were sparsely distributed. Breeding great northern diver (Gavia immer), red-throated diver (Gavia
stellata), mallard (Anas platyrhynchos), long-tailed duck (Clangula hyemalis), red-breasted merganser
(Mergus serrator) and ivory gull (Pagophila eburnean) were also observed. Two species were record-
ed as pre-moulting in southeast Greenland; the common eider and pink-footed goose (Anser
brachyrhynchus) (Merkel, et al., 2010).
Ivory gull (Pagophila eburnea) is known to breed in the northern part of the Survey Area along Blos-
seville coast. Breeding colonies for thick-billed murre (Uria lomvia) and little auk (Alle alle) are situated
in the most northern part of the project area in and near the entrance to Ittorqqortoormiit Sound. Aerial
surveys of little auk from May 2008 registered 25,507 individuals in the mouth of the Ittorqqortoormiit
Sound, 2,524 along the ice edge off Liverpool Land and 150,636 individuals along the northern off-
shore side of the polynya (Boertmann & Mosbech (eds), 2011); (Merkel, et al., 2010).
Large parts of the coastline provide suitable habitats for breeding seabirds (Figure 5-7 (Merkel, et al.,
2010)).
The offshore areas are much less known than the coastal areas. The Irminger Sea is used as a forag-
ing area for a number of species. Migrating birds pass through the project area in large numbers in
autumn (Boertmann & Mosbech (eds), 2011).

36 2D seismic survey offshore South East Greenland
EIA report v1
Figure 5-7: breeding colonies along the South East Greenland coast (Merkel, et al., 2010)
Red listed species in the sea South East of Greenland are black-legged kittiwake and ivory gull (VU,
vulnerable) and arctic tern (NT, Near Threatened). Only the western population of common eider is
red listed (Boertmann, 2007).
Black guillemot and pink-footed goose are national responsibility species, meaning that more than
20% of the global population occurs in Greenland.
DCE evaluates northern fulmar, common eider, long-tailed duck, black-legged kittiwake, ivory gull and
Arctic tern as valued ecosystem components (VEC) in the western Greenland Sea (Boertmann &
Mosbech (eds), 2011) with the following conclusion:

37 2D seismic survey offshore South East Greenland
EIA report v1
Northern fulmar is understood to have a favourable conservation status of the breeding popu-
lation.
Common eider is an important predator of shallow benthic communities. The conservation
status of the population is understood to be favourable, in contrast to the declining population
in West Greenland.
Ivory gull is a species with a particularly high conservation value, and it is red-listed. It occurs
in migration concentrations on the drift ice, in breeding colonies and in feeding concentrations
during summer. Arctic tern concentrations are mainly found at the breeding colonies along the
coasts.
DCE has identified a number of eider colonies along the southeast coast within the Survey Area as
important areas. These are areas where the species are particularly vulnerable (NERI, 2012). There
are no relevant marine protected sites within the Survey Area and no onshore sites designated to the
protection of birds (NERI, 2012).
Key habitats in the western Greenland Sea include ice edges, polynyas (often in combination), recur-
rent lead zones and the Marginal Ice Zone. Besides these, many small islands are important as
breeding grounds for seabirds (Boertmann & Mosbech (eds), 2011). Seabirds constitute an important
link between the productive marine ecosystem and the relatively low productive terrestrial ecosystem,
as they transport nutrients from the sea to the breeding colonies in land (Boertmann & Mosbech
(eds), 2011).
5.5 Marine mammals
5.5.1 Overview
Numerous marine mammal species are known to occur off South East Greenland, including the Sur-
vey Area. The following species have been recorded in or around the Survey Area: polar bear (Ursus
maritimus), walrus (Odobenus rosmarus), harbor seal (Phoca vitulina), harp seal (Pagophilus groen-
landicus), hooded seal (Cystophora cristata), ringed seal (Pusa hispida), bearded seal (Erignathus
barbatus), narwhal (Monodon monoceros), bowhead whale (Balaena mysticetus), fin whale (Balae-
noptera physalus), sei whale (Balaenoptera borealis), white whale (Delphinapterus leucas), mink
whale (Balaenoptera acutorostrata), humpback whale (Megaptera novaeangliae), blue whale (Balae-
noptera musculus), northern right whale (Eubalaena glacialis), pilot whale (genus Melas), killer whale
(Orcinus orca), sperm whale (Physeter macrocephalus), white-sided dolphin (Lagenorhynchus
obliquidens), white-beaked dolphin (Lagenorhynchus albirostris) (Boertmann et al., 2009a; Heide-
Jørgensen et al., 2007; Greenland Institute of Natural Resources, 2012). Grey seal (Halichoerus
grypus) was for the first time registered with certainty in 2009 northeast of Nunap Isua (Greenland
Institute of Natural Resources, 2012).
Polar bear and walrus are the best studied species, while knowledge about the distribution of several
species of whales is sparse or not existent (Boertmann et al., 2009a).

38 2D seismic survey offshore South East Greenland
EIA report v1
The following summaries are informed primarily by the Kanumas East SEIA (Boertmann et al.,
2009a). It should be noted that whilst this overlaps with the northern part of the Survey Area, the pro-
posed Survey Area lies out of the scope of the assessment. In general terms, there is a limited
amount of information on the abundance and distribution of marine mammals in and around the pro-
posed Survey Area itself.
A limited amount of information is also available from MMSO reports collated when TGS surveyed
during transit through the SEG Survey Area between 13 and 19 October 2012. Three minke, four fin,
one killer whale and 10 unidentified baleen whales were detected (all visual). Identified whales were
an average of just over 2km from the vessel, the killer whale approached to within around 1km. Uni-
dentified whales were significantly in excess of 2km and therefore observers unable to make an accu-
rate identification of species.
There was no acquisition undertaken in 2013 or 2014 and therefore no further information is available.
5.5.2 Polar Bear
Polar bear is described as being present all year round but it has a large seasonal range as it moves
with the sea ice as it forms and retreats. It is an important species for Greenlandic communities, both
because of small scale hunting and eco-tourism.
Distribution is inter-annually variable and is a factor of ice density and prey distribution. During sum-
mer months of minimal ice coverage, bears tend to remain on land but may be found on large frag-
ments of pack ice further offshore. Conversely, during winter months as the pack ice extends, polar
bears will spend much time in offshore locations.
Surveys using satellite tracked polar bears have shown that polar bear has a wide usage of the east
Greenland coastal area (Figure 5-8), although the area mapped is mainly north of the Survey Area,
Figure 5-8 shows substantial usage of the northern part of the Survey Area. Polar bears have also
been noted to use the offshore area all along the Greenland eastern coastline and offshore areas
(Figure 5-8).
Because there will be no ice when the survey takes place, and the survey will never be closer than
12nm from the coast, it is not expected that polar bear will be encountered.

39 2D seismic survey offshore South East Greenland
EIA report v1
.
Figure 5-8: distribution of all polar bear locations in the East Greenland and Northwest Sval-
bard region from 35 polar bears with satellite transmitters (Boertmann et al., 2009a, originally
from Wiig et al., 2003).
5.5.3 Pinnipeds
The Arctic walrus (Odobenus rosmarus) utilises shallow waters (less than 80m) and feeds mainly on
bivalves. It is mostly found close to the coast but sightings data from 1863-1992 reveal that walrus
can occur several kilometres away from coastal areas during summer months, particularly in July and
August. They have been known to make dives to 200-250m (Born, 2003). Mating occurs from Febru-
ary to April, with most offspring born in May or June the following year. Walrus populations have been
dramatically reduced due to hunting, and as such they are listed as endangered/critically endangered
on the Greenland Red List. The population size on the east coast is understood to be smaller than on
the west coast, and although distributed along the entire east coast Arctic walrus are mainly found
north of Ittoqqortoormiit Sound and therefore outside of the Licence Area. In general, they tend to
remain in shallow inshore areas and are unlikely to be found within the Survey Area although should
be considered as potentially present.
Other species of pinniped potentially present in the Survey Area include hooded seal (Cystophora
cristata), harp seal (Phoca groenlandia), bearded seal (Erignathus barbatus), harbour seal (Phoca
vitulina) and ringed seal (Phoca hispida). All of these species, except the bearded seal and harbour
seal, are classed as being of least concern on the Greenland red list, as they are numerous and

40 2D seismic survey offshore South East Greenland
EIA report v1
widespread throughout the area (Boertmann, 2007). Bearded seal is described as data deficient and
low in numbers but widespread throughout the area. Harbour seal is designated critically endangered
and Greenland red listed (Boertmann, 2007). The Survey Area is thought to be of high importance to
all these species.
Ringed seal are the species most associated with and adapted to sea ice conditions and are likely to
be seen in areas of high ice coverage. Bearded seals utilise sea ice coverage but to a lesser extent,
their population distribution tends to move with the ice edge. The survey is planned when the sea is
expected to be largely ice free (no ice breaker will be used) therefore encounters with ringed seal are
not expected (there were none during transit in 2012). The other species tend to prefer more open
water conditions. All species are likely to be found in the offshore environment and will most likely be
present throughout the survey area.
5.5.4 Bowhead whale (Balaena mysticetus)
This species spends its entire life in the Arctic and is often associated with the ice edge where zoo-
plankton blooms form. Generalised distribution is shown in Figure 5-9 and known areas of concern as
informed by Danish Centre for Environment and Energy datasets on seismic regulation areas (DCE,
2014) is shown in Figure 5-10. The species is considered relatively likely to be found within the pro-
posed Survey Area around polynyas as these will be areas of high food concentration although such
features will have dispersed by the time the survey enters these areas in summer.
Historically bowhead whale were hunted for their baleen and oil rich blubber. It is estimated that whale
numbers of the Spitsbergen stock decreased from 25,000 in 1679 to near extinction by 1980 (Bra-
ham, 1984). The Spitsbergen sub-population is currently classed as critically endangered by IUCN
despite the overall species being classed as ’least concern’ (Reilly et al., 2012). Christensen et al.,
(1992) states that it is likely that there are only a few hundred individuals present in Greenlandic wa-
ters, with the Spitzbergen stock only comprising double figure numbers. Due to their rarity and lack of
systematic surveys, little precise information on population numbers or movement patterns is known
about the Spitzbergen stock.

41 2D seismic survey offshore South East Greenland
EIA report v1
Figure 5-9 geographical range of the bowhead whale (Balaena mysticetus) (From NOAA, 2007).
Figure 5-10 SEG15 proposed survey lines and bowhead whale areas of concern. Data Source:
DCE, 2014.

42 2D seismic survey offshore South East Greenland
EIA report v1
5.5.5 Minke whale (Balaenoptera acutorostrata)
This is the most numerous cetacean species in the region and the one that is most likely to be seen
within the Survey Area. Minke whale are present in Arctic waters during the summer as they migrate
to feed on the large numbers of small fish and euphausids that are attracted to the spring phytoplank-
ton blooms (Boertmann et al., 2009b). They can be expected to be present in the region between
March and October and so will be present during the period that the seismic survey will be taking
place.
Hotspots for minke whale have been reported (Olsen & Holst, 2001). In relation to the Survey Area
these are most likely to be areas around Jan Mayan Island and the north and west coasts of Iceland
which have high abundances of capelin, a major prey species. Capelin are associated with the
Irminger current which may bring capelin, and associated fish-eating whales such as minke, towards
the Survey Area. Heide-Jorgensen et al., (2007) reports that a total of 14 minke whales were ob-
served during a ship-based line transect survey of South Greenland coastal waters in 2005. Of the 14
whales observed, 6 were sighted within the southeast seismic survey area (Figure 5-11). During
transit through the Survey Area in 2012, three individuals were observed.
Minke whale are an important species for indigenous Greenlanders as it is a species that is hunted for
food and resources.
5.5.6 Humpback whales (Megaptera novaeangliae)
This species moves to higher latitudes to utilise food availability during the summer months. They are
likely to be present in the vicinity of the Survey Area between June and October. Minke and hump-
back are only found in ice free waters and so will be most likely be present in offshore and southerly
areas of the proposed survey area particularly towards September and October when they begin mi-
grating south (Boertmann et al., 2009b). Both species are classed as least concern by the IUCN
Greenland Red List (Boertmann, 2007), although both species could potentially be reliant on the area
for food. It is thought that there may be hotspots for humpbacks within the Survey Area as it coincides
with areas of high prey availability, possibly where capelin congregate. This is reflected within sight-
ings data collected during a boat-based line transect survey in south Greenland September 2005, a
total of 46 humpback whales were observed, with those being recorded within the Survey Area locat-
ed in the Denmark Strait off the southwest coast of Iceland (Figure 5-11) (Heide-Jorgensen et al.,
2007). None were observed during transit through the Survey Area in 2012.
5.5.7 Other large cetaceans
The large rorqual species blue (Balaenoptera musculus), fin (Balaenoptera physalus) and sei (Balae-
noptera borealis) whales are also listed as present off southeast Greenland and the Survey Area
(Table 5-1). Fin whales are listed as globally endangered although there is a strong Atlantic popula-
tion and they have been noted as being abundant around Iceland and the Greenland Sea (NAMMCO
1997). During four separate ship surveys undertaken in 1987, 1989, 1995 and 2001, fin whales were
consistently most abundant offshore of southeast Greenland (Vikingsson et al., 2009). This distribu-
tion was again observed by Heide-Jorgensen et al., (2007) who reports sighting a total of 87 fin
whales, with the highest abundances located off the southeast Greenland coastline (Figure 5-11).
After minke, fin whale are the cetacean species most likely to be encountered in the proposed survey
area when they follow the food resources associated with the spring phytoplankton bloom. Distribu-
tion patterns for sei and blue whales are less well known but population abundance, particularly of
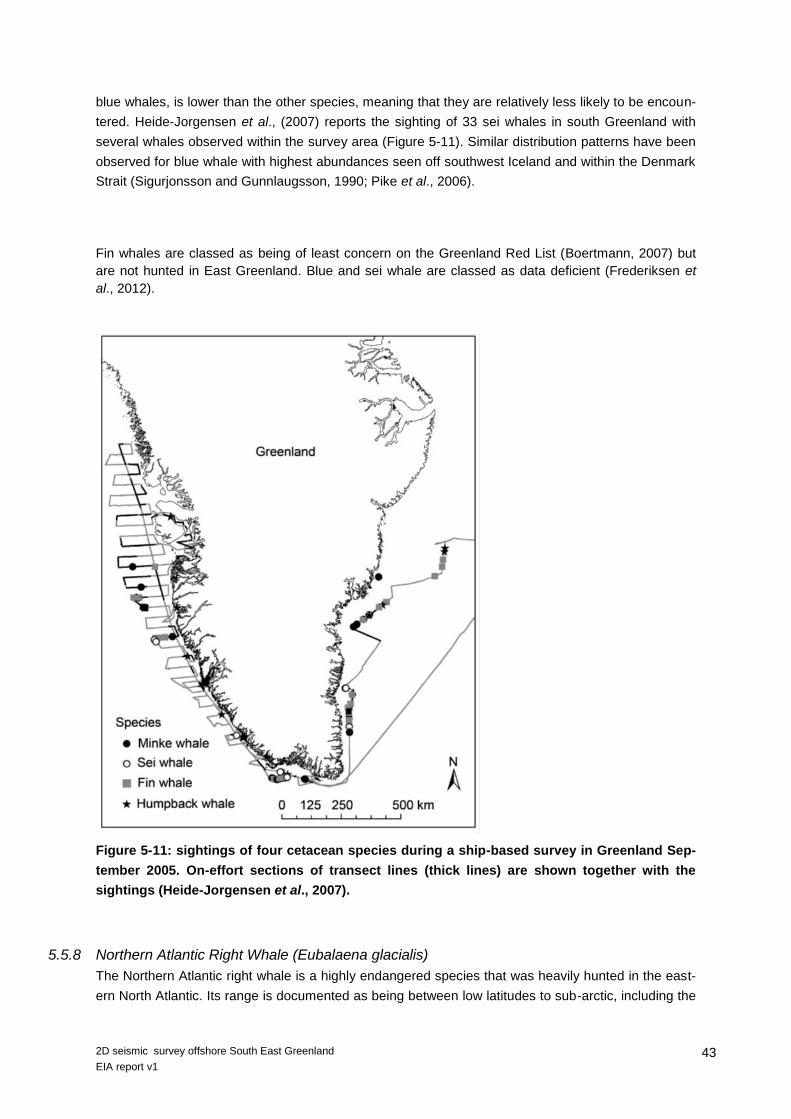
43 2D seismic survey offshore South East Greenland
EIA report v1
blue whales, is lower than the other species, meaning that they are relatively less likely to be encoun-
tered. Heide-Jorgensen et al., (2007) reports the sighting of 33 sei whales in south Greenland with
several whales observed within the survey area (Figure 5-11). Similar distribution patterns have been
observed for blue whale with highest abundances seen off southwest Iceland and within the Denmark
Strait (Sigurjonsson and Gunnlaugsson, 1990; Pike et al., 2006).
Fin whales are classed as being of least concern on the Greenland Red List (Boertmann, 2007) but
are not hunted in East Greenland. Blue and sei whale are classed as data deficient (Frederiksen et
al., 2012).
Figure 5-11: sightings of four cetacean species during a ship-based survey in Greenland Sep-
tember 2005. On-effort sections of transect lines (thick lines) are shown together with the
sightings (Heide-Jorgensen et al., 2007).
5.5.8 Northern Atlantic Right Whale (Eubalaena glacialis)
The Northern Atlantic right whale is a highly endangered species that was heavily hunted in the east-
ern North Atlantic. Its range is documented as being between low latitudes to sub-arctic, including the
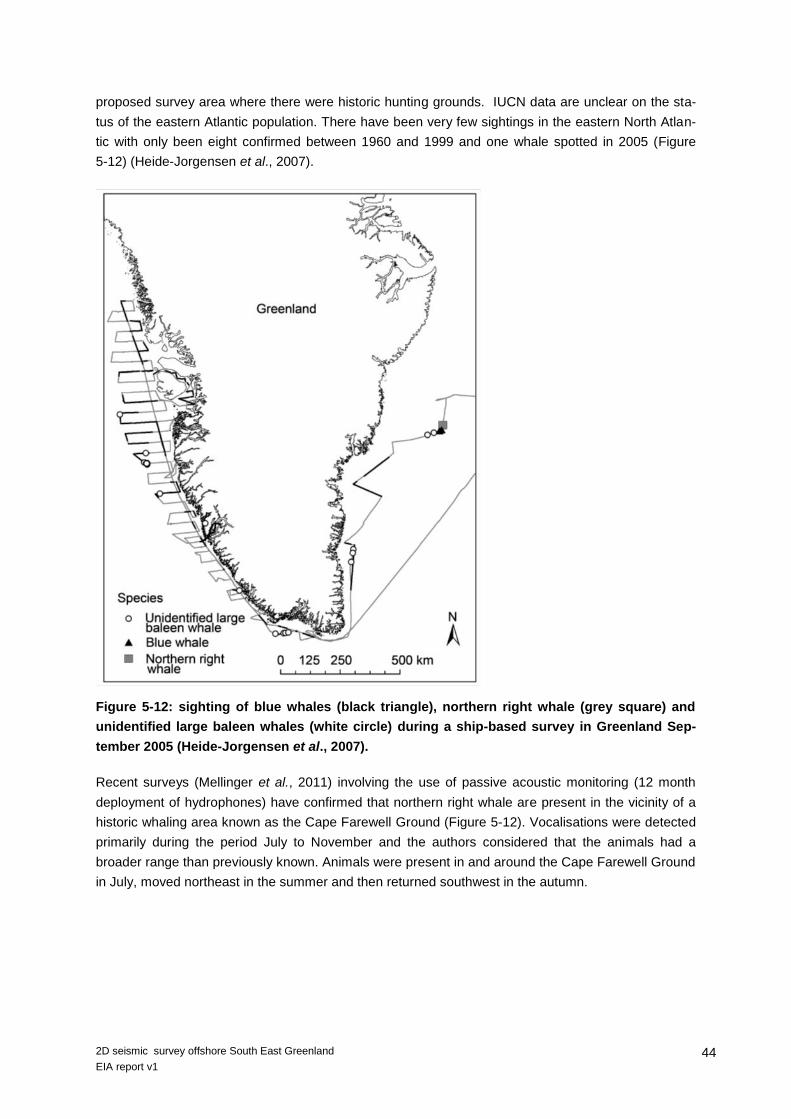
44 2D seismic survey offshore South East Greenland
EIA report v1
proposed survey area where there were historic hunting grounds. IUCN data are unclear on the sta-
tus of the eastern Atlantic population. There have been very few sightings in the eastern North Atlan-
tic with only been eight confirmed between 1960 and 1999 and one whale spotted in 2005 (Figure
5-12) (Heide-Jorgensen et al., 2007).
Figure 5-12: sighting of blue whales (black triangle), northern right whale (grey square) and
unidentified large baleen whales (white circle) during a ship-based survey in Greenland Sep-
tember 2005 (Heide-Jorgensen et al., 2007).
Recent surveys (Mellinger et al., 2011) involving the use of passive acoustic monitoring (12 month
deployment of hydrophones) have confirmed that northern right whale are present in the vicinity of a
historic whaling area known as the Cape Farewell Ground (Figure 5-12). Vocalisations were detected
primarily during the period July to November and the authors considered that the animals had a
broader range than previously known. Animals were present in and around the Cape Farewell Ground
in July, moved northeast in the summer and then returned southwest in the autumn.
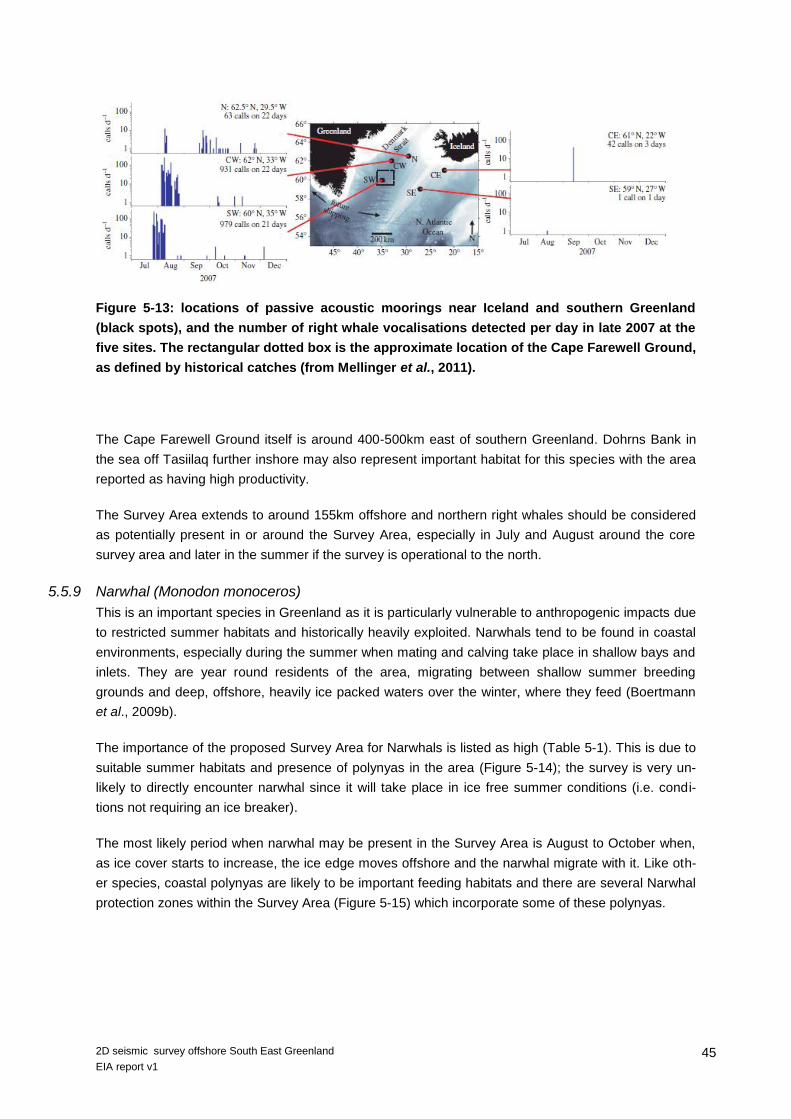
45 2D seismic survey offshore South East Greenland
EIA report v1
Figure 5-13: locations of passive acoustic moorings near Iceland and southern Greenland
(black spots), and the number of right whale vocalisations detected per day in late 2007 at the
five sites. The rectangular dotted box is the approximate location of the Cape Farewell Ground,
as defined by historical catches (from Mellinger et al., 2011).
The Cape Farewell Ground itself is around 400-500km east of southern Greenland. Dohrns Bank in
the sea off Tasiilaq further inshore may also represent important habitat for this species with the area
reported as having high productivity.
The Survey Area extends to around 155km offshore and northern right whales should be considered
as potentially present in or around the Survey Area, especially in July and August around the core
survey area and later in the summer if the survey is operational to the north.
5.5.9 Narwhal (Monodon monoceros)
This is an important species in Greenland as it is particularly vulnerable to anthropogenic impacts due
to restricted summer habitats and historically heavily exploited. Narwhals tend to be found in coastal
environments, especially during the summer when mating and calving take place in shallow bays and
inlets. They are year round residents of the area, migrating between shallow summer breeding
grounds and deep, offshore, heavily ice packed waters over the winter, where they feed (Boertmann
et al., 2009b).
The importance of the proposed Survey Area for Narwhals is listed as high (Table 5-1). This is due to
suitable summer habitats and presence of polynyas in the area (Figure 5-14); the survey is very un-
likely to directly encounter narwhal since it will take place in ice free summer conditions (i.e. condi-
tions not requiring an ice breaker).
The most likely period when narwhal may be present in the Survey Area is August to October when,
as ice cover starts to increase, the ice edge moves offshore and the narwhal migrate with it. Like oth-
er species, coastal polynyas are likely to be important feeding habitats and there are several Narwhal
protection zones within the Survey Area (Figure 5-15) which incorporate some of these polynyas.

46 2D seismic survey offshore South East Greenland
EIA report v1
Figure 5-14: Distribution of narwhals (from Boertmann et al., 2009b).
47 2D seismic survey offshore South East Greenland
EIA report v1
Figure 5-15 SEG15 proposed survey lines and narwhal areas of concern and closed areas.
Data Source: DCE, 2014.
5.5.10 Beluga or white whale (Delphina pterusleucas)
This critically endangered species (Boertmann, 2007) is generally absent from the east coast of
Greenland and is very unliklely to be present in the Survey Area.
Figure 5-16: General distribution of Beluga whales (Reilly et al., 2012).
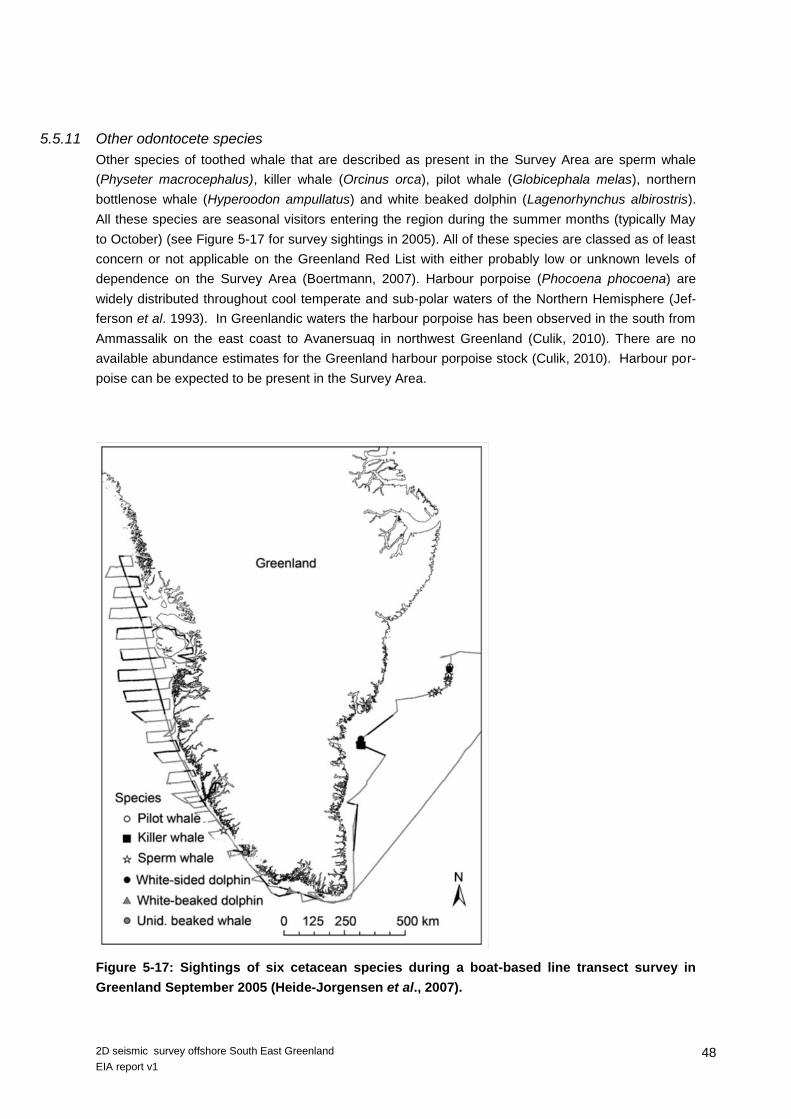
48 2D seismic survey offshore South East Greenland
EIA report v1
5.5.11 Other odontocete species
Other species of toothed whale that are described as present in the Survey Area are sperm whale
(Physeter macrocephalus), killer whale (Orcinus orca), pilot whale (Globicephala melas), northern
bottlenose whale (Hyperoodon ampullatus) and white beaked dolphin (Lagenorhynchus albirostris).
All these species are seasonal visitors entering the region during the summer months (typically May
to October) (see Figure 5-17 for survey sightings in 2005). All of these species are classed as of least
concern or not applicable on the Greenland Red List with either probably low or unknown levels of
dependence on the Survey Area (Boertmann, 2007). Harbour porpoise (Phocoena phocoena) are
widely distributed throughout cool temperate and sub-polar waters of the Northern Hemisphere (Jef-
ferson et al. 1993). In Greenlandic waters the harbour porpoise has been observed in the south from
Ammassalik on the east coast to Avanersuaq in northwest Greenland (Culik, 2010). There are no
available abundance estimates for the Greenland harbour porpoise stock (Culik, 2010). Harbour por-
poise can be expected to be present in the Survey Area.
Figure 5-17: Sightings of six cetacean species during a boat-based line transect survey in
Greenland September 2005 (Heide-Jorgensen et al., 2007).
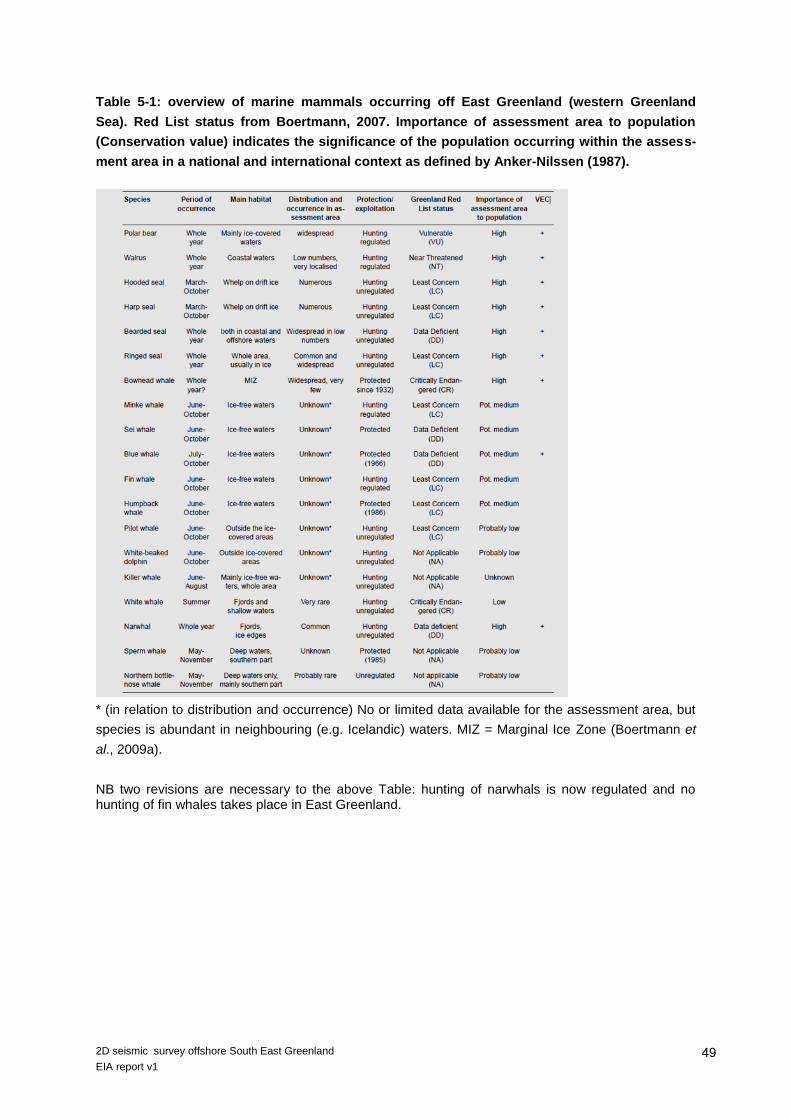
49 2D seismic survey offshore South East Greenland
EIA report v1
Table 5-1: overview of marine mammals occurring off East Greenland (western Greenland
Sea). Red List status from Boertmann, 2007. Importance of assessment area to population
(Conservation value) indicates the significance of the population occurring within the assess-
ment area in a national and international context as defined by Anker-Nilssen (1987).
* (in relation to distribution and occurrence) No or limited data available for the assessment area, but
species is abundant in neighbouring (e.g. Icelandic) waters. MIZ = Marginal Ice Zone (Boertmann et
al., 2009a).
NB two revisions are necessary to the above Table: hunting of narwhals is now regulated and no hunting of fin whales takes place in East Greenland.
50 2D seismic survey offshore South East Greenland
EIA report v1
6 HUMAN ACTIVITIES
6.1 Fishing
The bulk of Greenlandic fishing takes places off West Greenland (Figure 6-1), although there is some
low intensity fishing off of the south east coast. Fishing in the proposed survey area predomantly oc-
curs between May and December and targets demersal and pelagic species including Atlantic cod,
shrimp, redfish,halibut, mackerel and capelin. Fishing vessels have been tracked in South East and
South West Greenland during winter (2006-2008) (Figure 6-2) showing the intensity of fishing in the
two areas.
The total Greenlandic fishing in tonnes per year has increased by 50% over the past 10 years. The
increase has primarily been due to an increase in the yield from fishing for northern shrimp (Pandalus
borealis). After a collapse of the cod, halibut and redfish fisheries in the late 1960s, shrimp became
the most important commercial species, making up 90% of the export value of fishery products. The
shrimp catch off east Greenland increased during the 1970’s to 1990’s and peaked in 2003 (Garcia,
2007) (Statistics Greenland, 2013). In East Greenland the TAC has been stable since 2003 with
12.400 ton/year, but there has been a decline in catches from 13.000 tonnes to 2.000 tons in the late
2012 (Naturinstituttet, 2013).
Historically Cod has been an important commercial species in the area with targeted fisheries pur-
sued by mid water trawls.. Fishing for cod off Greenland peaked in the 1950s and 1960s with between
300,000 and 400,000 tonnes per year. The level dropped drastically in the early 1970s as a result of
overfishing. Since 2005 fishing for cod has been increasing, but is well below previous levels. The
biological counseling for 2013 advised no fishery for cod offshore in East and West Greenland (ICES,
2012), however 5.000 tons could be caught as a test quota according to TAC (NANOQ, 2013a). As
part of the experimental fishing permitted in 2013 trawlers were allowed to fish from July 1st to De-
cember 31st, while long line fishing was permitted from April 1
st to December 31
st 2013. A similar quo-
ta was given in 2012 and is understood to be in place at present. Experimental fishing is expected to
take place in coastal waters during the proposed survey period.
After the decline in density of cod in Greenlandic waters, halibut has become an important commer-
cial fish species. For Greenland halibut 10.761 tons were reported for the whole East Greenland coast
in 2011 (ICES, 2012).
Fishery for redfish in east Greenland started in 2009 with a catch in 2011 of 6.700 tons. The biological
counselling for 2013 is, that the catch is reduced to 3.500 tons. The species is very vulnerable to
commercial exploitation (ICES, 2012).
For capelin the biological counselling for 2013 has caution against catching capelin in the East Green-
land (ICES, 2012). The TAC is approximately 3.600 tons (NANOQ, 2013a).
Subsistence fishing is conducted by the inhabitants of Tasiilaq and Ittoqqortoormiit in the coastal are-
as. The most important species is Arctic char. Other species caught include spotted wolfish (Anarchi-
chas minor), Greenland shark (Microcephalus somniosus), Greenland halibut, sculpin (Myxocephalus
scorpius), and polar cod (Boreogadus saida) (Boertmann & Mosbech, 2011).
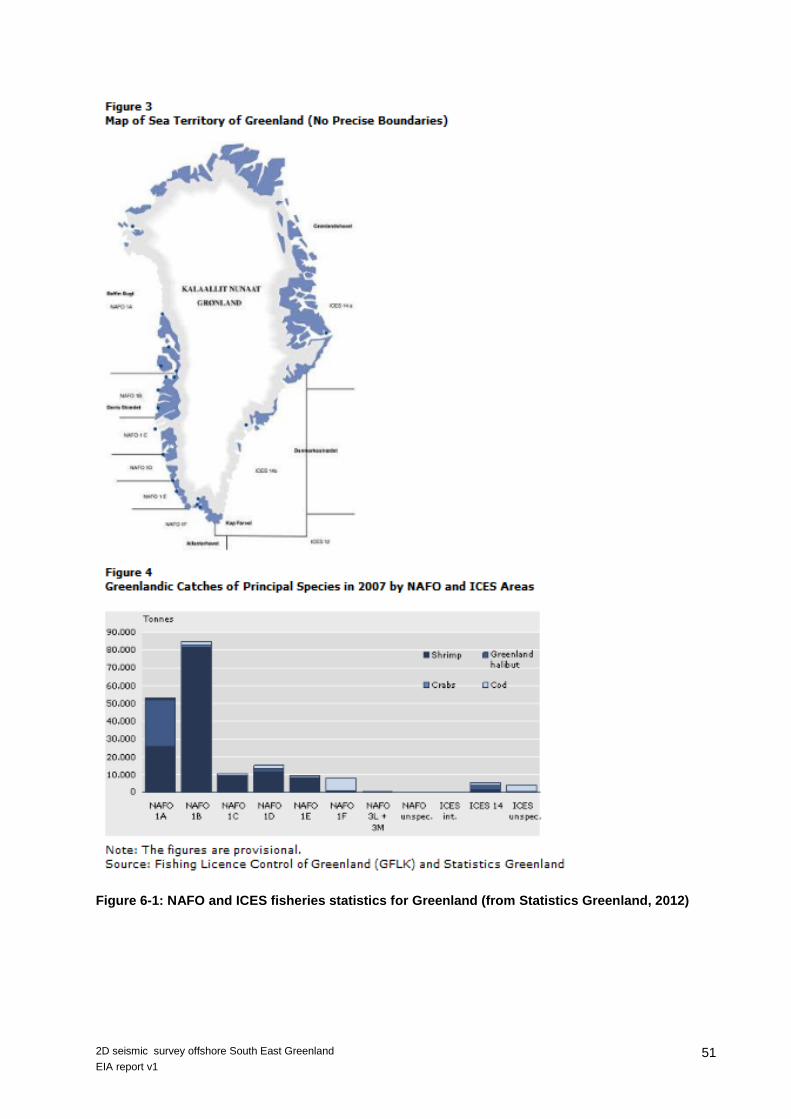
51 2D seismic survey offshore South East Greenland
EIA report v1
Figure 6-1: NAFO and ICES fisheries statistics for Greenland (from Statistics Greenland, 2012)

52 2D seismic survey offshore South East Greenland
EIA report v1
Figure 6-2: tracks of fishing vessels (> 90 BT) in South East and South West Greenland during
wintertime (October to March 2006-2008) (Merkel , 2010).
6.2 Hunting
Sustainable whaling is permitted and is an important element for the domestic food supply. The Inter-
national Whaling Commission awarded Greenland aboriginal subsistence quotas for large whales,
based on advice from the IWC’s scientific committee until 2012. Greenland has received a yearly
quota for 2008-2012 for whaling of 178 minke whale (Balaenoptera acutorostrata), 10 fin whale
(Balaenoptera physalus), 2 bowhead whale (Balaena mysticetus), and 9 humpback whale (Megaptera
novaeangliae) in West Greenland. Furthermore there is a quota on 12 minke whale in East Greenland
(NANOQ, 2013a). In 2013 Greenland raised the quota of large whales to 10 without the approval of
IWC (NANOQ, 2013b). The quota in East Greenland remains the same.
Except in specific municipalities, the hunting of small whales is allowed throughout the year, with no
seasonal restrictions. Some municipalities such as Qeqqata and Uummannarsuaq, certain timing
restrictions may apply.
The whaling products are distributed locally and sold on the local market (Brættet). Furthermore, a
minor amount is processed for resale in local communities without access to whaling vessels or with
shortage of meat. No whaling products are exported (Ministry of Fisheries, 2011). Hunting for whales
is mainly undertaken between July and September with hunts being conducted in mainly coastal are-
as, hunting from boats tend to be within 10nm of shore.
Hunting of seals is permitted in Greenland and tends to be undertaken in late winter and spring, main-
ly around the ice edges from small boats. Seals are unquoted and are mainly hunted all year round
except some areas where seasonal restrictions apply; these restrictions tend to be in the South West

53 2D seismic survey offshore South East Greenland
EIA report v1
Greenland area. Hunting is normally conducted using small boats in open waters, usually using rifles
(Ministry for Fisheries, 2012).
Polar bear and walrus are also hunted for indigenous use, the following tables provide a breakdown of
polar bear and walrus numbers caught in each area between 2005-2010 (Table 6-1).
Table 6-1: catch figures for polar bear (Isbjørn) and walrus (Hvalros) hunts between 2005-2010
(Greenland Statistics, 2013).
Seabirds are also an important source of food and income for hunters in Greenland (Piniarneq, 2013).
Hunting restrictions are in place for various species of seabirds, these tend to reflect breeding times.
Table 6-2 (A and B) show species of seabirds with a hunting season.
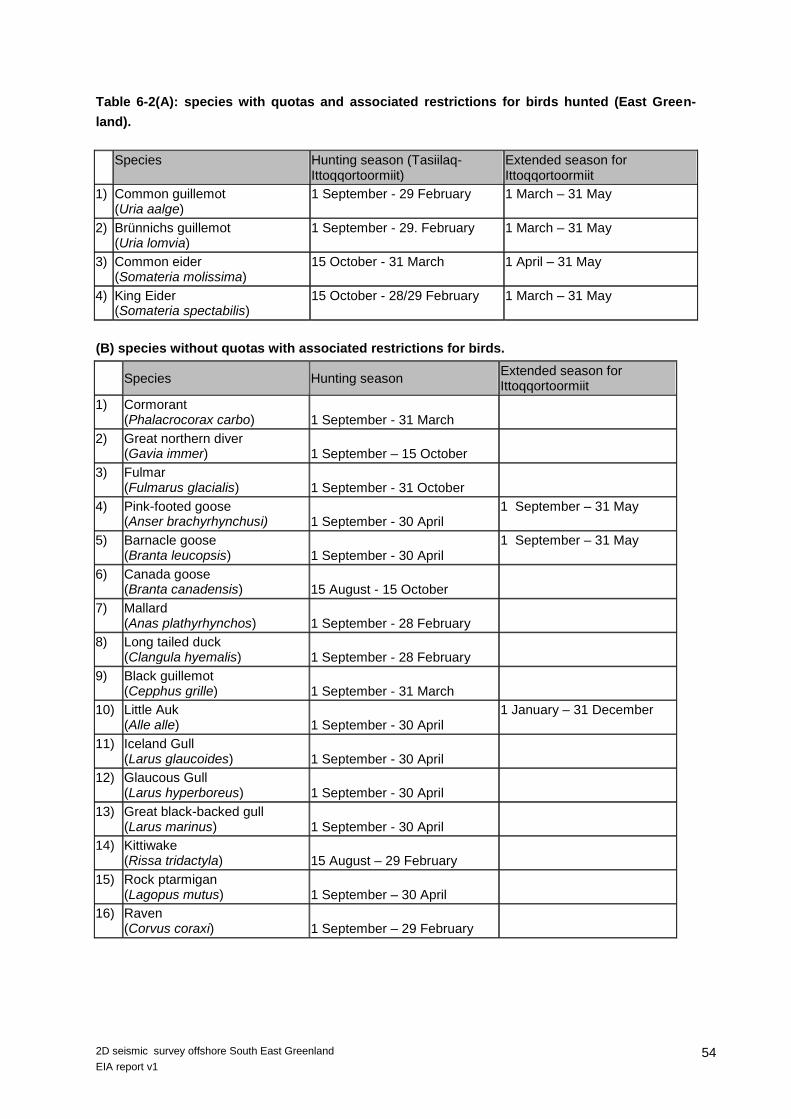
54 2D seismic survey offshore South East Greenland
EIA report v1
Table 6-2(A): species with quotas and associated restrictions for birds hunted (East Green-
land).
Species Hunting season (Tasiilaq-Ittoqqortoormiit)
Extended season for Ittoqqortoormiit
1) Common guillemot (Uria aalge)
1 September - 29 February 1 March – 31 May
2) Brünnichs guillemot (Uria lomvia)
1 September - 29. February 1 March – 31 May
3) Common eider (Somateria molissima)
15 October - 31 March 1 April – 31 May
4) King Eider (Somateria spectabilis)
15 October - 28/29 February 1 March – 31 May
(B) species without quotas with associated restrictions for birds.
Species Hunting season
Extended season for Ittoqqortoormiit
1) Cormorant (Phalacrocorax carbo) 1 September - 31 March
2) Great northern diver (Gavia immer) 1 September – 15 October
3) Fulmar (Fulmarus glacialis) 1 September - 31 October
4) Pink-footed goose (Anser brachyrhynchusi) 1 September - 30 April
1 September – 31 May
5) Barnacle goose (Branta leucopsis) 1 September - 30 April
1 September – 31 May
6) Canada goose (Branta canadensis) 15 August - 15 October
7) Mallard (Anas plathyrhynchos) 1 September - 28 February
8) Long tailed duck (Clangula hyemalis) 1 September - 28 February
9) Black guillemot (Cepphus grille) 1 September - 31 March
10) Little Auk (Alle alle) 1 September - 30 April
1 January – 31 December
11) Iceland Gull (Larus glaucoides) 1 September - 30 April
12) Glaucous Gull (Larus hyperboreus) 1 September - 30 April
13) Great black-backed gull (Larus marinus) 1 September - 30 April
14) Kittiwake (Rissa tridactyla) 15 August – 29 February
15) Rock ptarmigan (Lagopus mutus) 1 September – 30 April
16) Raven (Corvus coraxi) 1 September – 29 February

55 2D seismic survey offshore South East Greenland
EIA report v1
6.3 Tourism
Tourism is becoming increasingly important around Greenland and the tourist industry is one of three
major sectors within the Greenland economy. (Boertmann & Mosbech (eds), 2011). In the Survey
Area, tourism is concentrated around Tasiilaq and the other surrounding settlements (Eastgreenland,
2013). The majority of the tourists arrive by plane to Kulusuk Airport and are transported to Tasiilaq
and the other small settlements in the region by helicopter or small boats. The Survey Area is also
influenced by the tourist activities concentrated around Ittoqqortoormiit, to the north.
The tourist market is predominantly cruise ships and whale watching trips that visit in the summer
from Svalbard moving southward along the coast and in the fjord lands. These cruise ships spend the
majority of time in the coastal zone and sightings of marine mammals and birds are the major attrac-
tion. Much of the tourism industry is aimed at environment and wildlife enthusiasts.
The number of cruise ships has increased rapidly during the period 1999 – 2003 (Figure 6-3) and is
expected to continue increasing. More open water in the summer time will enable cruise ships to visit
more and more remotely situated sites (Boertmann & Mosbech (eds), 2011).

56 2D seismic survey offshore South East Greenland
EIA report v1
Figure 6-3: development in number of cruise ships and number of passengers 1999– 2007 in
Ittoqqortoormiit (Boertmann & Mosbech (eds), 2011).

57 2D seismic survey offshore South East Greenland
EIA report v1
7 IMPACT ASSESSMENT
7.1 Assessment methodology
An assessment of environmental impacts aims at identifying and evaluating significant effects that are
very likely to occur. The assessment focuses on the issues identified with most significant effects and
not on concerns that the assessment indicates to be insignificant. An impact can be either positive or
negative.
This note describes the general method for assessing environmental impacts. The method has been
developed based on the criteria in Annex 3 of the EU-EIA Directive (85/337/EEC). The assessment
method was drawn up by NIRAS. The method is a working tool which can be continuously revised.
The main purpose of the method is to ensure that the assessments are based on specific terms and
to increase the transparency of the assessments conducted. The objective is to propose possible
mitigation measures and to define the residual impacts in order to support the decision-making pro-
cess. It is important to point out that the method can never stand alone. It has not been the intention
to try to establish a method that would predict the exact magnitude of the impact or change in all situ-
ations and the method cannot replace specialist knowledge and project-specific assessments.
Description of the method
Table 7-1 describes when mitigation measures are expected with a view to reducing a given envi-
ronmental impact.
Table 7-1: degree of remedial measures.
Magnitude of impact Mitigation measure
Major impact Impact considered of sufficient importance to consider whether the pro-
ject should be changed or whether mitigation measures should be made
to reduce this impact
Moderate impact Impact of a magnitude where mitigation measures are considered
Minor impact Impact of a magnitude where it is not likely that mitigation initiatives are
necessary.
Negligible impact and no im-
pact
Impacts considered so negligible that they are not relevant to take into
consideration when implementing the project
A number of criteria form part of the assessment of environmental impacts. Table Table 7-2 lists the
most significant criteria. The likelihood of occurrence or the risk of an environmental impact taking
place has been divided into three groupings in the table; however, as is most often the case in respect
of impacts on the natural environment, this division will be more varied and detailed.

58 2D seismic survey offshore South East Greenland
EIA report v1
Table 7-2: list of criteria for assessment of environmental impacts
Criteria Factor
Importance of the issue Importance to international interests
Importance to national interests
Importance to regional interests
Importance to local interests
Importance in respect of the area with direct impact
Negligible or not important
Persistence Permanent impact (non-reversible) in the life of the project
Temporary for >5 years
Temporary for 1-5 years
Temporary for <1 year
Likelihood of occurrence High (>75 %)
Medium (25-75 %)
Low (<25 %)
Furthermore, it is important to consider whether the impact is caused directly by the project or indirect-
ly as a derived effect of a direct impact. Cumulative impacts must also be assessed, determining the
impact from combined activities or other projects locally or regionally.
The tables below (Table 7-3, Table 7-4 and Table 7-5) indicate the process of assessing the magni-
tude of individual environmental impacts in connection with a project. The following is a description of
the table:
Column 1 states the degree of disturbance: The extent of the disturbance is assessed as high, medi-
um or low. The determination of this is based on the potential severity of the impact, looking at the
impact on a specific issues (e.g. a species), not considering the Importance of the issue, the likelihood
of occurrence, or the persistence.
Column 2 assesses whether the issue (e.g. species, habitat, etc.) is important to international, nation-
al/regional or entirely local nature conservation interests.
Column 3 indicates the likelihood that the assessed disturbance occurs.
Column 4 shows the persistence of the impact.
By combining these four factors the magnitude of impact is found in column 5.
One of the purposes of the method is to ensure that the assessments are applied consistently based
on the degree of disturbance, importance of receptors, likelihood of occurrence and persistence of
effects. At the same time, the purpose is to increase the transparency of the assessments conducted

59 2D seismic survey offshore South East Greenland
EIA report v1
and allow supplementary argumentation. It is important to point out that it is a matter of estimating the
likely degree of impact; it is not possible to establish a method in which the degree of impact can al-
ways be predicted when the method is to cover environmental assessments across all relevant topics.
The method cannot replace specialist knowledge and project-specific assessments, and therefore the
assessments must be made on the basis of a specialist insight and with sufficient supporting argu-
ment. This can lead to the resultant degree of impact being different from what the method initially
predicts.

60 2D seismic survey offshore South East Greenland
EIA report v1
Table 7-3: assessment of degree of impact (high degree of disturbance).

61 2D seismic survey offshore South East Greenland
EIA report v1
Table 7-4: assessment of degree of impact (medium degree of disturbance).

62 2D seismic survey offshore South East Greenland
EIA report v1
Table 7-5: assessment of degree of impact (low degree of disturbance).

63 2D seismic survey offshore South East Greenland
EIA report v1
7.2 Noise generated by the survey
Noise modelling has been undertaken to support the impact assessment. Modelling work completed
in support of planned surveys off SE Greenland in 2013 has been used together with updated model-
ling for the 2014 survey programme. This modelling was based on a slightly larger airgun array to
that proposed for the 2015 survey and is therefore conservative in terms of predicted noise levels. All
work is described here.
The noise modelling used to inform this EIA3,4
follows technical requirements for noise models as set
out in current Guidelines (Kyhn et al., 2011):
In order to take account of the area actually ensonified by a seismic survey as well as potential other
surveys in the same general area a model of the expected noise exposure has to be included in the
supplied EIA. The model should be based on actual bathymetry, knowledge of sediment properties (to
the degree available) and realistic assumptions regarding vertical sound speed profiles and ice cover.
Modelling should not be restricted to the surface layer but extend to at least 1000 m depth or the sea-
bed. Horizontally, the model should extend to cover all areas exposed to levels likely to affect marine
mammals.
The modelling summarised below describes underwater noise in terms of peak to peak sound pres-
sure level (SPLpeakpeak) referenced to 1µPa. Source noise level is also expressed in a range of other
units (Table 7-6).
Modelling was performed using the programs NIBAS and NISIM, both of which utilize the Bellhop
implementation of the ray theory underwater sound propagation model. Bellhop and NISIM were both
developed by HLS Research respectively in 2011, (Porter, 2011) and in 2013. NIBAS was developed
by NIRAS in 2012.
The underwater noise modelling takes into account site specific parameters such as the actual ba-
thymetry and sediment properties along with sound speed profiles and ice cover extent based on
historical data, so that the model results reflect as accurately as possible the actual noise levels dur-
ing the survey.
Wherever there was uncertainty in site specific information conservative ‘worst case’ assumptions
have been made to ensure that, if anything, the magnitude of sound levels and predicted effects dis-
tance are over-estimated. This represents a precautionary approach in that any impacts should in
reality be rather less than predicted.
Key assumptions made include the following:
1. NIBAS and NISIM modelling overestimates the actual source level, as it assumes the source
is an omnidirectional point source, whereas in reality airgun arrays are area sources with a
strong vertical downwards directivity. This assumption is believed to cause sound levels in the
3 http://www.tgs.com/media/investor-webcast/External-
links/NIRAS%202013%20(SE%20Greenland%20noise%20modelling).pdf
4 http://www.tgs.com/media/investor-webcast/External-
links/NIRAS%202014%20(appendix%20to%20SE%20Greenland%202013%20noise%20modelling).pdf

64 2D seismic survey offshore South East Greenland
EIA report v1
horizontal near field up to 20 dB too high. (NB a drop of 6dB represents a halving of the
noise).
2. There is relatively little information available on key environmental parameters such as sea-
bed sediment character, and incomplete information on other important parameters such as
ice cover presence or absence and ice roughness which all affect noise propagation. Worst-
case values for these parameters were chosen for the modelling so that effect ranges would
not be underestimated. For example, the seabed surface has been assumed to be a hard re-
flective material; in reality, softer seabed sediments will tend to reduce noise propagation
more than predicted.
Table 7-6 provides the sources noise levels used for the modelling.
Table 7-6: Source noise level metrics used for modelling.
Source level for 3680 cubic inch airgun array (values for 3350 cubic inch
array proposed for 2015)
SPLpeak-peak at 1 m distance [dB re. 1 µPa] 263 dB re. 1 µPa @ 1 m
(259 dB re. 1 µPa @ 1 m)
SPLzero-peak at 1 m distance [dB re. 1 µPa] 257 dB re. 1 µPa @ 1 m
(253 dB re. 1 µPa @ 1 m)
SPLrms90% at 1 m distance [dB re. 1 µPa rms] 238 dB re. 1 µPa rms @ 1 m
(229 dB re. 1 µPa rms @ 1 m)
Duration of RMS calculation [s] 0.29 s (0.28 s)
SEL at 1 m distance [dB re. 1 µPa2s] per pulse 234 dB re. 1 µPa
2s @ 1 m
(234 dB re. 1 µPa2s @ 1 m)
Pulse duration [s] 0.4 s (0.4 s)
Source level for 5025 cubic inch airgun array (unlikely to be used in 2015)
SPLpeak-peak at 1 m distance [dB re. 1 µPa] 264 dB re. 1 µPa @ 1 m
SPLzero-peak at 1 m distance [dB re. 1 µPa] 258 dB re. 1 µPa @ 1 m
SPLrms90% at 1 m distance [dB re. 1 µPa rms] 241 dB re. 1 µPa rms @ 1 m
Duration of RMS calculation [s] 0.28 s
SEL at 1 m distance [dB re. 1 µPa2s] per pulse 235 dB re. 1 µPa
2s @ 1 m
Pulse duration [s] 0.4 s
From preliminary modelling results, sound propagation from the seismic survey is expected to be
much greater for lower frequency components of the sound spectrum. However, even for higher fre-
quencies it is expected that seismic noise will remain above 150 dB re 1µPa peak-peak for some tens
of kilometers. There is a suggestion of a complex relationship with water depth (i.e. different noise
levels at different depths for a given distance from the source) and some topographic shadowing
which is most noticeable for higher frequency parts of the spectrum.
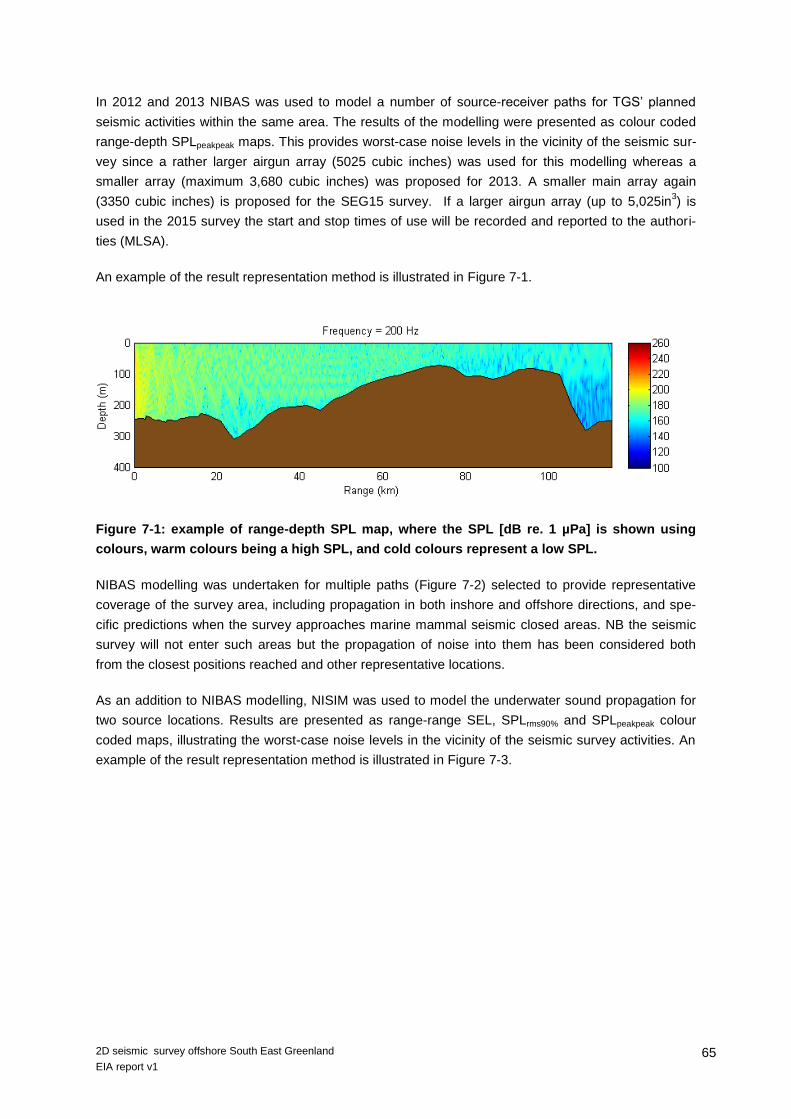
65 2D seismic survey offshore South East Greenland
EIA report v1
In 2012 and 2013 NIBAS was used to model a number of source-receiver paths for TGS’ planned
seismic activities within the same area. The results of the modelling were presented as colour coded
range-depth SPLpeakpeak maps. This provides worst-case noise levels in the vicinity of the seismic sur-
vey since a rather larger airgun array (5025 cubic inches) was used for this modelling whereas a
smaller array (maximum 3,680 cubic inches) was proposed for 2013. A smaller main array again
(3350 cubic inches) is proposed for the SEG15 survey. If a larger airgun array (up to 5,025in3) is
used in the 2015 survey the start and stop times of use will be recorded and reported to the authori-
ties (MLSA).
An example of the result representation method is illustrated in Figure 7-1.
Figure 7-1: example of range-depth SPL map, where the SPL [dB re. 1 µPa] is shown using
colours, warm colours being a high SPL, and cold colours represent a low SPL.
NIBAS modelling was undertaken for multiple paths (Figure 7-2) selected to provide representative
coverage of the survey area, including propagation in both inshore and offshore directions, and spe-
cific predictions when the survey approaches marine mammal seismic closed areas. NB the seismic
survey will not enter such areas but the propagation of noise into them has been considered both
from the closest positions reached and other representative locations.
As an addition to NIBAS modelling, NISIM was used to model the underwater sound propagation for
two source locations. Results are presented as range-range SEL, SPLrms90% and SPLpeakpeak colour
coded maps, illustrating the worst-case noise levels in the vicinity of the seismic survey activities. An
example of the result representation method is illustrated in Figure 7-3.

66 2D seismic survey offshore South East Greenland
EIA report v1
Figure 7-2: modelled noise paths.
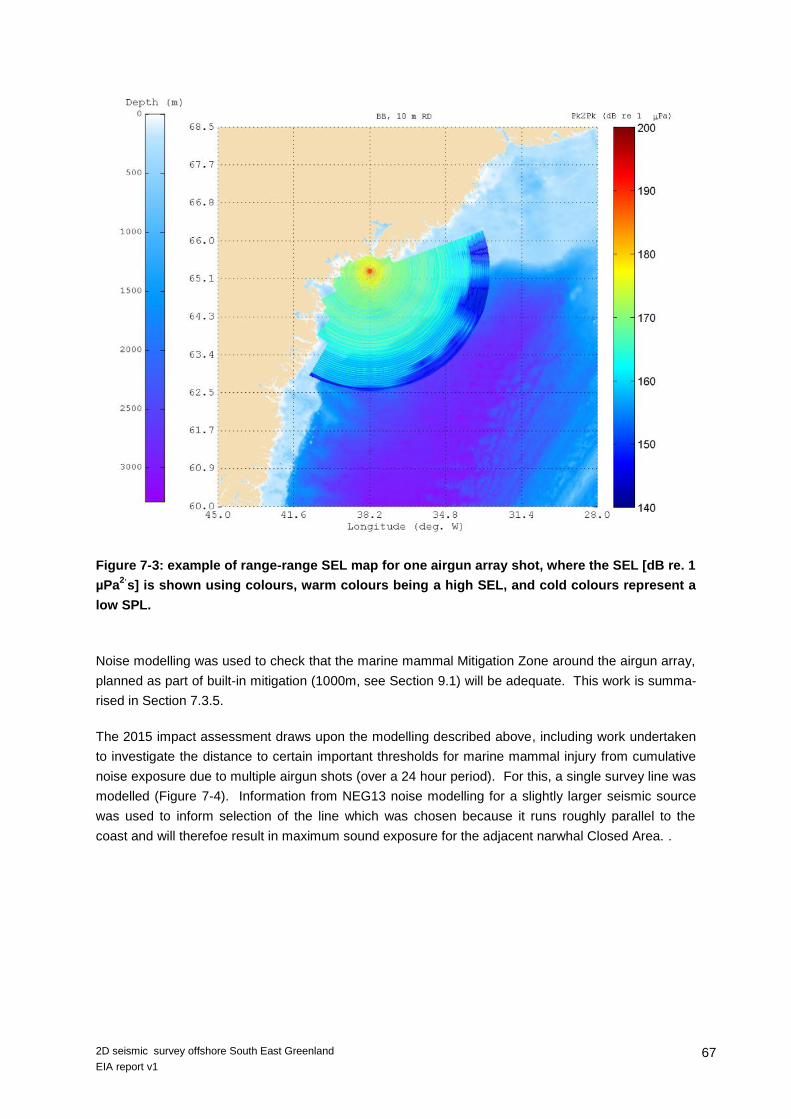
67 2D seismic survey offshore South East Greenland
EIA report v1
Figure 7-3: example of range-range SEL map for one airgun array shot, where the SEL [dB re. 1
µPa2·
s] is shown using colours, warm colours being a high SEL, and cold colours represent a
low SPL.
Noise modelling was used to check that the marine mammal Mitigation Zone around the airgun array,
planned as part of built-in mitigation (1000m, see Section 9.1) will be adequate. This work is summa-
rised in Section 7.3.5.
The 2015 impact assessment draws upon the modelling described above, including work undertaken
to investigate the distance to certain important thresholds for marine mammal injury from cumulative
noise exposure due to multiple airgun shots (over a 24 hour period). For this, a single survey line was
modelled (Figure 7-4). Information from NEG13 noise modelling for a slightly larger seismic source
was used to inform selection of the line which was chosen because it runs roughly parallel to the
coast and will therefoe result in maximum sound exposure for the adjacent narwhal Closed Area. .
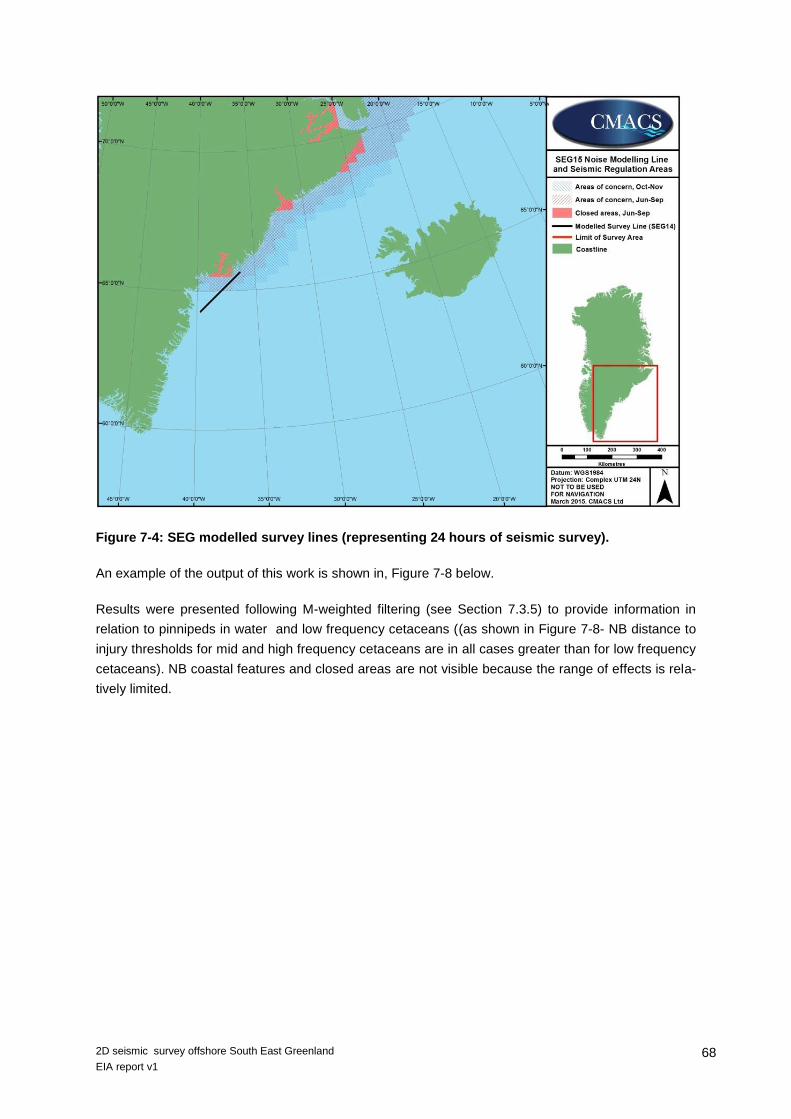
68 2D seismic survey offshore South East Greenland
EIA report v1
Figure 7-4: SEG modelled survey lines (representing 24 hours of seismic survey).
An example of the output of this work is shown in, Figure 7-8 below.
Results were presented following M-weighted filtering (see Section 7.3.5) to provide information in
relation to pinnipeds in water and low frequency cetaceans ((as shown in Figure 7-8- NB distance to
injury thresholds for mid and high frequency cetaceans are in all cases greater than for low frequency
cetaceans). NB coastal features and closed areas are not visible because the range of effects is rela-
tively limited.

69 2D seismic survey offshore South East Greenland
EIA report v1
Figure 7-5: example of cumulative noise exposure modelling (sound exposure level for low
frequency cetaceans).
7.3 Biological Environment
7.3.1 Benthic ecology
Benthic organisms are assumed to be highly sensitive to oil spills and high hydrocarbon concentra-
tions in the water. The benthic flora and fauna within the Survey Area therefore, are both potential
receptors to the impacts of a fuel/oil spill from seismic vessels operating during the survey pro-
gramme. The immediate effects of an oil spill will be seen in the surface layers of the water column
however, effects on the benthos are likely in shallow water (<50 m) where toxic concentrations can
reach the seafloor. In such areas intensive mortality has been recorded following an oil spill, for ex-
ample among crustaceans and molluscs (McCay et al., 2003a, McCay et al., 2003b).
Heavy oils may sink to the seabed as tar balls and the transport of light oils may be facilitated by ab-
sorption onto sediment particles in the water (Hjermann et al., 2007). Sediment particles are common
in coastal waters of Greenland where meltwater from glaciers can disperse widely into the open sea.
Long-term impacts may occur if oil is buried in sediments, among coarse ground or within biogenic
habitats. From such sites oil may seep over time and cause chronic pollution which may persist for
decades and cause small to moderate effects.
The direct impact of an oil spill in coastal regions is an expected mass mortality among macroalgae
and benthic invertebrates on oiled shores from a combination of chemical toxicity and smothering

70 2D seismic survey offshore South East Greenland
EIA report v1
(Boertmann & Mosbech (eds), 2011). Many benthos species, especially bivalves, accumulate hydro-
carbons, which may cause sublethal effects (e.g. reduced reproduction).
Due to the heterogeneity of the benthic environment in the proposed Survey Area, it is expected that
impacts could differ regionally.
Assessments of potential impacts on benthic ecology are summarised in Table 7-7.
Table 7-7: assessment of impacts from seismic activity on benthic ecology
Impact on Benthic Ecology
Assessment of activity
Degree of disturbance
Importance Likelihood of occurrence
Persistence Magnitude of Impact
Impact from oil spill on benthic flora
Med Local Low Short term Negligible
Justification Potential to cause mass mortality of macroalgae.
Oil spill has potential to affect large body of water including shal-low (<50m) coastal/intertidal regions howev-er the area in question does not have more than local im-portance
Controls in place to re-duce risk of spills to very low levels (Section 2).
Large oil spills have the poten-tial to per-sist and have long-term ef-fects; how-ever, it is likely any oil spill of a magnitude possible from the survey vessels (maximum volume on any one vessel around 650t) would not last for multiple years.
Impact from oil spill on benthic fauna
Low Local Low Short term Negligible
Justification It is expected that exposure to the relative-ly small vol-umes of mate-rial that could be released would not result in se-vere effects.
No known areas of high im-portance. Sea-bed fauna does underpin local ecology.
Controls in place to re-duce risk of spills to very low levels.
Large oil spills have the poten-tial to per-sist and have long-term ef-fects; how-ever, it is likely any oil spill of a magnitude possible

71 2D seismic survey offshore South East Greenland
EIA report v1
Impact on Benthic Ecology
Assessment of activity
Degree of disturbance
Importance Likelihood of occurrence
Persistence Magnitude of Impact
from the survey vessels (maximum volume on any one vessel around 650t) would not last for multiple years.
7.3.2 Pelagic ecology
Potential impacts of the seismic survey on the pelagic ecosystem are fuel/oil spills and underwater
noise. These impacts, in particular an oil spill, have the potential to impact key receptors of the pelag-
ic ecosystem at all levels from phytoplankton primary production to top zooplankton predators and fish
eggs/larvae.
The pelagic ecosystem in the region is highly seasonal with most biological activity in the surface
layers being present in spring and early summer in association with the spring bloom of phytoplank-
ton. Zooplankton abundances and distribution in the region are also highly seasonal in line with the
seasonal phytoplankton bloom. The bulk of biomass consists of grazing copepods such as Calanus
spp. Primary production is rapidly converted into large, specialised lipid stores by the herbivorous
Calanus species. The lipid rich diatom/Calanus food chain of the Arctic is seen to be important for
sustaining fish, sea bird and marine mammal populations (Falk-Petersen et al., 2002 and Scott et al.,
2002). Therefore, a reduction in Calanus abundances has the potential to lower lipid levels within the
Arctic food chain.
Impacts from any oil spill would be expected to be most severe in seasons with high biological activity
within the pelagic food web in the upper 50m of the water column, i.e. spring/early summer. By late
summer when the survey is due to commence, Calanus are expected to have migrated downwards in
the water column for overwintering and biomass of grazers in surface waters will be relatively low
(Dünweber et al., 2010). Therefore, biological activity will be lower or concentrated at the pycnocline
and so ecological damage from any fuel or oil spill on plankton communities can be assumed to be
less severe (Söderkvist et al., 2006).
Similar reasoning applies to the assessment of the effect of underwater noise on plankton. Zooplank-
ton and ichthyoplankton are unable to actively avoid the sound pressure waves generated by the air-
guns and can be killed within a distance of less than 2m with sub lethal injuries expected within 5m
(Østby et al., 2003). Despite the possibility of mortality, rates will be limited due to the highly mobile
nature of the proposed survey across a large prospect area and the highly seasonal nature of plank-
ton abundances. The impact of seismic activity on ichthyoplankton (fish eggs and larvae) has not
been assessed here as it is covered in the fisheries Section 7.3.3.
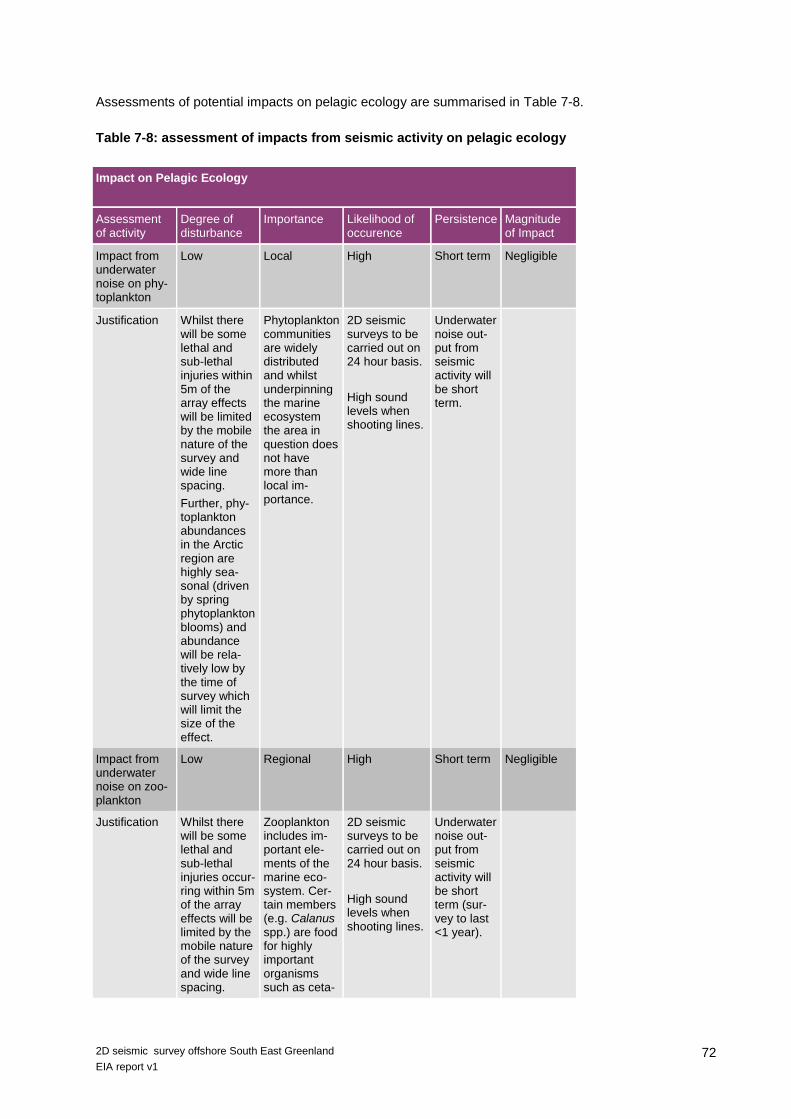
72 2D seismic survey offshore South East Greenland
EIA report v1
Assessments of potential impacts on pelagic ecology are summarised in Table 7-8.
Table 7-8: assessment of impacts from seismic activity on pelagic ecology
Impact on Pelagic Ecology
Assessment of activity
Degree of disturbance
Importance Likelihood of occurence
Persistence Magnitude of Impact
Impact from underwater noise on phy-toplankton
Low Local High Short term Negligible
Justification Whilst there will be some lethal and sub-lethal injuries within 5m of the array effects will be limited by the mobile nature of the survey and wide line spacing.
Further, phy-toplankton abundances in the Arctic region are highly sea-sonal (driven by spring phytoplankton blooms) and abundance will be rela-tively low by the time of survey which will limit the size of the effect.
Phytoplankton communities are widely distributed and whilst underpinning the marine ecosystem the area in question does not have more than local im-portance.
2D seismic surveys to be carried out on 24 hour basis.
High sound levels when shooting lines.
Underwater noise out-put from seismic activity will be short term.
Impact from underwater noise on zoo-plankton
Low Regional High Short term Negligible
Justification Whilst there will be some lethal and sub-lethal injuries occur-ring within 5m of the array effects will be limited by the mobile nature of the survey and wide line spacing.
Zooplankton includes im-portant ele-ments of the marine eco-system. Cer-tain members (e.g. Calanus spp.) are food for highly important organisms such as ceta-
2D seismic surveys to be carried out on 24 hour basis.
High sound levels when shooting lines.
Underwater noise out-put from seismic activity will be short term (sur-vey to last <1 year).

73 2D seismic survey offshore South East Greenland
EIA report v1
Impact on Pelagic Ecology
Assessment of activity
Degree of disturbance
Importance Likelihood of occurence
Persistence Magnitude of Impact
Zooplankton abundances in the Arctic region are highly sea-sonal (driven by spring phytoplankton blooms) and abundance will be rela-tively low by the time of survey which will limit the size of the effect.
The Survey Area is not known to contain par-ticularly high abundances of zooplank-ton.
Peak abun-dances earlier than planned seismic sur-vey.
ceans
Impact from oil spill on zooplankton
Low Regional Low Short term Negligible
Justification Zooplankton abundances in the Arctic region are highly sea-sonal (driven by spring phytoplankton blooms) and abundance will be rela-tively low by the time of survey which will limit the size of the effect.
Zooplankton includes im-portant ele-ments of the marine eco-system. Cer-tain members (e.g. Calanus spp.) are food for highly important organisms such as ceta-ceans
Controls in place to re-duce risk of spills to very low levels.
Large oil spills have the poten-tial to per-sist and have long-term effects however it is likely any oil spill from the survey vessels will only last a few years.

74 2D seismic survey offshore South East Greenland
EIA report v1
7.3.3 Fish and shellfish
It has been demonstrated that there is a narrow band of several meters where seismic noise can be
fatal to fish. In experiments with caged fish, animals that were between five and fifteen meters away
from seismic airguns have been demonstrated to sustain potentially permanent hearing damage
(McCauley et al., 2003). It has been suggested that as long as fish are of a suitable size (as small as
30-50mm) they are able to swim away from the mortal zone of the seismic guns (Nakken 1992) cited
in (Boertmann & Mosbech (eds), 2011) and (Boertmann, et al. 2010).
It has further been observed during assessments of wild fish behaviour that there may be a general
avoidance of seismic sounds at distances up to around 30km with an intense avoidance of sound at
up to 5km (Boertmann & Mosbech (eds), 2011) and (Boertmann, et al. 2010).
In a study by Wardle et al. (2001), underwater video footage of benthic/reef invertebrates and fish
showed that minor startle reactions were observed but there was no attempt to move away from the
source unless it was within 6m.
Various reactions have been described in different species studied, but most of the observed reac-
tions have been based around a startle reaction followed by general avoidance with pelagic species
avoiding seismic noise sources at a greater distance than benthic species (e.g. (Boertmann, et al.
2010). Lethal effects on adult fish have been observed only within a few meters directly around the
source of noise and permanent physical damage only within the first fifteen meters.
The concern relevant to adult fish is whether or not seismic noise will impair any key life cycle stage of
adult fish such as reproduction or migration.
Fish potentially affected include a range of species that are determined here to be of up to national
(Medium) importance.
Although this will represent an impact to affected fish communities the effect will be short term (hours
for discrete areas in relation to the survey, weeks to 1-2 months in terms of the whole survey) and it is
not expected that exclusion from important areas such as breeding grounds or spatially restricted
feeding areas will occur. Good practice to minimise airgun volume and power output that is planned to
reduce impacts to marine mammals will also serve to minimise disturbance effects on fish. Hence the
impact on adult fish from seismic shooting will be negligible/none (Table 7-9:).
There has been concern regarding planktonic fish larvae and eggs which are unable to avoid seismic
arrays. It has been observed that lethal and permanent sub-lethal injuries can occur within 5m from
the array (Østby et al., 2003) as cited in (Boertmann & Mosbech (eds), 2011) and (Boertmann et al.,
2010). It has been acknowledged through various surveys conducted as part of assessments by Can-
ada and Norway that the volume of water that is affected is very small and the impact is likely to be
small scale. There is concern over the level of mortality during surveys that look intensively at smaller
areas, particularly 3D surveys. It is a particular concern if such surveys coincide in space and time
with important fish spawning areas or areas of known high ichtyoplankonic abundance. For this rea-
son certain areas of known high larval abundance in Norwegian waters are closed for seismic surveys
during seasonal spawning events (Boertmann & Mosbech (eds), 2011).

75 2D seismic survey offshore South East Greenland
EIA report v1
The Survey Area is recognised as an important spawning area for Atlantic cod although spawning
takes place largly between April and May and so will be over by the time of the survey. It is also pos-
sible that areas within the Irminger current may have higher densities of juvenile fish, in particular
Icelandic cod, which spawn around western Iceland and redfish is brought towards the survey area by
the southern branch of the Irminger current. It is improbable that a spatially extensive 2D seismic sur-
vey within this region would cause a mortality rate that could impact at a population level.
In general there is very little knowledge on the effects of seismic shooting on shellfish (e.g. (Boert-
mann, et al. 2010), and there are no specific studies available addressing impacts of seismic surveys
on shellfish or on effects on their behaviour or physiology which may impact shellfish at a population
level.
Overall there is considered to be the prospect of no more than a negligible magnitude impact of in
terms of lethal/injurial effects on fish larvae and eggs and behavioural effects on adult fish, see Table
7-9:.
There are no specific studies available addressing impacts of seismic surveys on northern shrimp or
on effects on their behaviour or physiology (Boertmann, et al. 2010). There is limited fishing of north-
ern shrimp in the Survey Area. However, the Norwegian EIA of hydrocarbon activities in the Barents
Sea does not assess impacts on northern shrimp or fishery on this resource, because the species is
considered relatively robust to external impacts (Østby et al., 2003, cited in (Boertmann et al.,
2010)).Thus, regarding shellfish, impacts are expected to be in the close vicinity of the shellfish and
overall the impact will be negligible.
The assessments of the impacts from the proposed 2D seismic survey on fish and shellfish (including
Valued Ecosystem Components) and justification of the assessment is summarised in Table 7-9.
Table 7-9: assessments of impacts from the seismic survey on fish and shellfish (including
Valued Ecosystem Components).
Impacts on fish and shellfish
Assessment of activity
Degree of disturbance
Importance Likelyhood of occur-rence
Persistence Magnitude of Impact
Impact from underwater noise on eggs and larvae
Low National High Short term Negligible
Justification 2D survey will not impact any area for pro-longed peri-ods.
Spawning peak periods are generally earlier than the planned
Cod stocks national importance, others re-gional or lower.
2D seismic surveys always pro-duce high sound pres-sure
The under-water noise is related to seismic activity and will be short term.
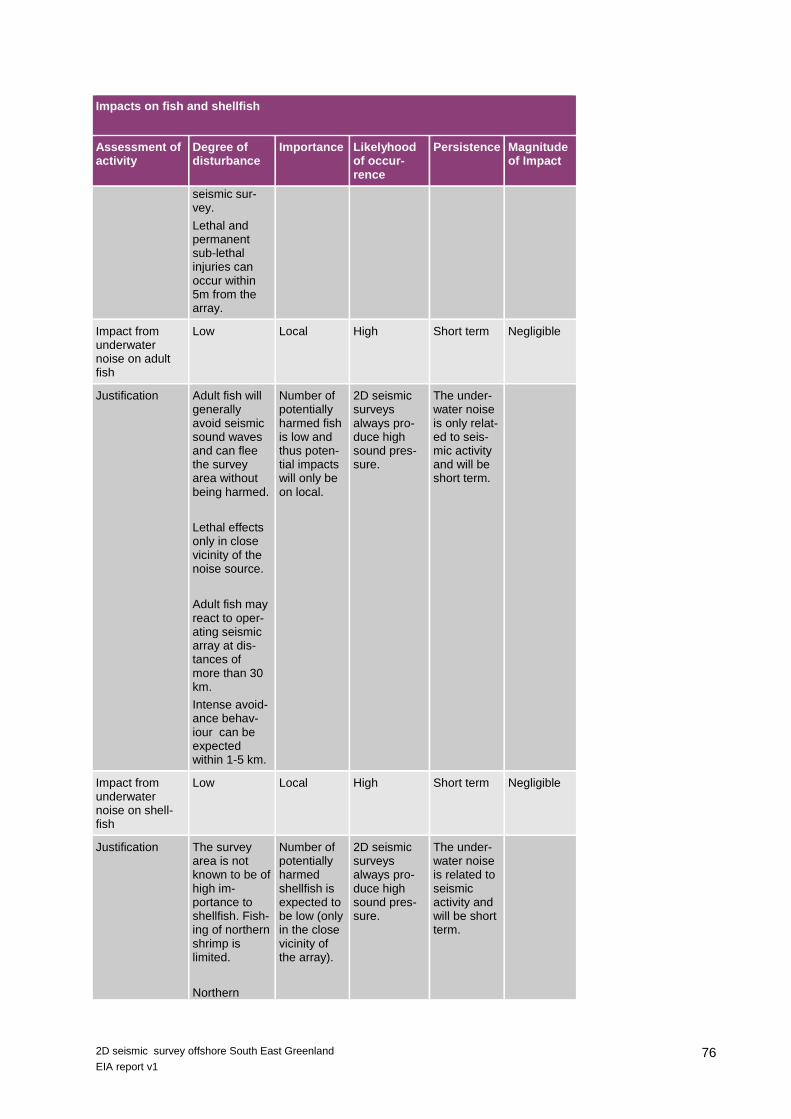
76 2D seismic survey offshore South East Greenland
EIA report v1
Impacts on fish and shellfish
Assessment of activity
Degree of disturbance
Importance Likelyhood of occur-rence
Persistence Magnitude of Impact
seismic sur-vey.
Lethal and permanent sub-lethal injuries can occur within 5m from the array.
Impact from underwater noise on adult fish
Low Local High Short term Negligible
Justification Adult fish will generally avoid seismic sound waves and can flee the survey area without being harmed.
Lethal effects only in close vicinity of the noise source.
Adult fish may react to oper-ating seismic array at dis-tances of more than 30 km.
Intense avoid-ance behav-iour can be expected within 1-5 km.
Number of potentially harmed fish is low and thus poten-tial impacts will only be on local.
2D seismic surveys always pro-duce high sound pres-sure.
The under-water noise is only relat-ed to seis-mic activity and will be short term.
Impact from underwater noise on shell-fish
Low Local High Short term Negligible
Justification The survey area is not known to be of high im-portance to shellfish. Fish-ing of northern shrimp is limited.
Northern
Number of potentially harmed shellfish is expected to be low (only in the close vicinity of the array).
2D seismic surveys always pro-duce high sound pres-sure.
The under-water noise is related to seismic activity and will be short term.

77 2D seismic survey offshore South East Greenland
EIA report v1
Impacts on fish and shellfish
Assessment of activity
Degree of disturbance
Importance Likelyhood of occur-rence
Persistence Magnitude of Impact
shrimp is considered relatively ro-bust to exter-nal impacts. Effects only expected within meters of the sound source.
7.3.4 Seabirds
Noise, collisions (with associated contaminant spill risks), fuel spills and light disturbance represent
risks to seabirds that will be introduced by vessels associated with seismic survey (Arctic council,
2009; (Merkel, 2010). Apart from the direct effects seabirds may also indirectly be affected by impacts
on a lower part of the food web. Icebreaking will not be required during the SEG15 survey and is not
considered further here.
There is not expected to be any direct interaction between survey activities and seabirds in the most
important coastal locations since the survey will never approach within 12nm of the shore; however,
migrating birds and species foraging further offshore may well encounter operations. Any fuel spills or
other marine pollution incident would of course potentially threaten coastal birds if the contaminants
came ashore and will be considered in the assessment.
Seabirds may be at a higher risk of suffering negative impacts from an oil spill than other marine or-
ganisms because of the amount of the time they spend on the sea surface and because coastlines,
where seabirds congregate, may receive a build up of oil as a result of wave action. This can cause
mortality on contact as the birds may be smothered, drown, poisoned, die from hypothermia as feath-
er waterproofing property is destroyed by oil or they may be unable to or have difficulty moving and
die from exhaustion. The number of birds affected would be related to the size and location of any
spill in relation to the habitats of birds.
The assessments of the potential impacts from the proposed 2D seismic survey on birds (Valued
Ecosystem Components and species of special concern) and justification of the assessment is sum-
marised in

78 2D seismic survey offshore South East Greenland
EIA report v1
Table 7-10. Noise from airguns is generally regarded as having potential for negligible direct effects
on birds as it is underwater (Boertmann & Mosbech (eds), 2011) and therefore not treated further.
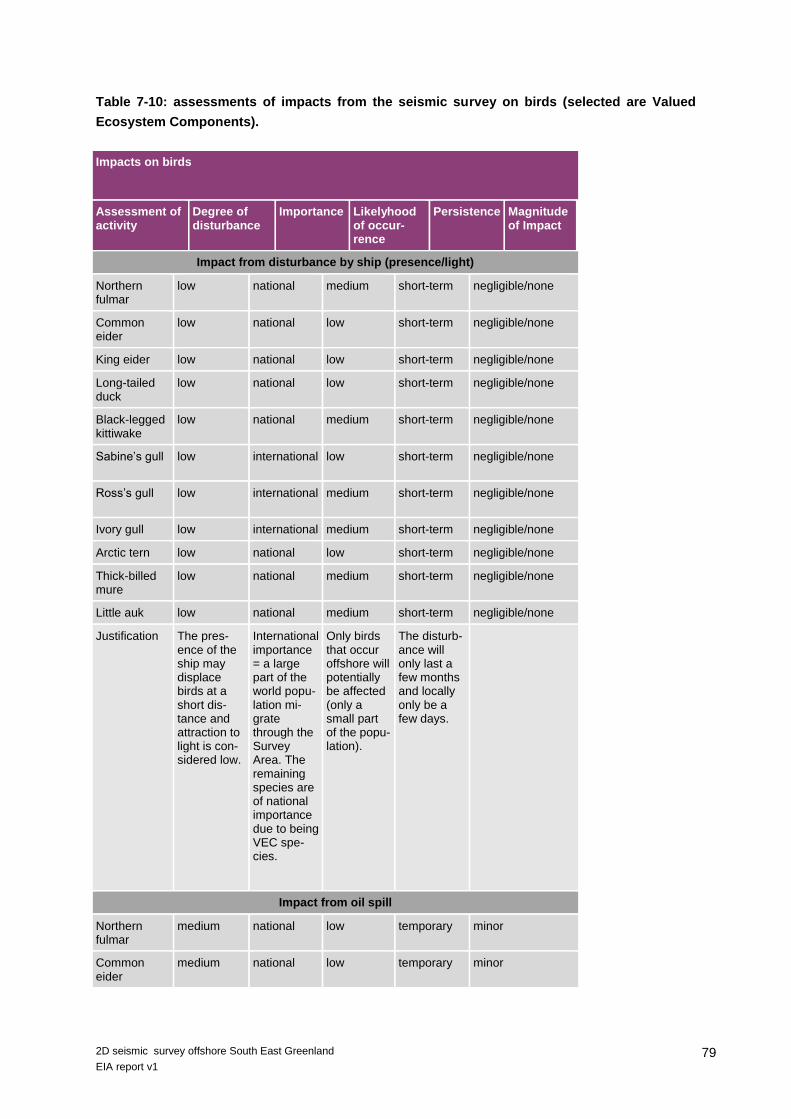
79 2D seismic survey offshore South East Greenland
EIA report v1
Table 7-10: assessments of impacts from the seismic survey on birds (selected are Valued
Ecosystem Components).
Impacts on birds
Assessment of activity
Degree of disturbance
Importance Likelyhood of occur-rence
Persistence Magnitude of Impact
Impact from disturbance by ship (presence/light)
Northern fulmar
low national medium short-term negligible/none
Common eider
low national low short-term negligible/none
King eider low national low short-term negligible/none
Long-tailed duck
low national low short-term negligible/none
Black-legged kittiwake
low national medium short-term negligible/none
Sabine’s gull low international low short-term negligible/none
Ross’s gull low international medium short-term negligible/none
Ivory gull low international medium short-term negligible/none
Arctic tern low national low short-term negligible/none
Thick-billed mure
low national medium short-term negligible/none
Little auk low national medium short-term negligible/none
Justification The pres-ence of the ship may displace birds at a short dis-tance and attraction to light is con-sidered low.
International importance = a large part of the world popu-lation mi-grate through the Survey Area. The remaining species are of national importance due to being VEC spe-cies.
Only birds that occur offshore will potentially be affected (only a small part of the popu-lation).
The disturb-ance will only last a few months and locally only be a few days.
Impact from oil spill
Northern fulmar
medium national low temporary minor
Common eider
medium national low temporary minor
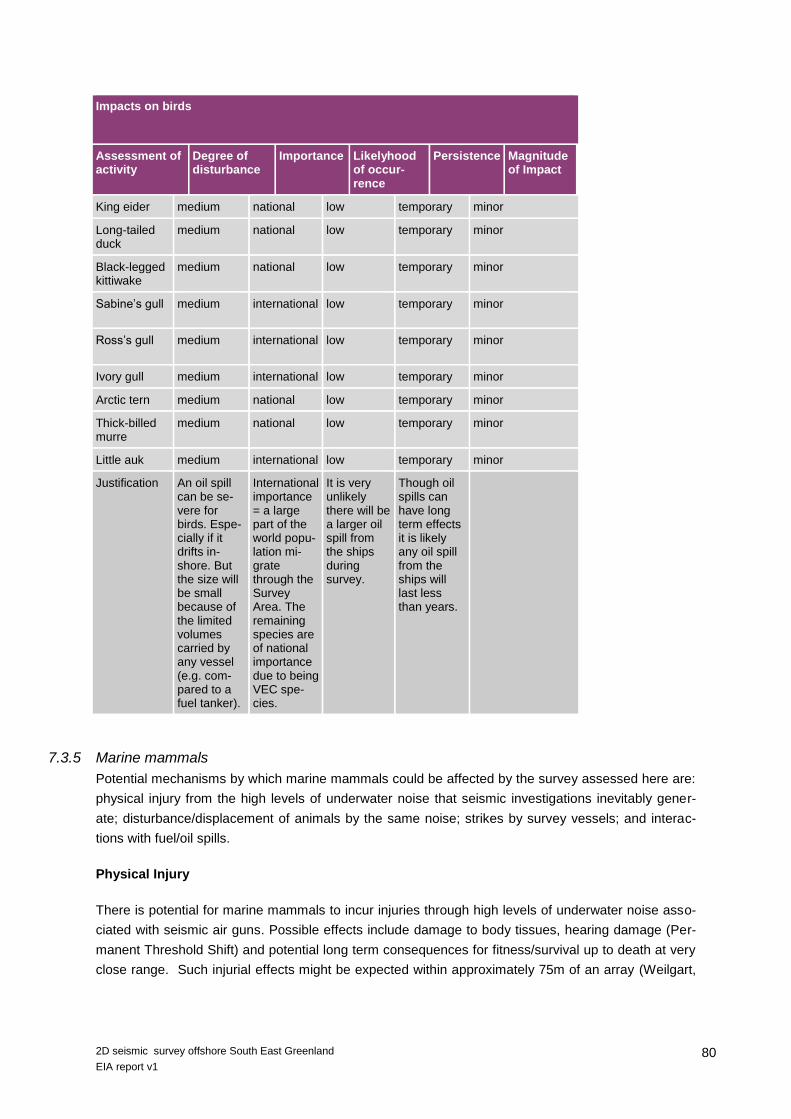
80 2D seismic survey offshore South East Greenland
EIA report v1
Impacts on birds
Assessment of activity
Degree of disturbance
Importance Likelyhood of occur-rence
Persistence Magnitude of Impact
King eider medium national low temporary minor
Long-tailed duck
medium national low temporary minor
Black-legged kittiwake
medium national low temporary minor
Sabine’s gull medium international low temporary minor
Ross’s gull medium international low temporary minor
Ivory gull medium international low temporary minor
Arctic tern medium national low temporary minor
Thick-billed murre
medium national low temporary minor
Little auk medium international low temporary minor
Justification An oil spill can be se-vere for birds. Espe-cially if it drifts in-shore. But the size will be small because of the limited volumes carried by any vessel (e.g. com-pared to a fuel tanker).
International importance = a large part of the world popu-lation mi-grate through the Survey Area. The remaining species are of national importance due to being VEC spe-cies.
It is very unlikely there will be a larger oil spill from the ships during survey.
Though oil spills can have long term effects it is likely any oil spill from the ships will last less than years.
7.3.5 Marine mammals
Potential mechanisms by which marine mammals could be affected by the survey assessed here are:
physical injury from the high levels of underwater noise that seismic investigations inevitably gener-
ate; disturbance/displacement of animals by the same noise; strikes by survey vessels; and interac-
tions with fuel/oil spills.
Physical Injury
There is potential for marine mammals to incur injuries through high levels of underwater noise asso-
ciated with seismic air guns. Possible effects include damage to body tissues, hearing damage (Per-
manent Threshold Shift) and potential long term consequences for fitness/survival up to death at very
close range. Such injurial effects might be expected within approximately 75m of an array (Weilgart,

81 2D seismic survey offshore South East Greenland
EIA report v1
2007), although the actual range of effect in relation to any particular survey will depend upon the
source noise level and environmental conditions influencing the propagation of sound underwater.
Marine mammals potentially present in the Survey Area include important species such as northern
right whale and humpback whale. Although close range encounters with species of arguably lower
importance (e.g. minke whale or harbour porpoise) are more likely, any injury causing effects should
be avoided where possible.
The risk of injuries to marine mammals is reduced to a very low level by built in mitigation which is
implementation of best practice guidelines as detailed in Kyhn et al. (2011) and summarised in (Sec-
tion 9.1). Essentially, through a combination of making use of the lowest power and smallest array
possible at any particular time, application of a ramp up (soft-start) procedure and visual and/or
acoustic surveillance by trained and experienced observers, the possibility of an impact is reduced.
Noise modelling (Section 7) has been undertaken to check that the mitigation planned will be ade-
quate to achieve the necessary protection of marine mammals. Of interest to the EIA is the maximum
propagation distance (for any modelled position) of certain important Sound Pressure Level (SPL)
thresholds related to lethal and injurial levels of noise. Thresholds of 240 and 220dBpeak-peak re 1µPa
are often cited as representing precautionary values for these respective thresholds (e.g. Parvin et al.,
2007 presented a comprehensive review of information on lethal and physical impacts of underwater
noise). Similar thresholds were suggested by Southall et al. (2007) for injury (defined as Permanent
Threshold Shift (PTS)):
Cetaceans 230 dB re 1µPa peak (unweighted)
Pinnipeds 218 dB re 1µPa peak (unweighted)
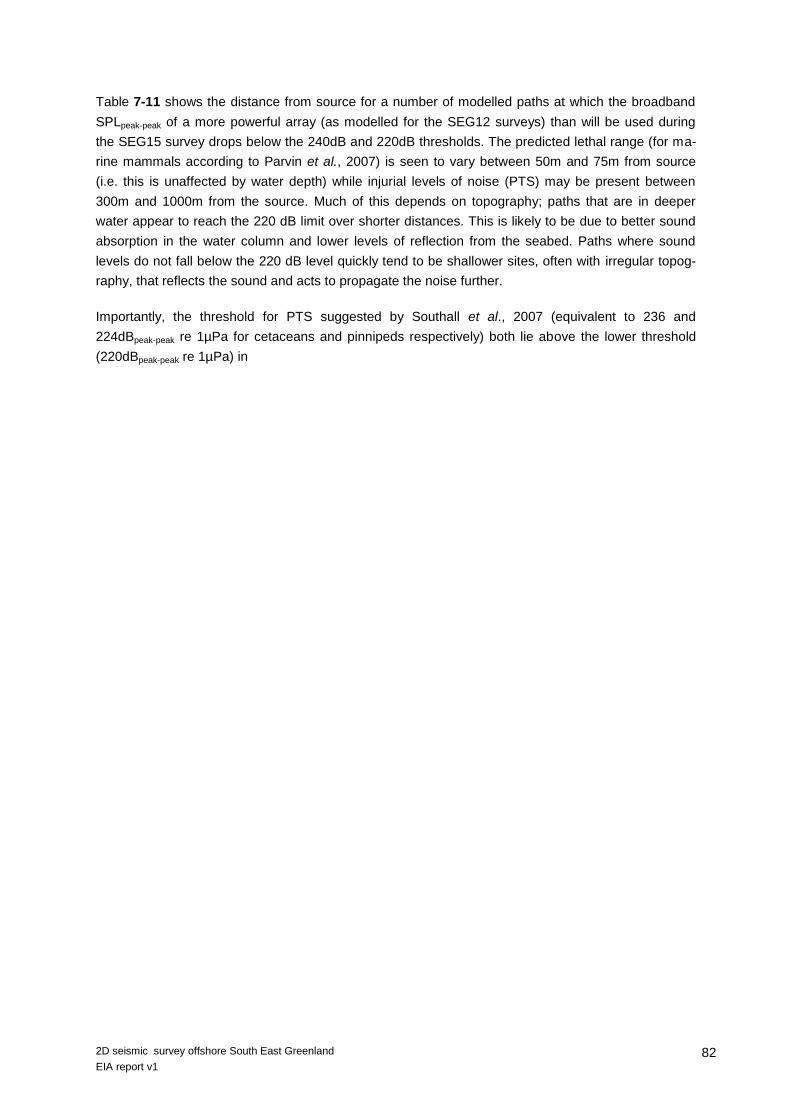
82 2D seismic survey offshore South East Greenland
EIA report v1
Table 7-11 shows the distance from source for a number of modelled paths at which the broadband
SPLpeak-peak of a more powerful array (as modelled for the SEG12 surveys) than will be used during
the SEG15 survey drops below the 240dB and 220dB thresholds. The predicted lethal range (for ma-
rine mammals according to Parvin et al., 2007) is seen to vary between 50m and 75m from source
(i.e. this is unaffected by water depth) while injurial levels of noise (PTS) may be present between
300m and 1000m from the source. Much of this depends on topography; paths that are in deeper
water appear to reach the 220 dB limit over shorter distances. This is likely to be due to better sound
absorption in the water column and lower levels of reflection from the seabed. Paths where sound
levels do not fall below the 220 dB level quickly tend to be shallower sites, often with irregular topog-
raphy, that reflects the sound and acts to propagate the noise further.
Importantly, the threshold for PTS suggested by Southall et al., 2007 (equivalent to 236 and
224dBpeak-peak re 1µPa for cetaceans and pinnipeds respectively) both lie above the lower threshold
(220dBpeak-peak re 1µPa) in

83 2D seismic survey offshore South East Greenland
EIA report v1
Table 7-11. This therefore represents a conservative estimate of the maximum distance at which in-
jurial levels of noise could occur.

84 2D seismic survey offshore South East Greenland
EIA report v1
Table 7-11: distance to selected threshold SPL values for each modelled path. NB figures
based on modelling for SEG12 survey with a larger array (5,025 cubic inch array, SPL 264dB
re. 1 μPa @ 1 m).
Distance from source where
broadband SPL peak-peak drops below:
Path 240 dB re 1 µPa 220 dB re 1 µPa
Path 1 75m 1000m
Path 2 75m 1000m
Path 3 50m 700m
Path 4 75m 1000m
Path 5 75m 1000m
Path 6 75m 900m
Path 7 75m 900m
Path 8 75m 900m
Path 9 75m 600m
Path 10 75m 500m
Path 11 75m 800m
Path 12 75m 1000m
Path 13 75m 900m
Path 14 50m 600m
Path 15 50m 350m
Path 16 50m 300m
Path 17 50m 350m
The potential for cumulative exposure effects also needs to be considered. The limit (summed energy
for all pulses) proposed by Southall et al. (2007) for cetaceans is 198dB re 1µPa2s and for pinnipeds
in water 186dB re 1µPa2s (NB some authorities consider this latter threshold to be too low: Thompson
and Hastie (2012) have proposed a revised multiple pulse criterion of 198 dB re 1 µPa2s (Mpw)).
Underwater noise modelling was completed to investigate the summed energy for all pulses (over a
24 hour period) in relation to the limits above. Results are presented graphically as the maximum
sound level at any depth and shown below for an area of interest in relation to the adjacent Closed
Area for narwhal inshore of the survey.

85 2D seismic survey offshore South East Greenland
EIA report v1
Figure 7-6: sound level map for inshore area of SEG14 survey, showing maximum over depth
sound exposure for: top, pinnipeds in water- 186dB threshold is shown by the dark red colour;
bottom 198dB low frequency cetaceans.
The modelling predicts that a pinniped (seal) which did not respond by moving away from the survey
could be exposed to injurial levels of noise if present within approximately 2.2km in the worst case
situation (Table 7-12). The equivalent distance for ‘low frequency’ cetaceans (as defined by Southall
et al., 2007) is less than 0.5km. Medium (e.g. narwhal) or high frequency cetaceans would not be
affected to any greater distance.
It is expected that animals would respond to high levels of noise by moving away, thus reducing the received level of noise to below injurial levels.
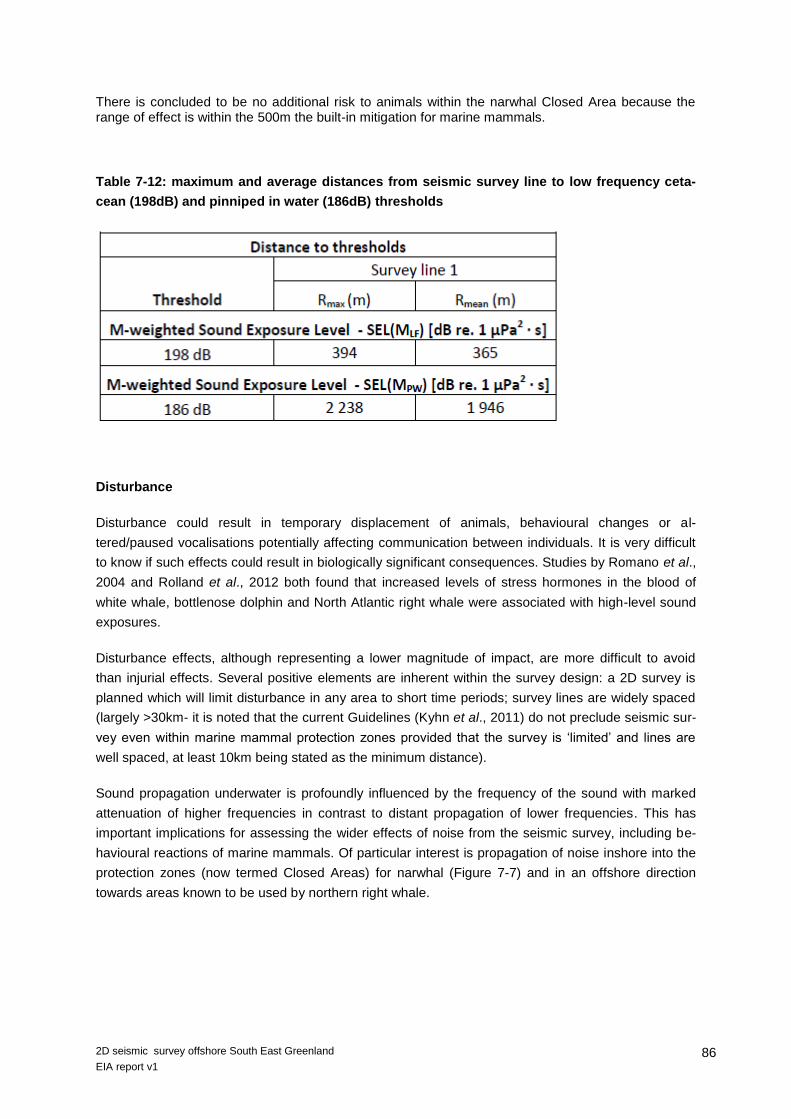
86 2D seismic survey offshore South East Greenland
EIA report v1
There is concluded to be no additional risk to animals within the narwhal Closed Area because the range of effect is within the 500m the built-in mitigation for marine mammals.
Table 7-12: maximum and average distances from seismic survey line to low frequency ceta-
cean (198dB) and pinniped in water (186dB) thresholds
Disturbance
Disturbance could result in temporary displacement of animals, behavioural changes or al-
tered/paused vocalisations potentially affecting communication between individuals. It is very difficult
to know if such effects could result in biologically significant consequences. Studies by Romano et al.,
2004 and Rolland et al., 2012 both found that increased levels of stress hormones in the blood of
white whale, bottlenose dolphin and North Atlantic right whale were associated with high-level sound
exposures.
Disturbance effects, although representing a lower magnitude of impact, are more difficult to avoid
than injurial effects. Several positive elements are inherent within the survey design: a 2D survey is
planned which will limit disturbance in any area to short time periods; survey lines are widely spaced
(largely >30km- it is noted that the current Guidelines (Kyhn et al., 2011) do not preclude seismic sur-
vey even within marine mammal protection zones provided that the survey is ‘limited’ and lines are
well spaced, at least 10km being stated as the minimum distance).
Sound propagation underwater is profoundly influenced by the frequency of the sound with marked
attenuation of higher frequencies in contrast to distant propagation of lower frequencies. This has
important implications for assessing the wider effects of noise from the seismic survey, including be-
havioural reactions of marine mammals. Of particular interest is propagation of noise inshore into the
protection zones (now termed Closed Areas) for narwhal (Figure 7-7) and in an offshore direction
towards areas known to be used by northern right whale.

87 2D seismic survey offshore South East Greenland
EIA report v1
Figure 7-7: example noise propagation from the closest planned point of the survey into a
narwhal Protection Zone; top, 2012 modelling 25-1,000Hz (5,025 cubic inch array), bottom,
2013 broadband modelling (3,680 cubic inch array).
For narwhal the majority of the survey period will overlap with the period of protection (see Figure
5-15) (1 June to 30 November- Closed Area June-September); however, modelling of sound propaga-
tion from the survey into protection zones for the 2013 survey suggested that this would not lead to
disturbance effects. Narwhal are termed mid-frequency cetaceans by Southall et al. (2007) and are
understood to have a lower frequency perception limit of around 150 Hz. At the upper end of their
hearing range narwhal and other mid and high-frequency cetaceans are understood to be able to
perceive sound up to 160 kHz. Noise modelling stopped at 1 kHz since a test case demonstrated
rapid attenuation of higher frequencies. There was no evidence of sound propagation into this area

88 2D seismic survey offshore South East Greenland
EIA report v1
for sound above 150Hz; rapid attenuation of higher frequencies and a degree of topographic limitation
influence the results with the conclusion that there should not be disturbing levels of noise present
within the protection waters.
Figure 7-8: example noise model output (propagation offshore- 25-200Hz).
In 2014 the narwhal Protection Zones were revised as Closed Areas. Whilst the survey will not enter
these areas some provisional lines are planned which approach the seaward boundary of the most
southerly Closed Area (see Figure 5-15). It is expected that there will be disturbing levels of noise
within some few kilometres of the survey but that the majority of the narwhal Closed Area will be unaf-
fected because of the rapid attenuation of higher frequencies and attenuation due to shallowing ba-
thymetry mentioned above.
Bowhead whales, which could occur around ice floes if these are present inshore of the survey, are
most sensitive to lower frequencies and are known to respond behaviourally to relatively low levels of
anthropogenic noise with sensitivity to noise of a few tens of Hz or lower. Southall et al. (2007) cite
Richardson et al., (1999) who reported the onset of significant behavioural disturbance from multiple
pulses at RLs (RMS over pulse duration) around 120 dB re 1 μPa for migrating bowhead whales.
Other low-frequency cetaceans, and bowhead whales not engaged in migration, were considered to
be slightly less sensitive with behavioural disturbance initiating around 140 to 160 dB re 1 μPa. Alt-
hough there are no specific protection zones for bowhead whales in the Survey Area, consideration
ought to be given to possible disturbance. Sound pressure levels are predicted to be of a magnitude

89 2D seismic survey offshore South East Greenland
EIA report v1
sufficient to disturb the most sensitive species such as bowhead whale at up to 50km. For this reason
MMSOs are to be especially aware of the potential for bowhead whales to occur and they will act in a
precautionary manner if the animals are known to be in the area. If possible the survey will move
away from any area where bowheads have been reported to be active to a distance of at least 50km
with survey commencing away from the area in question. There will also be a 2km firing restriction to
limit the strongest behavioural responses.
Equivalent mitigation was used during the 2013 survey by TGS off NE Greenland. When a bowhead
whale was spotted by the MMSOs on 22 September 2013 this resulted in the survey temporarily
ceasing to fire airguns and relocating more than 50km before survey re-started and avoiding the area
for several days. The MMSOs reported that they received full cooperation from the seismic crew and
Client Representative on board.
It should be noted that the 50km estimated disturbance distance is relatively high compared to rec-
orded examples of such disturbance (e.g. reports of reactions at 20-30km from airgun arrays are cited
in Kyhn et al., 2011), potentially reflecting the result of various conservative assumptions used in the
noise modelling. Other species of cetacean, and pinnipeds, are not expected to be disturbed to any
greater distance than bowhead whale in an inshore direction but northern right whale also have opti-
mum hearing at lower frequencies and it is assumed that they could be at least as sensitive as bow-
head whales. There is evidence that this species uses an area offshore from the Survey Area around
July/August and again in autumn (Mellinger et al., 2011). Figure 7-8 provides an example of offshore
propagation towards this area, including lower frequencies where northern right whale have peak
sensitivity. This species was the subject of an unusual opportunistic study in the Bay of Fundy (Rol-
land et al., 2012); the authors report that a marked drop in background noise from shipping, especially
between 50 and 150Hz, immediately after 11 September 2001 (‘9/11’) was correlated with a signifi-
cant reduction in the levels of stress-related faecal hormone metabolites in North Atlantic right whales.
It was noted by the authors that shipping noise could interfere with whale calls (‘acoustic masking’).
Threshold noise levels for disturbance are uncertain but it should be considered that there is potential
for disturbing levels of noise to propagate to the limit of the modelled range (around 100km- see also
Boertmann & Mosbech (eds), 2011) for frequencies up to 50Hz. This is believed to be highly con-
servative (for reasons previously described but notably including precautionary assumptions about the
source magnitude and propagation loss).
Northern right whales are believed to be at very low levels following near extinction due to hunting
and there is potential for medium severity impacts on a population level even if only one or two indi-
viduals were affected. During the survey northern right whale are expected to be affected only when
the survey takes place in the most offshore areas (around 300km from the coast and within around
100km of the area believed to be utilised by the whales). The peak sensitivity for northern right whale
is believed to be around July/August when they are understood to congregate in the vicinity of the
former Cape Farewell whaling grounds (Mellinger et al., 2011).
There is considered to be a very small chance that the survey could seriously disturb northern right
whale since a number of factors would need to combine for the survey to be taking place in an off-
shore area at the time that northern right whale were present. If temporary displacement occurred it
would be in an offshore direction and it is expected that migration movements would not be affected.

90 2D seismic survey offshore South East Greenland
EIA report v1
Vessel strikes
The survey, in largely ice free waters, should not come into direct conflict with species such as bow-
head and narwhal which have characteristics that make them especially vulnerable to collisions with
vessels (bowhead whales tend to be relatively hard to detect and their size restricts their manoeuvra-
bility in confined areas around ice while narwhal may ‘freeze’ rather than flee an approaching vessel).
Whist the vessel is in transit the speed will not generally exceed around 10 knots. MMSOs will remain
on duty in order to check the path for marine mammals. Marked changes in speed or direction will be
avoided in general (this is built in mitigation - see Section 2.3.8). Other vessels, including supporting
craft, should exercise caution through good watches and reducing speed/taking careful avoidance
measures when whales are sighted nearby, speeds for these craft should not exceed 10 knots.
Accidental oil/fuel spills
The majority of oil required during the survey is marine gas oil (MGO). Approximately 11m3
of MGO
will be used each day. At any one time there will be up to around two thousand tonnes of oil bunkered
on vessels but up to high hundreds of tonnes on any single vessel during the survey.
The nature and magnitude of the effects of an oil spill depend on a combination of factors including
the size of the spill, prevailing weather conditions and sensitivity of receptors. Effects of a spill can be
remote from the source of the incident if a slick travels, although the quantities of fuel involved in the
proposed seismic activity are not so high that significant remote effects would be likely.
Marine mammals are generally considered less sensitive to oiling compared to other marine organ-
isms (except polar bear and juvenile seals) as the majority of species rely on a thick layer of blubber
for insulation rather than fur (Boertmann & Mosbech (eds), 2011). However, this characteristic also
means that oil present within the water column will immediately come in to direct contact with the ce-
tacean’s skin or eyes, potentially causing irritation or blindness (Boertmann & Mosbech (eds), 2011).
Past studies have also suggested that whales are unable to detect oil-contaminated waters and there-
fore cannot avoid polluted areas (Harvey and Dalheim, 1994).
There are several important areas to marine mammals within the Survey Area that would be especial-
ly vulnerable to an oil spill event (see Section 5.5). The formation of ice can increase the risk for ma-
rine mammals to be exposed and impacted by forcing species to surface in oil-contaminated areas.
Cetaceans can also be indirectly impacted via the food chain. There are intimate links between differ-
ent species and local habitats: walrus for example feed on benthic bivalves in waters less than around
100m deep and rely on good stocks of invertebrate prey (see Section 5.5). Surface feeding whales
such as bowhead, minke, fin, sei, blue and humpback are also susceptible to oil ingestion, which can
result in injuries to the gastrointestinal tract. Baleen whales are also at risk of fouling baleen plates
during filtration feeding (Boertmann and Mosbech, 2011).
Some marine mammals, notably narwhal and bowhead whale, have relatively restricted (and to some
extent predictable) summer habitats. Even though cetaceans are thought to be less vulnerable to oil
spills than other marine groups any impact to these areas could potentially represent a serious prob-
lem, especially for bowhead whale which have a very limited stock off the east of Greenland.

91 2D seismic survey offshore South East Greenland
EIA report v1
No discharge of oil into the environment would be planned. All vessels to be involved in the survey
have International Oil Pollution Prevention certificates and detailed procedures to minimise risks and
deal with spills. All personnel will be required to be aware of the sensitivity of the environment and of
the procedures in place to minimize risks. Critical personnel will be required to have an in depth
knowledge of procedures and their roles in the case of an oil spill.
Assessments of potential impacts on marine mammals are summarised in Table 7-13.
Table 7-13: assessment of the potential impacts on marine mammals during seismic survey
activity.
Impact on Marine Mammals
Assessment of activity
Degree of disturbance
Importance Likelihood of occurrence
Persistence Magnitude of Impact
Death/injury from high levels of underwater noise
Bowhead whale
high international low short term minor
Blue whale high international low short term minor
Narwhal high international low short term minor
White whale high international low Short term minor
Northern right whale
high international low short term minor
Other large baleen whales
high national low short term minor
Odontocete cetaceans
high national low short term minor
Polar bear high international low short term minor
Walrus high international low short term minor
Other pinnipeds (VEC species)
high international low short term minor
Pinnipeds (others)
high national low short term minor
Justification The effect, if it oc-curred, would be serious.
VEC spe-cies as-sumed to be of inter-national importance, others at least na-tional.
Certain spe-cies (e.g. narwhal, polar bear) are not ex-pected to encounter underwater noise from the survey at close range. For other species this is possible but with mitigation in
Survey will take place over a period of up to around 2 months.

92 2D seismic survey offshore South East Greenland
EIA report v1
Impact on Marine Mammals
Assessment of activity
Degree of disturbance
Importance Likelihood of occurrence
Persistence Magnitude of Impact
place the likelihood is not >25% for any species. NB a 1km Mitigation Zone is as-sumed.
Disturbance/displacement by underwater noise
Bowhead whale
medium international medium short term minor
Blue whale medium international low short term minor
Narwhal medium international medium short term minor
White whale medium international low Short term minor
Northern right whale
medium international low short term minor
Other large baleen whales
medium national high short term minor
Odontocete cetaceans
medium national high short term minor
Polar bear low international low short term none
Walrus low international low short term negligible
Other pinnipeds (VEC species)
low international high short term minor
Pinnipeds (others)
low national high short term negligible
Justification Bowhead may be present inshore or to the north of the sur-vey, these and other species are conser-vatively assumed to experience at least a medium level of impact.
Pinnipeds are ex-pected to be relative-ly less sensitive than cetaceans.
As above. Certain spe-cies have a relatively low chance of encountering survey (blue whale, white whale and northern right whale) at relevant distances. Bowhead are likely to be present well north of the survey so the assessment is conserva-tive, narwhal are assumed unlikely to be present at
Survey will take place over a period of up to around 2 months.

93 2D seismic survey offshore South East Greenland
EIA report v1
Impact on Marine Mammals
Assessment of activity
Degree of disturbance
Importance Likelihood of occurrence
Persistence Magnitude of Impact
close enough range to experience marked disturbance effects. Polar bear should not be affected.
Collision with vessels
Bowhead whale
high international low short term minor
Blue whale high international low short term minor
Narwhal high international low short term minor
White whale high international low Short term minor
Northern right whale
high international low short term minor
Other large baleen whales
medium national low short term negligible
Odontocete cetaceans
medium national low short term negligible
Polar bear high international low short term none
Walrus high international low short term minor
Other pinnipeds (VEC species)
high international low short term minor
Pinnipeds (others)
medium national low short term negligible
Justification Collisions would cause injury, poten-tially death. For spe-cies with small popu-lations/important species this would be serious and nowhere less than medium level disturbance.
As above. No evidence of collisions in previous surveys. Measures in place to reduce risks.
Polar bear should not be affected.
Survey will take place over a period of up to around 2 months.
Fuel/oil spills
Bowhead whale
medium international low short term minor
Blue whale low international low short term negligible
Narwhal medium international low short term minor
White whale medium international low Short term minor
Northern low international low short term negligible
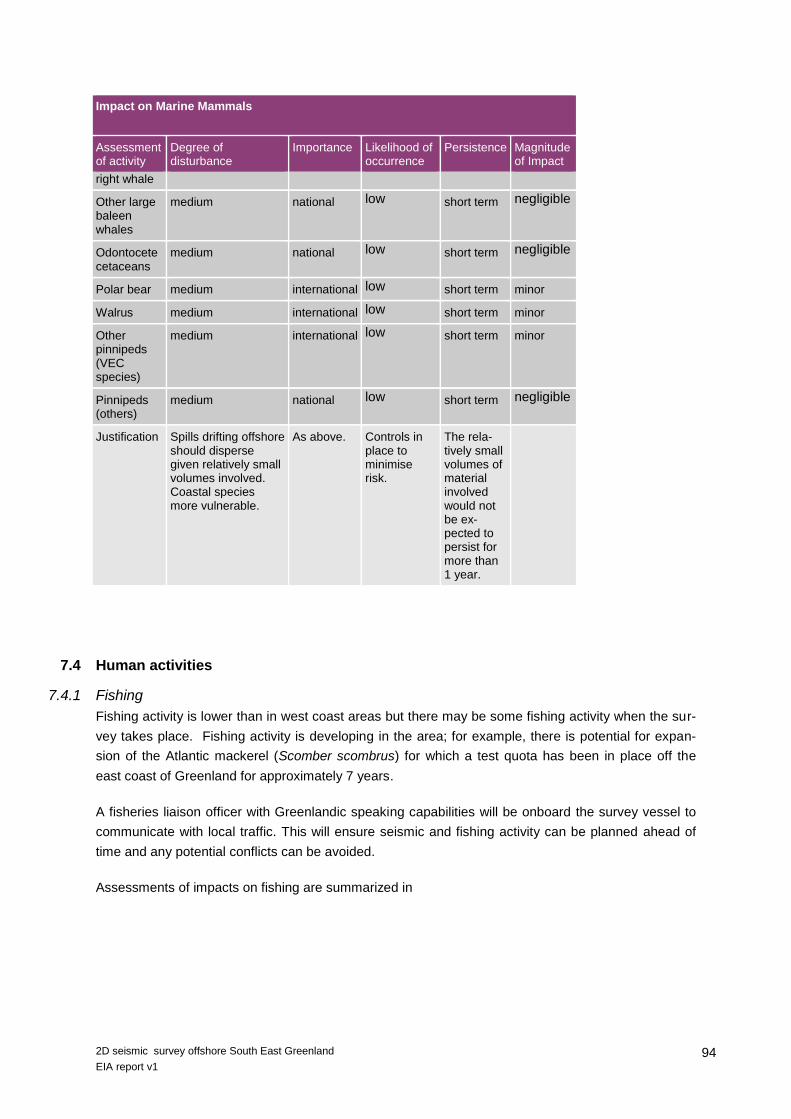
94 2D seismic survey offshore South East Greenland
EIA report v1
Impact on Marine Mammals
Assessment of activity
Degree of disturbance
Importance Likelihood of occurrence
Persistence Magnitude of Impact
right whale
Other large baleen whales
medium national low short term negligible
Odontocete cetaceans
medium national low short term negligible
Polar bear medium international low short term minor
Walrus medium international low short term minor
Other pinnipeds (VEC species)
medium international low short term minor
Pinnipeds (others)
medium national low short term negligible
Justification Spills drifting offshore should disperse given relatively small volumes involved. Coastal species more vulnerable.
As above. Controls in place to minimise risk.
The rela-tively small volumes of material involved would not be ex-pected to persist for more than 1 year.
7.4 Human activities
7.4.1 Fishing
Fishing activity is lower than in west coast areas but there may be some fishing activity when the sur-
vey takes place. Fishing activity is developing in the area; for example, there is potential for expan-
sion of the Atlantic mackerel (Scomber scombrus) for which a test quota has been in place off the
east coast of Greenland for approximately 7 years.
A fisheries liaison officer with Greenlandic speaking capabilities will be onboard the survey vessel to
communicate with local traffic. This will ensure seismic and fishing activity can be planned ahead of
time and any potential conflicts can be avoided.
Assessments of impacts on fishing are summarized in

95 2D seismic survey offshore South East Greenland
EIA report v1
Table 7-14.

96 2D seismic survey offshore South East Greenland
EIA report v1
Table 7-14: assessments of impacts from seismic surveys on fishing.
Impact on fishing
Assessment of activity
Degree of disturbance
Importance Likelyhood of occurence
Persistence Magnitude of Impact
Impact on fishing
Low International Low Short term Negligible
Justification Limited fish-ing in the survey area.
Coordination with fisheries liaison officer on board survey ves-sel.
Low risk of disturbance of fishing and reduced catch.
Fishing vessels from Green-land and other coun-tries.
Low risk
that fishing vessels and seismic sur-veys will occur at the same time.
A fisheries liaison officer with Green-landic speak-ing capabili-ties will be onboard the survey ves-sel.
Seismic activities are short term.
7.4.2 Hunting
Hunting mainly takes place from spring to autumn located largely within 10 nm of the coast and in-
shore of the survey. There are not expected to be any conflicts with this activity, see Table 7-15.
Table 7-15: assessments of impacts from seismic surveys on hunting.
Impact on hunting
Assessment of activity
Degree of disturbance
Importance Likelyhood of occurence
Persistence Magnitude of Impact
Impact on activities related to hunting
Low Local Low Short term Negligible
Justification The area is not an im-portant hunt-ing area.
Few hunters in the sur-vey area.
Low risk that hunting and seismic survey will occur in the survey area at the same time.
Seismic activi-ties are short term.

97 2D seismic survey offshore South East Greenland
EIA report v1
7.4.3 Tourism
Although the potential for tourism activities to develop in the survey area is recognised, it is consid-
ered that current activities are at a relatively low level and given the non-intensive (i.e. mobile) nature
of the survey there is not any significant potential for impacts on tourism. Should survey vessels en-
counter tourist (or other) vessels offshore, it is in the interests of the survey to avoid close approaches
to minimize the risk of damage occurring to streamers. Avoidance of such conflict would be achieved
via routine watches and, where necessary, radio communications.
The cruise ships will typically sail along the ice edge or near the coast. It is assumed that there will be
no impact with activities related to tourism to take into account Table 7-16.
Table 7-16: assessment of impact from seismic surveys on tourism
Impact on tourism
Assessment of activity
Degree of disturbance
Importance Likelyhood of occurence
Persistence Magnitude of Impact
Impact on tourism
Low International Low Short term Negligible/none
Justification Cruise ships will typically sail along the ice edge or near the coast.
Cruise ships from differ-ent coun-tries.
Low risk that cruise ships will be close to the seismic surveys.
Risk of damage minimized via routine watchers on board sur-vey vessel.
Seismic sur-veys are short term.
Negligible
8 CUMULATIVE IMPACTS
No other sesmic surveys are believed to be planned off SE Greenland in 2015 and this assessment
has concluded that interactions with other activities such as fishing, tourism and hunting will be negli-
gible.
The proposed SEG15 survey will be carried out in conjunction with the NEG15 survey, with SEG15
likely to take place when NEG15 is complete or when pack ice conditions in the North are no longer
favourable.
Although this is the fifth consecutive year that TGS has applied to carry out seismic surveys off south
east Greenland, very little seismic data has been acquired, with only 968 line km shot in 2012. There
is considered to be no potential for cumulative impacts to occur.

98 2D seismic survey offshore South East Greenland
EIA report v1
9 MITIGATION & MONITORING
9.1 Key Built-in Mitigation
Certain mitigation is planned within the survey design, or will be implemented to meet the expecta-
tions of the authorities consenting the survey. This was summarised in Section 2. Here, it was stated
that the DCE’s detailed guidelines (Kyhn et al., 2011 and Johansen et al., 2012) would be followed.
These guidelines are summarised here.
As well as recommending mitigation procedures to follow the guidelines also stipulate the following as
a code of best practice. Comments are made where applicable.
Seismic arrays will not be larger than needed to fulfil the required survey (a relatively large
(powerful) array is needed because deep seismic imaging is planned, see Section 2.2).
Where suitable mitigation guns shall be used, this is a single gun of the lowest possible out-
put.
Airguns will not be used away from the transect line except during ramp-up procedures on
approach.
At least four qualified marine mammal and seabird observers (MMSO) including PAM opera-
tors will be present on the source vessel with a minimum of one observer monitoring visually
and one PAM operator monitoring acoustically during pre-firing watches.
The MMSOs will be provided with a suitably sheltered observation point which provides good
visual coverage around the source vessel and communications to the seismic observers (to
enable a shut down or delay firing if required). The ideal location for this observation point is
on top of the bridge (“monkey island”).
MMSO observations and acoustic monitoring will be continuous in order to identify marine
mammals entering the 200m injury zone and instruct a reduction in seismic output to single
mitigation gun.
Two Passive Acoustic Monitoring (PAM) operators will be on board. PAM will be continuously
deployed and monitored throughout pre-watch and seismic survey. The methodology for ob-
servations and the reporting of data shall be done in line with DCE guideline requirements.
The following is a summary of key elements of DCE’s mitigation guidelines (2011) which will also be
followed during the SEG15 survey:

99 2D seismic survey offshore South East Greenland
EIA report v1
Pre-firing watch
Due to the nature of air gun arrays and the levels of underwater noise they propagate, it is important
to monitor the area around the boat especially prior to commencement of air gun firing. Under DCE
guidelines an exclusion zone of 500m area from the centre of the air gun array is to be monitored for
marine mammals, this will be increased to 1,000m for SEG15 because the results of noise model-
ling indicate that dangerous levels of noise could be present to that range. A dedicated marine
mammal observer (MMO) should be on duty to monitor the exclusion zone prior to any air gun firings.
The pre-firing watch is required to be at least 30 minutes in length in water less than 200m deep.
A minimum of 60 minute pre-firing watch is required in waters deeper than 200m because of the
potential presence of deep diving animals that would be missed by a shorter watch.
The seismic crew must ask the MMO for an all-clear before starting (Ramp up start) firing.
Air gun firing delays
If a marine mammal (whale, dolphin or seal) enters the 1,000m exclusion zone during the pre-firing
watch (30 or 60 min) the ramp up procedure will be delayed until 20 minutes after the last sighting.
DCE guidelines state that within the mitigation zone there is 200m injury zone. If marine mammals
enter the mitigation zone there is no need to stop firing, however, if they enter the injury zone the
output of the array will be reduced to only the mitigation gun, which will be a single gun of the
smallest volume.
Guidelines that have also been suggested by BMP for previous surveys stipulate that seismic arrays
should not be fired within 2km of bowhead whales. This approach is to be adopted for the SEG15
survey.
Ramp-ups (Soft Starts)
DCE guidelines state that seismic arrays should not start at full power. In order to prevent sudden
noise shock to any marine mammals a ramp-up should be undertaken. The Ramp-up should be con-
ducted by a gradual build-up of power, starting with the smallest gun and adding in others gradually.
Where technically possible the soft start will take 20 minutes to complete, it will never be less
than 20 minutes. The ramp-up is designed to allow marine mammals sufficient warning and time to
leave the area.
If the airgun array has stopped firing for any period longer than 5 minutes full pre-watch and ramp
up procedures should be undertaken. If the period is less than 5 minutes the MMO should conduct
a visual search for marine mammals inside the exclusion zone before shooting recommences. If a
marine mammal is present, commencement of the airguns should not be undertaken for 20 minutes
after the last sighting and a soft start should be undertaken.
Ramp up procedures should be conducted on the approach to the beginning of the seismic transect
line. If ramp up procedures cannot be undertaken for technical or other reasons, suitable measures
should be implemented to ensure the mitigation zone is free.
100 2D seismic survey offshore South East Greenland
EIA report v1
Airgun tests
If airgun testing is required on the entire array at full power a full pre firing watch and soft start is re-
quired. If testing is required on one gun at low power no soft start should be required. If one or sever-
al guns are to be fired on full power a reduced soft start is permissible with a gradual build-up of
power/guns over a time proportional to the number of guns being fired following a quick visual search
by the MMO. The soft start time should not be longer than 20 minutes in this instance. MMO watches
should be conducted throughout the tests and tests delayed if mammals are within the exclusion
zone.
Line Change
If the line change time is planned to be longer than 20 minutes the air gun array should be shut
down at the end of the previous line and a 20 minute soft start should be undertaken prior to recom-
mencement. During line changes of less than 20 minutes arrays must either be shut-down or
operated with the mitigation gun only.
A pre firing watch should be undertaken during line changes, in cases where line changes are greater
than 20 minutes a full 30/60 minute pre watches should be undertaken prior to the expected start
of the ramp up procedures. Pre-firing watches can commence before the end of the previous transect.
If a marine mammal enters the exclusion zone the soft start should be delayed until 20 minutes after
the last sighting.
9.2 Proposed Monitoring
Measurements of underwater noise generated during seismic survey are planned to validate model-
ling undertaken to support this EIA. This will involve deployment of a hydrophone to record received
sound at varying distances from the survey and at different depths from a representative location of
the survey area.
It is planned that this work be undertaken from the survey support vessel (to provide the ability to
measure at distance from the source vessel). The support (or ‘chase’) vessel regularly returns to port
during survey and it is proposed that a survey team join during such a port call to undertake meas-
urements during a representative part of the survey. The survey team will be equipped with all nec-
essary technical equipment, the key elements being calibrated hydrophones, amplifier, filter(s) and
computer/sound card. Oceanographic equipment (ropes, ballast, winch etc.) will be available on the
chase vessel. The survey team will also be equipped with standard equipment to measure water tem-
perature, depth and salinity.
1. The support vessel will position itself ahead of the source vessel, around 500m away from the
survey line and 5km in front of the survey, and hold position.
2. The noise measurement team will ready themselves and deploy the hydrophone(s) to an ini-
tial depth of 50m. Continuous recordings of underwater sound will be made within the limits
of equipment used (e.g. between 7Hz and 80kHz).

101 2D seismic survey offshore South East Greenland
EIA report v1
3. Once the source vessel is 750m distant the recordings are started. After 1 minute of recording
the hydrophone will be lowered to 33% water depth and measurements made for 1 minute,
then 66% and finally seabed plus 10m (both for 1 minute). IN this way, measurement at all
depths will be made while the survey ship is between 750m – 500m from the hydrophones.
4. The equipment will then be retrieved. When the source is around 20km distant the process
will be repeated; and again when at 50, 100 and 150km distances.
5. Sound speed profiles will be determined by measurement of depth, salinity and temperature
at each measurement location.
6. Source vessel position will be recorded at all times and analysed retrospectively to calculate
distance from source for all sound measurements.
7. If time allows additional measurements from close to the source will be made by repeating
steps 1-2 at different depths.
Much of the survey effort is focused on the continental shelf and so the work would be planned in
waters up to around 300m deep. Favourable weather would be required for the support vessel to
hold position while measurements were made.
It is recognised that the support vessel has a number of responsibilities and may need to break off
from noise measurement work, for example if required to avoid conflict between the seismic survey
and another vessel. The noise measurement work is however expected to be completed within a 24
hour period.
Sound measurements will take place in both the NEG15 and the SEG15 areas if possible. Ice condi-tions in the NEG15 Survey Area might prevent such a study in this area. This will not be known until survey is underway.

102 2D seismic survey offshore South East Greenland
EIA report v1
10 REFERENCES
Anker-Nilssen T (1987). Metoder til konserkvensanalyser olje/sjøfugl. - Vildtrapport 44. Trondheim:
Norsk Institutt for Naturforskning.
Arctic council (2009). Arctic Marine Shipping, Assessment report.
Bacon S, Reverdin G, Rigor I & Snaith H (2002). A freshwater jet on the east Greenland Shelf.
Journal of Geophysical Research, 107, C7.
Bauerfeind E, Bodungen B, Arndt, K, & Koeve, W (1994). Particle flux, and composition of sediment-
ing matter, in the Greenland Sea. Journal of marine systems, 5(6), pp 411-423.
Bertness M D, Leonard G H, Levine J M, Schmidt P R, & Ingraham A O (1999). Testing the relative
contribution of positive and negative interactions in rocky intertidal communities. Ecology, 80(8), pp
2711-2726.
Blue Ocean Institute (2012). www.blueocean.org/seafood
Boertmann D (2007). Grønlands Rødliste. Grønlands Hjemmestyre, Direktoratet for Miljø og Natur, pp
154.
Boertmann D & Mosbech A (eds.) (2011). The western Greenland Sea, a strategic environmental
impact assessment of hydrocarbon activities. Aarhus University, DCE – Danish Centre for Environ-
ment and Energy, pp 268. - Scientific Report from DCE – Danish Centre for Environment and Energy
no. 22.
Boertmann D, Mosbech A, Schiedek, D & Johansen K (eds) (2009a). The western Greenland Sea. A
preliminary strategic environmental impact assessment of hydrocarbon activities in the KANUMAS
East area. National Environmental Research Institute, Aarhus University, Denmark, pp 246. – NERI
Technical report no. 719. http://www.dmu.dk/Pub/FR719.pdf
Boertmann D, Olsen K, & Nielsen R D (2009b). Seabirds and marine mammals in Northeast Green-
land. Aerial surveys in spring and summer 2008. National Environmental Research Institute, Aarhus
University, Denmark, pp 50. – NERI Technical Report no. 721. http://www.dmu.dk/Pub/FR721.pdf
Boertmann D, & Nielsen, R D (2010). A bowhead whale calf observed in northeast Greenland waters.
Polar Record, 46, pp 373-375.
Boertmann D, Tougaard J, Johansen K, & Mosbech A (2010). Guidelines to environmental impact
assessment of seismic activities in Greenland waters. NERI Technical Report no. 785.
Bolshaya Sovetskaya Entsiklopediya. (1979).
Born E W, Rysgaard S, Ehlmé G, Sejr M, Acquarone M & Levermann N (2003). Underwater observa-
tions of foraging free-living walruses (Odobenus rosmarus) including estimates of their food consump-
tion. Polar Biology 26: pp 348-357.

103 2D seismic survey offshore South East Greenland
EIA report v1
Braham H W (1984). The Bowhead Whale, Balaena mysticetus. Marine Fisheries review, 46, pp 45-
53.
Brandt A (1995). Peracarid fauna (Crustacea, Malacostraca) of the Northeast Water Polynya off
Greenland: documenting close benthic-pelagic coupling in the Westwind Trough. Marine ecology pro-
gress series. Oldendorf, 121(1), pp 39-51.
Brandt A, Piepenburg D (1994) Peracarid crustacean assemblages of the Kolbeinsey Rldge, north of
Iceland. Polar Biology, 14, pp 97-10.
Carey, A G (1991). Ecology of North American Arctic continental shelf benthos: a review. Continental
Shelf Research, 11(8), 865-883.
Carmack E, & Wassmann P (2006). Food webs and physical-biological coupling on pan-Arctic
shelves: Unifying concepts and comprehensive perspectives. Progress in Oceanography, 71, pp 446–
477.
Christensen I, Haug T, & Øien N (1992). Seasonal distribution, exploitation and present abundance
of stocks of large baleen whales (Mysticeti) and sperm whales (Physeter macrocephalus) in Norwe-
gian and adjacent waters. International Council for Exploration of the Seas, Journal of Marine Sci-
ence, 49, pp 341–355.
Coachmann L, & Aagaard K, (1974). Physical Oceanography of Arctic and Subarctic Seas. Seattle:
Washington and Seattle Department of Oceanography.
Cohen D M, Inada T, Iwamoto T, & Scialabba N (1990). Gadiform fishes of the world (Order
Gadiformes). An annotated and illustrated catalogue of cods, hakes, grenadiers and other gadiform
fishes known to date. FAO Species Catalogue,10.
Culik MB (2010). Odontocetes: the toothed whales: Distribution, Behaviour, Migration and Threats.
Compiled for the Convention on Migratory species (CMS/UNEP) Secretariat, Bonn, Germany.
Dalpadado P, & Skjoldal H R (1991). Distribution and life history of krill from the Barents Sea, pp. 443-
460 in Sakshaug E, Hopkins C C E, & 0ritsland N A, (eds.) (1990). Proceedings of the Pro Mare
Symposium on Polar Marine Ecology, Polar Research, JO(2).
Danish Centre for Environment and Energy (2012). A Strategic Environmental Impact Assessment of
hydrocarbon activities in the Greenland sector of the Labrador Sea and the southeast Davis Strait.
Aarhus University, pp 224.
Danish Centre for Environment and Energy (2014). GIS Data - seismic regulation areas in Greenland,
revised January 2014.
Danish Meteorological Institute (2012). http://www.dmi.dk/dmi/index/gronland.htm Accessed February
2013.
Dietz, R. (2008). Contaminants in Marine Mammals in Greenland. Aarhus University: National
Environmental Research Institute.

104 2D seismic survey offshore South East Greenland
EIA report v1
Dietz R, Riget F, & Johansen P (1996). Lead, Cadmium, Mercury and Selenium in Greenland marine
mammals. The Science of the Total Environment, 186, pp. 67-93.
Dünweber M, Swalethorp R, Kjellerup S, Nielsen T G, Arendt K E, Hjorth M, Tönnesson K, Møller E F
(2010). Succession and fate of the spring diatom bloom in Disko Bay, western Greenland. Marine
Ecology Progress Series, 419: pp 11-29.
Eastgreenland (2013). http://www.eastgreenland.com/database.asp?lang=eng&num=202 (senest
hentet eller vist den 1. February 2013)
Falk-Petersen S, Dahl T M, Scott C L, Sargent J R, Gulliksen B, Kwasniewski S, Hop H, Millar, R-M
(2002). Lipid biomarkers and trophic linkages between the Arctic ctenophores and calanoid copepods
in Svalbard waters. Marine Ecology Progress Series, 227, pp 187-194.
Falk-Pedersen S, Mayzaud P, Kattner G, Sargent J (2009). Lipids and life strategy of Arctic Calanus.
Marine Biological Research, 5, pp18-39.
Falk-Pedersen S, Pavlov V, Timofeev S, Sargent J R (2007). Climate variability and possible effects
on arctic food chains: the role of Calanus, In Ørbek, J B, Kallenborn R, Tombre I, Hegeseth E N, Falk-
Petersen, S, Hoel A H (Eds.) Arctic-alpine ecosystems and people in a changing environment.
Springer, Berlin, pp 147-166.
Frederiksen M, Boertmann D, Ugarte F, & Mosbech A, (eds) (2012). South Greenland. A Strategic
Environmental Impact Assessment of hydrocarbon activities in the Greenland sector of the Labrador
Sea and the southeast Davis Strait. Aarhus University, DCE – Danish Centre for Environment and
Energy, pp 220. Scientific Report from DCE – Danish Centre for Environment and Energy No. 23
http://www.dmu.dk/Pub/SR23.pdf.
Garcia E G (2007). The Northern Shrimp (Pandalus borealis) Offshore Fishery in the Northeast
Atlantic.Advances in Marine Biology, 52.
General Bathymetric Chart of the Oceans (2008).
http://www.gebco.net/data_and_products/gebco_web_services/web_map_service/#getmap Accessed
February 2013.
Gordon J, Gillespie D, Potter J, Frantzis A, Simmonds M P, Swift R, & Thompson D (2003). A review
of the effects of seismic surveys on marine mammals. Marine Technological Society Journal. 37(4) pp
16-34.
Graf G (1992). Benthic-pelagic coupling: a benthic view. Oceanography and Marine Biology: An An-
nual Review, 30.
Greenland Institute of Natural Resources (2003): Biodiversity of Greenland - a country study.
Technical Report No. 55,Pinngortitaleriffik, Grønlands Naturinstitut, pp 165.
Greenland Institute of Natural Resources (2012). http://www.natur.gl (27/01/2012).

105 2D seismic survey offshore South East Greenland
EIA report v1
Greenland Institute of Natural Resources (2013). Fisk. http://www.natur.gl/fisk-og-skaldyr/fisk/.
Accessed January 20th 2013.
Greenland Statistics (2013). Catch
http://www.stat.gl/dialog/main.asp?lang=da&version=2011&link=FI&subthemecode=t13&colcode=t
(senest hentet eller vist den 4. February 2013).
Guldbæk K (pers com) (2013). Cod fishery in Greenland water 2013. 4.. February 2013. Head of
section.
Gyory J, Mariano A, & Ryan E (2008). The Irminger Current. Downloaded from Ocean Surface
Currents: http://oceancurrents.rsmas.miami.edu/atlantic/irminger.html
Hanna E, Wood L, & Nance H (2002). A polar airstream and sea-ice off south east Greenland.
Weather, 57.
Hansen K, Buch E, & Gregersen U (2004). Weather, Sea and Ice conditions offshore West
Greenland. Copenhagen: Dansih Meteorological Institute.
Harvey J T, & Dalheim M E (1994). Cetaceans in oil, pp 257-264, in Loughin T R, (ed). Marine Mam-
mals and the Exonn Valdez – Academic Press, San Diego.
Heide-Jørgensen M P, Simon M J, & Laidre K L (2007). Estimates of large whale abundance in
Greenlandic waters from a ship-based survey in 2005.
Hirche H J, Baumann M E M, Kattner G, & Gradinger R (1991). Plankton distribution and the impact
of copepod grazing on primary production in Fram Strait, Greenland Sea. Journal of Marine Systems,
2(3), pp 477-494.
Hjermann D Ø, Melson A, Dingsør G E, Durant J M, Eikeset A M, Røed L P, Ottersein G, Storvil G,
Stenseth N C (2007). Fish and oil in the Lofoten- Barents Sea System: synoptic review of the effects
of oil spill on fish populations. Marine Ecology Progress Series, 339, pp 283-299.
Hobson K A, Fisk A, Karnovsky N, Holst M, Gagnon J-M & Fortier M
w
of energy and contaminants. Deep-Sea Research, 49, pp 5131-5150.
Home rule declaration no 8 of 2nd March 2009 on protection of hunting of birds.
http://www.lovgivning.gl/gh.gl-love/dk/2009/bkg/bkg_08-2009_dk/bkg_nr_08-2009_dk.htm
Icelandic Fisheries (2013). http://www.fisheries.is/main-species/pelagic-fishes/capelin/ Acsessed 1st
February 2013.
ICES 2011.Report of the North Western Working Group (NWWG), 26 April-3 May 2011, ICES
Headquarters, Copenhagen. ICES CM 2011/ACOM:7. 975 pp.
106 2D seismic survey offshore South East Greenland
EIA report v1
ICES (2012). www.natur.gl.
http://www.natur.gl/fileadmin/user_files/Dokumenter/FISK/xDK_sammendrag_af_fiskeraadgivning_for
_2013__NAFO.pdf. Accessed 2013.
Jefferson T A, Leatherwood S, Webber M A (1993). FAO Species identification guide. Marine mam-
mals of the world. UNEP/FAO, Rome, pp 320.
Kiørboe T, Nielsen T G (1994). Regulation of zooplankton biomass and production in a temperate,
coastal ecosystem. 1. Copepods. Limnology Oceanography, 39, pp 493-507.
Knauss J (1996). Introduction to Physical Oceanography. Prentice Hall.
Kyhn L A, Tougaard J, Johansen K, Boertmann D, & Mosbech, (2011). A. Guidelines to the environ-
mental impact assessment of seismic activities in Greenland waters, 3rd
revised edition.
Lippert H, Iken K, Rachor E & Wiencke C (2001). Macrofauna associated with macroalgae in the
Kongsfjord (Spitsbergen). Polar Biology, 24(7): pp 512-522.
McCauley R D, Fewtrell J, & Popper A N (2003). High intensity anthropogenic sound damages fish
ears. Journal of Acoustical Society of America, 113 (1), pp 638-642.
McCay D P F, Gibson M, Cobb J S (2003a). Scaling restoration of American lobsters: combined de-
mographic and discounting model for an exploited species. Marine Ecology Progress Series, 264, pp
197-212.
McCay D P F, Peterson C H, DeAlteris J T, Catena J (2003b). Restoration that targets function as
opposed to structure: replacing lost bivalve production and filtration. Marine Ecology Progress Series,
264, pp 177-196.
Mellinger D K, Nieukirk S L, Klinck K, Klinck H, Dziak R P, Clapham P J & Brandsdóttir B (2011). Con-
firmation of right whales near a nineteenth-century whaling ground east of southern Greenland. Bio-
logical Letters.
Merkel F M (2010). Light-induced bird strikes on vessels in Southwest Greenland. Greenland Institute
of Natural Resources.
Ministry of Fisheries (2011), Hunting and Agriculture, Letter.
http://dk.nanoq.gl/Emner/Erhverv/Erhvervsomraader/Fangst_og_Jagt/~/media/7BB1564F0B754DBC9
BE87DB9FC411BB1.ashx (Access 4th February 2013).
Ministry for Fisheries (2012). Hunting and Agriculture, Fact Sheet.
http://uk.nanoq.gl/~/media/uk_nanoq/apnn_dep%20for%20fiskeri%20fangst%20og%20landbrug/publi
cations/factsheet%20grl%20seal_april2012_eng%20%20dok895739.ashx (senest hentet eller vist
den 4. February 2013).
Mjelle A K (2006). Halibut mitogenomics: A study of mitochondrial genome sequence of Atlantic,
Pacific and Greenland Halibut. Masters Thesis, University of Bodo.

107 2D seismic survey offshore South East Greenland
EIA report v1
Møller P R, Nielsen J G, Knudsen S W, Poulsen J Y, Sünksen K & Jørgensen, O A (2010). A checklist
of the fish fauna of Greenland waters. Zootaxa, 2378, pp 1-84.
Møller E F, Nielsen T G, & Richardson K (2006). The zooplankton community in the Greenland Sea:
Composition and role in carbon turnover. Deep-Sea Research I, 53, pp 76–93.
Mumm N, Auel H, Hanssen H, Hagen W, Richter C, & Hirche H J (1998). Breaking the ice: large-scale
distribution of mesozooplankton after a decade of Arctic and transpolar cruises. Polar Biology, 20, pp
189 -197.
Nakken, Odd (1992). Scientific basis for management of fish resources with regard to seismic
exploration. Proceedings of Pteropiscis II, Bergen Norway.
NAMMCO Scientific Committee (1997). Report of the Fifth Meeting. Tromso. (NAMMCO/7/6).
NANOQ (2013a) www.nanoq.gl, 2013, quotas. u.d.
http://uk.nanoq.gl/Emner/News/News_from_Government/2013/01/Whales.aspx (Access 4th February
2013)
NANOQ (2013b) Hunting seasons. 2013.
http://dk.nanoq.gl/Emner/Erhverv/Erhvervsomraader/Fangst_og_Jagt/Jagttider/Havpattedyr.aspx
(Access 4th February 2013).
NANOQ, Piniarneq (2011).
http://dk.nanoq.gl/Emner/Erhverv/Erhvervsomraader/Fangst_og_Jagt/PINIARNEQ.aspx:
National Snow & Ice Data Center (2013). http://nsidc.org/cryosphere/seaice/ Accessed February 2013
Naturinstituttet (2013). http://www.natur.gl/nyheder/nyhed/a/rejebestanden-ved-groenland-falder-
fortsat-1/ (senest hentet eller vist den 1. February 2013).
NERI (2012). Database of important areas to Greenland wildlife.
http://dmugisweb.dmu.dk/rdimportantareas/
NOAA Fisheries Office of Protected Resources (2007).
http://www.nmfs.noaa.gov/pr/species/mammals/cetaceans/bowheadwhale.htm
NORSOK (2004). Annex B Norsk Sokkels Konkuranseposisjon (NORSOK, 2004) sampling standards.
Norwegian Meteorological Institute (2013). http://polarview.met.no/index_HI.html Accessed February
2013.
NunaGIS (2013). http://www.nunagis.gl/da/fangst-fiskeri/51-hele-gr-nland-fiskeri-da?cat=14 (senest
hentet eller vist den 1. February 2013.
Olsen E, & Holst J C (2001). A note on common minke whale (Balaenopteraacutorostrata) diets in the
Norwegian Sea and the North Sea. Journal of Cetacean Research Management, 3 (2), pp 179 -183.

108 2D seismic survey offshore South East Greenland
EIA report v1
Østby C, Nordstrøm L, Moe KA (2003). Konsekvenser av seismisk aktivitet. Alpha Miljørådgivning.
Oslo, Norway. ULB delutredning 18.
Parvin S J, Nedwell J R and Harland E (2007). Lethal and physical injury of marine mammals, and
requirements for Passive Acoustic Monitoring. Subacoustech Report 565R0212, report prepared for
the UK Government Department for Business, Enterprise and Regulatory Reform.
Piepenburg D (2005). The Seafloor Fauna in a Changing Arctic – a Review on Its Past, Present and
Future. Polarforschung, 75 (2–3), pp 63-76.
Piepenburg D, Ambrose W G Jr., Brandt A, Renaud P E, Ahrens M J & Jensen P (1997). Benthic
community patterns reflect water column processes in the Northeast Water polynya (Greenland). –
Journal of Marine Systems, 10, pp 467-482.
Piepenburg D, & von Juterzenka K (1994) Abundance, biomass, and spatial distribution pattern of
brittle stars (Echinodermata: Ophiuroidea) on the Kolbeinsey Ridge north of Iceland. Polar Biology,
14, pp185-194.
Pike D G, Víkingsson G A, Gunnlaugsson T h, & Øien N (2006). A note on the distribution and abun-
dance of blue whales (Balaenoptera musculus) in the Central and Northeast North Atlantic. NAMMCO
Scientific Publication, 7, pp 19-29.
Piniarneq (2013). Jagtinformation og fangstfangstregistrering.
http://dk.nanoq.gl/Emner/Erhverv/Erhvervsomraader/Fangst_og_Jagt/~/media/nanoq/DFFL/Fangst/Pi
niarneq/Piniarneq%202013_DK.ashx Accessed January 31st 2013.
Porter M B (2011). The Bellhop manual and user’s guide. Heat, Light and Sound Reseach Inc, La
Jolla, CA, USA, pp 57.
Przybylak R (2003). The Climate of the Arctic. Norwell: Kluwer Academic Publishers.
Ratz, H.J and Lloret, J. 2005. Long-term variability of growth and recruitment of cod (Gadus morhua)
off Greenland. ICES Journal of Marine Science, 62, pp 1310-1321.
Reilly S B, Bannister J L, Best P B, Brown M, Brownell Jr, R L, Butterworth, D S, Clapham, P J,
Cooke J, Donovan G, Urbán J, & Zerbini A N (2012). Balaena mysticetus (Svalbard-Barents
Ribergaard M H, og Sandø A B (2004). Modelling transport of cod eggs and larvae. In prep.
Richardson K, Markager S, Buch E, Lassen M F, & Kristensen A S (2005). Seasonal distribution of
primary production, phytoplankton biomass and size distribution in the Greenland Sea. Deep Sea
Research Part I: Oceanographic Research Papers, 52(6), pp 979-999.
Richardson W J, Miller G W, & Greene, C R, Jr (1999). Displacement of migrating bowhead whales by
sounds from seismic surveys in shallow waters of the Beaufort Sea. Journal of the Acoustical Society
of America, 106, pp 2281.

109 2D seismic survey offshore South East Greenland
EIA report v1
Richman S E & Lovvorn S R (2003). Effects of clam species dominance on nutrients and energy ac-
quisition by spectacled eiders in the Bering Sea. – Marine Ecology Progress Series, 261, pp 283-297.
Rolland R M, Parks S E, Hunt K E, Castellote M, Corkeron P J, Nowacek D P, Wasser S K, Kraus S D
(2012). Evidence that ship noise increases stress in right whales. Proceeding of the Royal Society of
Biological Sciences, 10.1098/rspb.2011.2429.
Romano T A, Keogh C, Feng P, Berk L, Schlundt C E, Carder D A, Finneran J J (2004). Anthropogen-
ic sound and marine mammal health: measures of the nervous and immune systems before and after
intense sound exposure. Canadian Journal of Fisheries and Aquatic Sciences, 61, pp 1124-1134.
Rysgaard S, Nielsen T G, & Hansen, B W (1999). Seasonal variation in nutrients, pelagic primary
production and grazing in a high-Arctic coastal marine ecosystem, Young Sound, northeast Green-
land. Marine Ecological Progress Series, 179, pp 13–25.
Rysgaard S, & Nielsen T G (2006). Carbon cycling in a high-arctic marine ecosystem – Young Sound,
NE Greenland. Progress in Oceanography, 71, pp 426-445.
Rysgaard S, Vang T, Stjernholm M, Rasmussen B, Windelin A, Kiilsholm S (2003). Physical condi-
tions, carbon transport and climate change impacts in a NE Greenland fj ord. Arctic, Antarctic and
Alpine Research, 35, pp 301-312.
Saether O T E, Ellingsen & Mohr V (1986). Lipids of North Atlantic krill. Journal of Lipid Research, 27,
pp 274–285.
Saunders R A, Ingvarsdottir A, Rasmussen, J, Hay, S J, & Brierley, A. S (2007). Regional variation in
distribution pattern, population structure and growth rates of Meganyctiphanes norvegica and Thysa-
noessa longicaudata in the Irminger Sea, North Atlantic. Progress in Oceanography, 72(4), pp 313-
342.
Scott C L, Kwasniewski S, Falk-Petersen S, Sargent J R (2002). Species differences, origins and
functions of fatty alcohols and fatty acids in the wax esters and phospholipids of Calanus hyperbo-
reus, Calanus glacialis and Calanus finmarchicus from Arctic waters. Marine Ecology Progress Se-
ries, 235, pp 127-134.
Sea (Spitsbergen) subpopulation). In IUCN 2012. IUCN Red List of Threatened Species. Version
2012.2. <www.iucnredlist.org>. Downloaded on 11 February 2013.
Sejr M K & Christensen P B (2007). Growth, production and carbon demand of macro fauna in Young
Sound, with a special emphasis on the bivalves Hiatella arctica and Mya truncate. In: Rysgaard S &
Glud R N (eds). Carbon cycling in Arctic marine ecosystems: Case study Young Sound. Bioscience
58.
Sigurjonsson J & Gunnlaugsson T (1990). Recent trends in abundance of blue (Balaenoptera muscu-
lus) and humpback whales (Megaptera novaeangliae) off west and southwest Iceland, with note on
occurrence of other cetacean species. Report from the International Whaling Commision, 40, pp 537-
551.

110 2D seismic survey offshore South East Greenland
EIA report v1
Soderkvist J, Nielsen T G, & Jespersen M, (2006). Physical and biological oceanography in West
Greenland Waters with emphasis on shrimp and fish larvae distribution. NERI Technical Report, 581.
Southall B L, Bowles A E, Ellison W T, Finneran J J, Gentry R L, Greene C R, Kastak D, Ketten D R,
Miller J H, Nachtigall P E, Richardson W J, Thomas J A, Tyack P L. (2007). Marine Mammal Noise
Exposure Criteria: Initial Scientific Recommendations. Aquatic Mammals.
Statistics Greenland. (2013). http://www.stat.gl/publ/en/FI/2010/content/Catches.htm (Access 1st
February 2013).
Swalethorp R, Kjellerup S, Dünweber M, Nielsen T G, Møller E F, Rysgaard S, Hansen B W (2011).
Grazing, egg production and biochemical evidence of differences in the life strategies of Calanus fin-
marchicus, C. glacialis and C. hyperboreus in Disko Bay, western Greenland. Marine Ecology
Progress Series, 429, pp 125–144.
Thompson P & Hastie G (2012). Identification of appropriate noise exposure criteria for assessing
auditory injury for pinnipeds using offshore wind farm sites. Moray Offshore Renewables Limited -
Environmental Statement. Technical Appendix 7.3 E.UNEP (2004) Pedersen S A, Madsen J, & Dyhr-
Nielsen M. Arctic Greenland, East Greenland Shelf, West Greenland Shelf, GIWA Regional assess-
ment 1b, 15, 16. University of Kalmar, Kalmar, Sweden.
Víkingsson G A, Pike D G, Desportes G, Øien N, Gunnlaugsson T H, & Bloch D (2009). Distribution
and abundance of fin whales (Balaenoptera physalus) in the Northeast and Central Atlantic as in-
ferred from the North Atlantic Sightings Surveys 1987-2001. NAMMCO Scientific Publications, 7, pp
49-72.
Vilhjálmsson H (2002). Capelin (Mallotus villosus) in the Iceland–East Greenland–Jan Mayen
ecosystem. ICES Journal of Marine Science, 59. 870–883.
Wardle C S, Carter T J, Urquhart G G, Johnstone A D F, Ziolkowski A M, Hampson G & Mackie D
(2001). Effects of seismic air guns on marine fish. Continental Shelf Research, 21(8), pp 1005-1027.
Weilgart L S (2007). A brief review of known effects of noise on marine mammals. International. Jour-
nal of Comparative Psychology, 20, pp 159-168.
Wiig O, Born E R, Pedersen L T (2003). Movements of female polar bears (Ursus maritimus) in the
East Greenland pack ice. Polar Biology, 26, pp 509-516.