2nd quarter 2021 earnings call
TRANSCRIPT

August 4, 2021
2nd Quarter 2021 Earnings Call

Call Participants & Forward-Looking Statements
2
Forward-Looking StatementsThis communication contains certain “forward-looking statements” within the meaning of the Private Securities Litigation Reform Act of 1995. Forward-looking statements include statements regarding, among other things, our current expectations about the Company’s future results, financial condition, sales, earnings, free cash flow, margins, objectives, goals, strategies, beliefs, intentions, plans, estimates, prospects, projections and outlook of the Company and can generally be identified by the use of words or phrases such as “may,” “will,” “expect,” “intend,” “estimate,” “anticipate,” “plan,” “foresee,” “project,” “believe,” “continue” or the negatives of these terms, variations on them and other similar expressions. These forward-looking statements involve known and unknown risks, uncertainties and other factors which may cause actual results to be materially different from those expressed in or implied by such forward-looking statements. Forward-looking statements are based largely on the Company’s expectations and judgments and are subject to a number of risks and uncertainties, many of which are unforeseeable and beyond our control.
The factors that could cause actual results to materially differ include, among others: the negative impacts the coronavirus (COVID-19) has had and will continue to have on the Company’s business, financial condition, cash flows, results of operations and supply chain, as well as the global economy in general (including future uncertain impacts); the impact of decreasing demand for printed materials and significant overcapacity in a highly competitive environment creates downward pricing pressures and potential underutilization of assets; the impact of digital media and similar technological changes, including digital substitution by consumers; the impact of fluctuations in costs (including labor and labor-related costs, energy costs, freight rates and raw materials, including paper) and the impact of fluctuations in the availability of raw materials, including paper; the inability of the Company to reduce costs and improve operating efficiency rapidly enough to meet market conditions; the impact of the various restrictive covenants in the Company’s debt facilities on the Company’s ability to operate its business, as well as the uncertain negative impacts COVID-19 may have on the Company’s ability to continue to be in compliance with these restrictive covenants; the impact of increased business complexity as a result of the Company’s transformation to a marketing solutions partner; the impact negative publicity could have on our business; the failure to successfully identify, manage, complete and integrate acquisitions, investment opportunities or other significant transactions, as well as the successful identification and execution of strategic divestitures; the failure of clients to perform under contracts or to renew contracts with clients on favorable terms or at all; the impact of changing future economic conditions; the fragility and decline in overall distribution channels; the impact of changes in postal rates, service levels or regulations, including delivery delays due to ongoing COVID-19 impacts on daily operational staffing at the United States Postal Service; the failure to attract and retain qualified talent across the enterprise; the impact of regulatory matters and legislative developments or changes in laws, including changes in cyber-security, privacy and environmental laws; significant capital expenditures may be needed to maintain the Company’s platforms and processes and to remain technologically and economically competitive; the impact of risks associated with the operations outside of the United States, including costs incurred or reputational damage suffered due to improper conduct of its employees, contractors or agents; the impact of an other than temporary decline in operating results and enterprise value that could lead to non-cash impairment charges due to the impairment of property, plant and equipment and intangible assets; the impact on the holders of Quad’s class A common stock of a limited active market for such shares and the inability to independently elect directors or control decisions due to the voting power of the class B common stock; and the other risk factors identified in the Company’s most recent Annual Report on Form 10-K, which may be amended or supplemented by subsequent Quarterly Reports on Form 10-Q or other reports filed with the Securities and Exchange Commission.
Except to the extent required by the federal securities laws, the Company undertakes no obligation to publicly update or revise any forward-looking statements, whether as a result of new information, future events or otherwise.
Joel QuadracciChairman, President & Chief Executive Officer
Dave HonanExecutive Vice President & Chief Financial Officer

Our Key Competitive Advantages
3
Strategic priorities are powered by three key
competitive advantages that distinguish Quad as a
Marketing Solutions Partner:

Welcome Josh Golden
4
Appointed Josh Golden Chief Marketing Officer effective July 5, 2021
Golden most recently served as President and Publisher of the advertising and marketing media brand Ad Age
Golden will greatly accelerate our visibility and drive growth across our entire solutions portfolio
Josh Golden, Chief Marketing Officer

Commitment to Innovation – Rise Interactive & Connex
5
Named Product of the Year by
the Business Intelligence Group
Rise Interactive’s Media Optimization Platform that enables
each marketing dollar to drive the greatest return
Proactive Intelligence
Automated Optimization
Cross Platform Insights
ONE INTEGRATED PLATFORM

Recent Success Story
6
A Leading Global Retail and Ecommerce Company
Client Opportunity• Engaged Quad’s Client Technology team to organize, optimize and deploy
highly regionalized advertising and in-store promotional signage as the client expands its grocery footprint.
Quad Solution• Deployed our Content Management Workflow Solution to centralize and
organize the client’s marketing efforts and simplify regional complexity.
• Supported with Business Process Implementation and Change Management services.
OUTCOME• Transitioning all in-store signage
production to our platform.
• Introducing client to our analytics solutions to dynamically track the effectiveness of each campaign.

Expanding Client Relationships in New Verticals
7
We continue to grow client relationships in expansion categories including Technology, Consumer Packaged Goods and Direct-to-Consumer

Commitment to Culture & Social Purpose
8

Financial Overview
9(1) See slide 14 for definitions of our non-GAAP measures, slides 15 and 16 for reconciliations of Adjusted EBITDA and Adjusted EBITDA Margin and slide 17 for a reconciliation of Free Cash Flow as non-GAAP measures.
Second Quarter Year-to-Date
US $ Millions June 30, 2021 June 30, 2020 June 30, 2021 June 30, 2020
STATEMENT OF OPERATIONS (excluding discontinued operations)
Net Sales $ 693.9 $ 584.5 $ 1,399.7 $ 1,407.0
Cost of Sales 554.2 460.9 1,114.0 1,108.6
Selling, General and Administrative Expenses 80.1 63.3 160.6 162.9
Adjusted EBITDA (1) $ 59.7 $ 59.9 $ 125.5 $ 135.3
Adjusted EBITDA Margin (1) 8.6% 10.2% 9.0% 9.6%
STATEMENT OF CASH FLOWS (including discontinued operations)
Net Cash Provided By Operating Activities $ 88.9 $ 67.2
Capital Expenditures (27.2) (38.0)
Free Cash Flow (1) $ 61.7 $ 29.2

Debt Capital Structure
10
25%Floating
75%Fixed
(1) See slide 14 for definitions of our Non-GAAP measures and slide 18 for a reconciliation of Debt Leverage Ratio as a Non-GAAP measure.
4.9%3.00x
May 2022
Debt Leverage Ratio (1)
as of June 30, 2021Blended Interest Rate
as of June 30, 2021
Next Significant Debt Maturity of $239 Million
$98 millionCash on Hand
as of June 30, 2021
$463 millionUnused Capacity under $500 Million
Revolver as of June 30, 2021Subject to Certain Covenants

2021 Outlook
11
Full-Year 2021
Previous Outlook Current Outlook
Annual Net Sales Change (1) Flat to down a low single-digit percentage 1% to 3% increase
Full-Year Adjusted EBITDA (2) Not provided $240 to $260 million
Year-End Debt Leverage Ratio (2)(3) At or near 3.0x Approximately 2.75x
(1) Due to QuadExpress being sold on June 30, 2021, Annual Net Sales Change excludes QuadExpress sales for the second half of 2020(2) See slide 14 for definitions of our Non-GAAP measures(3) Debt Leverage Ratio is calculated at the midpoint of the Adjusted EBITDA outlook
We have strong sales momentum heading into the second half of 2021, providing the foundation for our raised and expanded financial outlook for the full-year

Thank You

Supplemental Information

Non-GAAP Financial Measures
14
• In addition to financial measures prepared in accordance with accounting principles generally accepted in the United States of America (GAAP), this presentation also contains Non-GAAP financial measures, specifically EBITDA, EBITDA Margin, Adjusted EBITDA, Adjusted EBITDA Margin, Free Cash Flow, Net Debt, Debt Leverage Ratio, and Adjusted Diluted Earnings (Loss) Per Share From Continuing Operations. The Company believes that these Non-GAAP measures, when presented in conjunction with comparable GAAP measures, provide additional information for evaluating Quad’s performance and are important measures by which Quad’s management assesses the profitability and liquidity of its business. These Non-GAAP measures should be considered in addition to, not as a substitute for or superior to, net earnings (loss) as a measure of operating performance or to cash flows provided by operating activities as a measure of liquidity. These Non-GAAP measures may be different than Non-GAAP financial measures used by other companies. Reconciliations to the GAAP equivalent of these Non-GAAP measures are contained on slides 15 - 21.
• Adjusted EBITDA is defined as net earnings (loss) attributable to Quad common shareholders excluding interest expense, income tax expense (benefit), depreciation and amortization (“EBITDA”), restructuring, impairment and transaction-related charges, gain from sale and leaseback, loss from discontinued operations, net of tax, net pension income, loss on debt extinguishment, equity in (earnings) loss of unconsolidated entity, the Adjusted EBITDA for unconsolidated equity method investments (calculated in a consistent manner with the calculation for Quad) and net earnings (loss) attributable to noncontrolling interests.
• EBITDA Margin and Adjusted EBITDA Margin are defined as EBITDA or Adjusted EBITDA divided by net sales.
• Free Cash Flow is defined as net cash provided by operating activities less purchases of property, plant and equipment.
• Debt Leverage Ratio is defined as total debt and finance lease obligations less cash and cash equivalents (Net Debt) divided by the last twelve months of Adjusted EBITDA.
• Adjusted Diluted Earnings (Loss) Per Share From Continuing Operations is defined as earnings (loss) from continuing operations before income taxes and equity in (earnings) loss of unconsolidated entity excluding restructuring, impairment and transaction-related charges, gain from sale and leaseback, loss on debt extinguishment, and adjusted for income tax expense at a normalized tax rate, divided by diluted weighted average number of common shares outstanding.

Adjusted EBITDASecond Quarter
15
Three Months Ended June 30,
US $ Millions 2021 2020
Net earnings (loss) attributable to Quad common shareholders $ 34.4 $ (23.5)
Interest expense 15.6 16.2
Income tax expense (benefit) 1.3 (4.3)
Depreciation and amortization 38.7 46.7
EBITDA [Non-GAAP] $ 90.0 $ 35.1
EBITDA Margin [Non-GAAP] 13.0% 6.0%
Restructuring, impairment and transaction-related charges (13.4) 16.4
Gain from sale and leaseback (13.7) —
Loss from discontinued operations, net of tax — 8.7
Net pension income (3.5) (2.6)
Loss on debt extinguishment — 2.4
Other (1) 0.3 (0.1)
Adjusted EBITDA [Non-GAAP] $ 59.7 $ 59.9
Adjusted EBITDA Margin [Non-GAAP] 8.6% 10.2%
(1) Other includes the following items: (a) the equity in (earnings) loss of unconsolidated entity, which includes the results of operations for an investment in an entity where Quad has the ability to exert significant influence, but not control, and is accounted for using the equity method of accounting; (b) the Adjusted EBITDA for unconsolidated equity method investments, which was calculated in a consistent manner with the calculation above for Quad; and (c) the net earnings (loss) attributable to noncontrolling interests, which is the portion of the net earnings (loss) not owned by Quad for an investment where Quad has a controlling financial interest.

Adjusted EBITDAYear-to-Date
16
Six Months Ended June 30,
US $ Millions 2021 2020
Net earnings (loss) attributable to Quad common shareholders $ 44.6 $ (35.9)
Interest expense 30.1 34.3
Income tax expense (benefit) 1.8 (5.5)
Depreciation and amortization 80.6 94.1
EBITDA [Non-GAAP] $ 157.1 $ 87.0
EBITDA Margin [Non-GAAP] 11.2% 6.2%
Restructuring, impairment and transaction-related charges (10.8) 39.2
Gain from sale and leaseback (13.7) —
Loss from discontinued operations, net of tax — 12.5
Net pension income (7.6) (5.3)
Loss on debt extinguishment — 1.8
Other (1) 0.5 0.1
Adjusted EBITDA [Non-GAAP] $ 125.5 $ 135.3
Adjusted EBITDA Margin [Non-GAAP] 9.0% 9.6%
(1) Other includes the following items: (a) the equity in (earnings) loss of unconsolidated entity, which includes the results of operations for an investment in an entity where Quad has the ability to exert significant influence, but not control, and is accounted for using the equity method of accounting; (b) the Adjusted EBITDA for unconsolidated equity method investments, which was calculated in a consistent manner with the calculation above for Quad; and (c) the net earnings (loss) attributable to noncontrolling interests, which is the portion of the net earnings (loss) not owned by Quad for an investment where Quad has a controlling financial interest.
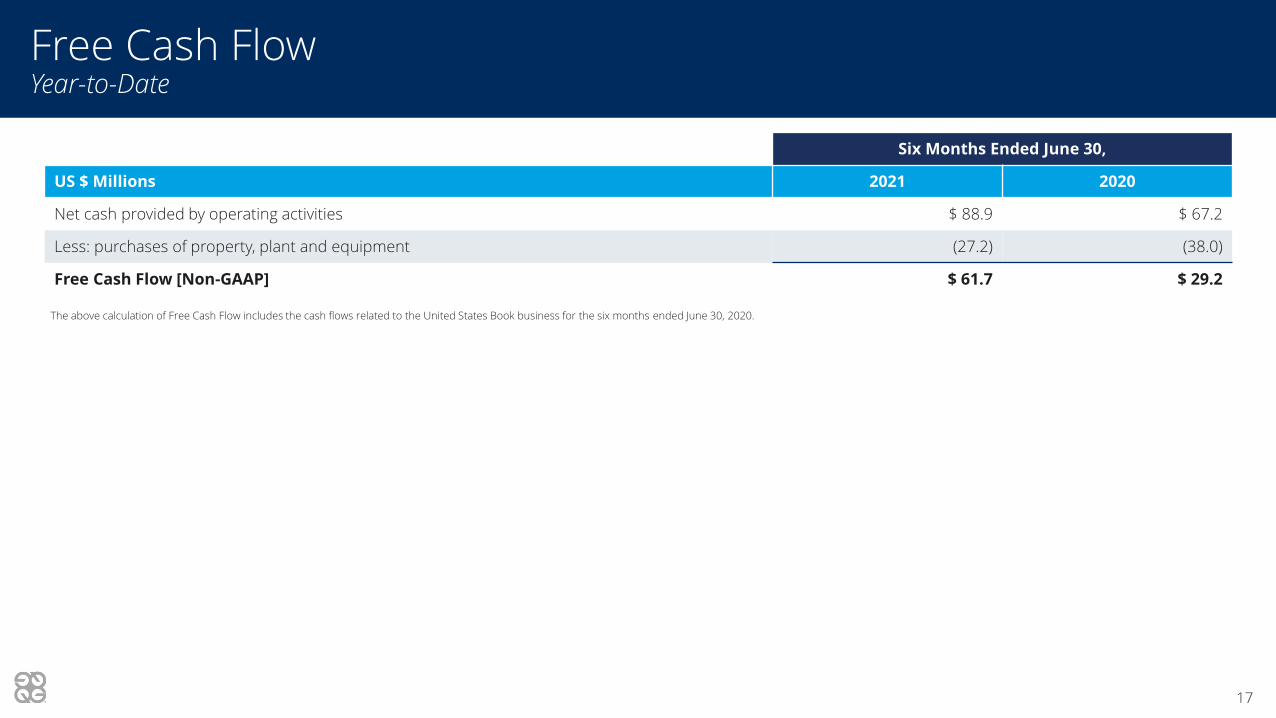
Free Cash FlowYear-to-Date
17
Six Months Ended June 30,
US $ Millions 2021 2020
Net cash provided by operating activities $ 88.9 $ 67.2
Less: purchases of property, plant and equipment (27.2) (38.0)
Free Cash Flow [Non-GAAP] $ 61.7 $ 29.2
The above calculation of Free Cash Flow includes the cash flows related to the United States Book business for the six months ended June 30, 2020.

US $ Millions, Except Ratio June 30, 2021 December 31, 2020
Total debt and finance lease obligations on the balance sheets $ 851.1 $ 928.2
Less: Cash and cash equivalents 98.3 55.2
Net Debt [Non-GAAP] $ 752.8 $ 873.0
Divided by: trailing twelve months Adjusted EBITDA [Non-GAAP] (1) $ 250.6 $ 260.4
Debt Leverage Ratio [Non-GAAP] 3.00x 3.35x
Debt Leverage Ratio
18
(1) The calculation of Adjusted EBITDA for the trailing twelve months ended June 30, 2021, and December 31, 2020, was as follows:
Add SubtractTrailing Twelve Months
EndedYear Ended Six Months Ended
December 31, 2020 June 30, 2021 June 30, 2020 June 30, 2021
Net earnings (loss) attributable to Quad common shareholders $ (128.3) $ 44.6 $ (35.9) $ (47.8)
Interest expense 68.8 30.1 34.3 64.6
Income tax expense (benefit) 0.3 1.8 (5.5) 7.6
Depreciation and amortization 181.6 80.6 94.1 168.1
EBITDA [Non-GAAP] $ 122.4 $ 157.1 $ 87.0 $ 192.5
Restructuring, impairment and transaction-related charges 124.1 (10.8) 39.2 74.1
Loss from discontinued operations, net of tax 21.9 — 12.5 9.4
Net pension income (10.5) (7.6) (5.3) (12.8)
Gain from sale and leaseback — (13.7) — (13.7)
Loss on debt extinguishment 1.8 — 1.8 —
Other 0.7 0.5 0.1 1.1
Adjusted EBITDA [Non-GAAP] $ 260.4 $ 125.5 $ 135.3 $ 250.6

Balance Sheet
19
US $ Millions June 30, 2021 December 31, 2020
ASSETS
Cash and cash equivalents $ 98.3 $ 55.2
Receivables, less allowance for credit losses 323.8 399.1
Inventories 168.6 170.2
Prepaid expenses and other current assets 36.0 54.7
Property, plant and equipment—net 831.6 884.2
Operating lease right-of-use assets—net 80.1 81.0
Goodwill 86.4 103.0
Other intangible assets—net 88.9 104.3
Other long-term assets 75.4 76.0
Total assets $ 1,789.1 $ 1,927.7
LIABILITIES AND SHAREHOLDERS’ EQUITY
Accounts payable $ 313.7 $ 320.0
Accrued liabilities 220.6 305.6
Current portion of debt and finance lease obligations 260.4 23.5
Current portion of operating lease obligations 26.6 28.4
Long-term debt and finance lease obligations 590.7 904.7
Operating lease obligations 55.5 54.5
Deferred income taxes 7.4 4.2
Single and multi-employer pension obligations 81.2 92.3
Other long-term liabilities 100.9 109.7
Total liabilities 1,657.0 1,842.9
Total shareholders’ equity and noncontrolling interests 132.1 84.8
Total liabilities and shareholders’ equity $ 1,789.1 $ 1,927.7

Adjusted Diluted Earnings Per ShareSecond Quarter
20
Three Months Ended June 30,
US $ Millions (Except Per Share Data) 2021 2020
Earnings (loss) from continuing operations before income taxes and equity in loss of unconsolidated entity $ 35.9 $ (18.8)
Restructuring, impairment and transaction-related charges (13.4) 16.4
Gain from sale and leaseback (13.7) —
Loss on debt extinguishment — 2.4
Adjusted net earnings from continuing operations, before income taxes [Non-GAAP] 8.8 —
Income tax expense at 25% normalized tax rate 2.2 —
Adjusted net earnings from continuing operations [Non-GAAP] $ 6.6 $ —
Basic weighted average number of common shares outstanding 51.3 50.7
Plus: effect of dilutive equity incentive instruments [Non-GAAP] 1.2 0.3
Diluted weighted average number of common shares outstanding [Non-GAAP] 52.5 51.0
Adjusted diluted earnings per share from continuing operations [Non-GAAP] $ 0.13 $ —
Diluted earnings (loss) per share from continuing operations [GAAP] $ 0.66 $ (0.29)

Adjusted Diluted Earnings Per ShareYear-to-Date
21
Six Months Ended June 30,
US $ Millions (Except Per Share Data) 2021 2020
Earnings (loss) from continuing operations before income taxes and equity in loss of unconsolidated entity $ 46.5 $ (28.6)
Restructuring, impairment and transaction-related charges (10.8) 39.2
Gain from sale and leaseback (13.7) —
Loss on debt extinguishment — 1.8
Adjusted net earnings from continuing operations, before income taxes [Non-GAAP] 22.0 12.4
Income tax expense at 25% normalized tax rate 5.5 3.1
Adjusted net earnings from continuing operations [Non-GAAP] $ 16.5 $ 9.3
Basic weighted average number of common shares outstanding 51.3 50.6
Plus: effect of dilutive equity incentive instruments [Non-GAAP] 1.4 0.4
Diluted weighted average number of common shares outstanding [Non-GAAP] 52.7 51.0
Adjusted diluted earnings per share from continuing operations [Non-GAAP] $ 0.31 $ 0.18
Diluted earnings (loss) per share from continuing operations [GAAP] $ 0.85 $ (0.46)