2q 2015 financial results
TRANSCRIPT

Piergiorgio PelusoMarco Patuano
Telecom Italia Group2Q’15 Results
TELECOM ITALIA GROUP2Q’15 Results Rome, August 7th, 2015
2Q’15 Results 2
TI 2Q’15 Results Marco Patuano
Financial Update Piergiorgio Peluso
Take-Aways Marco Patuano
Appendix
Agenda
FY 2014 Preliminary Results & 2015-2017 Plan OutlineMarco Patuano - Piergiorgio Peluso

2Q’15 Results 3
This presentation contains statements that constitute forward looking statements within the meaning of the Private SecuritiesLitigation Reform Act of 1995. These statements appear in a number of places in this presentation and include statementsregarding the intent, belief or current expectations of estimates regarding future growth in the different business lines and theglobal business, financial results and other aspects of the activities and situations relating to the Telecom Italia Group. Suchforward looking statements are not guarantees of future performance and involve risks and uncertainties, and actual results maydiffer materially from those projected or implied in the forward looking statements as a result of various factors. Consequently,Telecom Italia makes no representation, whether expressed or implied, as to the conformity of the actual results with thoseprojected in the forward looking statements. Forward-looking information is based on certain key assumptions which we believeto be reasonable as of the date hereof, but forward looking information by its nature involves risks and uncertainties, which areoutside our control, and could significantly affect expected results. Analysts and investors are cautioned not to place unduereliance on those forward looking statements, which speak only as of the date of this presentation. Telecom Italia undertakes noobligation to release publicly the results of any revisions to these forward looking statements which may be made to reflect eventsand circumstances after the date of this presentation, including, without limitation, changes in Telecom Italia business oracquisition strategy or planned capital expenditures or to reflect the occurrence of unanticipated events. Analysts and investorsshould consult the Company's Annual Report on Form 20-F as well as periodic filings made on Form 6-K, which are on file withthe United States Securities and Exchange Commission which may identify factors that affect the forward looking statementsincluded herein.
The accounting policies adopted in the preparation of the Half-Year Condensed Consolidated Financial Statements as of and forthe six months ended 30 June 2015 have been applied on a basis consistent with those adopted in the Annual ConsolidatedFinancial Statements at 31 December 2014, to which reference should be made, except for the new standards and interpretationsadopted by the Telecom Italia Group starting from 1 January 2015 which had no effects on the Half-Year CondensedConsolidated Financial Statements as of and for the six months ended 30 June 2015. Please note that the limited review on theTelecom Italia Group Half-Year Condensed Consolidated Financial Statements at 30 June 2015 has not yet been completed.
Marco Patuano - Piergiorgio Peluso
Safe Harbour

2Q’15 Results 4Marco Patuano
2Q’15 Main Events
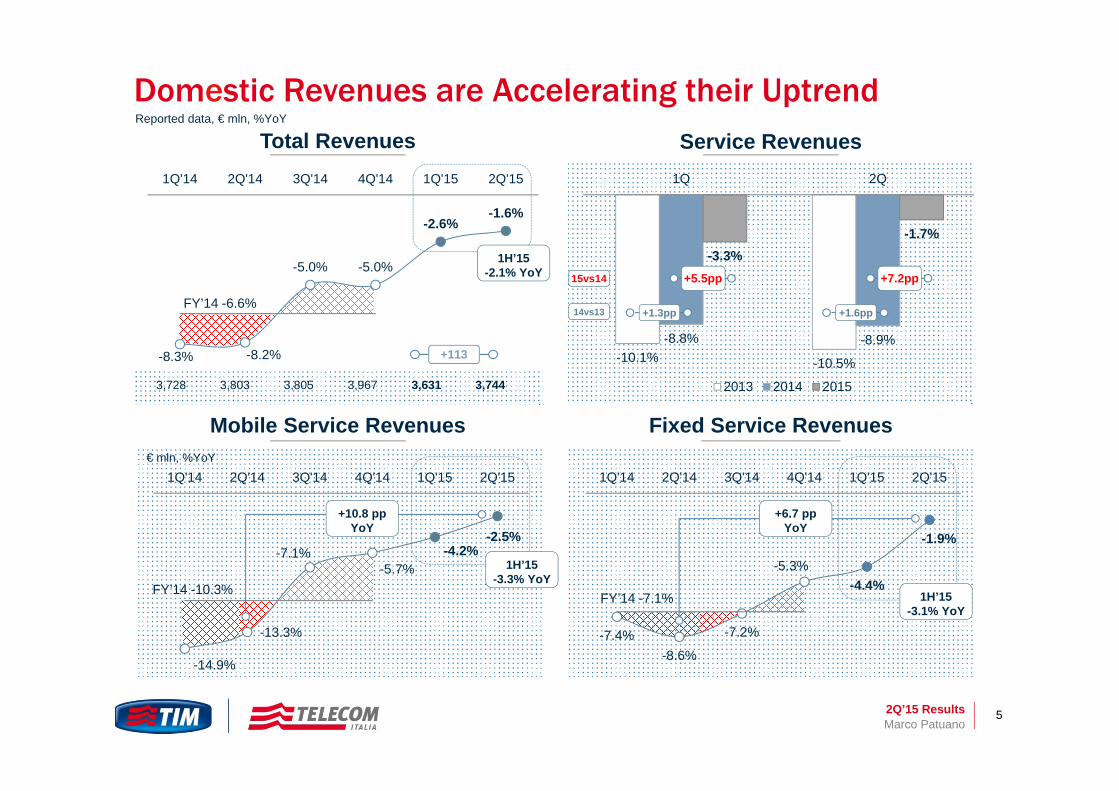
Domestic Improving trends both on Domestic Service
Revenues (+1.6pp QoQ) & Underlying Ebitda(+2.1pp QoQ)
Further recovery in Mobile Service Revenues: -2.5% YoY vs -4.2%YoY in 1Q’15
Solid performance in Fixed Service Revenues: -1.9%YoY vs -4.4% YoY in 1Q’15
Brazil Positive performance on Mobile Business
Generated (+1.1% YoY), supported by very strong performance in Innovative Mobile VAS (+44% YoY)
Negative Service Revenues Trend affected by MTRs, Reduction in Prepaid lines, weak Macro and slowdown in Traditional (-13.9% YoY)
Solid postpaid CB growth: +525k lines in 2Q’15
Inwit
Successful IPO ~36% of Inwit (greenshoeexcluded) delivered to TI in 2Q’15 a net total consideration of 784 mln euro
Related Group-level Net Worth strengthening of 253 mln euro
Real Estate PlanOverall savings of > 150 mln euro per annum
from 2018 Lease renegotiations as of June 30 carry a
IAS-17 impact on Debt of 676 mln euro; yearly cost reduced, no impact on liquidity
Expected Ebitda contribution on FY’15 from the ongoing Plan is about 50 mln euro
Net Debt
Net debt reduction to ~27 bln euro in 2Q’15 vs~27.4 bln euro in 1Q’15 incorporates:
~ -0.7 bln euro from operations, M&A and special projects;
~ +0.1 bln euro for 4G license clean-up costs in Brazil
~ +0.2 bln euro for dividend payments
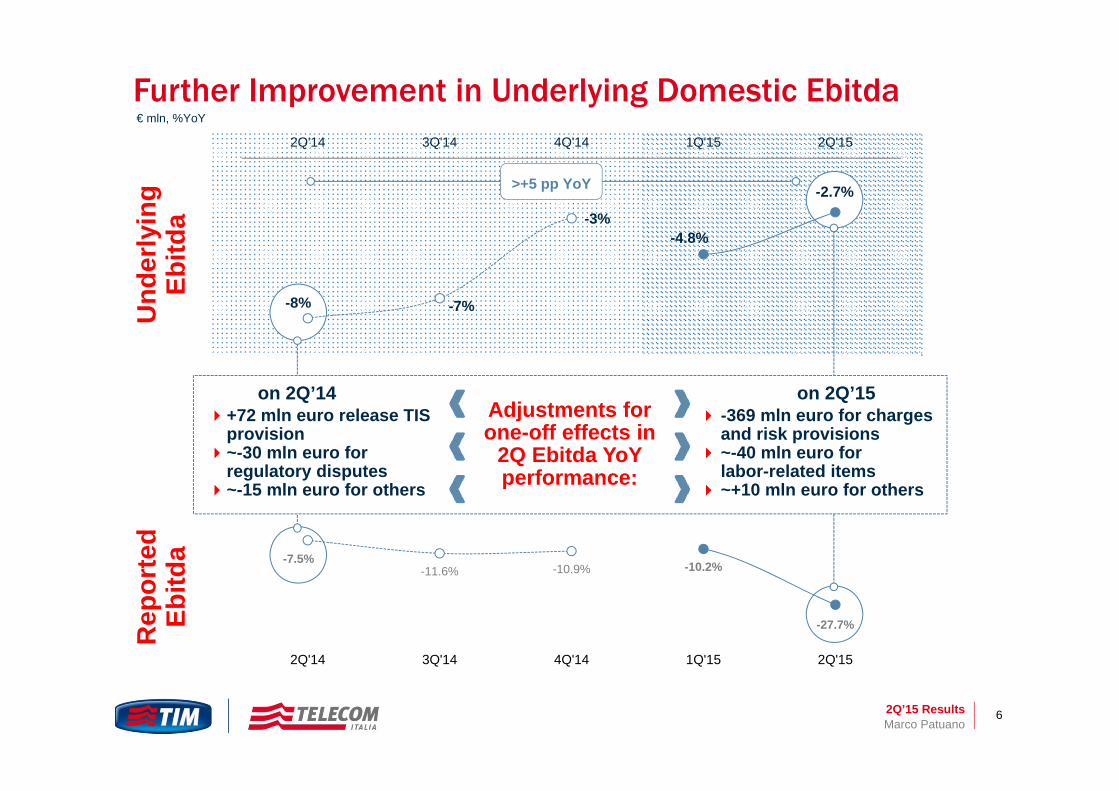
Charges & Risk Provisions
369 mln euro posted in our 1H’15 Accounts include charges and risk provisions resulting from:
regulatory disputes and penalties and the liabilities related to those expenses,
disputes with former employees, and liabilities with customers and/or suppliers
2Q’15 Results 5
Total Revenues
Mobile Service Revenues
Domestic Revenues are Accelerating their UptrendService Revenues
Reported data, € mln, %YoY
Fixed Service Revenues€ mln, %YoY
Marco Patuano
-10.1% -10.5%
-8.8% -8.9%
-3.3%-1.7%
1Q 2Q
2013 2014 2015
+1.3pp
+5.5pp
+1.6pp
+7.2pp
14vs13
15vs14
-8.3% -8.2%
-5.0% -5.0%
-2.6%-1.6%
1Q'14 2Q'14 3Q'14 4Q'14 1Q'15 2Q'15
FY’14 -6.6%
3,728 3,803 3,805 3,967 3,631 3,744
1H’15-2.1% YoY
-7.4%-8.6%
-7.2%
-5.3%-4.4%
-1.9%
1Q'14 2Q'14 3Q'14 4Q'14 1Q'15 2Q'15
FY’14 -7.1%
-14.9%
-13.3%
-7.1%-5.7%
-4.2%-2.5%
1Q'14 2Q'14 3Q'14 4Q'14 1Q'15 2Q'15
FY’14 -10.3%
+6.7 ppYoY
+10.8 ppYoY
1H’15-3.3% YoY
1H’15-3.1% YoY
+113
2Q’15 Results 6
Further Improvement in Underlying Domestic Ebitda
Marco Patuano
€ mln, %YoY
-8% -7%
-3%-4.8%
-2.7%
2Q'14 3Q'14 4Q'14 1Q'15 2Q'15
>+5 pp YoY
-7.5%-11.6% -10.9% -10.2%
-27.7%
2Q'14 3Q'14 4Q'14 1Q'15 2Q'15
Rep
orte
d Eb
itda
Adjustments for one-off effects in
2Q Ebitda YoYperformance:
Und
erly
ing
Ebitd
a
on 2Q’14 on 2Q’15+72 mln euro release TIS
provision~-30 mln euro for
regulatory disputes~-15 mln euro for others
-369 mln euro for charges and risk provisions
~-40 mln euro for labor-related items
~+10 mln euro for others
2Q’15 Results 7
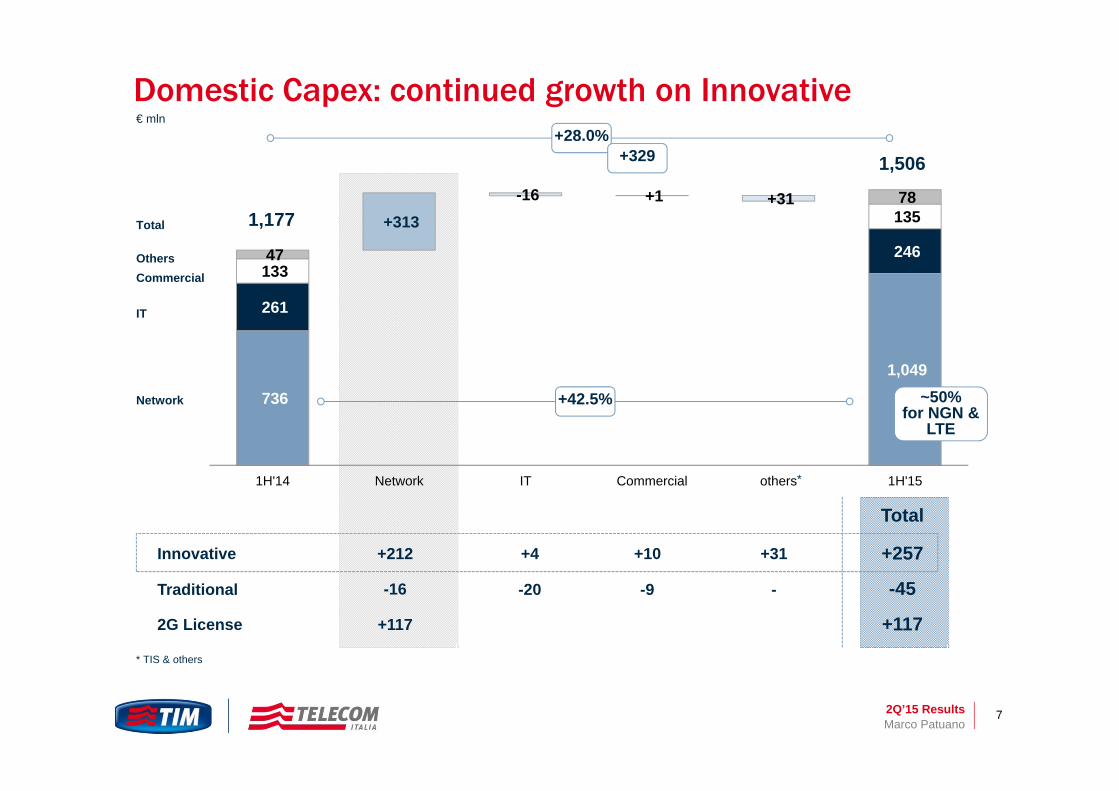
Domestic Capex: continued growth on Innovative
736
1,049
261
246 133
135
47
+313 -16 +1 +31 78
1H'14 Network IT Commercial others 1H'15
IT
Commercial Others
Total
Network
€ mln
1,506
+42.5%
+28.0%
Total
Innovative +212 +4 +31+10 +257
Traditional -16 -20 --9 -45
+329
*
* TIS & others
1,177
~50% for NGN &
LTE
2G License +117 +117
Marco Patuano

2Q’15 Results 8
45
103151
231
290
374
1Q'14 2Q'14 3Q'14 4Q'14 1Q'15 2Q'15
+58
+48
+80
+59
+84
6,933 6,939 6,932 6,921 6,945 6,971
1% 1% 2% 3% 4% 5%
19%
29%
~37%
1Q'14 2Q'14 3Q'14 4Q'14 1Q'15 2Q'15
+8 pp in6 months
8,268 8,541 8,752 8,728 8,677 8,091
409 610 844 1,343 1,803 2,663
1Q'14 2Q'14 3Q'14 4Q'14 1Q'15 2Q'15
4GCoverage
+201 +234 +499 +460 +860
5% 7% 9% 13% 17% 25%
8,677 9,151 9,596 10,071 10,480 10,754
Speeding Up on LTE & NGN
Internet users
LTEusers
MBBusers
Fiber CBon BB CB
Fiber CB
BB CB
Marco Patuano
FiberCoverage
51%
77%>83%
1Q'14 2Q'14 3Q'14 4Q'14 1Q'15 2Q'15
232 Citieswith
4G Plus
% LTE on MBB

2Q’15 Results 9
-1.8% -1.3% -2.1% -1.7% -0.8% -0.4%
-13.1%-11.9%
-5.0% -4.0%-3.4%
-2.0%
1Q'14 2Q'14 3Q'14 4Q'14 1Q'15 2Q'15
TraditionalInnovative
25%
75%
32%
68%
40%
60%
2Q’13 2Q’14 2Q’15
Domestic Mobile
Marco Patuano
Total Revenues Service Revenues - Trend YoY€ mln, %YoY
1,099 1,138 1,189 1,183 1,053 1,109
76 126 95 185 98 127
1Q'14 2Q'14 3Q'14 4Q'14 1Q'15 2Q'15
1,175 1,264 1,284 1,368 1,151 1,236Total
Handsets
Service
Innovative vs. Traditional
-14.9%-13.3%
-7.1%-5.7%
-4.2%-2.5%
+1.7 pp +6.1 pp +1.4 pp +1.5 pp +1.7 ppQoQ
CB ARPU/Mix
-12.1% -15.7%
-10.3%-8.4%
-5.3% -4.2%
ConsumerService Rev.
+11.5 ppYoY
-16.9%-13.7%
-6.6% -7.2%-4.3%
-2.1%
FY’14 -11.1%
FY’14 -11.7%
+11.6 ppYoY
BusinessService Rev.
Bundle adoption67% overall
(+8 p.p. YoY)

2Q’15 Results 10
6.0
1.5
Options with Data Full Voice&Data SMS&Data Data Only on Smartphone
~15% of «Full» Non-LTE bundlesand ~20% of «Voice+Data» ones
are on LTE devices
Marco Patuano
Mobile Consumer: Offer Simplification & Evolution
~0.9 ~1.0~1.2
~1.4 ~1.5
~1.9
Jan Feb Mar Apr May Jun
Consumer Small Screen LTE
~7.5
(1) excluding data only
Weight on total 83% 8% 1% 8%
LTE
withoutLTE
+1 mln
Focus on Options with Data(1)
~6.9 ~7.0 ~7.1 ~7.2 ~7.2 ~7.4Total Consumer Small Screen
Innovation through Simplification
Continuous Offer Evolution
Maximise reach of LTE on our Customer Base
Commercial Strategy
2Q’15 Results 11
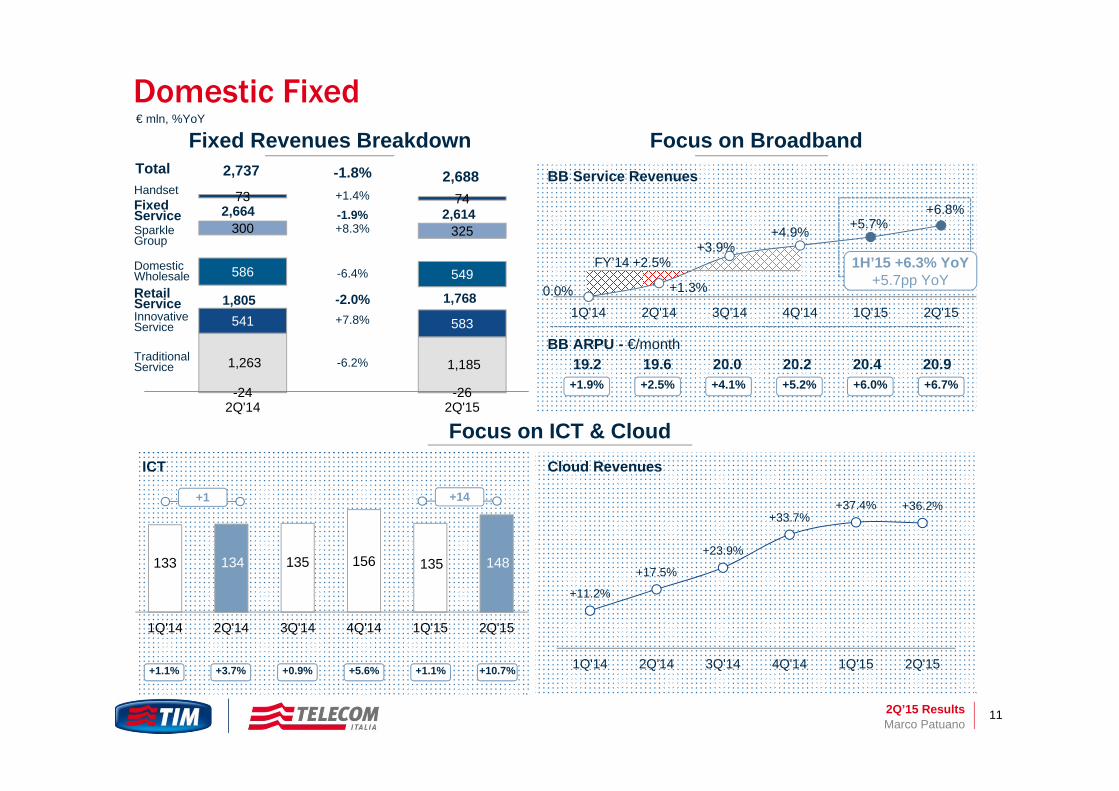
+14+1
133 134 135 156 135 148
1Q'14 2Q'14 3Q'14 4Q'14 1Q'15 2Q'15
+1.1% +3.7% +0.9% +5.6% +10.7%+1.1%
Fixed Revenues Breakdown
1,263 1,185
541 583
586 549
300 325
-24 -26
73 74
2Q'14 2Q'15
TraditionalService
InnovativeService
Domestic Wholesale
Sparkle Group
Fixed Service
Handset
Total
Retail Service
-6.2%
+7.8%-2.0%
-6.4%
+8.3%-1.9%+1.4%
-1.8%
1,805 1,768
2,664 2,614
2,737 2,688
Marco Patuano
Domestic Fixed€ mln, %YoY
19.2 19.6 20.0 20.2 20.4 20.9
ICT
+1.9% +2.5% +4.1% +5.2% +6.7%+6.0%
+11.2%
+17.5%
+23.9%
+33.7%+37.4% +36.2%
1Q'14 2Q'14 3Q'14 4Q'14 1Q'15 2Q'15
Cloud Revenues
Focus on ICT & Cloud
FY’14 +2.5% 1H’15 +6.3% YoY+5.7pp YoY
BB ARPU - €/month
0.0% +1.3%
+3.9%+4.9% +5.7%
+6.8%
1Q'14 2Q'14 3Q'14 4Q'14 1Q'15 2Q'15
Focus on BroadbandBB Service Revenues

2Q’15 Results 12
Lines involvedin
«flatenization»:
~4.1 mln>3mln pay-per-use
voice-only
Opted-Out ~0.2 mln
Churned(cut lines +
migration to competition)
~0.2 mln
Lines movedto flat
monthlybilling:
~3.7 mln
CurrentOpt-Out
Ratio: ~5%
Marco Patuano
1.08% 1.09%
1.13%
1.63%
1.08%
FY'14avg
monthly
Mar '15 Apr'15 May'15 Jun'15
Churn rate on flatenization cluster
Consumer Fixed: the “Tutto Voce” Campaign pushes ahead
After peaking in May on the back of Media and Competitors increased intensity, churn of cluster targeted by “Tutto Voce” is back at 2014 levels
Overall net fixed line losses expected to start reducing from 4Q’15, including structural winback effect from Mobile-Only and continued good performance
in Fixed Gross Adds (~+20% YoY in 2Q’15)

2Q’15 Results 13
245 256308
353395
~550
2Q'14 3Q'14 4Q'14 1Q'15 2Q'15 FY'15e
Netflix service integrated into Tim Vision Set-top-box
3 year agreement – no exclusivity
Revenues share model
Billing available in TIM invoice
Partnership with Mediaset Premium (DTT) and Mediaset Premium Online (BB)
3 year agreement – exclusivity in the telco arena
Mediaset Premium Online integrated into Tim Vision Set-top-box
Billing Integration - exclusive pricing for TIM
+61.2%
Customer Base, 000 Weekly Acquisition Trend
ADSL60%Fiber
15%
NIP15%
RTG4%
ULL6%
Tutto Fibra58%
TIM Smart22%
Tutto16%
Other4%
Orig
inO
ffer
Mix
Des
tinat
ion
Offe
rMix
Launch in October
Launch in September
Marco Patuano
Pay-TV Gains Momentum
2.3x 1.2x
492
1,147 1,390
Avg Apr-May Avg Jun Avg July

2Q’15 Results 14
2,314 2,275 2,235 2,230 2,091 1,958
717 799 906 1,049 1,044 1,150
1Q'14 2Q'14 3Q'14 4Q'14 1Q'15 2Q'15
3,031 3,073 3,141 3,278 3,135 3,108
+8.9% +7.2% +4.7% +5.4% +3.4% +1.1%
+2.5% -1.6% -6.8% -8.8% -9.6% -13.9%
+36.2% +44.2% +50.5% +57.2% +45.7% +44.0%
+7.8% +8.0% +6.5% +4.6%+1.6%
-5.2%
-0.1%-2.6%
TIM Brasil: More Data & Postpaid fight erosion on Traditional Reported data, R$ mln, %YoY
1,316 1,329 1,330 1,566 1,337 1,260
1Q'14 2Q'14 3Q'14 4Q'14 1Q'15 2Q'15
1H’15-1.8% YoY
Resilient Performance despite Challenges & Headwinds: Macro, MTR cut (-33% YoY in 1H) and OTT driving Traditional Services decline
Outstanding pace on Innovative Service Revenues growth: +44% YoY in 2Q
Strong Postpaid performance: CB +11% YoY with 525K net adds in 2Q
Fixed Revenues growth (+14% YoY in 2Q) thanks to Intelig’sbusiness repositioning and positive Fiber Live contribution
EBITDA margin progression (29.2% in 1H, +1.3pp YoY) supported by cost cutting initiatives
Network investments (capex +27% YoY in 1H) driving better quality to support a solid position in data: 157 cities now covered with MBB project. 4G investments: 112% YoY growth in 2Q’15
Highlights
Focus on Mobile Generated(1) ServiceTotal Service Revenues
Innovative
Traditional
Total
Marco Patuano
Before discontinuities
Reported Ebitda
EBITDA
4,099 3,985 4,045 4,196 3,940 3,784
1Q'14 2Q'14 3Q'14 4Q'14 1Q'15 2Q'15
+0.3%-2.0%
-3.9% -3.4% -3.9%-5.0%
+1.3%-1.3%
-4.0% -3.6% -4.5%-5.7%
Total Service Revenues Mobile Service Revenues
(1) Excluding revenues from: non-TIM clients, wholesale and others

2Q’15 Results 15
TI 2Q’15 Results Marco Patuano
Financial Update Piergiorgio Peluso
Take-Aways Marco Patuano
Appendix
Agenda
Marco Patuano - Piergiorgio Peluso
2Q’15 Results 16
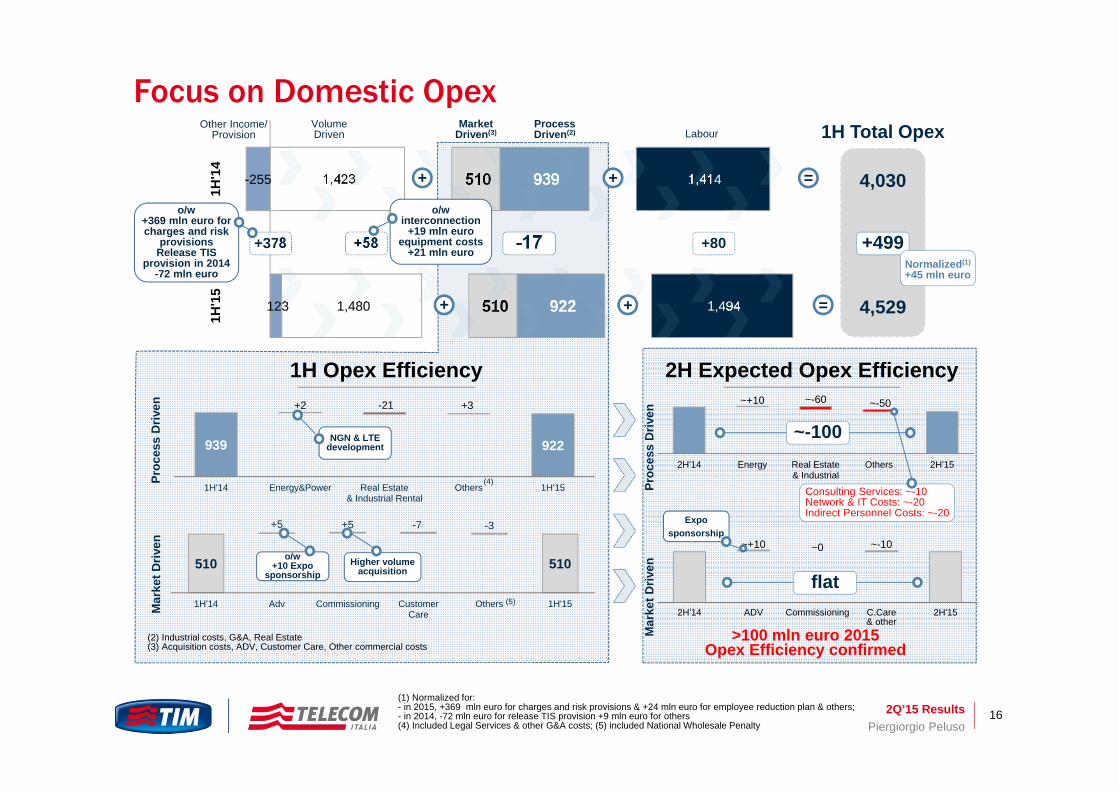
123
-255
1,480
1,423
510
510
922
939
1,494
1,414
1H'1
51H
'14
VolumeDriven
Market Driven(3)
Process Driven(2) Labour
Other Income/Provision
-17 +80+58
o/w +369 mln euro for charges and risk
provisionsRelease TIS
provision in 2014 -72 mln euro
4,030
4,529
1H Total Opex
+499Normalized(1)
+45 mln euro
939 922
+2 -21 +3
1H'14 Energy&Power Real Estate& Industrial Rental
Others 1H'15
Proc
ess
Driv
en
NGN & LTE development
(4)
510 510
+5 +5 -7 -3
1H'14 Adv Commissioning CustomerCare
Others 1H'15Mar
ket D
riven
o/w+10 Expo
sponsorshipHigher volume
acquisition
(5)
(2) Industrial costs, G&A, Real Estate(3) Acquisition costs, ADV, Customer Care, Other commercial costs
+378
1H Opex Efficiency 2H Expected Opex Efficiency
>100 mln euro 2015Opex Efficiency confirmed
Consulting Services: ~-10Network & IT Costs: ~-20Indirect Personnel Costs: ~-20
~+10 ~-60 ~-50
2H'14 Energy Real Estate& Industrial
Others 2H'15
~-100
~+10 ~0 ~-10
2H'14 ADV Commissioning C.Care& other
2H'15
flat
Expo sponsorship
Mar
ket D
riven
Proc
ess
Driv
en
++
o/w interconnection
+19 mln euroequipment costs
+21 mln euro
++
Focus on Domestic Opex
(1) Normalized for:- in 2015, +369 mln euro for charges and risk provisions & +24 mln euro for employee reduction plan & others; - in 2014, -72 mln euro for release TIS provision +9 mln euro for others(4) Included Legal Services & other G&A costs; (5) included National Wholesale Penalty Piergiorgio Peluso
=
=
2Q’15 Results 17
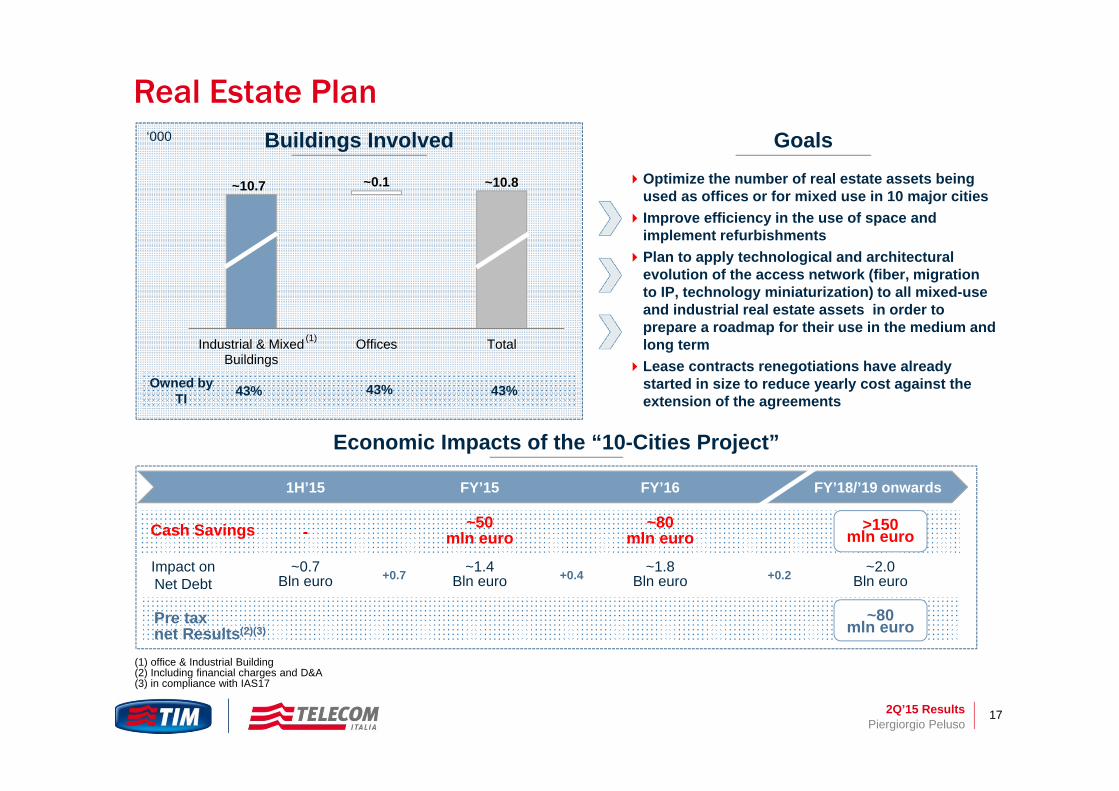
Real Estate PlanBuildings Involved Goals
Optimize the number of real estate assets being used as offices or for mixed use in 10 major cities
Improve efficiency in the use of space and implement refurbishments
Plan to apply technological and architectural evolution of the access network (fiber, migration to IP, technology miniaturization) to all mixed-use and industrial real estate assets in order to prepare a roadmap for their use in the medium and long term
Lease contracts renegotiations have already started in size to reduce yearly cost against the extension of the agreements
Economic Impacts of the “10-Cities Project”
~10.7 ~0.1 ~10.8
Industrial & MixedBuildings
Offices Total
Owned by TI 43% 43% 43%
(1)
Piergiorgio Peluso
1H’15 FY’15 FY’16 FY’18/’19 onwards
Impact on Net Debt
Cash Savings - ~50 mln euro
~80 mln euro
>150mln euro
~0.7 Bln euro
~1.4 Bln euro
~1.8 Bln euro
~2.0 Bln euro+0.7 +0.4 +0.2
~80mln euro
(1) office & Industrial Building(2) Including financial charges and D&A(3) in compliance with IAS17
Pre taxnet Results(2)(3)
‘000
2Q’15 Results 18
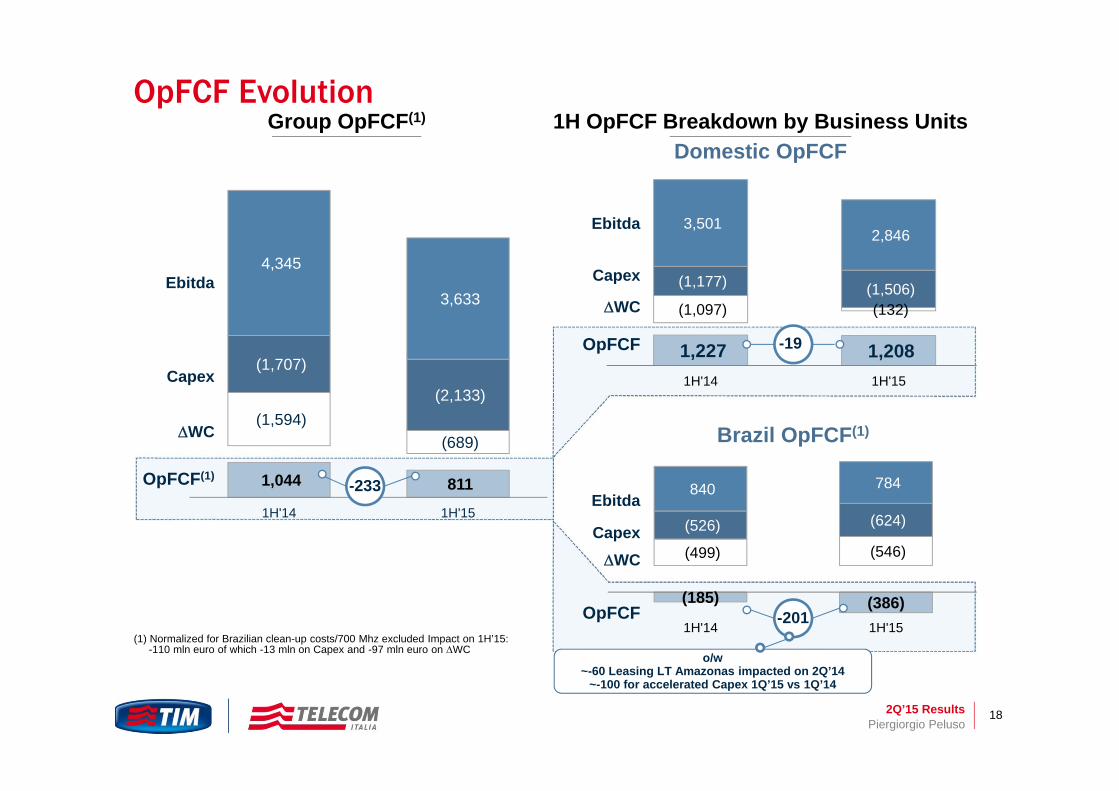
OpFCF Evolution
Ebitda
Capex
WC
Group OpFCF(1)
Piergiorgio Peluso
(1) Normalized for Brazilian clean-up costs/700 Mhz excluded Impact on 1H’15: -110 mln euro of which -13 mln on Capex and -97 mln euro on WC
1,227 1,208
(1,097) (132)
(1,177) (1,506)
3,501 2,846
1H'14 1H'15
1H OpFCF Breakdown by Business UnitsDomestic OpFCF
Brazil OpFCF(1)
Ebitda
Capex
WC
OpFCF
Ebitda
CapexWC
OpFCF
1,044 811
(1,594) (689)
(1,707)
(2,133)
4,345
3,633
1H'14 1H'15
OpFCF(1)
-19
-233
o/w ~-60 Leasing LT Amazonas impacted on 2Q’14
~-100 for accelerated Capex 1Q’15 vs 1Q’14
(185) (386)
(499) (546)
(526) (624)
840 784
1H'14 1H'15-201
2Q’15 Results 19Piergiorgio Peluso
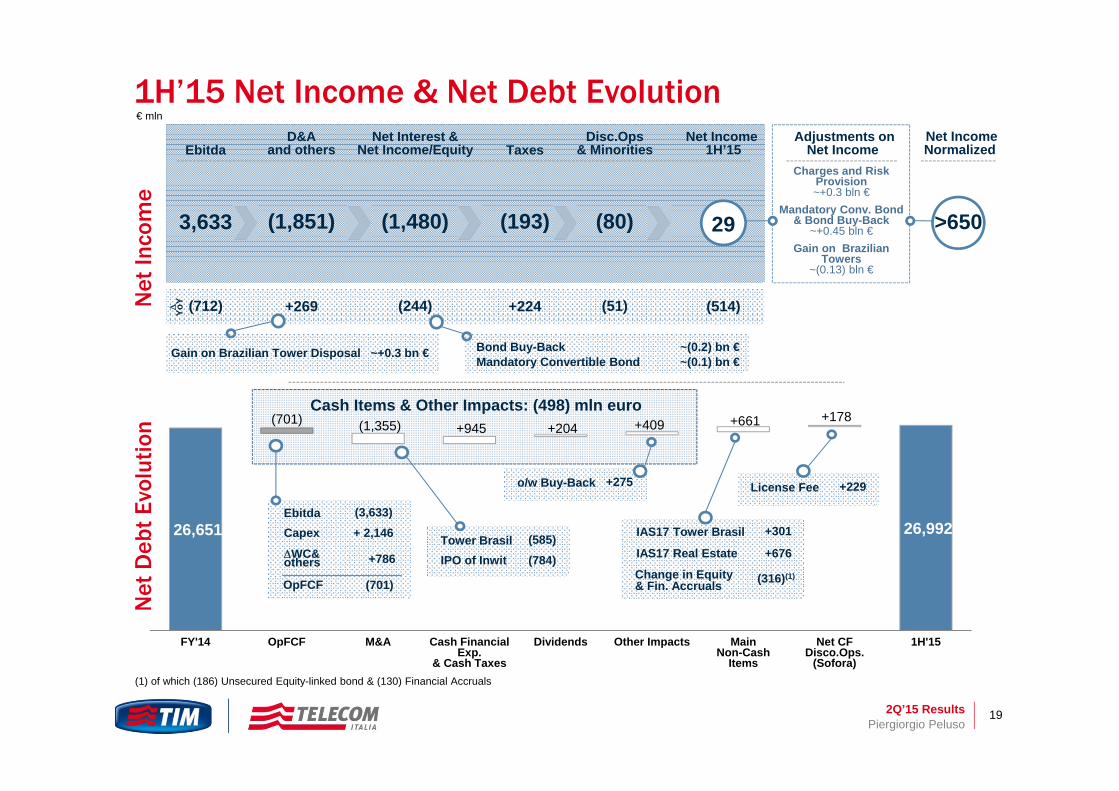
1H’15 Net Income & Net Debt Evolution€ mln
(1) of which (186) Unsecured Equity-linked bond & (130) Financial Accruals
26,651 26,992
(701) (1,355) +945 +204 +409 +661 +178
FY'14 OpFCF M&A Cash Financial Exp.
& Cash Taxes
Dividends Other Impacts MainNon-Cash
Items
Net CF Disco.Ops.
(Sofora)
1H'15
EbitdaCapex
WC&others
(3,633)+ 2,146
+786
OpFCF (701)
Tower BrasilIPO of Inwit
(585)(784)
IAS17 Tower Brasil
IAS17 Real Estate
+301
+676
Change in Equity& Fin. Accruals (316)(1)
o/w Buy-Back +275 License Fee +229
Cash Items & Other Impacts: (498) mln euro
Net
Deb
tEv
olut
ion
Net
Inco
me
YoY (712) +269 (514)(244) +224 (51)
EbitdaD&A
and othersNet Income
1H’15Net Interest &
Net Income/Equity TaxesDisc.Ops
& MinoritiesAdjustments on
Net IncomeNet IncomeNormalized
3,633 (1,851) 29(1,480) (193) (80)
Charges and RiskProvision~+0.3 bln €
Mandatory Conv. Bond& Bond Buy-Back
~+0.45 bln €Gain on Brazilian
Towers~(0.13) bln €
Bond Buy-BackMandatory Convertible Bond
~(0.2) bn €~(0.1) bn €
Gain on Brazilian Tower Disposal ~+0.3 bn €
>650
2Q’15 Results 20
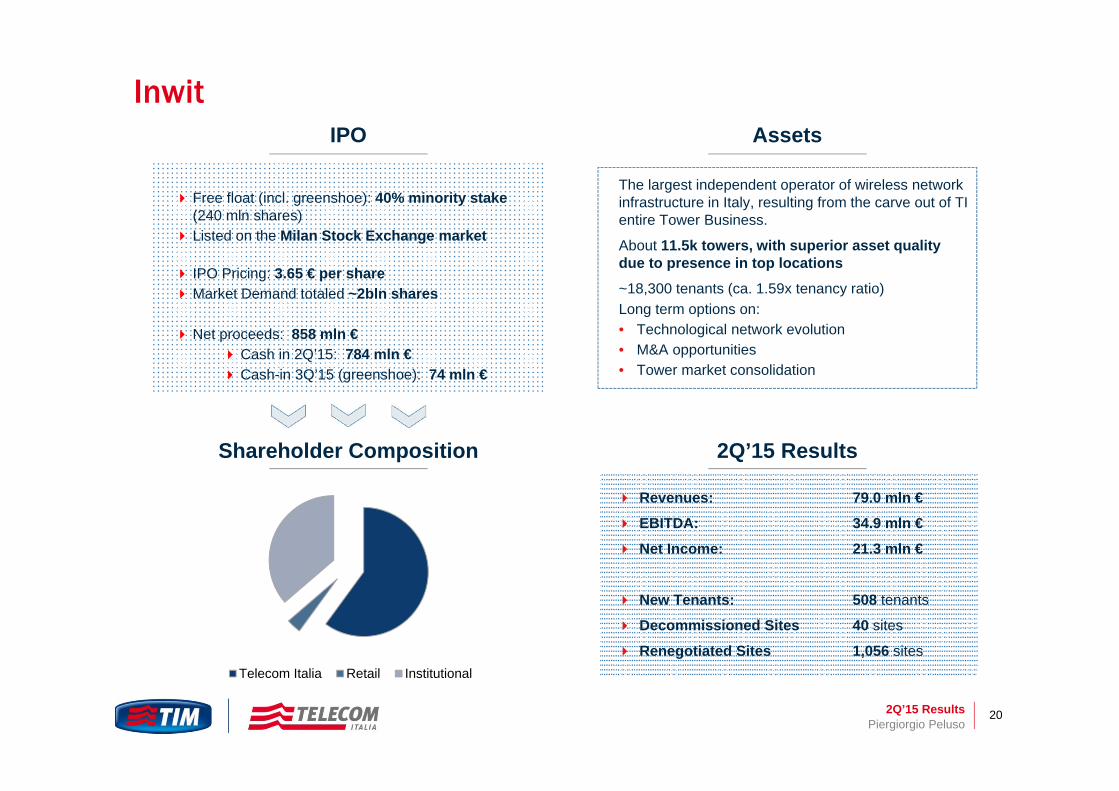
The largest independent operator of wireless network infrastructure in Italy, resulting from the carve out of TI entire Tower Business.
About 11.5k towers, with superior asset quality due to presence in top locations
~18,300 tenants (ca. 1.59x tenancy ratio)Long term options on:• Technological network evolution• M&A opportunities• Tower market consolidation
Free float (incl. greenshoe): 40% minority stake (240 mln shares)
Listed on the Milan Stock Exchange market
IPO Pricing: 3.65 € per shareMarket Demand totaled ~2bln shares
Net proceeds: 858 mln € Cash in 2Q’15: 784 mln € Cash-in 3Q’15 (greenshoe): 74 mln €
Inwit
Piergiorgio Peluso
Revenues: 79.0 mln €
EBITDA: 34.9 mln €
Net Income: 21.3 mln €
New Tenants: 508 tenants
Decommissioned Sites 40 sites
Renegotiated Sites 1,056 sites
Shareholder Composition
AssetsIPO
2Q’15 Results
Telecom Italia Retail Institutional
2Q’15 Results 21FY 2014 Preliminary Results & 2015-2017 Plan Outline
TI 2Q’15 Results Marco Patuano
Financial Update Piergiorgio Peluso
Take-Aways Marco Patuano
Appendix
Marco Patuano - Piergiorgio Peluso
Agenda
2Q’15 Results 22
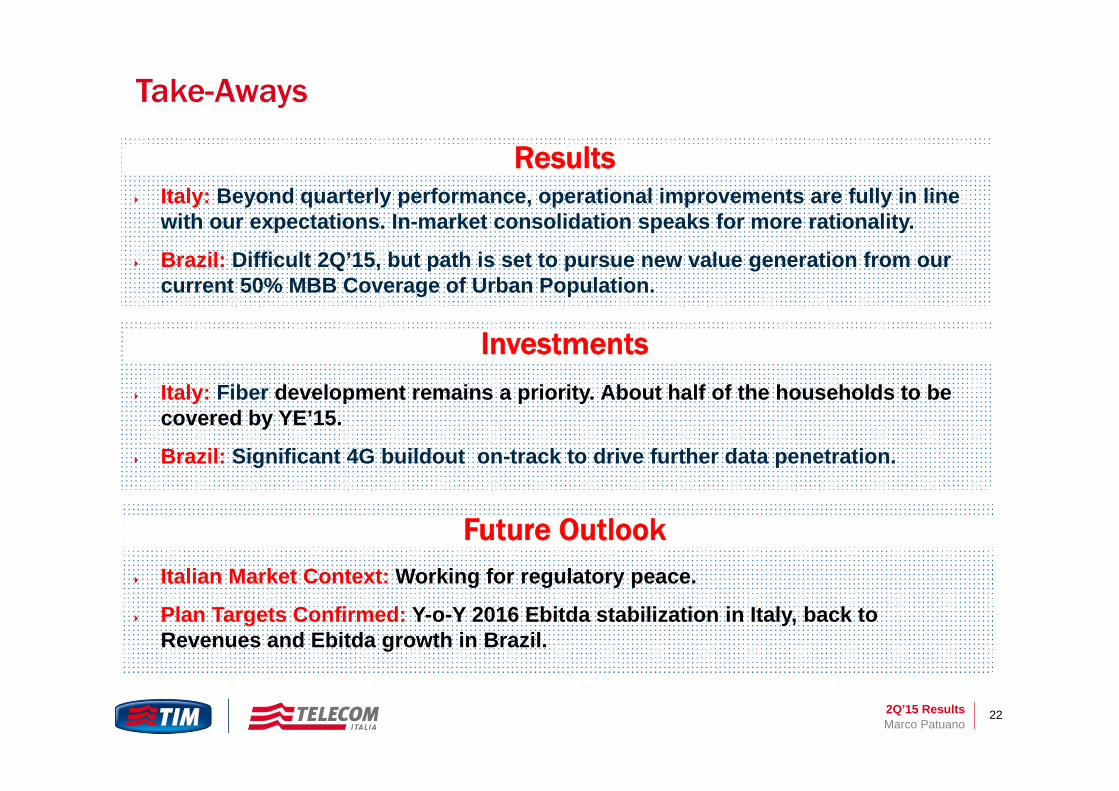
Take-Aways
FY 2014 Preliminary Results & 2015-2017 Plan OutlineMarco Patuano
Italian Market Context: Working for regulatory peace.
Plan Targets Confirmed: Y-o-Y 2016 Ebitda stabilization in Italy, back to Revenues and Ebitda growth in Brazil.
Italy: Beyond quarterly performance, operational improvements are fully in line with our expectations. In-market consolidation speaks for more rationality.
Brazil: Difficult 2Q’15, but path is set to pursue new value generation from our current 50% MBB Coverage of Urban Population.
Italy: Fiber development remains a priority. About half of the households to be covered by YE’15.
Brazil: Significant 4G buildout on-track to drive further data penetration.
Results
Investments
Future Outlook

2Q’15 Results 23
TI 2Q’15 Results Marco Patuano
Financial Update Piergiorgio Peluso
Take-Aways Marco Patuano
Appendix
FY 2014 Preliminary Results & 2015-2017 Plan OutlineMarco Patuano - Piergiorgio Peluso
Agenda

2Q’15 Results 24
Domestic Mobile Breakdown
Marco Patuano - Piergiorgio Peluso
€ mln, QoQ
Quarterly Mobile Revenues Breakdown Service Revenues Trend YoY
2Q’15 2Q’14
Total 1,236 1,264 -2.2%Service 1,109 1,138 -2.5%
Handsets 127 126 +0.1%
Traditional Service 622 726 -14.3%
Innovative Service 416 342 +21.8%
Wholesale Service 71 69 +2.1%
YoY
o/w Outgoing 455 531 -14.3%
o/w Incoming 62 56 +9.9%
o/w Browsing 339 281 +20.7%
o/w Internet Content 77 61 +27.3%
o/w Messaging 106 139 -24.0%
-14.9% -13.3%
-7.1% -5.7% -4.2% -2.5%
1Q'14 2Q'14 3Q'14 4Q'14 1Q'15 2Q'15
-24.1%-21.9%
-16.7% -16.1%-12.9% -14.3%
+9.9% +8.4%
+16.6%+13.1%
+14.4%
+21.8%
2Q’15 Results 25
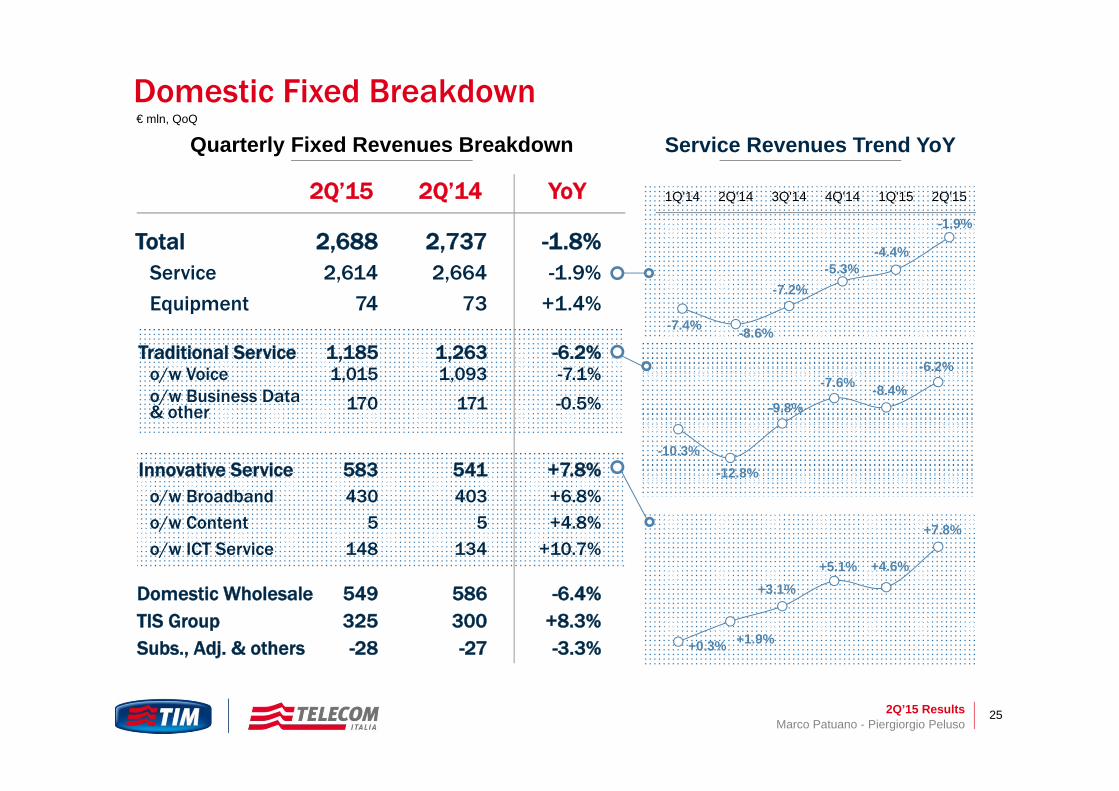
Domestic Fixed Breakdown
Marco Patuano - Piergiorgio Peluso
Quarterly Fixed Revenues Breakdown Service Revenues Trend YoY
2Q’15 2Q’14 YoY
Total 2,688 2,737 -1.8%Service 2,614 2,664 -1.9%
Equipment 74 73 +1.4%
Traditional Service 1,185 1,263 -6.2%o/w Voice 1,015 1,093 -7.1%o/w Business Data & other 170 171 -0.5%
Innovative Service 583 541 +7.8%o/w Broadband 430 403 +6.8%o/w Content 5 5 +4.8%o/w ICT Service 148 134 +10.7%
549 586 -6.4%Domestic WholesaleTIS Group 325 300 +8.3%Subs., Adj. & others -28 -27 -3.3%
-7.4% -8.6%
-7.2%-5.3%
-4.4%
-1.9%
1Q'14 2Q'14 3Q'14 4Q'14 1Q'15 2Q'15
-10.3%-12.8%
-9.8%
-7.6% -8.4%
-6.2%
+0.3% +1.9%
+3.1%+5.1% +4.6%
+7.8%
€ mln, QoQ

2Q’15 Results 26
-28-20
-8
-17
-41 -34
+78
+5
-25
+20
-15+0
Jan Feb Mar Apr May June
Domestic Mobile KPIsMobile CB Active CB - YoY Trend
‘000
Marco Patuano - Piergiorgio Peluso
MNP Balance Highlights
Constant KPIs improvement:
Better MNP Balance vs. 2014+63k in 1H’15 vs. -148k in 1H’14
Constant increase in Active CB on Total CB86%, +2pp vs. 2Q’14
YoY gap on Active CB narrowed-0.1% YoY
Active CB
30,996 30,660 30,374 30,350 30,140 30,075
1Q'14 2Q'14 3Q'14 4Q'14 1Q'15 2Q'15
83% 84% 85% 85% 85% 86%
34% 36% 37% 39% 41% 42%
User BB on Active
-1.8%
-1.3%
-2.3%
-1.3%
-0.4%-0.1%
1Q'14 2Q'14 3Q'14 4Q'14 1Q'15 2Q'15
2015
2014
+63
-148
cum.Jan-Jun
2Q’15 Results 27
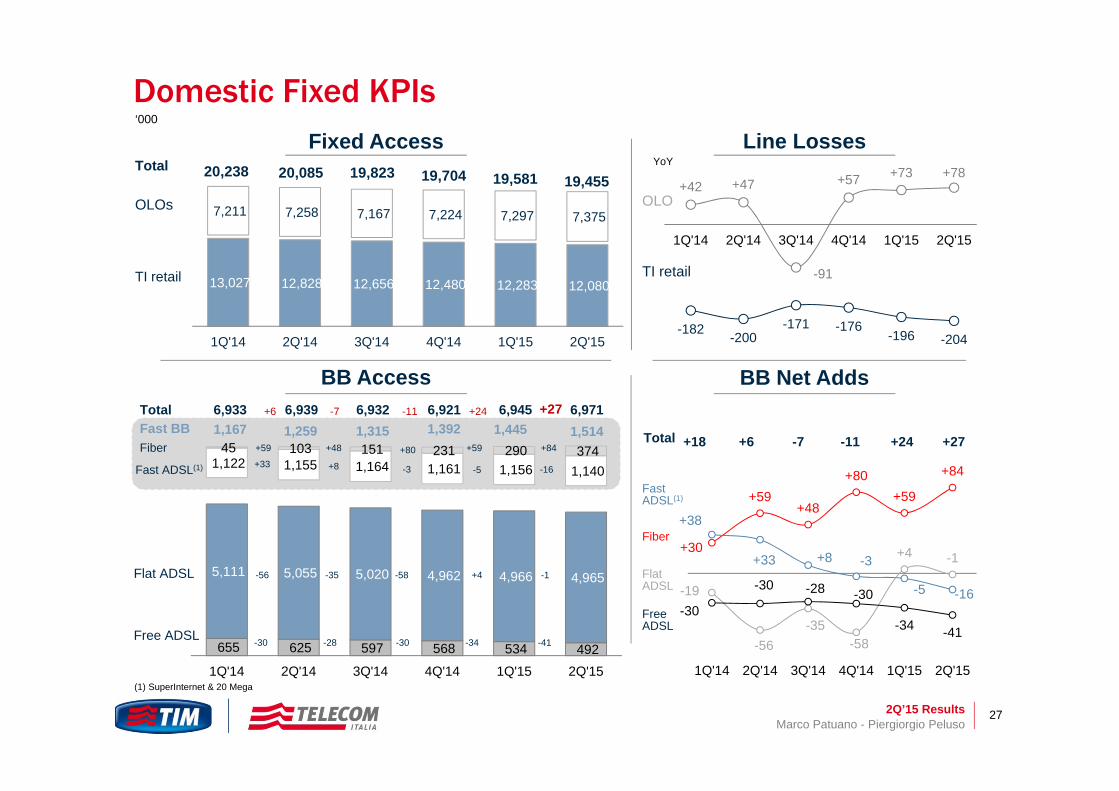
Domestic Fixed KPIs
Marco Patuano - Piergiorgio Peluso
(1) SuperInternet & 20 Mega
Fixed Access Line LossesYoY
BB Access
OLO
TI retail
655 625 597 568 534 492
5,111 5,055 5,020 4,962 4,966 4,965
1,122 1,155 1,164 1,161 1,156 1,140
45 103 151 231 290 374
1Q'14 2Q'14 3Q'14 4Q'14 1Q'15 2Q'15
+59
Flat ADSL
Free ADSL
Fast ADSL(1)
Fiber
+6 -7 -11 +24
+59 +48 +80 +84
+33 +8 -3 -5 -16
-56 -35 -58 +4 -1
-30 -28 -30 -34 -41
TotalFast BB 1,167 1,259 1,315 1,392 1,445 1,514
6,933 6,939 6,932 6,921 6,945 6,971+27
OLOs
TI retail
Total 19,823 19,704 19,58120,238 20,085 19,455
13,027 12,828 12,656 12,480 12,283 12,080
7,211 7,258 7,167 7,224 7,297 7,375
1Q'14 2Q'14 3Q'14 4Q'14 1Q'15 2Q'15
BB Net Adds
Free ADSL
Flat ADSL
Fiber
Fast ADSL(1)
Total
+42 +47
-91
+57 +73 +78
-182 -200-171 -176
-196 -204
1Q'14 2Q'14 3Q'14 4Q'14 1Q'15 2Q'15
+30
+59+48
+80+59
+84
+38
+33 +8 -3
-5 -16-19
-56-35
-58
+4 -1
-30
-30 -28 -30
-34 -41
1Q'14 2Q'14 3Q'14 4Q'14 1Q'15 2Q'15
+18 +6 -7 -11 +24 +27
‘000
2Q’15 Results 28
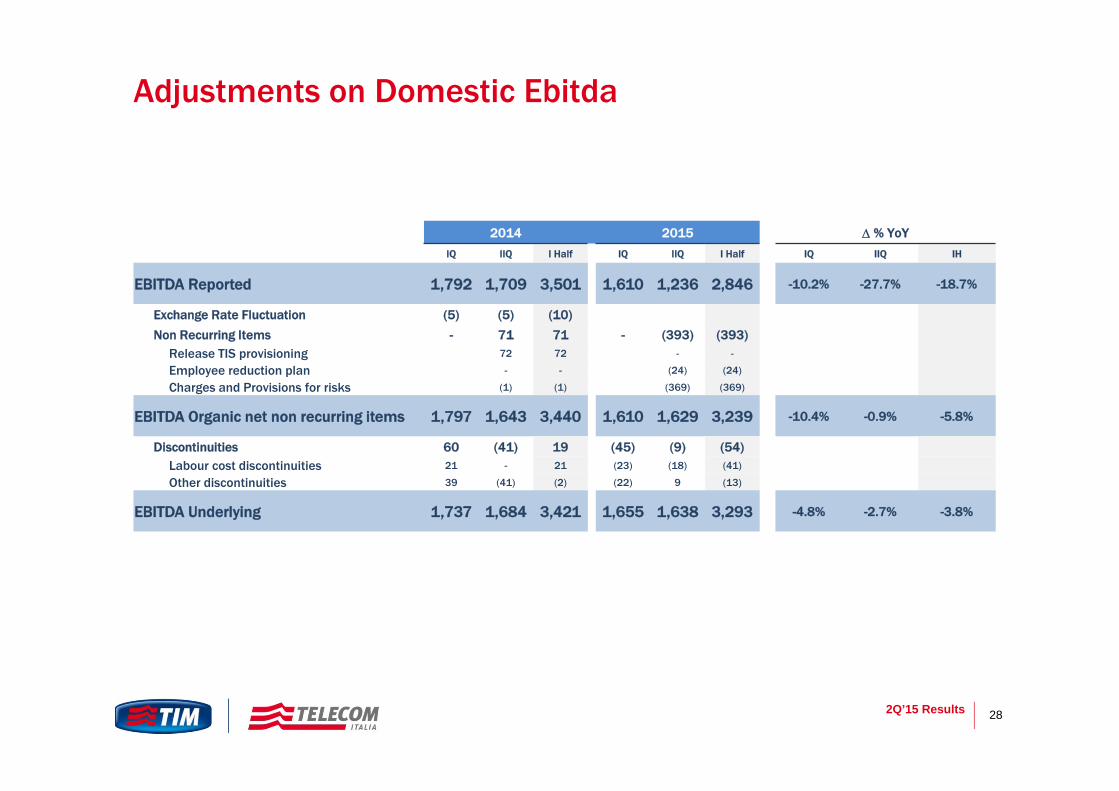
Adjustments on Domestic Ebitda
2014 2015 % YoY
IQ IIQ I Half IQ IIQ I Half IQ IIQ IH
EBITDA Reported 1,792 1,709 3,501 1,610 1,236 2,846 -10.2% -27.7% -18.7%
Exchange Rate Fluctuation (5) (5) (10)
Non Recurring Items - 71 71 - (393) (393)Release TIS provisioning 72 72 - -
Employee reduction plan - - (24) (24)
Charges and Provisions for risks (1) (1) (369) (369)
EBITDA Organic net non recurring items 1,797 1,643 3,440 1,610 1,629 3,239 -10.4% -0.9% -5.8%
Discontinuities 60 (41) 19 (45) (9) (54)Labour cost discontinuities 21 - 21 (23) (18) (41)
Other discontinuities 39 (41) (2) (22) 9 (13)
EBITDA Underlying 1,737 1,684 3,421 1,655 1,638 3,293 -4.8% -2.7% -3.8%

2Q’15 Results 29
Covered until 2019
(1) € 31,899 mln is the nominal amount of outstanding medium-long term debt. By adding Mandatory Convertible Bond (€ 1,300 mln), discontinued operations (€ 350 mln), IAS adjustments (€ 1,388 mln) and current financial liabilities (€ 768 mln), the gross debt figure of € 35,705 mln is reached.
Loans (of which long-term rent, financial and operating leases payable € 2,020)
Drawn bank facilityBonds
Undrawn portions of committedC&CE (escludeddiscontinued)
Debt Maturities and Liquidity Margin
Marco Patuano - Piergiorgio Peluso
839893
1,049
1,028
1,482
1,139
1,433
7,8637,0002,478
1,771
2,227
1,780
2,706
1,267
11,807
24,036
6,374
13.374
3,317
2,664
3,276
2,808
4,1882,406
13,240 31,899
Liquiditymargin
Within 2015 FY 2016 FY 2017 FY 2018 FY 2019 FY 2020 Beyond 2020 Total M/LTerm Debt
Record-rate Refinancing Continues € mln
2Q’15 Results 30
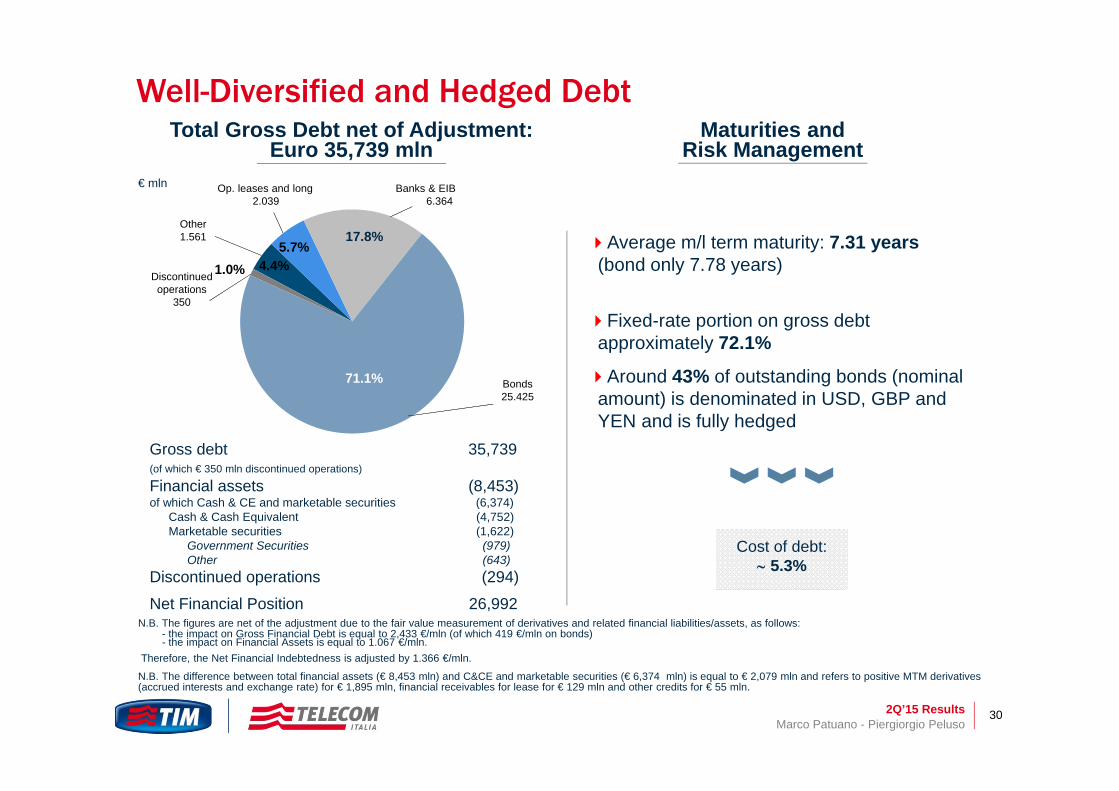
Total Gross Debt net of Adjustment: Euro 35,739 mln
Maturities and Risk Management
Average m/l term maturity: 7.31 years (bond only 7.78 years)
Fixed-rate portion on gross debt approximately 72.1%
Around 43% of outstanding bonds (nominal amount) is denominated in USD, GBP and YEN and is fully hedged
Well-Diversified and Hedged Debt
Cost of debt: 5.3%
Marco Patuano - Piergiorgio Peluso
N.B. The figures are net of the adjustment due to the fair value measurement of derivatives and related financial liabilities/assets, as follows: - the impact on Gross Financial Debt is equal to 2,433 €/mln (of which 419 €/mln on bonds)- the impact on Financial Assets is equal to 1.067 €/mln.
Therefore, the Net Financial Indebtedness is adjusted by 1.366 €/mln.
N.B. The difference between total financial assets (€ 8,453 mln) and C&CE and marketable securities (€ 6,374 mln) is equal to € 2,079 mln and refers to positive MTM derivatives (accrued interests and exchange rate) for € 1,895 mln, financial receivables for lease for € 129 mln and other credits for € 55 mln.
Gross debt 35,739(of which € 350 mln discontinued operations)
Financial assets (8,453) of which Cash & CE and marketable securities (6,374)
Cash & Cash Equivalent (4,752)Marketable securities (1,622)
Government Securities (979)Other (643)
Discontinued operations (294)
Net Financial Position 26,992
€ mln
4.4%5.7%
17.8%
71.1%
1.0%
Banks & EIB6.364
Other1.561
Op. leases and long2.039
Discontinuedoperations
350
Bonds25.425

2Q’15 Results 31
0.00
0.50
1.00
1.50
2.00
2.50
3.00
3.50
4.00
2015 2016 2017 2018 2019 2020 2021 2022 2023 2024 2029 2033 2034 2036 2038 2055Amount Outstanding (EUR equivalent) New bond issues EUR Amount Bought Back (EUR equivalent)
Benefitting from January and March record-low coupon bond funding, worth in aggregate E3bn, TI successfully executed to-date 3 bond buybacks targeting EUR and USD notes worth in total
€ 3.8 Bln, considerably improving the yield of its liquidity.
YTD 2015 Buybacks will deliver more than € 350 mln pre-tax coupon savings until 2022 net of 2015 negative impact
* including above-par buyback price effect and derivatives unwind impact
70% premium Convertible Bond 1.125% coupon
Jan 2023 Bond3.25% coupon
€ Bln
2015 YTD Results from our 2015 Group Capital Markets Activity
Building Up Large Savings from our Multi-Currency Liability Management
Average all-in yield* on liquidity deployed >2%
Marco Patuano - Piergiorgio Peluso