2q 2021 results - ir.kaspi.kz
TRANSCRIPT
1
2Q 2021 Results
26 July, 2021
2
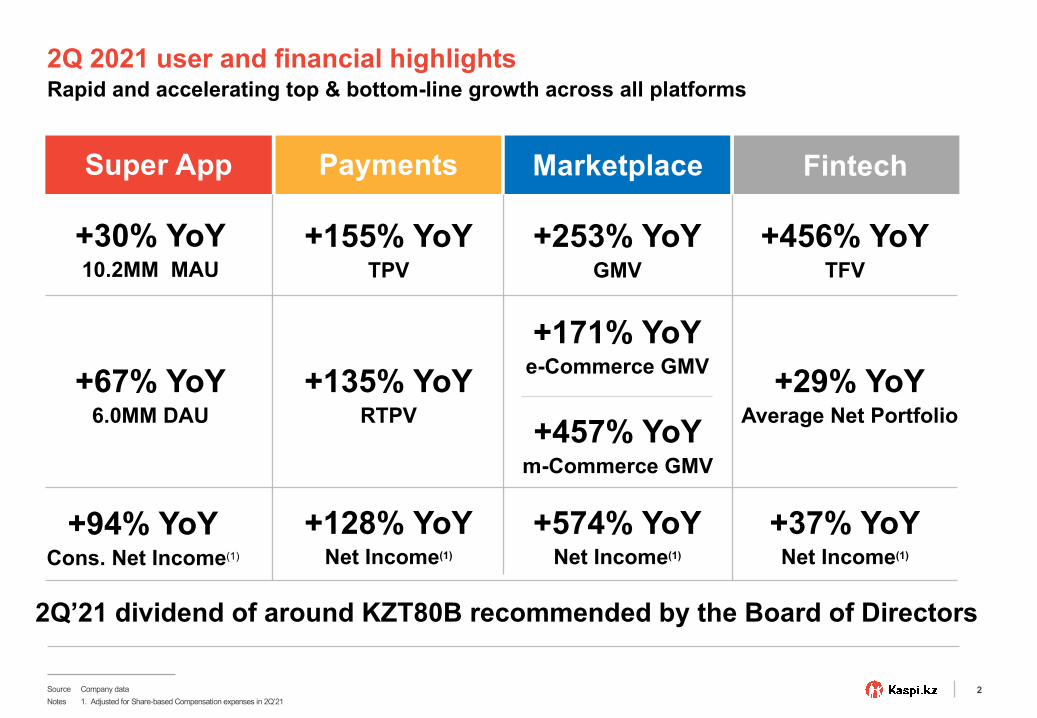
2Q 2021 user and financial highlights Rapid and accelerating top & bottom-line growth across all platforms
+30% YoY10.2MM MAU
+67% YoY6.0MM DAU
+155% YoYTPV
+135% YoYRTPV
+253% YoYGMV
+171% YoYe-Commerce GMV
+456% YoYTFV
+29% YoYAverage Net Portfolio
Super App Payments Marketplace Fintech
+457% YoYm-Commerce GMV
Source Company data
2Q’21 dividend of around KZT80B recommended by the Board of Directors
+94% YoYCons. Net Income(1)
+128% YoYNet Income(1)
+574% YoYNet Income(1)
+37% YoYNet Income(1)
Notes 1. Adjusted for Share-based Compensation expenses in 2Q’21
3
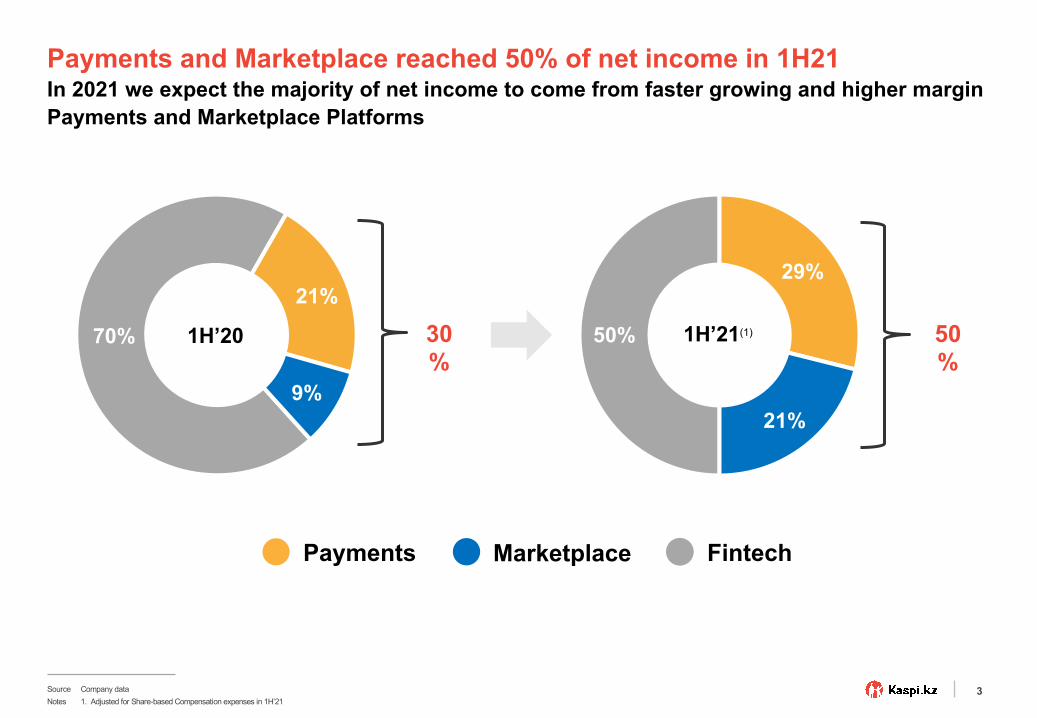
Payments and Marketplace reached 50% of net income in 1H21
Payments Marketplace Fintech
In 2021 we expect the majority of net income to come from faster growing and higher margin Payments and Marketplace Platforms
70%
21%
9%
1H’20 50%
29%
21%
1H’21(1)30%
50%
Source Company dataNotes 1. Adjusted for Share-based Compensation expenses in 1H’21
4
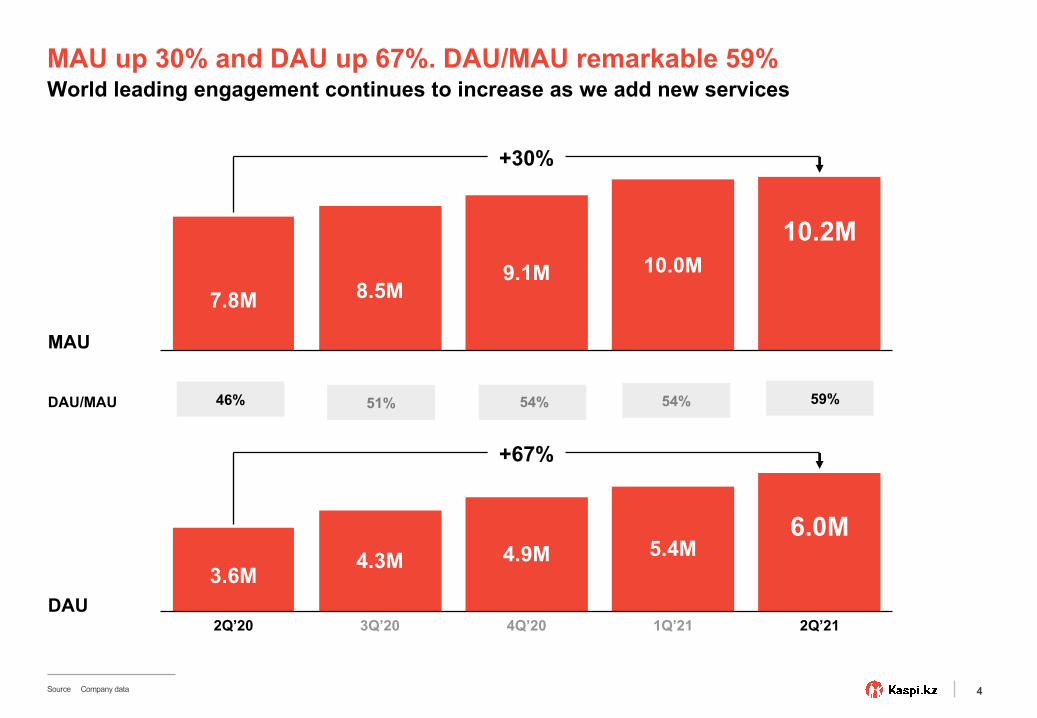
MAU up 30% and DAU up 67%. DAU/MAU remarkable 59% World leading engagement continues to increase as we add new services
MAU
DAU
6.2M7.8M
8.5M
46% 51% 54% 54%DAU/MAU
Source Company data
7.8M 8.5M9.1M 10.0M
10.2M
+30%
4Q’20
3.6M
2Q’20
5.4M4.3M
3Q’20 1Q’21
4.9M6.0M
2Q’21
+67%
59%
5
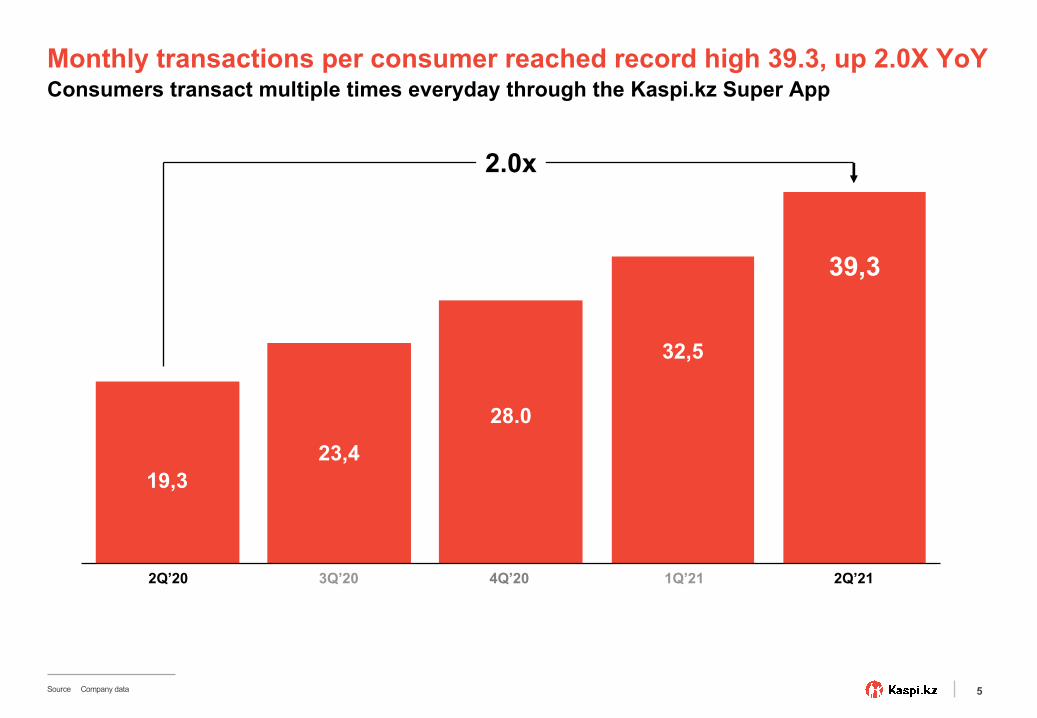
Monthly transactions per consumer reached record high 39.3, up 2.0X YoYConsumers transact multiple times everyday through the Kaspi.kz Super App
Source Company data
19,323,4
28.0
32,5
39,3
2Q’20 1Q’213Q’20 4Q’20 2Q’21
2.0x
6
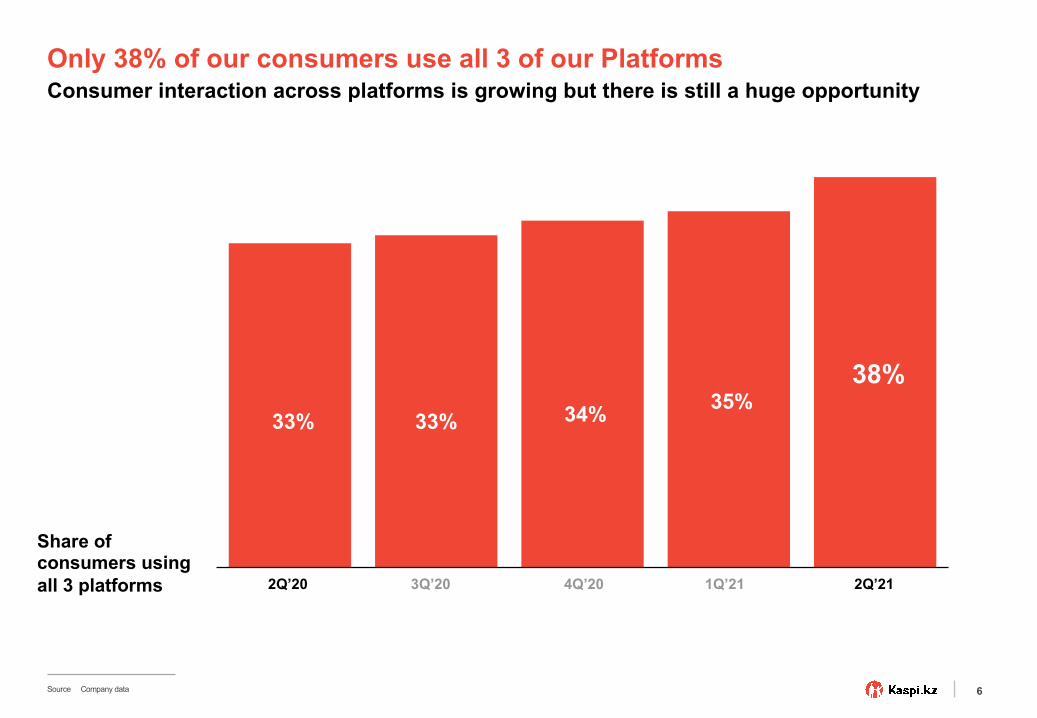
Share of consumers using all 3 platforms
234B
306B
363B
412B
444B
Source Company data
33%
2Q’20
33%
3Q’20
34%
1Q’214Q’20
35%38%
2Q’21
Only 38% of our consumers use all 3 of our PlatformsConsumer interaction across platforms is growing but there is still a huge opportunity
7
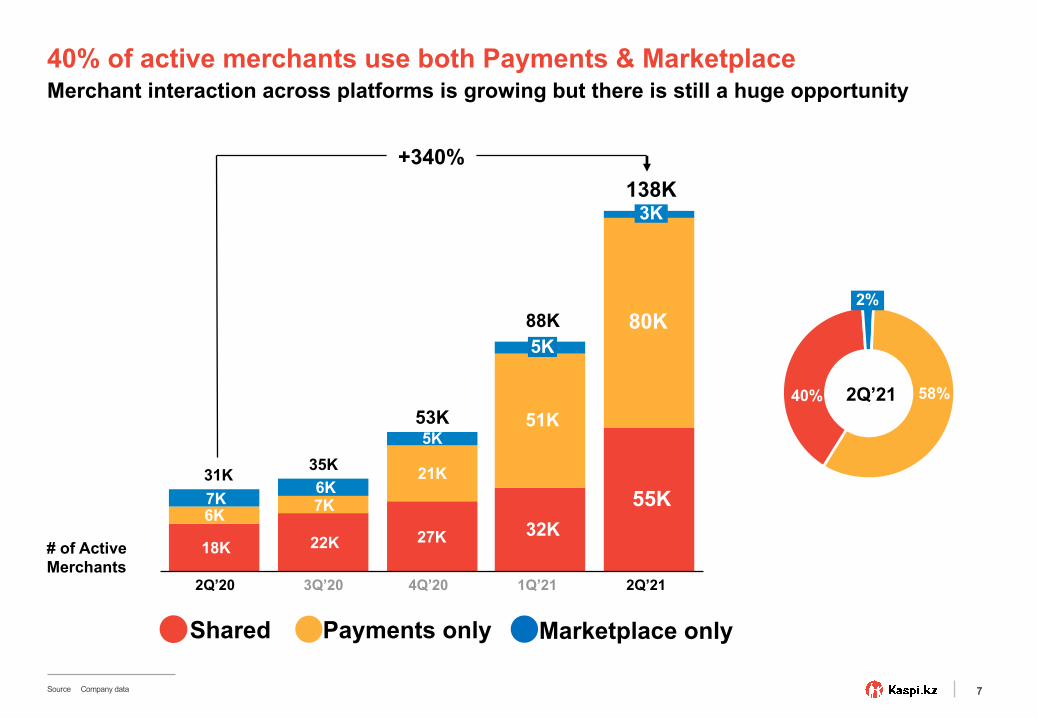
40% of active merchants use both Payments & Marketplace Merchant interaction across platforms is growing but there is still a huge opportunity
7K21K7K
18K
6K 7K
5K
27K 32K
5K
51K
3K
55K
80K
53K
88K
31K 35K
138K
Payments only Marketplace only
# of Active Merchants
40% 58%
+340%
1Q’214Q’20 2Q’213Q’202Q’20
Source Company data
2Q’21
7K
22K
6K
2%
Shared
8
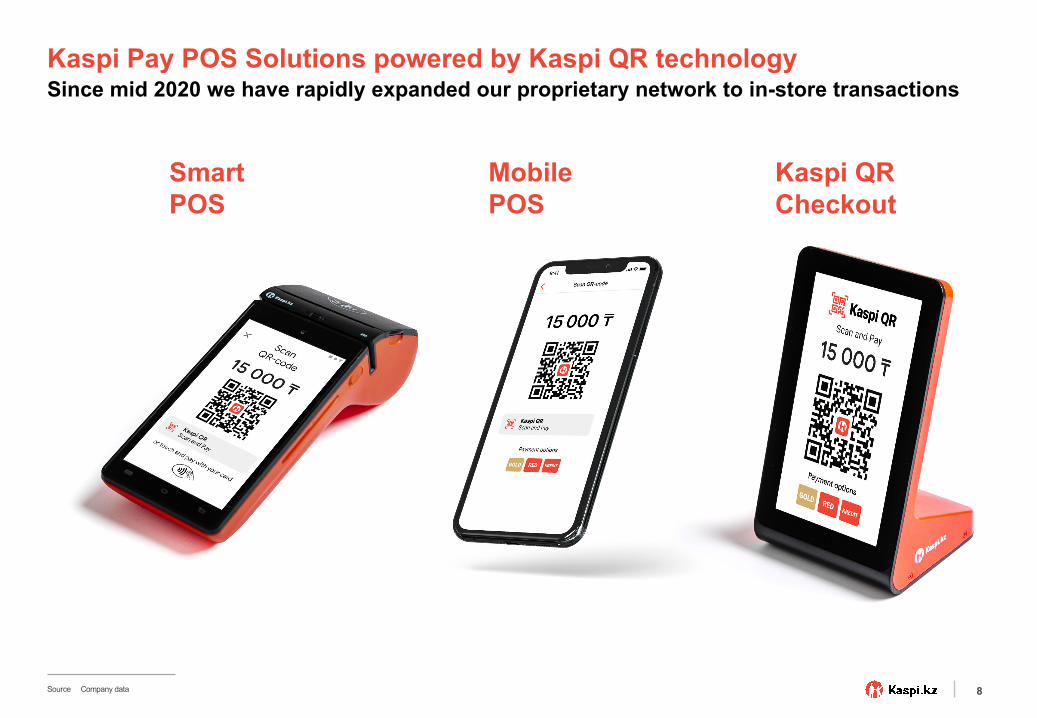
Kaspi Pay POS Solutions powered by Kaspi QR technologySince mid 2020 we have rapidly expanded our proprietary network to in-store transactions
Smart POS
Mobile POS
Kaspi QR Checkout
Source Company data
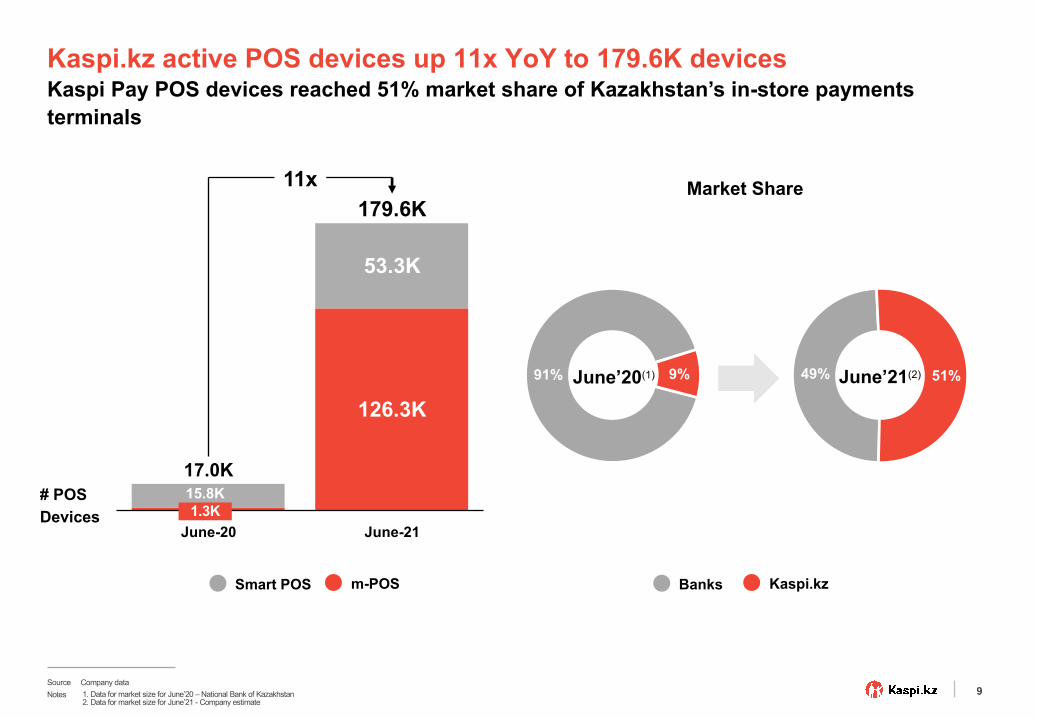
9
Market Share
Kaspi.kz active POS devices up 11x YoY to 179.6K devicesKaspi Pay POS devices reached 51% market share of Kazakhstan’s in-store payments terminals
91% 9%June’20(1) 49% 51%
Banks Kaspi.kz
June’21(2)
Source Company dataNotes 1. Data for market size for June’20 – National Bank of Kazakhstan
2. Data for market size for June’21 - Company estimate
Smart POS m-POS
# POS Devices
17.0K
126.3K
15.8K
June-21June-20
53.3K
179.6K11x
1.3K
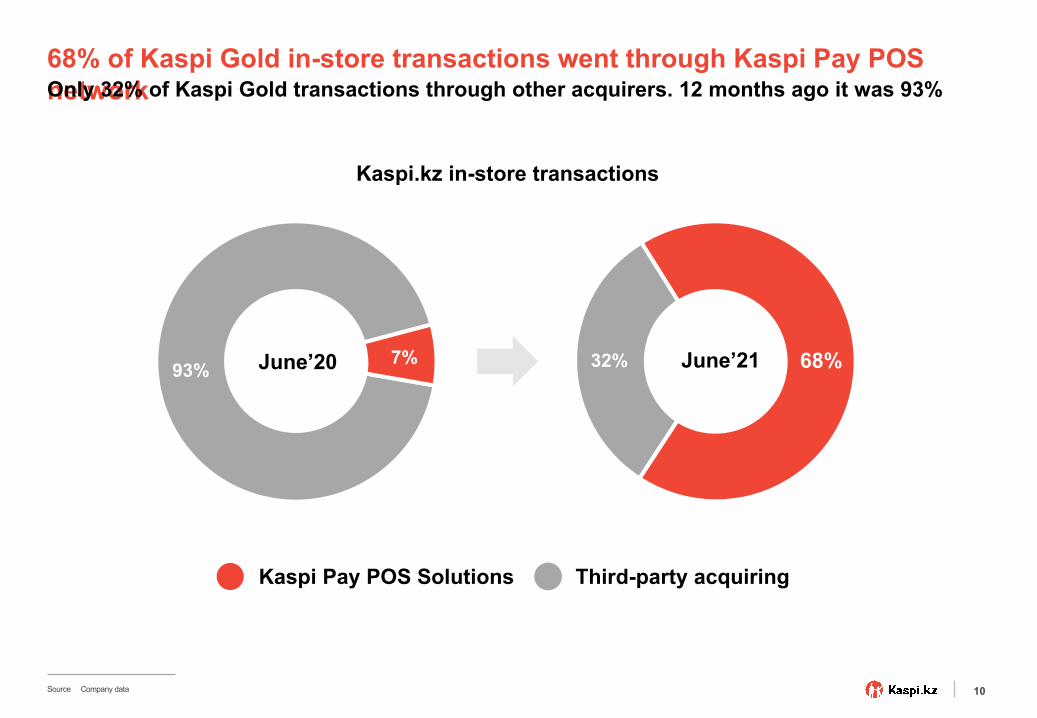
10
68% of Kaspi Gold in-store transactions went through Kaspi Pay POS networkOnly 32% of Kaspi Gold transactions through other acquirers. 12 months ago it was 93%
Kaspi.kz in-store transactions
Source Company data
Kaspi Pay POS Solutions Third-party acquiring
93%7%June’20 32% 68%June’21

11
4%
16%80%
Kaspi POS# of transactions
Other cards
Kaspi Gold Card
Kaspi QR
Source Company data
Kaspi Pay POS transactions up 26x YoY. Kaspi QR is 80% of transactionsGrowth in Kaspi POS transactions accelerating. Consumers and merchants love Kaspi QR contactless payments
2Q’21
2Q’206M
85M
3Q’20
17M
48M
4Q’20 1Q’21
156M
2Q’21
26.0X
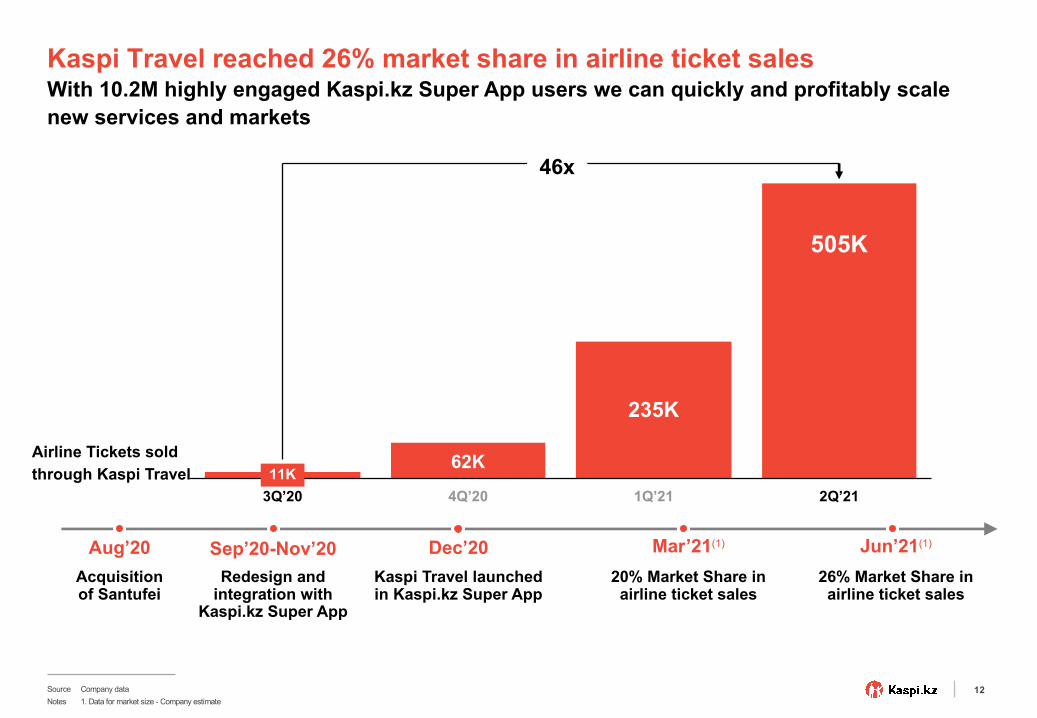
12
Acquisitionof Santufei
Aug’20Kaspi Travel launchedin Kaspi.kz Super App
Dec’20Sep’20-Nov’20Redesign and
integration with Kaspi.kz Super App
20% Market Share in airline ticket sales
Mar’21(1) Jun’21(1)
26% Market Share in airline ticket sales
Kaspi Travel reached 26% market share in airline ticket sales
58K
78K
98K
11K
36K
13K13K
1Q’21
505K
11K62K
3Q’20 4Q’20 2Q’21
235K
46x
Airline Tickets soldthrough Kaspi Travel
Source Company dataNotes 1. Data for market size - Company estimate
With 10.2M highly engaged Kaspi.kz Super App users we can quickly and profitably scale new services and markets
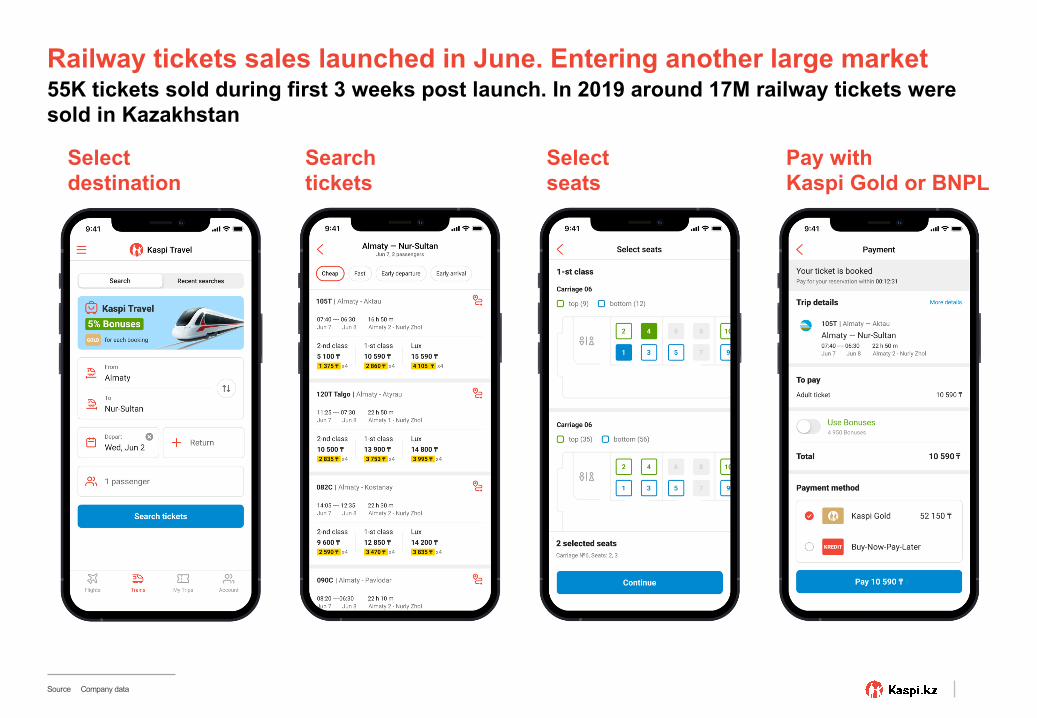
13
Railway tickets sales launched in June. Entering another large market55K tickets sold during first 3 weeks post launch. In 2019 around 17M railway tickets were sold in Kazakhstan
Source Company data
Select destination
Search tickets
Select seats
Pay with Kaspi Gold or BNPL
14
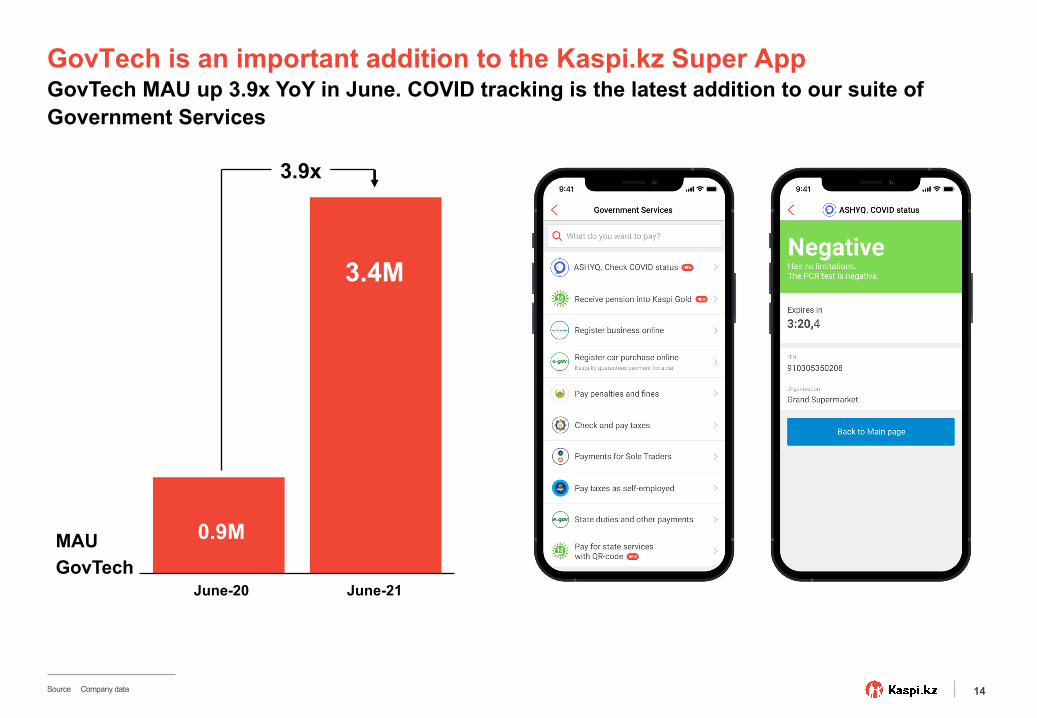
GovTech is an important addition to the Kaspi.kz Super AppGovTech MAU up 3.9x YoY in June. COVID tracking is the latest addition to our suite of Government Services
MAUGovTech
0.9M
June-20
3.4M
June-21
3.9x
Source Company data
15
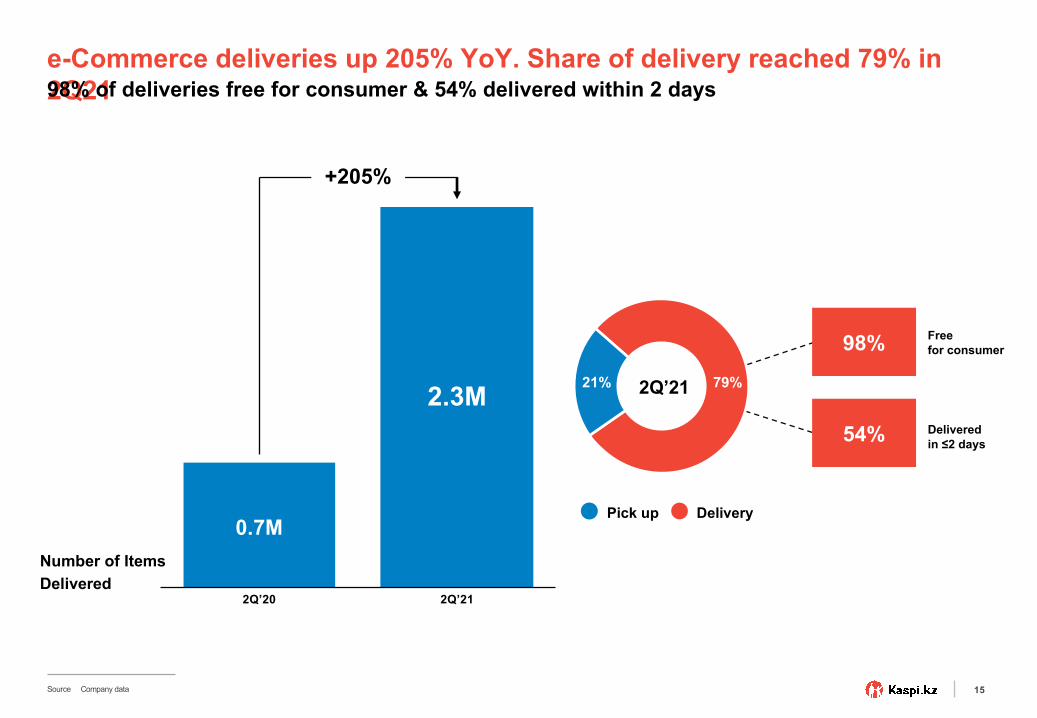
79%21%
e-Commerce deliveries up 205% YoY. Share of delivery reached 79% in 2Q2198% of deliveries free for consumer & 54% delivered within 2 days
Number of Items Delivered
Free for consumer
2Q’21
DeliveryPick up
98%
Deliveredin ≤2 days
Source Company data
$741MM
1.4M
0.7M
2.3M
2Q’20 2Q’21
+205%
54%
16
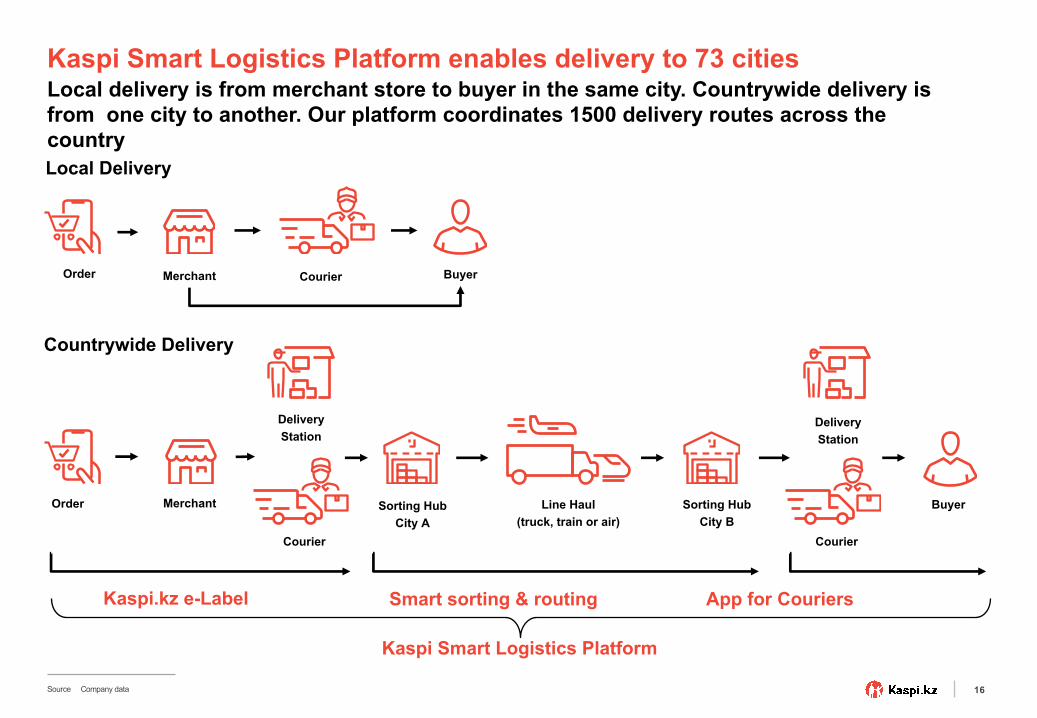
Kaspi Smart Logistics Platform enables delivery to 73 citiesLocal delivery is from merchant store to buyer in the same city. Countrywide delivery is from one city to another. Our platform coordinates 1500 delivery routes across the country
Source Company data
Order Merchant Courier Buyer
Order Merchant
Courier
BuyerSorting HubCity A
Sorting HubCity B
Line Haul(truck, train or air)
Local Delivery
Countrywide Delivery
DeliveryStation
Kaspi.kz e-Label Smart sorting & routing App for Couriers
Kaspi Smart Logistics Platform
DeliveryStation
Courier
17
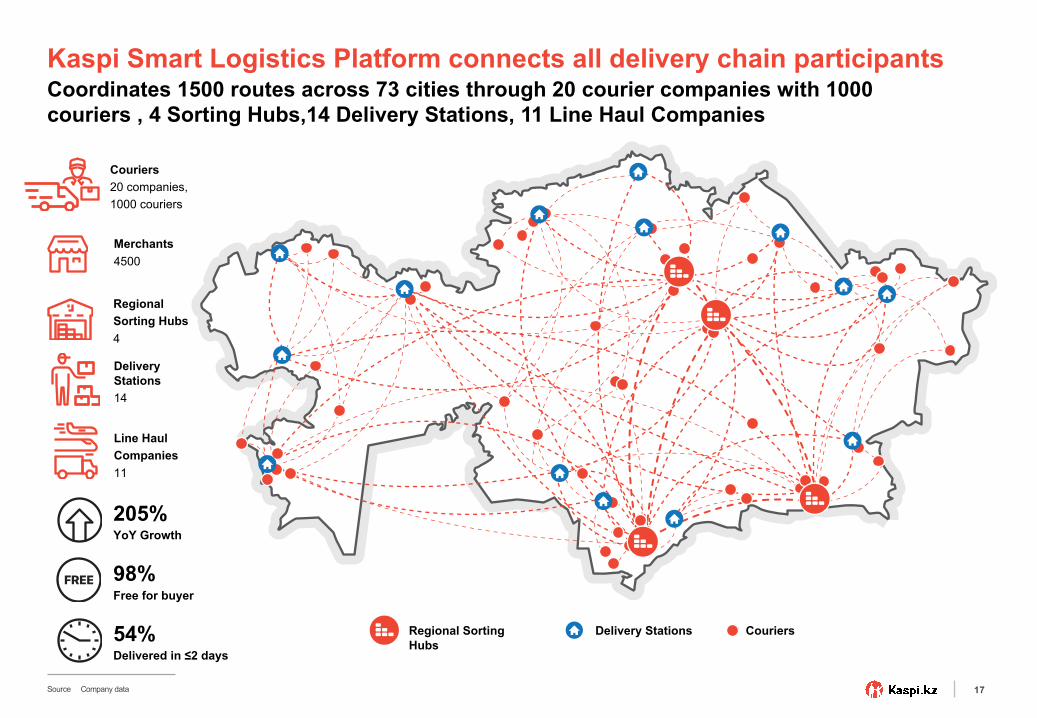
Kaspi Smart Logistics Platform connects all delivery chain participantsCoordinates 1500 routes across 73 cities through 20 courier companies with 1000 couriers , 4 Sorting Hubs,14 Delivery Stations, 11 Line Haul Companies
Regional Sorting Hubs4
Delivery Stations14
Line HaulCompanies11
205%YoY Growth
98%Free for buyer
54%Delivered in ≤2 days
Merchants4500
Regional Sorting Hubs
Delivery Stations Couriers
Couriers20 companies,1000 couriers
Source Company data
18
International & Ukraine
Portmone & Kaspi.kz
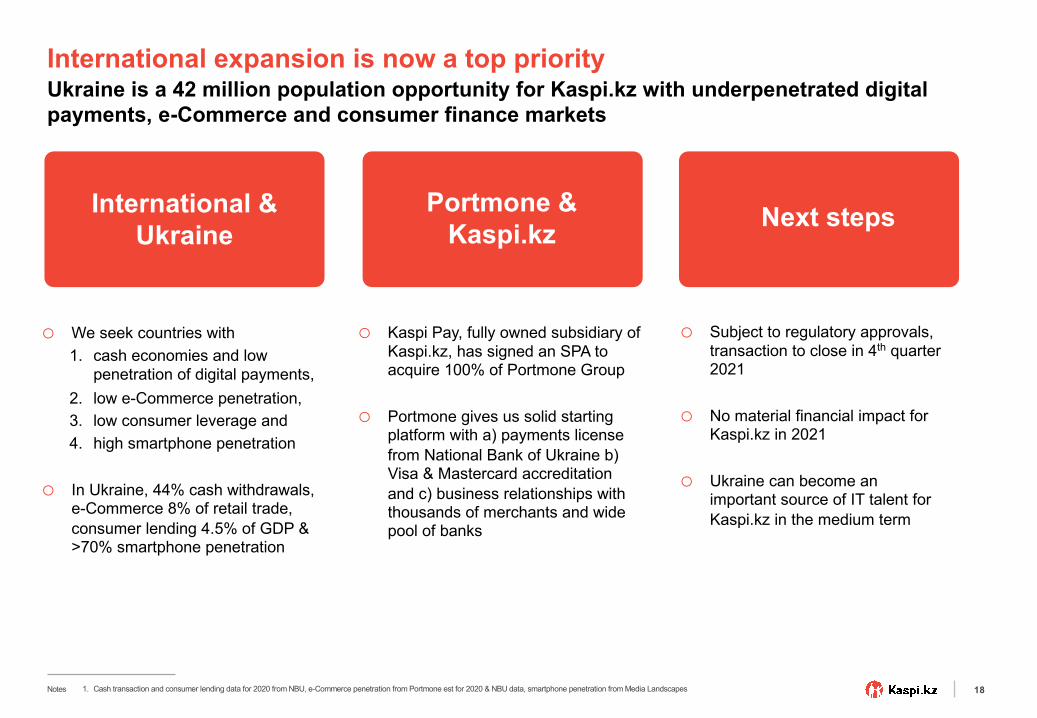
o Subject to regulatory approvals, transaction to close in 4th quarter 2021
o No material financial impact for Kaspi.kz in 2021
o Ukraine can become an important source of IT talent for Kaspi.kz in the medium term
o Kaspi Pay, fully owned subsidiary of Kaspi.kz, has signed an SPA to acquire 100% of Portmone Group
o Portmone gives us solid starting platform with a) payments license from National Bank of Ukraine b) Visa & Mastercard accreditation and c) business relationships with thousands of merchants and wide pool of banks
o We seek countries with1. cash economies and low
penetration of digital payments,2. low e-Commerce penetration,3. low consumer leverage and4. high smartphone penetration
o In Ukraine, 44% cash withdrawals, e-Commerce 8% of retail trade, consumer lending 4.5% of GDP & >70% smartphone penetration
1. Cash transaction and consumer lending data for 2020 from NBU, e-Commerce penetration from Portmone est for 2020 & NBU data, smartphone penetration from Media LandscapesNotes
Next steps
International expansion is now a top priorityUkraine is a 42 million population opportunity for Kaspi.kz with underpenetrated digital payments, e-Commerce and consumer finance markets

19
Payments Platform
20
Active Consumers
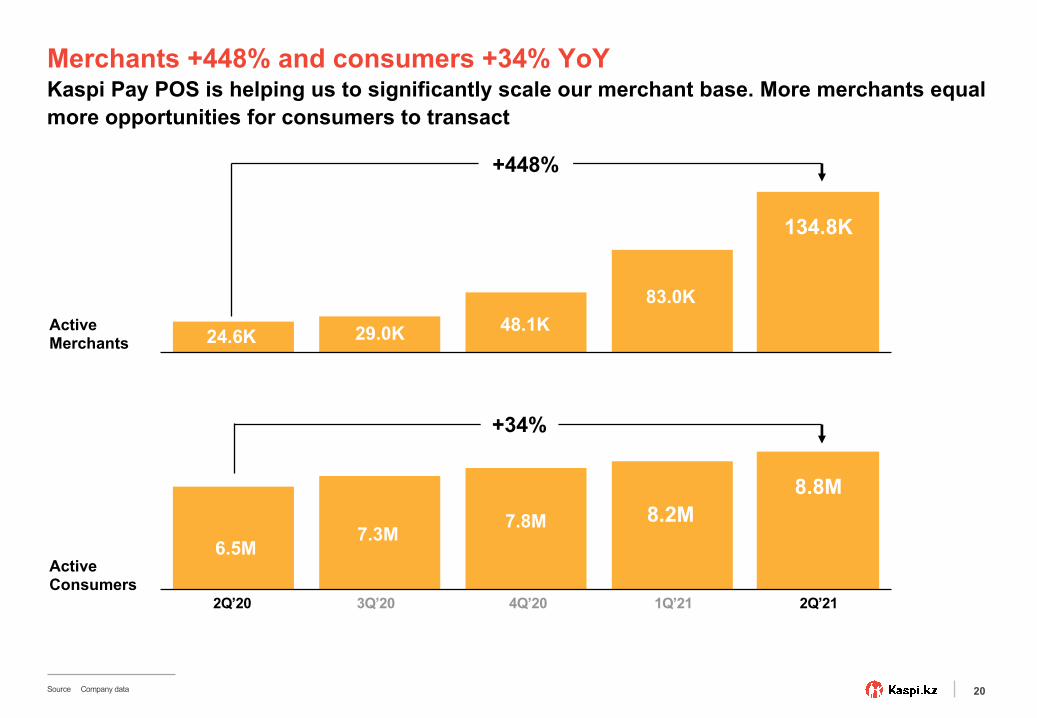
Merchants +448% and consumers +34% YoYKaspi Pay POS is helping us to significantly scale our merchant base. More merchants equal more opportunities for consumers to transact
7.3M6.5M
7.8M
5.4M
83.0K48.1K29.0K24.6K
Source Company data
134.8K
+448%
8.8M
6.5M7.8M
7.3M8.2M
+34%
2Q’20 1Q’213Q’20 4Q’20 2Q’21
Active Merchants
21
TPV
RTPV 1.175B
Take Rate
KZT
KZT
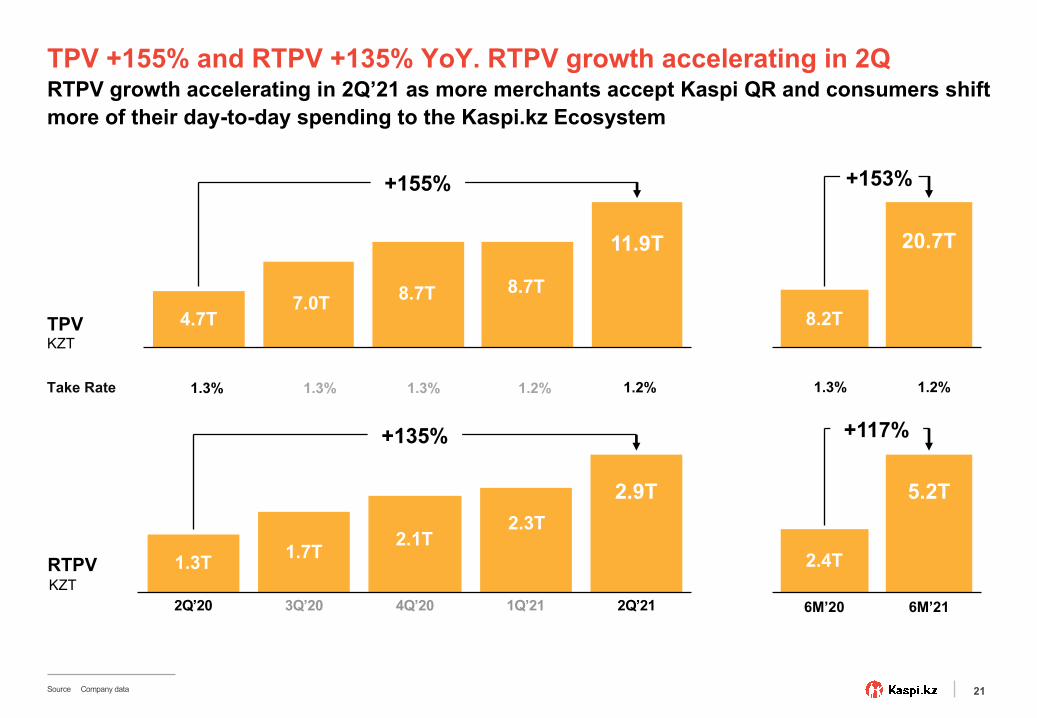
TPV +155% and RTPV +135% YoY. RTPV growth accelerating in 2Q
1.143B
1.3% 1.3% 1.3% 1.2%
Source Company data
8.7T
4.7T7.0T
11.9T
8.7T
+155%
1.7T1.3T
2.9T
1Q’21
2.3T
2Q’20 3Q’20
2.1T
4Q’20 2Q’21
+135%
8.2T
20.7T
+153%
2.4T
6M’20
5.2T
6M’21
+117%
1.2%1.3%1.2%
RTPV growth accelerating in 2Q’21 as more merchants accept Kaspi QR and consumers shift more of their day-to-day spending to the Kaspi.kz Ecosystem
22
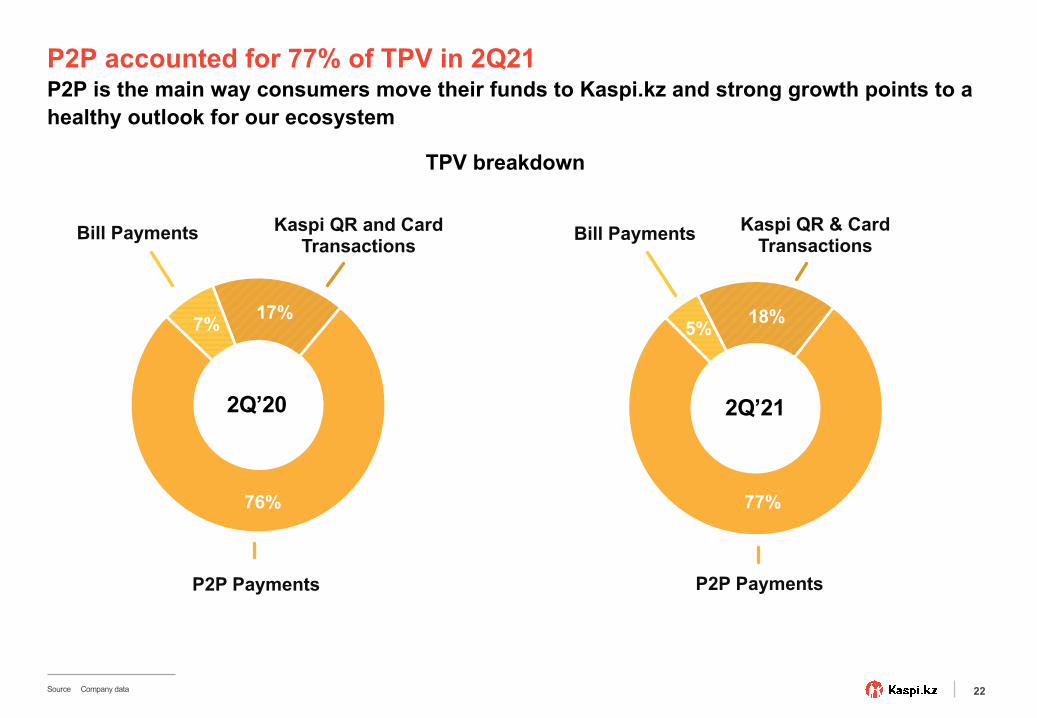
P2P accounted for 77% of TPV in 2Q21P2P is the main way consumers move their funds to Kaspi.kz and strong growth points to a healthy outlook for our ecosystem
Bill Payments Kaspi QR and Card Transactions
TPV breakdown
P2P Payments
17%7%
76%
2Q’20
Bill Payments Kaspi QR & Card Transactions
P2P Payments
18%5%
77%
2Q’21
Source Company data
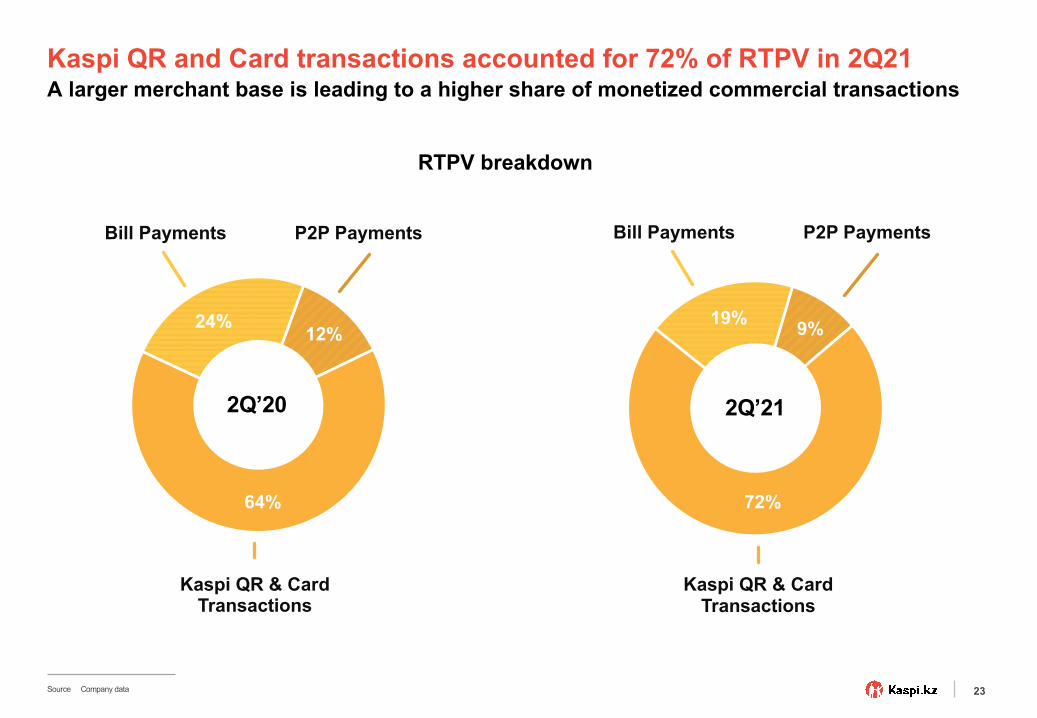
23
Bill Payments P2P Payments
RTPV breakdown
Kaspi QR & Card Transactions
24%12%
64%
2Q’20
19% 9%
72%
2Q’21
Bill Payments P2P Payments
Kaspi QR & Card Transactions
Source Company data
Kaspi QR and Card transactions accounted for 72% of RTPV in 2Q21A larger merchant base is leading to a higher share of monetized commercial transactions
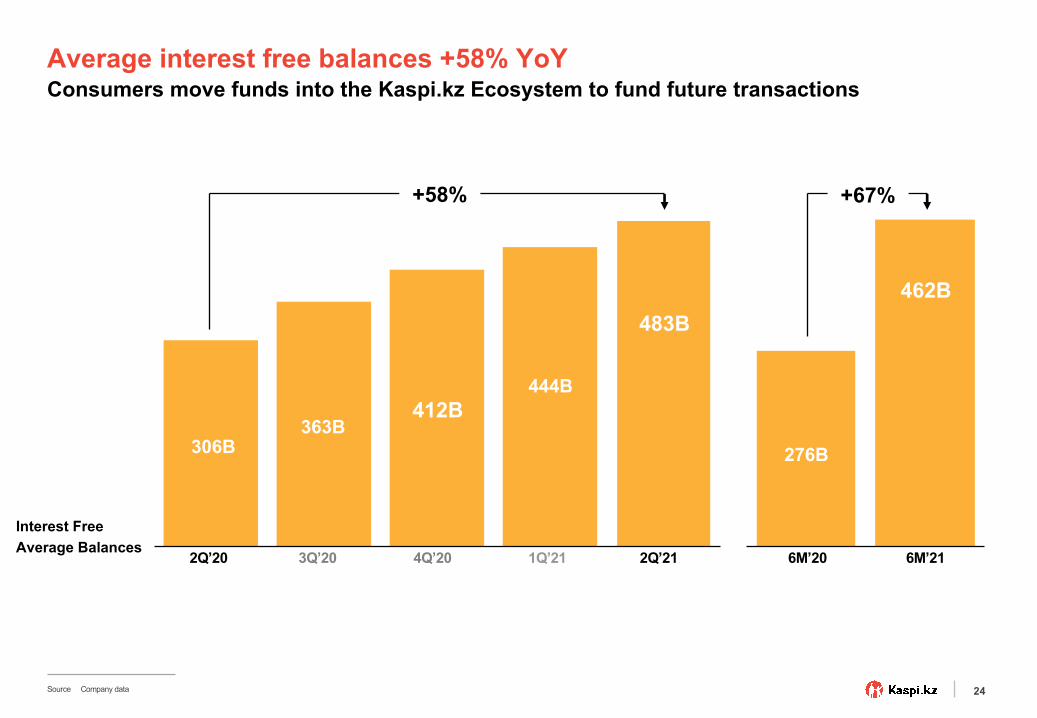
24
Interest Free Average Balances
Average interest free balances +58% YoYConsumers move funds into the Kaspi.kz Ecosystem to fund future transactions
Source Company data
276B
462B
+58% +67%
306B363B
412B444B
483B
1Q’213Q’202Q’20 4Q’20 2Q’21 6M’216M’20
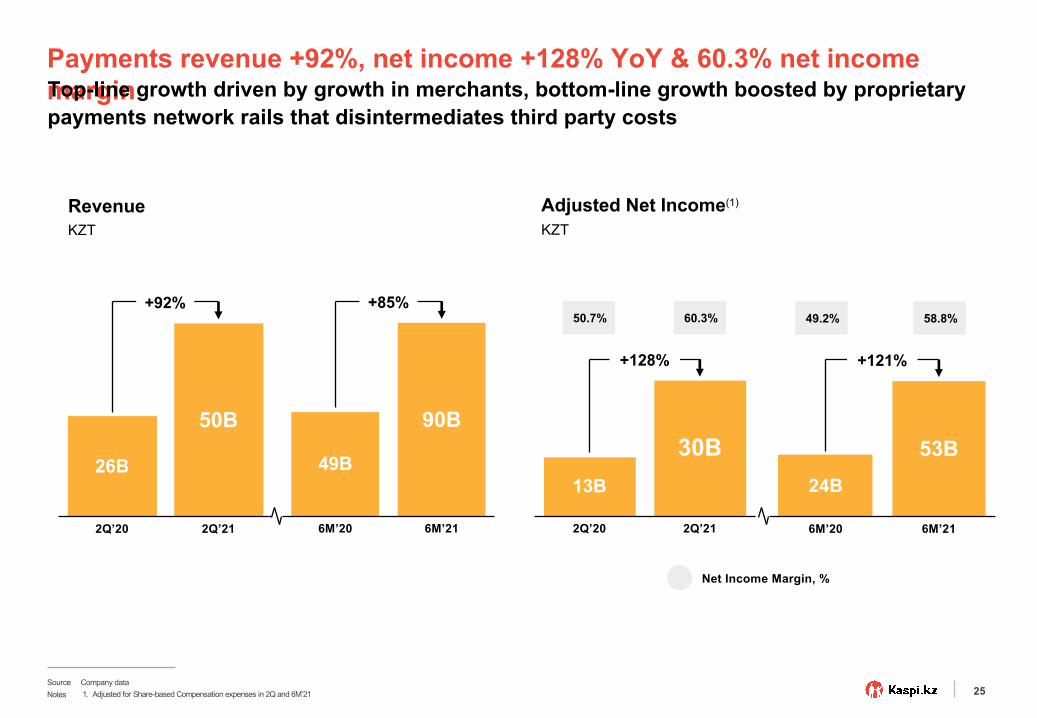
25
Payments revenue +92%, net income +128% YoY & 60.3% net income marginTop-line growth driven by growth in merchants, bottom-line growth boosted by proprietary payments network rails that disintermediates third party costs
Net Income Margin, %
26B
2Q’20
50B
2Q’21
+92%
RevenueKZT
Adjusted Net Income(1)
KZT
Source Company dataNotes 1. Adjusted for Share-based Compensation expenses in 2Q and 6M’21
49B
6M’20
90B
6M’21
+85%
$255MM
6M’21
24B
53B
6M’20
+121%
58.8%49.2%
13B
2Q’212Q’20
30B
+128%
60.3%50.7%

26
Marketplace Platform
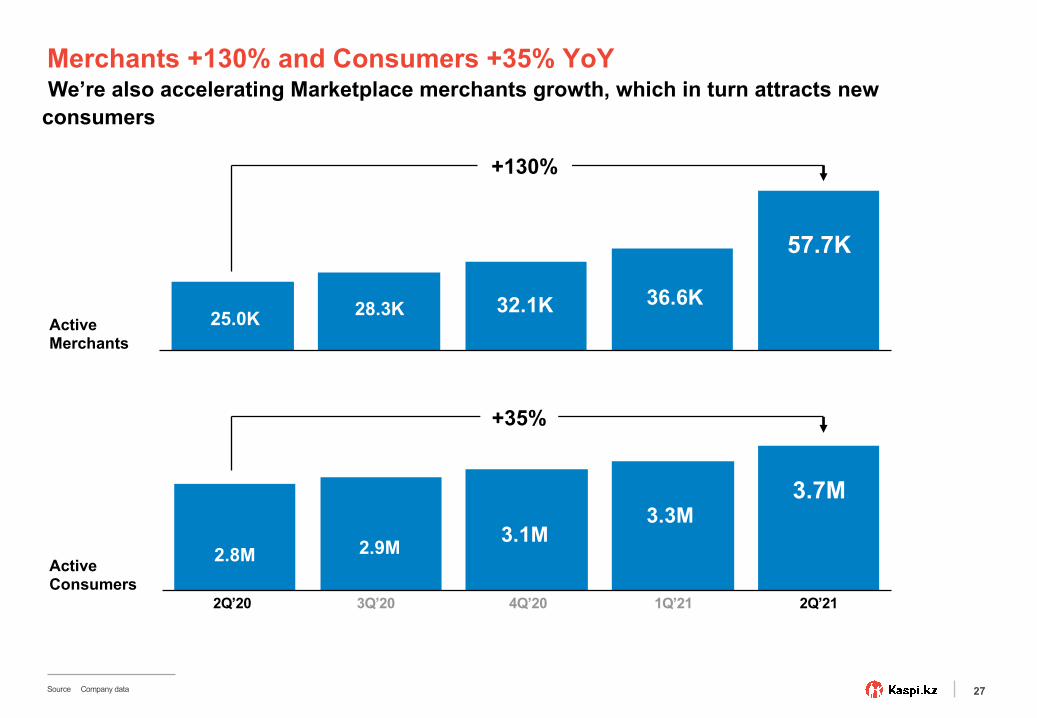
27
Merchants +130% and Consumers +35% YoYWe’re also accelerating Marketplace merchants growth, which in turn attracts new
consumers
Source Company data
25.0K 28.3K 32.1K 36.6K
57.7K
+130%
2.8M3.1M
3.3M
2.9M
3.7M
+35%
Active Merchants
Active Consumers
2Q’20 1Q’213Q’20 4Q’20 2Q’21

28
GMV +253% YoY and take rate up to 8.5% in 2Q21
GMV growth driven by both e-Commerce and m-Commerce. Take rate driven by mix shift,
promotional campaigns and initial monetization of Kaspi Logistics and Marketing Services
KZTGMV
Take Rate 6.3% 7.4% 8.8% 8.2%
Source Company data
1Q’213Q’20
112B
2Q’20
278B
206B
396B
341B
4Q’20 2Q’21
+253%
6M’216M’20
271B
674B
+148%
8.5% 6.7% 8.3%
29
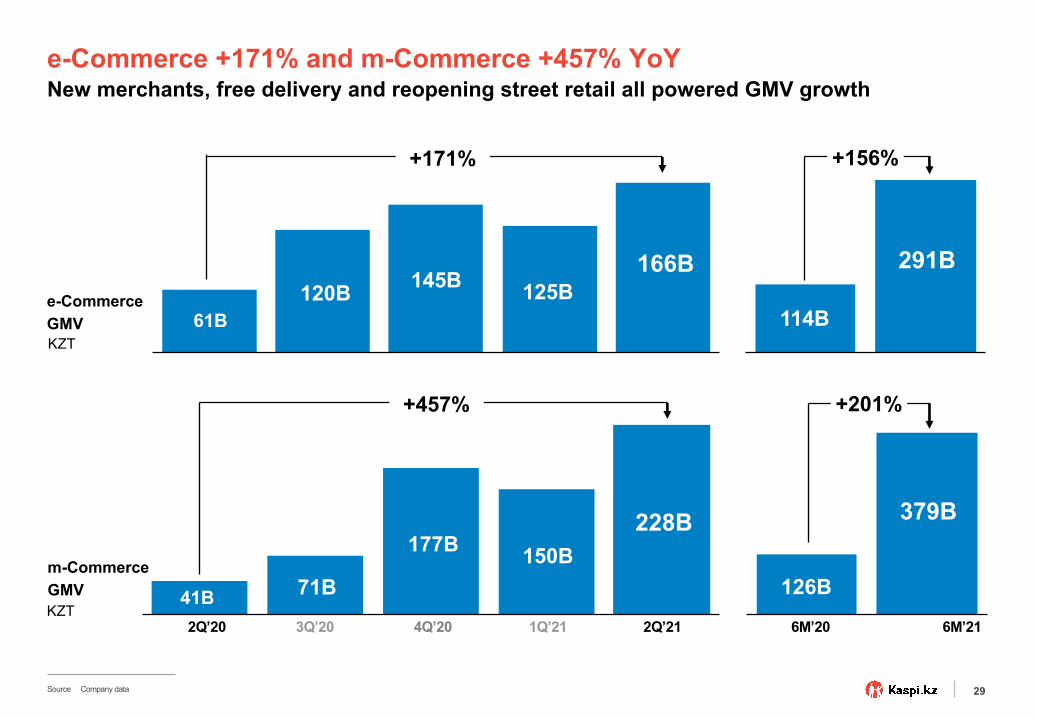
e-Commerce +171% and m-Commerce +457% YoYNew merchants, free delivery and reopening street retail all powered GMV growth
KZT
KZT
m-CommerceGMV
e-CommerceGMV
Source Company data
125B61B
120B 145B166B
+171%
41B2Q’20 3Q’20
71B
177B
4Q’20
150B
1Q’21
228B
2Q’21
+457%
114B
291B
+156%
379B
126B
6M’20 6M’21
+201%
30
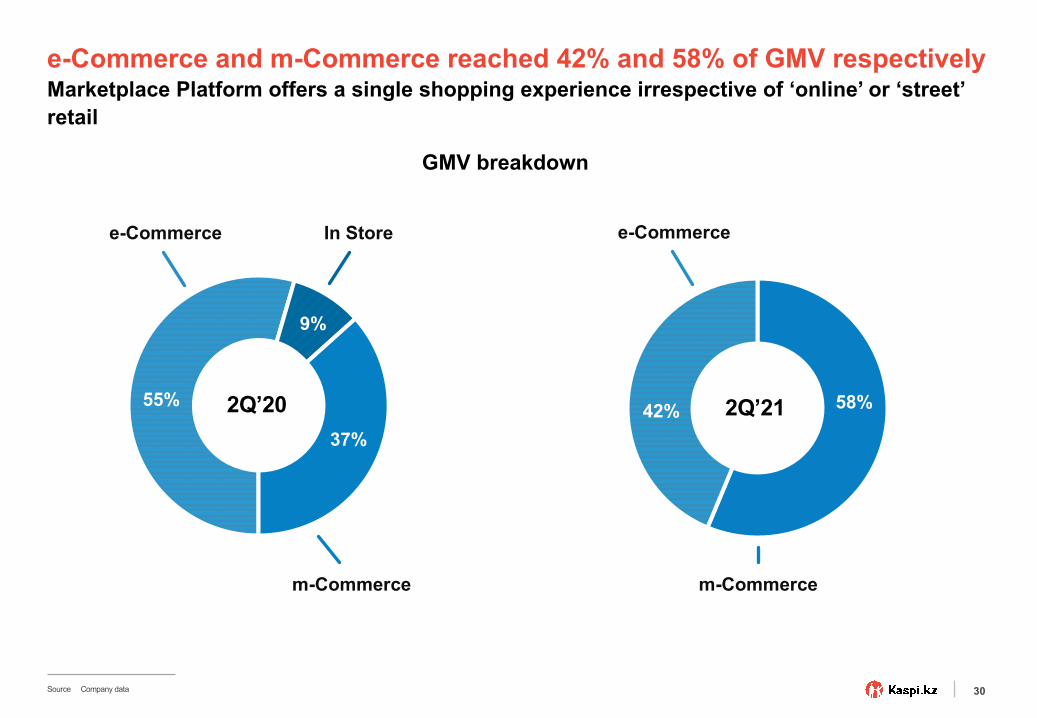
58%42%
e-Commerce and m-Commerce reached 42% and 58% of GMV respectivelyMarketplace Platform offers a single shopping experience irrespective of ‘online’ or ‘street’ retail
Source Company data
55%
9%
e-Commerce In Store
m-Commerce
37%
2Q’20 2Q’21
e-Commerce
m-Commerce
GMV breakdown
31
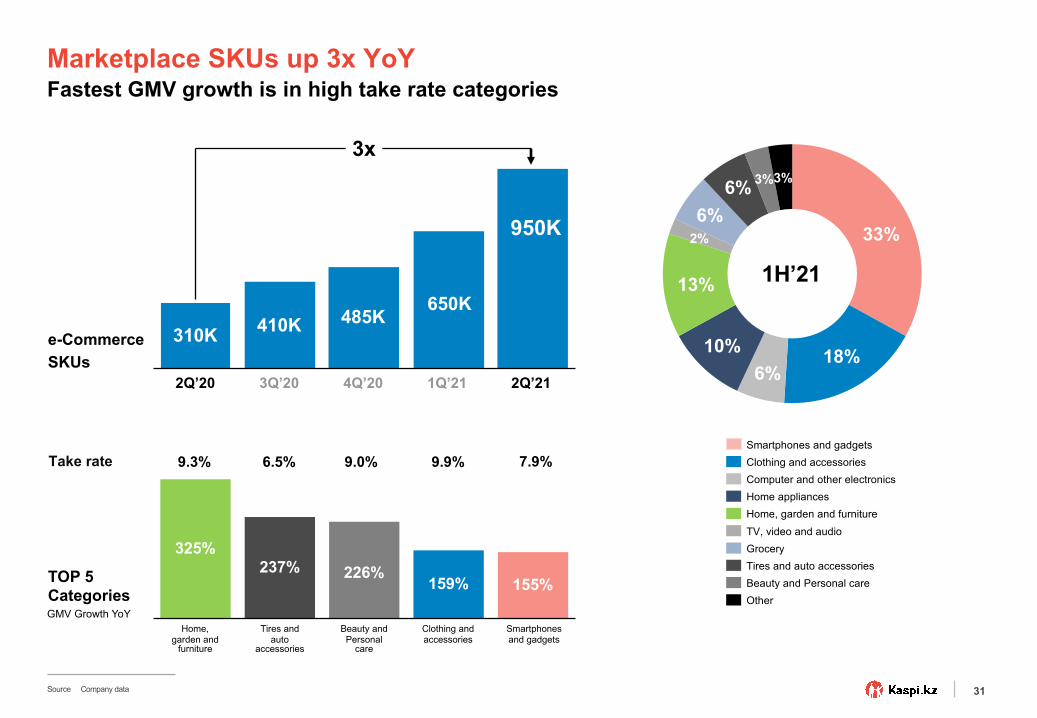
33%
18%6%
10%
13%
6%
6%
2%
3%3%
1H’21
325%
Smartphones and gadgets
Home, garden and
furniture
Clothing and accessories
237%155%
Tires and auto
accessories
Beauty and Personal
care
226%159%
Smartphones and gadgetsClothing and accessoriesComputer and other electronicsHome appliancesHome, garden and furnitureTV, video and audioGroceryTires and auto accessoriesBeauty and Personal careOther
1Q’214Q’20
410K
2Q’20
310K
3Q’20
485K650K
950K
2Q’21
3x
Take rate 9.3% 6.5% 9.0% 9.9% 7.9%
e-Commerce
SKUs
TOP 5 Categories
Marketplace SKUs up 3x YoYFastest GMV growth is in high take rate categories
GMV Growth YoY
Source Company data
32
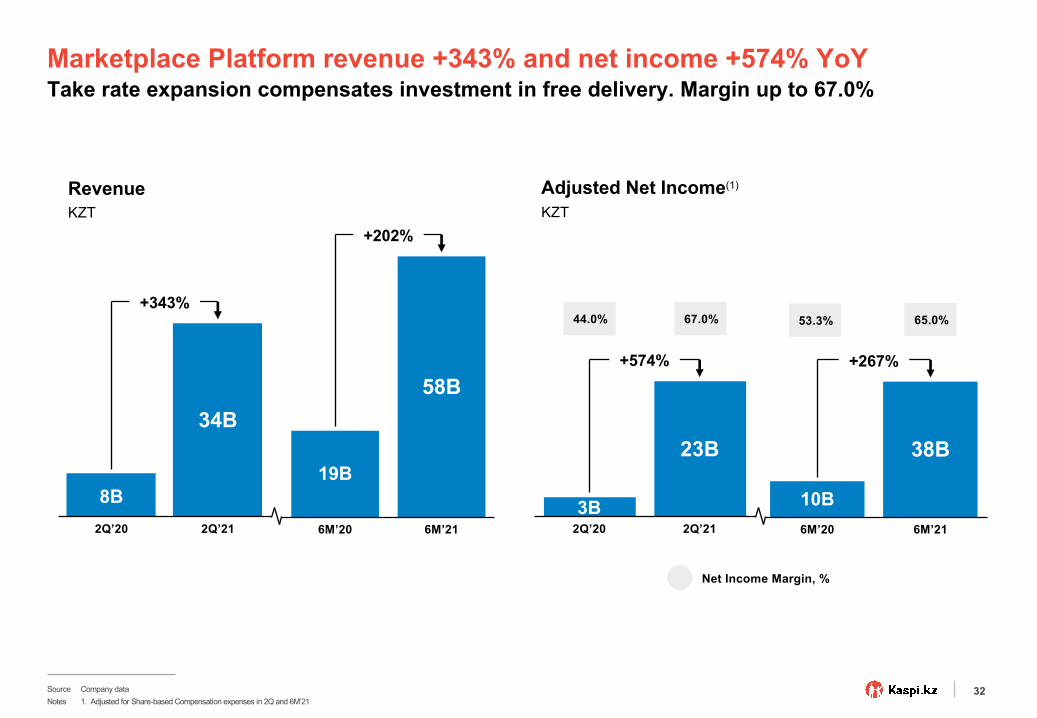
$255MM
38B
6M’20
10B6M’21
+267%
65.0%53.3%
Marketplace Platform revenue +343% and net income +574% YoYTake rate expansion compensates investment in free delivery. Margin up to 67.0%
Net Income Margin, %
Source Company dataNotes 1. Adjusted for Share-based Compensation expenses in 2Q and 6M’21
$741MM
34B
8B
2Q’20 2Q’21
+343%
3B2Q’20
23B
2Q’21
+574%
67.0%44.0%
RevenueKZT
Adjusted Net Income(1)
KZT
19B
6M’20
58B
6M’21
+202%

33
Fintech Platform
34
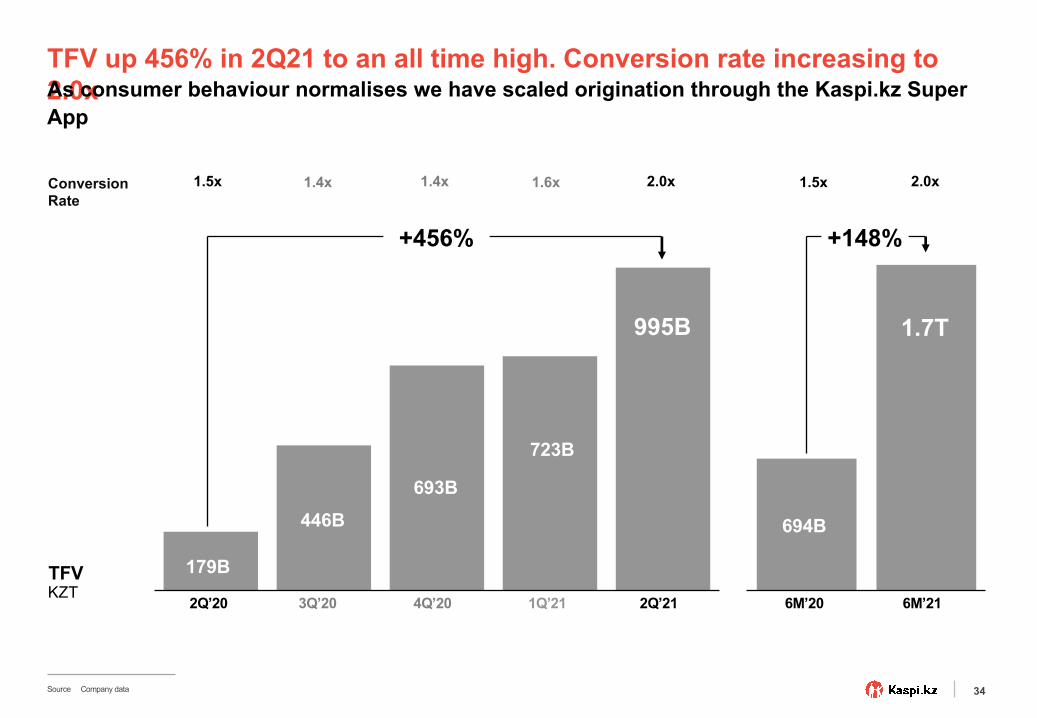
TFV up 456% in 2Q21 to an all time high. Conversion rate increasing to 2.0xAs consumer behaviour normalises we have scaled origination through the Kaspi.kz Super App
KZTTFV
ConversionRate
1.5x 1.4x 1.4x 1.6x
Source Company data
179B
693B446B
723B
995B
+456%
1.7T
694B
6M’20 6M’21
+148%
2.0x 1.5x 2.0x
1Q’213Q’202Q’20 4Q’20 2Q’21
35
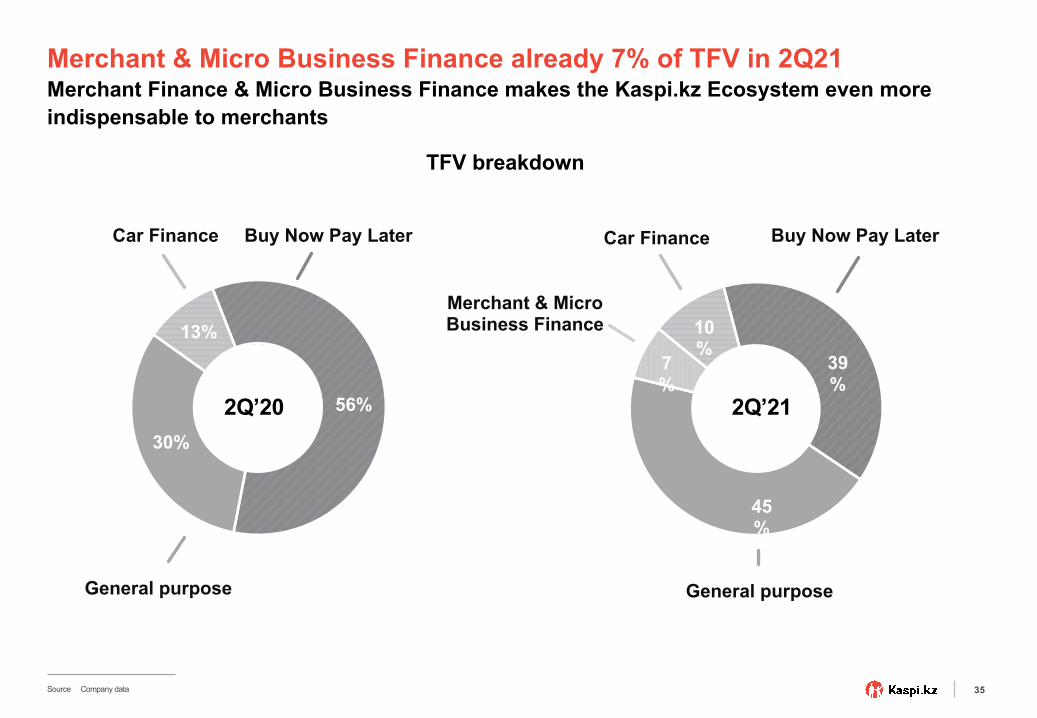
Merchant & Micro Business Finance already 7% of TFV in 2Q21Merchant Finance & Micro Business Finance makes the Kaspi.kz Ecosystem even more indispensable to merchants
Car Finance Buy Now Pay Later
General purpose
13%
30%
56%2Q’20
Source Company data
Car Finance Buy Now Pay Later
General purpose
2Q’21
Merchant & Micro Business Finance 10
%39%
45%
7%
TFV breakdown
36
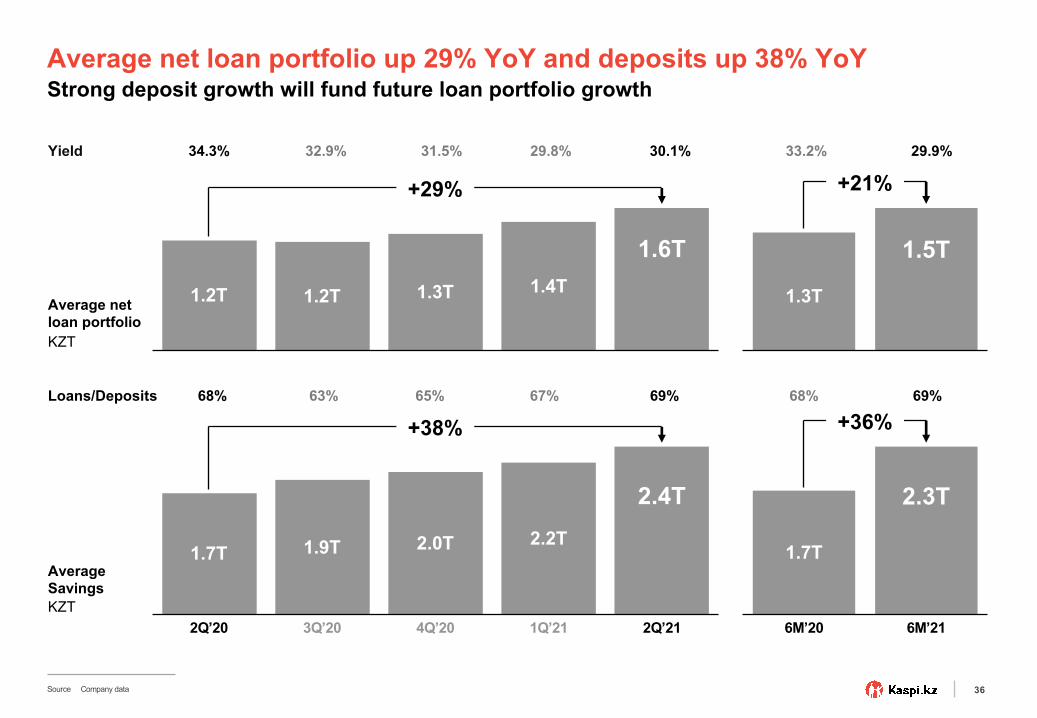
Average net loan portfolio up 29% YoY and deposits up 38% YoYStrong deposit growth will fund future loan portfolio growth
Average net loan portfolio
Average SavingsKZT
KZT
Loans/Deposits
Yield 34.3% 32.9% 31.5% 29.8%
68% 63% 65% 67%
Source Company data
1.2T1.2T 1.3T 1.4T
1.6T
+29%
4Q’20
1.7T
1Q’212Q’20
2.2T2.0T1.9T
3Q’20
2.4T
2Q’21
+38%
1.5T
1.3T
+21%
6M’21
1.7T
6M’20
2.3T
+36%69%68%
29.9%33.2%30.1%
69%
37
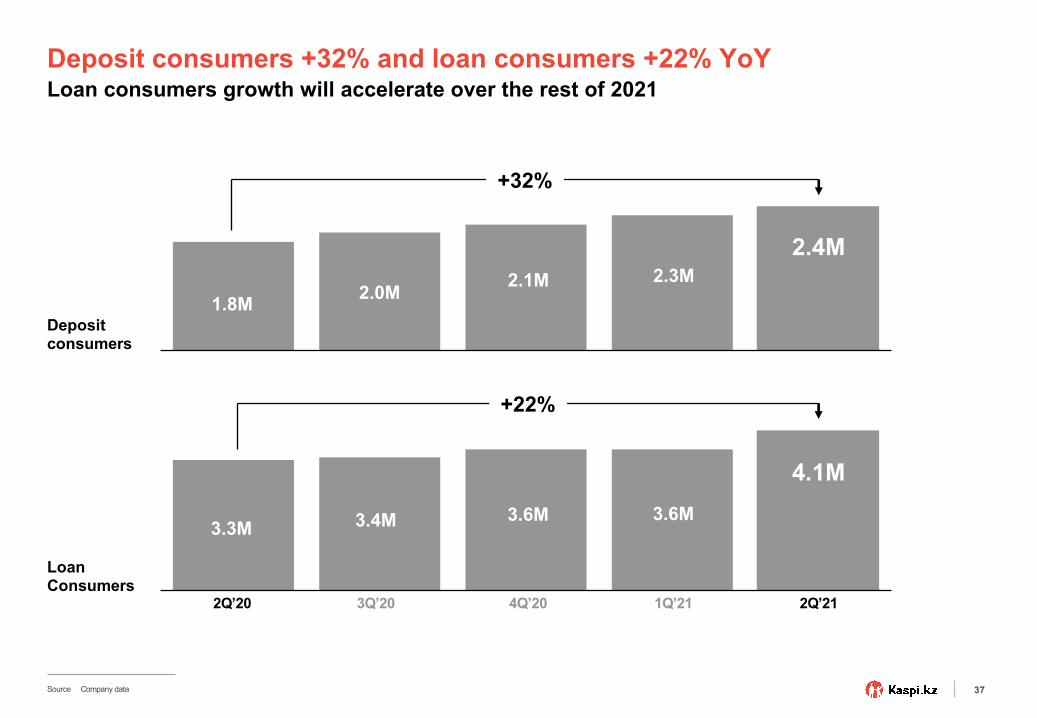
Deposit consumers +32% and loan consumers +22% YoY
Deposit consumers
Loan Consumers
Loan consumers growth will accelerate over the rest of 2021
Source Company data
2.3M1.8M 2.0M 2.1M
2.4M
+32%
3.6M
2Q’20 1Q’21
3.3M 3.4M
3Q’20
4.1M
4Q’20
3.6M
2Q’21
+22%
38
$255MM
81B
6M’20 6M’21
91B
+11%
36.4%35.2%
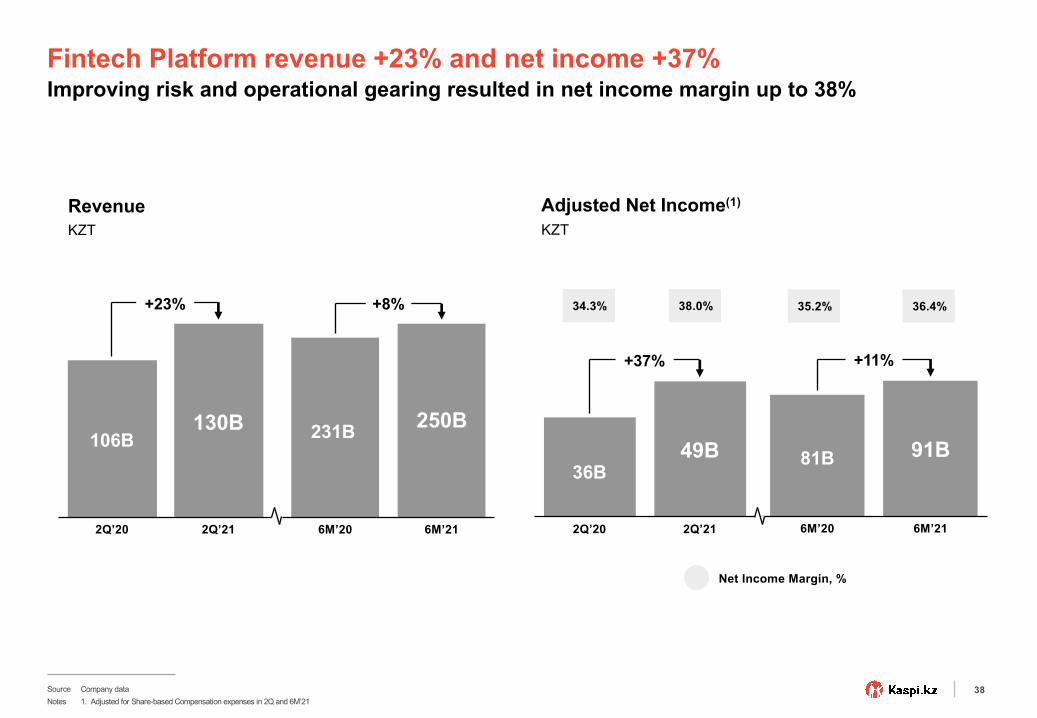
Fintech Platform revenue +23% and net income +37% Improving risk and operational gearing resulted in net income margin up to 38%
Source Company dataNotes 1. Adjusted for Share-based Compensation expenses in 2Q and 6M’21
$741MM
2Q’20
106B130B
2Q’21
+23%
$286MM
$741MM
36B
2Q’20
49B
2Q’21
+37%
38.0%34.3%
Net Income Margin, %
RevenueKZT
Adjusted Net Income(1)
KZT
6M’21
231B
6M’20
250B
+8%
39
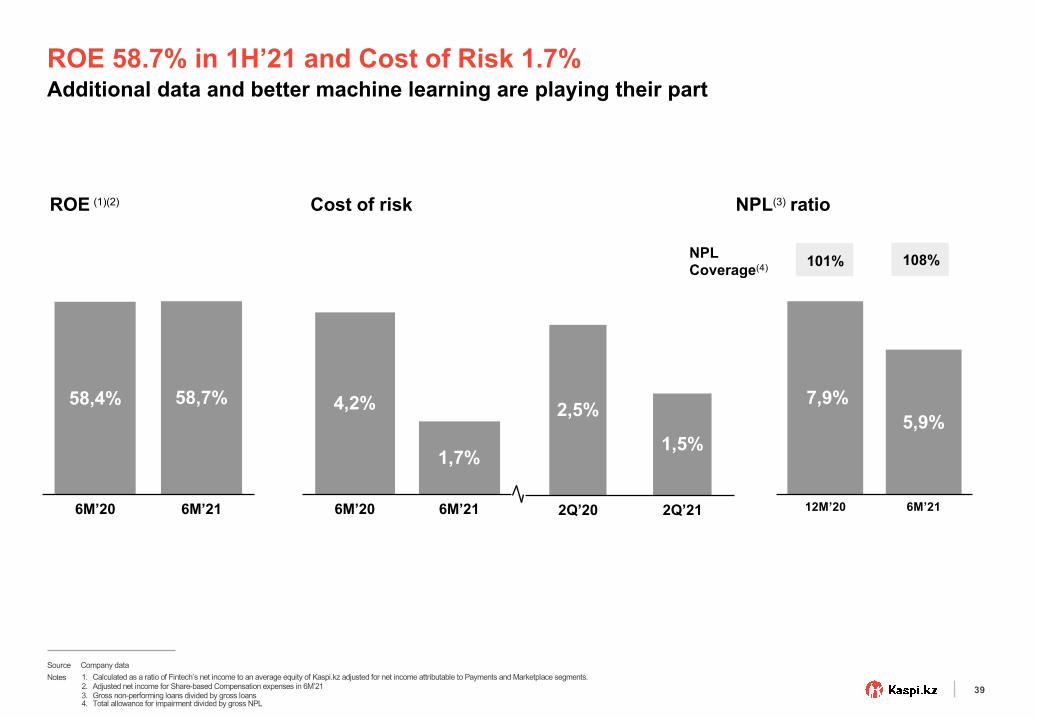
ROE 58.7% in 1H’21 and Cost of Risk 1.7%Additional data and better machine learning are playing their part
Cost of risk
$286MM
$255MM
$741MM
8,6%9,0%
7,9%7,3%
ROE (1)(2) NPL(3) ratio
NPL Coverage(4)
108%101%
$286MM
$255MM
$741MM
4,2%
6M’20 6M’21
1,7%
58,4%
6M’20
58,7%
6M’21
2,5%
2Q’20 2Q’21
1,5%
7,9%
12M’20
5,9%
6M’21
Source Company dataNotes 1. Calculated as a ratio of Fintech’s net income to an average equity of Kaspi.kz adjusted for net income attributable to Payments and Marketplace segments.
2. Adjusted net income for Share-based Compensation expenses in 6M’213. Gross non-performing loans divided by gross loans4. Total allowance for impairment divided by gross NPL
40
4.55 4.55
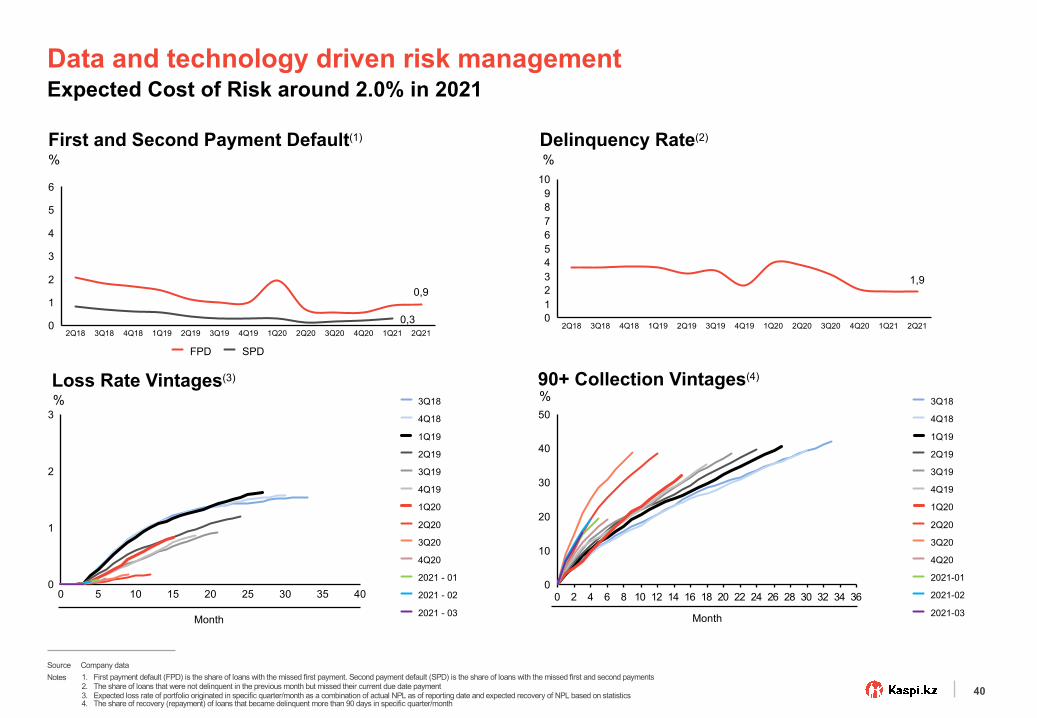
Delinquency Rate(2)First and Second Payment Default(1)
%%
90+ Collection Vintages(4)Loss Rate Vintages(3)
%%
MonthMonth
6
5
3
0
4
1
2
4Q182Q18 3Q18 1Q19 2Q19 3Q190,3
4Q19 1Q20 2Q20 3Q20 4Q20 1Q21
0,9
2Q21
FPD SPD
3025200
0 5 10 4015 35
1
2
33Q18
4Q18
1Q19
2Q19
2Q20
3Q19
2021 - 01
4Q19
1Q20
3Q20
4Q20
2021 - 02
2021 - 030 2 4 6 8 10 12 14 16 18 20 22 24 26 28 30 32 34 36
20
0
40
10
30
50
2Q19
3Q18
4Q18
1Q19
4Q20
3Q20
3Q19
1Q20
4Q19
2Q20
2021-01
2021-02
2021-03
2
7
0
6
1
543
89
10
1Q202Q18 3Q18 4Q18 1Q19 2Q19 3Q19 4Q19 2Q20 3Q20 4Q20 1Q21
1,9
2Q21
Data and technology driven risk managementExpected Cost of Risk around 2.0% in 2021
Source Company dataNotes 1. First payment default (FPD) is the share of loans with the missed first payment. Second payment default (SPD) is the share of loans with the missed first and second payments
2. The share of loans that were not delinquent in the previous month but missed their current due date payment3. Expected loss rate of portfolio originated in specific quarter/month as a combination of actual NPL as of reporting date and expected recovery of NPL based on statistics4. The share of recovery (repayment) of loans that became delinquent more than 90 days in specific quarter/month

41
4.55 4.55
Consolidated financials & Guidance
42
4.55 4.55
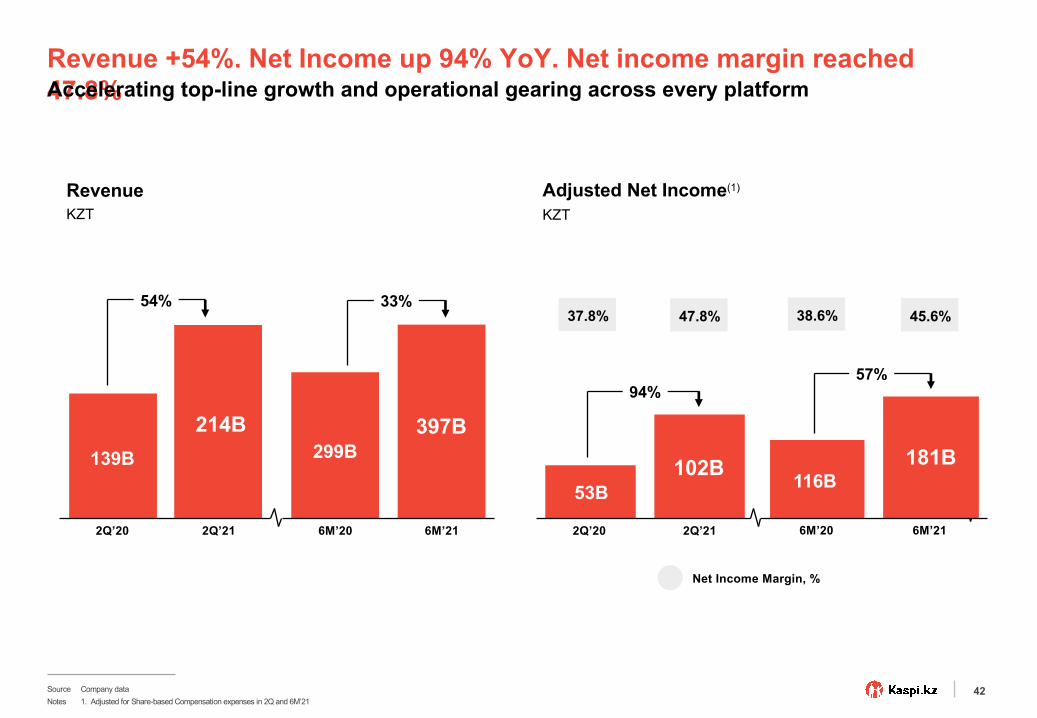
139B
214B
54%
2Q’20 2Q’21
299B397B
33%
6M’20 6M’21
181B116B
57%
38.6% 45.6%
6M’20 6M’21
Revenue +54%. Net Income up 94% YoY. Net income margin reached 47.8%Accelerating top-line growth and operational gearing across every platform
Source Company dataNotes 1. Adjusted for Share-based Compensation expenses in 2Q and 6M’21
Net Income Margin, %
RevenueKZT
Adjusted Net Income(1)
KZT
$286MM
$741MM
102B53B
94%
37.8% 47.8%
2Q’20 2Q’21
43
4.55 4.55
RTPV
TFV
Average Balances on Current Accounts
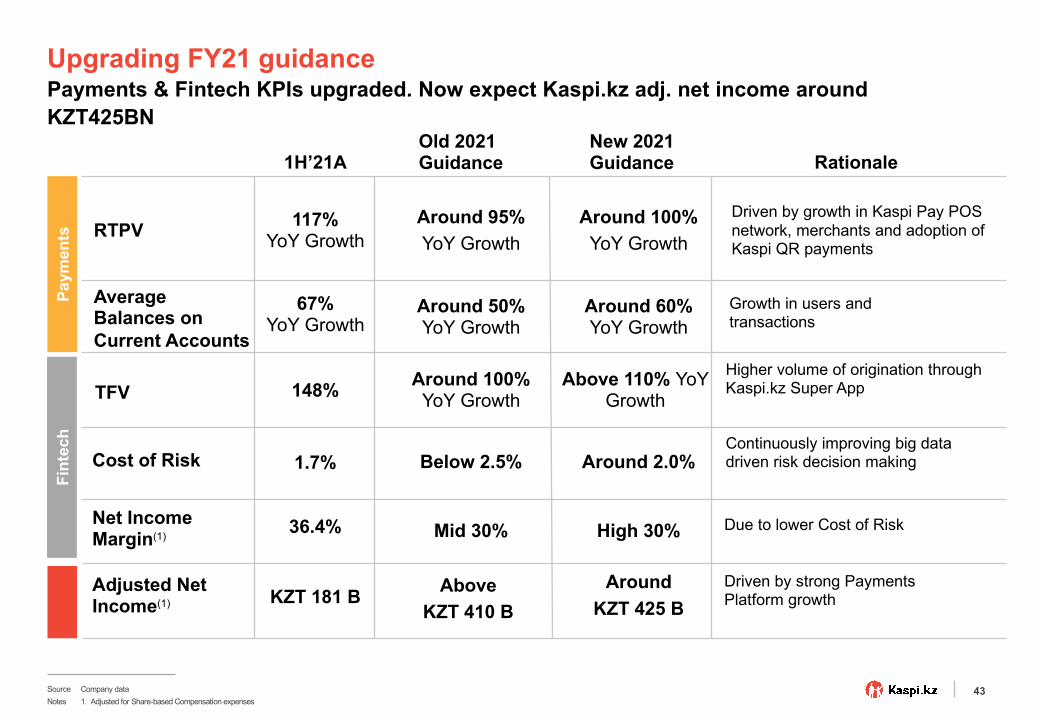
Upgrading FY21 guidancePayments & Fintech KPIs upgraded. Now expect Kaspi.kz adj. net income around KZT425BN
Pay
men
ts
Fint
ech
Adjusted Net Income(1)
Old 2021Guidance
Cost of Risk
New 2021 Guidance
Around 50% YoY Growth
Below 2.5%
Around 95%YoY Growth
Around 100% YoY Growth
Above KZT 410 B
1H’21A
117%YoY Growth
148%
1.7%
67% YoY Growth
KZT 181 B
Rationale
Driven by growth in Kaspi Pay POS network, merchants and adoption of Kaspi QR payments
Growth in users and transactions
Higher volume of origination through Kaspi.kz Super App
Driven by strong Payments Platform growth
Source Company data
Notes 1. Adjusted for Share-based Compensation expenses
Around 60% YoY Growth
Around 2.0%
Around 100%YoY Growth
Around KZT 425 B
Above 110% YoY Growth
Net Income Margin(1) Mid 30%36.4% High 30%
Continuously improving big data driven risk decision making
Due to lower Cost of Risk
44
4.55 4.55
RTPV
Net Income Margin(1)
Net Income Margin(1)
Net Income Margin(1)
GMV
TFV
Take Rate
Take Rate
Conversion Rate
Yield
Average Balances on Current Accounts
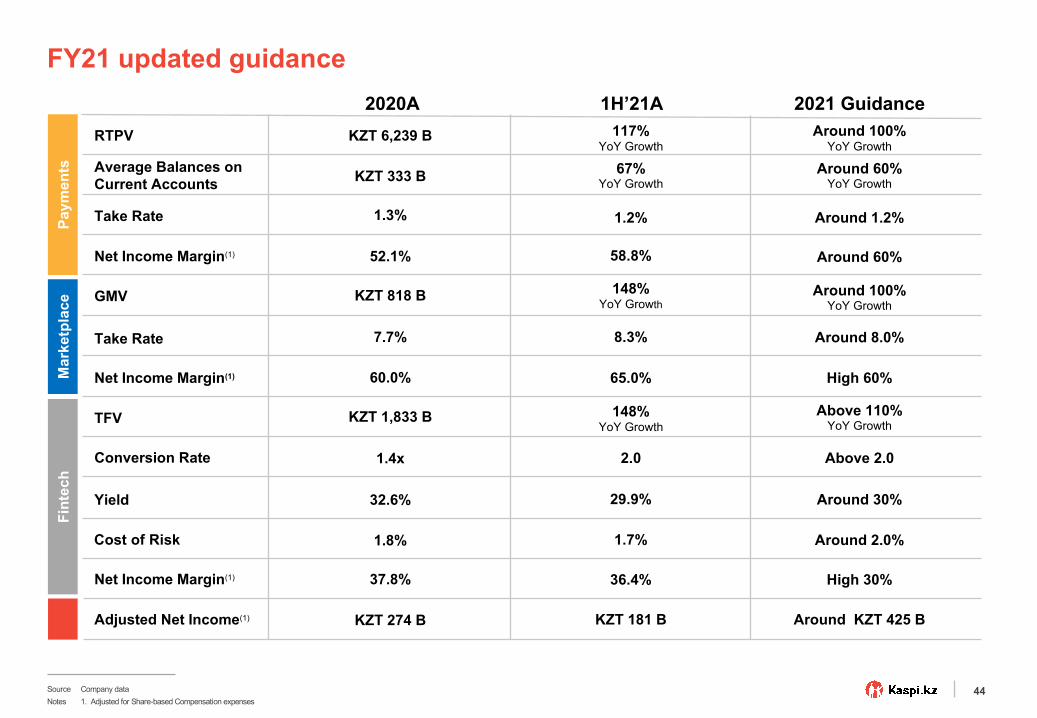
FY21 updated guidanceM
arke
tpla
cePa
ymen
ts
Fint
ech
Adjusted Net Income(1)
2021 Guidance2020AKZT 6,239 B
52.1%
1.3%
KZT 333 B
KZT 818 B
60.0%
1.8%
KZT 1,833 B
7.7%
1.4x
32.6%
37.8%
KZT 274 B
Cost of Risk
Around 100% YoY Growth
Around 60%
High 60%
Around 2.0%
Around 100% YoY Growth
Around 1.2%
Around 8.0%
Above 2.0
Around 30%
Around 60% YoY Growth
Above 110% YoY Growth
High 30%
Around KZT 425 B
1H’21A117%
YoY Growth
58.8%
65.0%
1.7%
148% YoY Growth
1.2%
8.3%
2.0
29.9%
67% YoY Growth
148% YoY Growth
36.4%
KZT 181 B
Source Company dataNotes 1. Adjusted for Share-based Compensation expenses
45
Q&A

46
Appendix
47
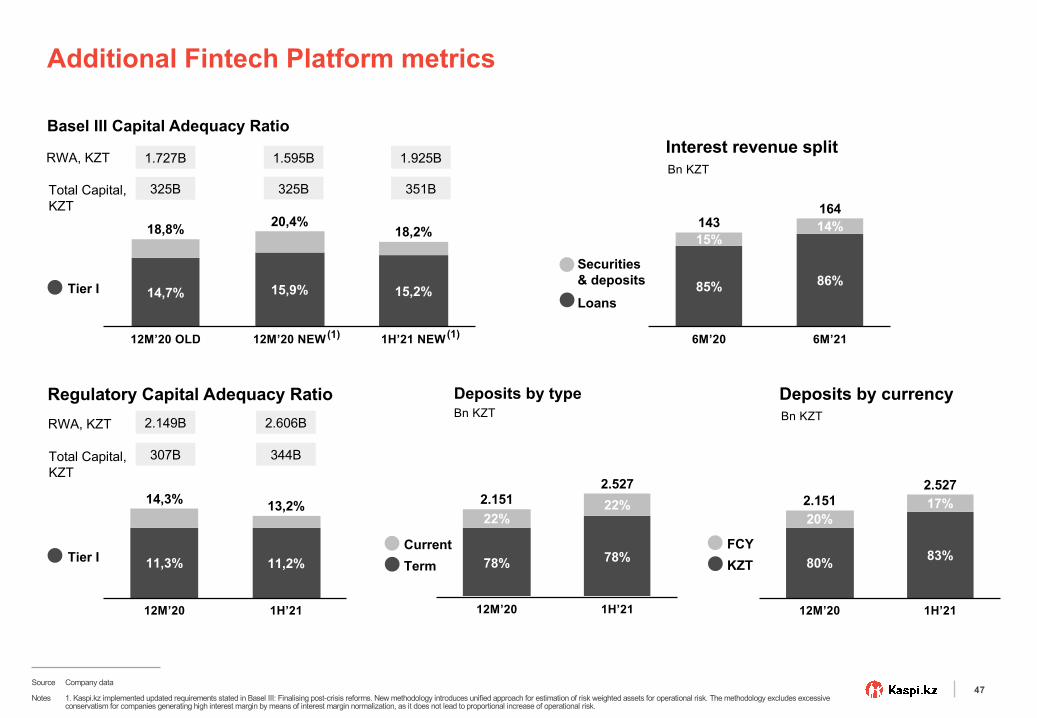
Additional Fintech Platform metrics
(1)
Basel III Capital Adequacy Ratio
Deposits by type
RWA, KZT
Total Capital, KZT
Regulatory Capital Adequacy RatioRWA, KZT
Total Capital, KZT
Tier I
Bn KZT Bn KZT
Deposits by currency
TermCurrent
KZTFCY
Tier I
1.727B
325B
1.925B
351B
2.149B
307B
2.606B
344B
Source Company data
12M’20 OLD
14,7% 15,2%
18,2%
15,9%
1H’21 NEW12M’20 NEW
18,8% 20,4%
11,3%
1H’21
11,2%
12M’20
14,3% 13,2%
1H’21
22%
78%
12M’20
22%2.151
78%
2.527
1H’21
83%
20%
80%
17%
12M’20
2.1512.527
1.595B
325B
14315%
85%
6M’20
86%
14%
6M’21
164
Bn KZT
Interest revenue split
Loans
Securities& deposits
(1)
Notes 1. Kaspi.kz implemented updated requirements stated in Basel III: Finalising post-crisis reforms. New methodology introduces unified approach for estimation of risk weighted assets for operational risk. The methodology excludes excessive conservatism for companies generating high interest margin by means of interest margin normalization, as it does not lead to proportional increase of operational risk.

48
6M 2020, KZT MM 6M 2021, KZT MM 6M 2021 ADJUSTED, KZT MM 2Q 2020, KZT MM 2Q 2021, KZT MM 2Q 2021 ADJUSTED, KZT MM
Revenue48,594 89,686 89,686 25,819 49,586 49,586
growth, %- - 84.6% - - 92.1%
Transaction & Membership Revenue 34,880 67,872 67,872 17,853 38,082 38,082
Interest Revenue 13,714 21,814 21,814 7,966 11,504 11,504
Cost of revenue(9,021) (9,168) (9,168) (4,410) (5,027) (5,027)
growth, % - - 1.6% - - 14.0%
% of revenue18.6% 10.2% 10.2% 17.1% 10.1% 10.1%
Transaction Expenses (5,709) (6,387) (6,387) (2,760) (3,625) (3,625)
Operating Expenses (3,312) (2,781) (2,781) (1,650) (1,402) (1,402)
Total net revenue39,573 80,518 80,518 21,409 44,559 44,559
growth, % - - 103.5% - - 108.1%
margin, %81.4% 89.8% 89.8% 82.9% 89.9% 89.9%
Technology & product development (4,381) (7,520) (6,082) (2,336) (3,958) (3,226)
Sales and marketing (5,770) (10,593) (10,593) (3,009) (4,959) (4,959)
General and administrative expenses (735) (1,291) (790) (373) (644) (392)
Operating income28,687 61,114 63,053 15,691 34,998 35,982
growth, %- - 119.8% - - 129.3%
margin, % 59.0% 68.1% 70.3% 60.8% 70.6% 72.6%
Income tax (4,802) (10,189) (10,327) (2,613) (6,029) (6,101)
Net income23,885 50,925 52,726 13,078 28,969 29,881
growth, %- - 120.7% - - 128.5%
margin, % 49.2% 56.8% 58.8% 50.7% 58.4% 60.3%
Payments Income Statement(1)
1. Adjusted for LTIP expenses booked in 1H’21

49
6M 2020, KZT MM 6M 2021, KZT MM 6M 2021 ADJUSTED, KZT MM 2Q 2020, KZT MM 2Q 2021, KZT MM 2Q 2021 ADJUSTED, KZT MM
Revenue19,151 57,743 57,743 7,782 34,454 34,454
growth, %- - 201.5% - - 342.7%
Seller fees 18,137 56,207 56,207 7,052 33,555 33,555 Other gains and losses 1,014 1,536 1,536 730 899 899
Cost of revenue(1,714) (4,012) (4,012) (1,140) (2,170) (2,170)
growth, %- - 134.1% - - 90.4%
% of revenue8.9% 6.9% 6.9% 14.6% 6.3% 6.3%
Transaction Expenses (80) (59) (59) (39) (24) (24)
Operating Expenses (1,634) (3,953) (3,953) (1,101) (2,146) (2,146)
Total net revenue17,437 53,731 53,731 6,642 32,284 32,284
growth, %- - 208.1% - - 386.1%
margin, %91.1% 93.1% 93.1% 85.4% 93.7% 93.7%
Technology & product development (1,980) (4,285) (3,534) (1,007) (2,293) (1,908)
Sales and marketing (2,910) (4,737) (4,737) (1,404) (2,284) (2,284)
General and administrative expenses (300) (387) (380) (151) (197) (197)
Operating income12,247 44,322 45,080 4,080 27,510 27,895
growth, %- - 268.1% - - 583.7%
margin, %63.9% 76.8% 78.1% 52.4% 79.8% 81.0%
Income tax (2,034) (7,491) (7,557) (655) (4,792) (4,827)
Net income10,213 36,831 37,523 3,425 22,718 23,068
growth, %- - 267.4% - - 573.5%
margin, %53.3% 63.8% 65.0% 44.0% 65.9% 67.0%
Marketplace Income Statement(1)
1. Adjusted for LTIP expenses booked in 1H’21
50
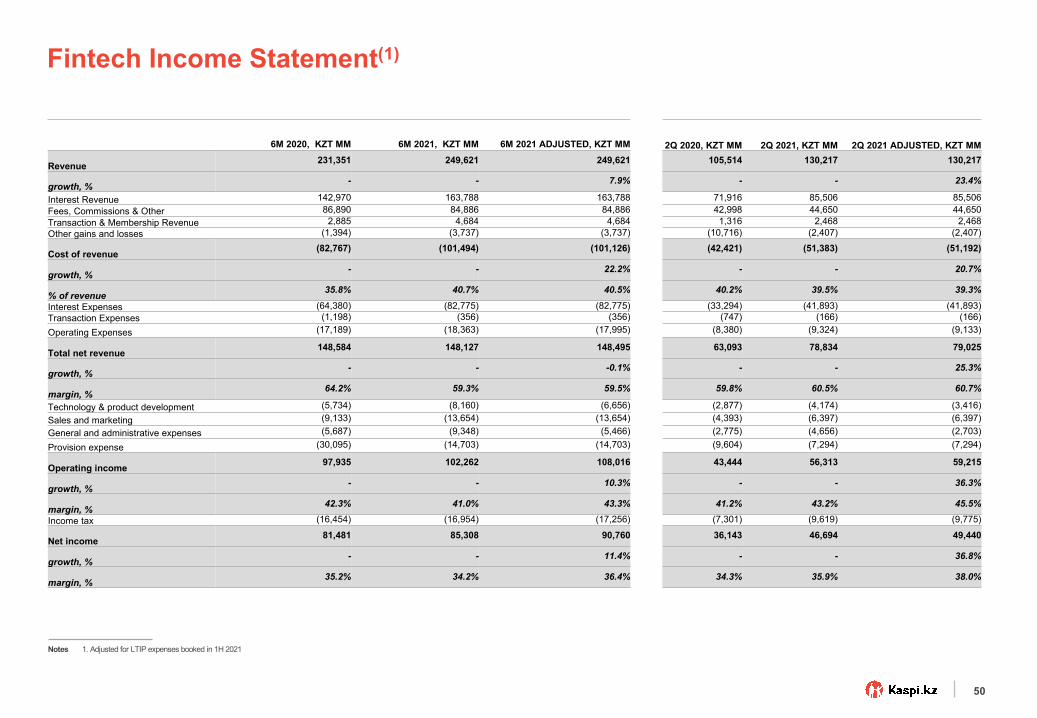
6M 2020, KZT MM 6M 2021, KZT MM 6M 2021 ADJUSTED, KZT MM 2Q 2020, KZT MM 2Q 2021, KZT MM 2Q 2021 ADJUSTED, KZT MM
Revenue231,351 249,621 249,621 105,514 130,217 130,217
growth, % - - 7.9% - - 23.4%
Interest Revenue 142,970 163,788 163,788 71,916 85,506 85,506 Fees, Commissions & Other 86,890 84,886 84,886 42,998 44,650 44,650 Transaction & Membership Revenue 2,885 4,684 4,684 1,316 2,468 2,468 Other gains and losses (1,394) (3,737) (3,737) (10,716) (2,407) (2,407)
Cost of revenue(82,767) (101,494) (101,126) (42,421) (51,383) (51,192)
growth, % - - 22.2% - - 20.7%
% of revenue 35.8% 40.7% 40.5% 40.2% 39.5% 39.3%
Interest Expenses (64,380) (82,775) (82,775) (33,294) (41,893) (41,893)Transaction Expenses (1,198) (356) (356) (747) (166) (166)Operating Expenses (17,189) (18,363) (17,995) (8,380) (9,324) (9,133)
Total net revenue148,584 148,127 148,495 63,093 78,834 79,025
growth, % - - -0.1% - - 25.3%
margin, % 64.2% 59.3% 59.5% 59.8% 60.5% 60.7%
Technology & product development (5,734) (8,160) (6,656) (2,877) (4,174) (3,416)Sales and marketing (9,133) (13,654) (13,654) (4,393) (6,397) (6,397)General and administrative expenses (5,687) (9,348) (5,466) (2,775) (4,656) (2,703)
Provision expense (30,095) (14,703) (14,703) (9,604) (7,294) (7,294)
Operating income97,935 102,262 108,016 43,444 56,313 59,215
growth, % - - 10.3% - - 36.3%
margin, % 42.3% 41.0% 43.3% 41.2% 43.2% 45.5%
Income tax (16,454) (16,954) (17,256) (7,301) (9,619) (9,775)
Net income81,481 85,308 90,760 36,143 46,694 49,440
growth, % - - 11.4% - - 36.8%
margin, % 35.2% 34.2% 36.4% 34.3% 35.9% 38.0%
Fintech Income Statement(1)
Notes 1. Adjusted for LTIP expenses booked in 1H 2021
51
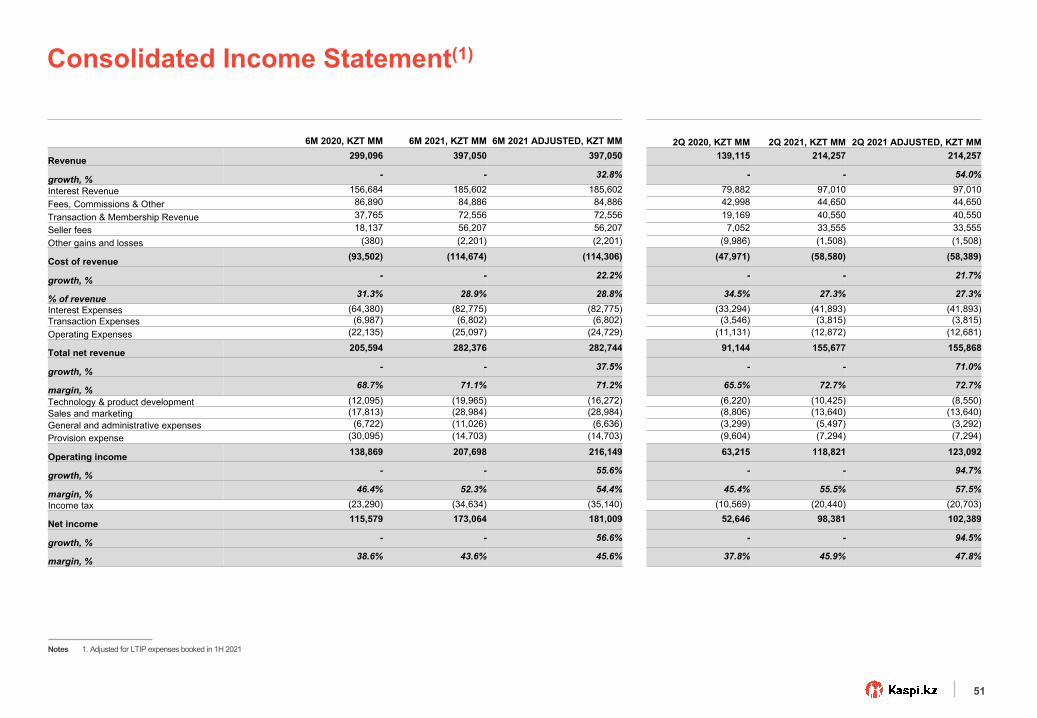
6M 2020, KZT MM 6M 2021, KZT MM 6M 2021 ADJUSTED, KZT MM 2Q 2020, KZT MM 2Q 2021, KZT MM 2Q 2021 ADJUSTED, KZT MM
Revenue 299,096 397,050 397,050 139,115 214,257 214,257
growth, % - - 32.8% - - 54.0%
Interest Revenue 156,684 185,602 185,602 79,882 97,010 97,010 Fees, Commissions & Other 86,890 84,886 84,886 42,998 44,650 44,650 Transaction & Membership Revenue 37,765 72,556 72,556 19,169 40,550 40,550 Seller fees 18,137 56,207 56,207 7,052 33,555 33,555 Other gains and losses (380) (2,201) (2,201) (9,986) (1,508) (1,508)
Cost of revenue (93,502) (114,674) (114,306) (47,971) (58,580) (58,389)
growth, % - - 22.2% - - 21.7%
% of revenue 31.3% 28.9% 28.8% 34.5% 27.3% 27.3%
Interest Expenses (64,380) (82,775) (82,775) (33,294) (41,893) (41,893)Transaction Expenses (6,987) (6,802) (6,802) (3,546) (3,815) (3,815)Operating Expenses (22,135) (25,097) (24,729) (11,131) (12,872) (12,681)
Total net revenue 205,594 282,376 282,744 91,144 155,677 155,868
growth, % - - 37.5% - - 71.0%
margin, % 68.7% 71.1% 71.2% 65.5% 72.7% 72.7%
Technology & product development (12,095) (19,965) (16,272) (6,220) (10,425) (8,550)Sales and marketing (17,813) (28,984) (28,984) (8,806) (13,640) (13,640)General and administrative expenses (6,722) (11,026) (6,636) (3,299) (5,497) (3,292)Provision expense (30,095) (14,703) (14,703) (9,604) (7,294) (7,294)
Operating income 138,869 207,698 216,149 63,215 118,821 123,092
growth, % - - 55.6% - - 94.7%
margin, % 46.4% 52.3% 54.4% 45.4% 55.5% 57.5%
Income tax (23,290) (34,634) (35,140) (10,569) (20,440) (20,703)
Net income 115,579 173,064 181,009 52,646 98,381 102,389
growth, % - - 56.6% - - 94.5%
margin, % 38.6% 43.6% 45.6% 37.8% 45.9% 47.8%
Consolidated Income Statement(1)
Notes 1. Adjusted for LTIP expenses booked in 1H 2021
52
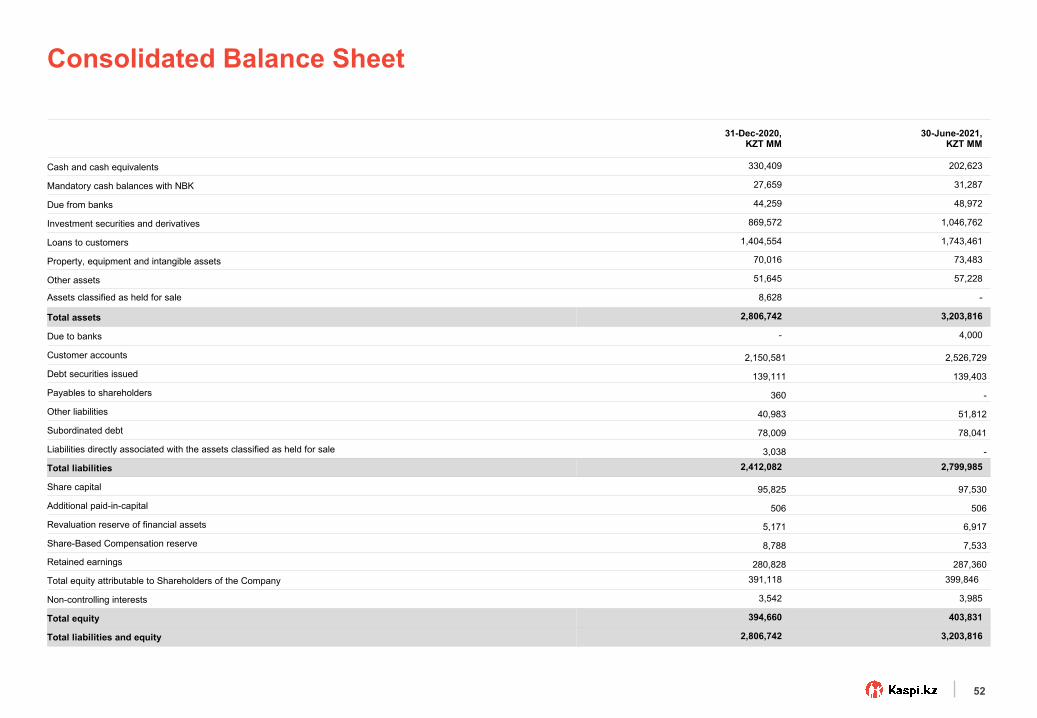
Consolidated Balance Sheet
31-Dec-2020, KZT MM
30-June-2021, KZT MM
Cash and cash equivalents 330,409 202,623
Mandatory cash balances with NBK 27,659 31,287
Due from banks 44,259 48,972
Investment securities and derivatives 869,572 1,046,762
Loans to customers 1,404,554 1,743,461
Property, equipment and intangible assets 70,016 73,483
Other assets 51,645 57,228
Assets classified as held for sale 8,628 -
Total assets 2,806,742 3,203,816
Due to banks - 4,000
Customer accounts 2,150,581 2,526,729
Debt securities issued 139,111 139,403
Payables to shareholders 360 -
Other liabilities 40,983 51,812
Subordinated debt 78,009 78,041
Liabilities directly associated with the assets classified as held for sale 3,038 -
Total liabilities 2,412,082 2,799,985
Share capital 95,825 97,530
Additional paid-in-capital 506 506
Revaluation reserve of financial assets 5,171 6,917
Share-Based Compensation reserve 8,788 7,533
Retained earnings 280,828 287,360
Total equity attributable to Shareholders of the Company 391,118 399,846
Non-controlling interests 3,542 3,985
Total equity 394,660 403,831
Total liabilities and equity 2,806,742 3,203,816
53
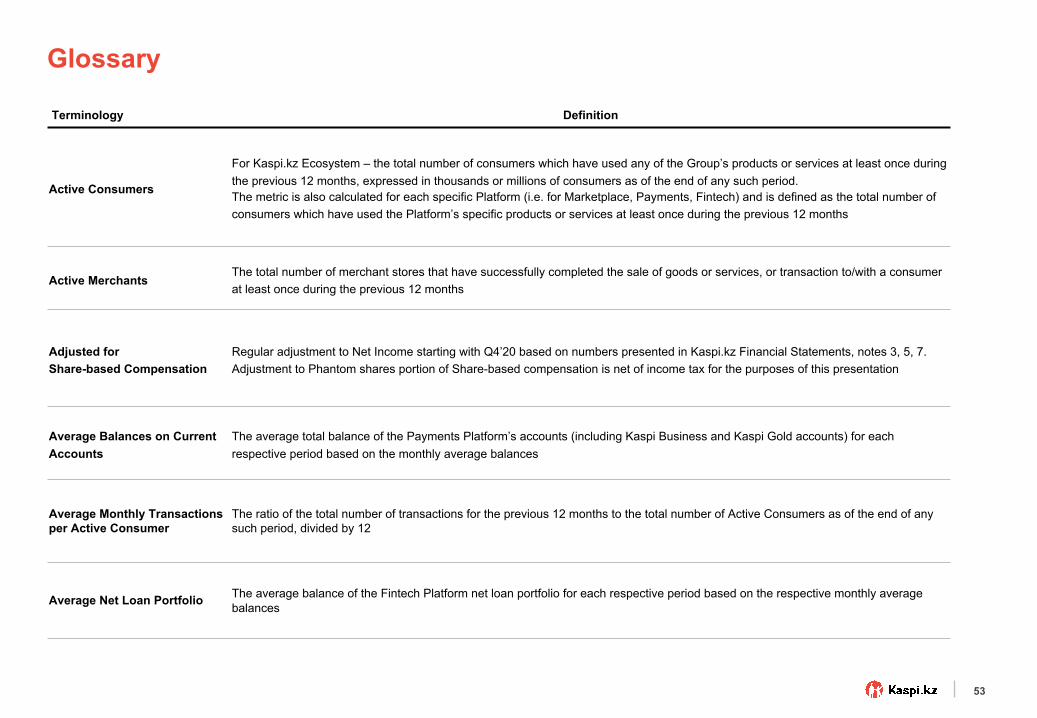
Terminology Definition
Active Consumers
For Kaspi.kz Ecosystem – the total number of consumers which have used any of the Group’s products or services at least once during the previous 12 months, expressed in thousands or millions of consumers as of the end of any such period.The metric is also calculated for each specific Platform (i.e. for Marketplace, Payments, Fintech) and is defined as the total number ofconsumers which have used the Platform’s specific products or services at least once during the previous 12 months
Active MerchantsThe total number of merchant stores that have successfully completed the sale of goods or services, or transaction to/with a consumer at least once during the previous 12 months
Adjusted for Share-based Compensation
Regular adjustment to Net Income starting with Q4’20 based on numbers presented in Kaspi.kz Financial Statements, notes 3, 5, 7. Adjustment to Phantom shares portion of Share-based compensation is net of income tax for the purposes of this presentation
Average Balances on Current Accounts
The average total balance of the Payments Platform’s accounts (including Kaspi Business and Kaspi Gold accounts) for each respective period based on the monthly average balances
Average Monthly Transactions per Active Consumer
The ratio of the total number of transactions for the previous 12 months to the total number of Active Consumers as of the end of any such period, divided by 12
Average Net Loan Portfolio The average balance of the Fintech Platform net loan portfolio for each respective period based on the respective monthly average balances
Glossary
54
Terminology Definition
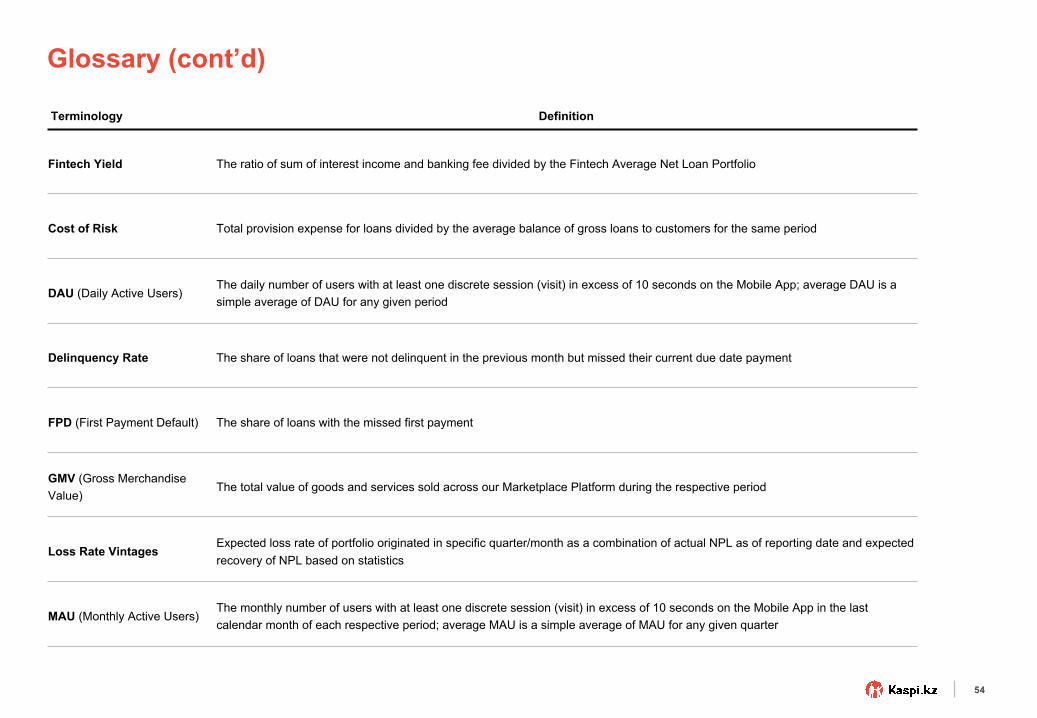
Fintech Yield The ratio of sum of interest income and banking fee divided by the Fintech Average Net Loan Portfolio
Cost of Risk Total provision expense for loans divided by the average balance of gross loans to customers for the same period
DAU (Daily Active Users)The daily number of users with at least one discrete session (visit) in excess of 10 seconds on the Mobile App; average DAU is asimple average of DAU for any given period
Delinquency Rate The share of loans that were not delinquent in the previous month but missed their current due date payment
FPD (First Payment Default) The share of loans with the missed first payment
GMV (Gross Merchandise Value)
The total value of goods and services sold across our Marketplace Platform during the respective period
Loss Rate VintagesExpected loss rate of portfolio originated in specific quarter/month as a combination of actual NPL as of reporting date and expected recovery of NPL based on statistics
MAU (Monthly Active Users)The monthly number of users with at least one discrete session (visit) in excess of 10 seconds on the Mobile App in the last calendar month of each respective period; average MAU is a simple average of MAU for any given quarter
Glossary (cont’d)
55
Terminology Definition
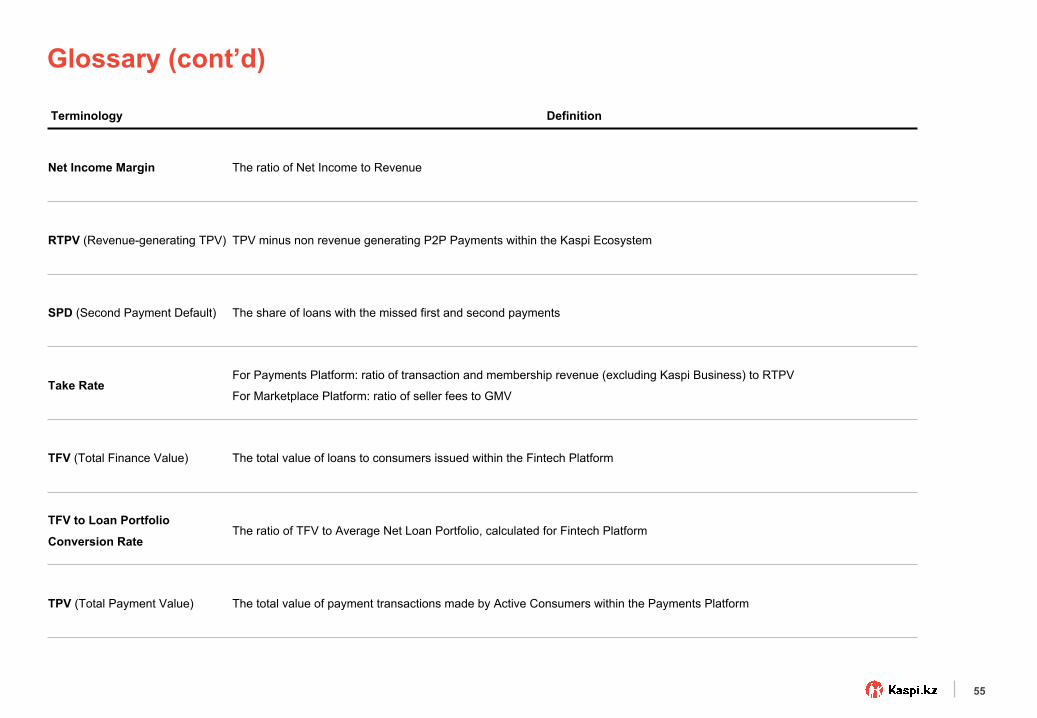
Net Income Margin The ratio of Net Income to Revenue
RTPV (Revenue-generating TPV) TPV minus non revenue generating P2P Payments within the Kaspi Ecosystem
SPD (Second Payment Default) The share of loans with the missed first and second payments
Take RateFor Payments Platform: ratio of transaction and membership revenue (excluding Kaspi Business) to RTPV
For Marketplace Platform: ratio of seller fees to GMV
TFV (Total Finance Value) The total value of loans to consumers issued within the Fintech Platform
TFV to Loan PortfolioConversion Rate
The ratio of TFV to Average Net Loan Portfolio, calculated for Fintech Platform
TPV (Total Payment Value) The total value of payment transactions made by Active Consumers within the Payments Platform
Glossary (cont’d)
56
Disclaimer
Forward-looking statements
Some of the information in this announcement may contain projections or other forward-looking statements regarding future events or
the future financial performance of Kaspi.kz. You can identify forward looking statements by terms such as "expect", "believe",
"anticipate", "estimate", "intend", "will", "could," "may" or "might", the negative of such terms or other similar expressions. Kaspi.kz
wish to caution you that these statements are only predictions and that actual events or results may differ materially. Kaspi.kz does
not intend to update these statements to reflect events and circumstances occurring after the date hereof or to reflect the occurrence
of unanticipated events. Many factors could cause the actual results to differ materially from those contained in projections or forward-
looking statements of Kaspi.kz, including, among others, general economic conditions, the competitive environment, risks associated
with operating in Kazakhstan, rapid technological and market change in the industries the Company operates in, as well as many
other risks specifically related to Kaspi.kz and its respective operations.