2q18 results - ir.suzano.com.brir.suzano.com.br/ptb/6947/636221.pdf · 2q18 results adjusted...
TRANSCRIPT

2Q18 Results
Adjusted EBITDA¹ in 2Q18 of R$1,449/ton, leading the industry
São Paulo, August 9, 2018. Suzano Papel e Celulose (B3: SUZB3), one of the largest integrated pulp and paper producers in Latin America, announces today its consolidated results for the second quarter of 2018 (2Q18).
MAIN HIGHLIGHTS
• Operating Cash Generation2 and Adjusted EBITDA² set new records in the quarter: R$1.28 billion and R$1.57 billion, respectively.
• Strong performance in the pulp segment, supported by the effect from exchange variation: adjusted EBITDA1/ton of R$1,646/ton (+59.4% on 2Q17).
• Marginal increase in cash cost in LTM: R$593/ton, 0.8% higher than in LTM to 2Q17.
• Solid results and new increases in paper prices in both the domestic and international markets: adjusted EBITDA1/ton of R$892/ton (+25.8% on 2Q17).
• Truck drivers' strike: production loss of approximately 80,000 tons of market pulp and of approximately 25,000 tons of paper in 2Q18, which adversely affected sales.
• Investments: conclusion of the acquisition of around 9,500 hectares in rural areas and 1,200,000 m³ of wood in São Paulo state from Duratex S.A.
• Transaction with Fibria: authorization granted without restrictions by Federal Trade Commission (U.S. antitrust agency, case formally filed at CADE (Brazil) and SAMR (China) and pre-filing in European Union and Turkey, issuance of declaration of effectiveness by the Securities Exchange Commission of the United States of America.
• Financing of Fibria Transaction: 6th debentures issue (R$4.7 billion | US$1.3 billion) and reduction of financial commitment to US$4,4 billion.
Financial Data (R$ million) 2Q18 2Q17 Δ Y-o-Y 1Q18 Δ Q-o-Q 6M18 6M17 Δ Y-o-Y
Net Revenue 3,204 2,530 26.6% 2,999 6.8% 6,203 4,784 29.7%
Adjusted EBITDA¹ 1,573 1,157 36.0% 1,528 2.9% 3,101 2,004 54.7%
Adjusted EBITDA Margin¹ 49.1% 45.7% 3.4 p.p. 51.0% -1.9 p.p. 50.0% 41.9% 8.1 p.p.
Net Financial Result (3,970) (678) 485.6% (157) 2422.8% (4,127) (553) 646.6%
Net Income (1,849) 199 -1031.3% 813 -327.4% (1,036) 649 -259.7%
Operating Cash Generation² 1,279 910 40.5% 1,265 1.1% 2,543 1,532 66.0%
Net Debt /Adjusted EBITDA¹ (x) 1.7 x 2.7 x -1.0 x 1.7 x 0.0 x 1.7 x 2.7 x -1.0 x
Operational Data ('000 tons) 2Q18 2Q17 Δ Y-o-Y 1Q18 Δ Q-o-Q 6M18 6M17 Δ Y-o-Y
Sales 1,085 1,188 -8.7% 1,160 -6.4% 2,245 2,369 -5.2%
Pulp 802 917 -12.5% 876 -8.5% 1,678 1,832 -8.4%
Paper 284 272 4.3% 284 -0.2% 568 537 5.8%
Production 1,134 1,215 -6.7% 1,215 -6.7% 2,349 2,363 -0.6%
Pulp 821 931 -11.9% 920 -10.8% 1,741 1,805 -3.6%
Paper 313 283 10.5% 295 6.1% 608 558 9.1%
1 Excludes non-recurring items. | 2 Operating Cash Flow corresponds to Adjusted EBITDA less sustaining capex. | ³ Considers results of Consumer Goods Unit.

Page 2 of 29
2Q18 EARNINGS RELEASE
The consolidated interim financial statements were prepared in accordance with the standards of the Securities and Exchange Commission of Brazil (CVM) and the Accounting Pronouncements Committee (CPC) and comply with the International Financial Reporting Standards (IFRS) issued by the International Accounting Standard Board (IASB). The operational and financial information is presented based on a consolidated basis and in Brazilian real (R$). Note that figures may present discrepancies due to rounding. Non-financial data, such as volume, quantity, average price and average quotes in Brazilian real and U.S. dollar, were not reviewed by our independent auditors.
CONTENTS Pulp Business Performance ........................................................................................................................... 3
Pulp Sales Volume and Revenue ............................................................................................................ 3 Pulp Cash Cost ........................................................................................................................................ 4 Pulp Segment EBITDA ............................................................................................................................ 5 Pulp Operating Cash Generation and ROIC ........................................................................................... 5
Paper Business Performance ......................................................................................................................... 6
Paper Sales Volume And Revenue ......................................................................................................... 6 Paper EBITDA ......................................................................................................................................... 7 Paper Operating Cash Flow and ROIC ................................................................................................... 7
Economic and Financial Performance .......................................................................................................... 8
Net Revenue ............................................................................................................................................ 8 Production ............................................................................................................................................... 8 Cost of Goods Sold ................................................................................................................................. 9 Operating Expenses ................................................................................................................................ 9 Adjusted EBITDA ..................................................................................................................................... 9 Financial Income and Expenses ........................................................................................................... 10 Derivative Transactions ......................................................................................................................... 10 Transaction with Fibria .......................................................................................................................... 12 Net Income (Loss) ................................................................................................................................. 13 Indebtedness ......................................................................................................................................... 13 Investments ........................................................................................................................................... 14 Cash Flow and ROIC............................................................................................................................. 15
Capital Markets .............................................................................................................................................. 17
Fixed Income .................................................................................................................................................. 18
Rating .............................................................................................................................................................. 18
Events ............................................................................................................................................................. 19
Events in the Period .............................................................................................................................. 19 Subsequent Events ............................................................................................................................... 20 Upcoming Events .................................................................................................................................. 21
IR Contacts ..................................................................................................................................................... 21
Appendices .................................................................................................................................................... 22
Appendix 1 – Operating Data ................................................................................................................ 22 Appendix 2 – Consolidated Statement of Income ................................................................................. 23 Appendix 3 – Consolidated Balance Sheet ........................................................................................... 24 Appendix 4 – Consolidated Statement of Cash Flow ............................................................................ 25 Appendix 5 – EBITDA ........................................................................................................................... 26 Appendix 6 – Segmented Statement of Income .................................................................................... 27
Corporate Information ................................................................................................................................... 29
Forward-Looking Statements ....................................................................................................................... 29

Page 3 of 29
2Q18 EARNINGS RELEASE
PULP BUSINESS PERFORMANCE PULP SALES VOLUME AND REVENUE
Data from the World 20 Report of the Pulp and Paper Products Council (PPPC) show that, in 2Q18, global pulp shipments grew 3.3% on the same period last year. Meanwhile, global eucalyptus pulp shipments grew 3.4%. Suzano sold 801.8 thousand tons of market pulp in 2Q18, 8.5% less than in 1Q18 and 12.1% less than in 2Q17 due to downtime at Mucuri Unit (line 1) and the truck drivers’ strike. In 6M18, the industry’s pulp shipments amounted to 25.4 million tons, up 1.9% on the year-ago period, while eucalyptus shipments came to 10.8 million tons, increasing 4.5% on 6M17. Pulp sales came to 1.7 million tons in the first half of the year, down 8.4% on 6M17, reflecting the partial rebuilding of the Company’s inventories. The level of global pulp inventories reported by the PPPC ended June at 35 days.
The average net pulp price in USD in 2Q18 was US$745/ton, increasing US$14/ton (+1.9%) from 1Q18 and US$168/ton (+29.2%) from 2Q17. In 6M18, the price stood at US$737/ton, increasing US$195/ton (+36.0%) from 6M17. The higher net pulp price is mainly explained by the positive and solid fundamentals of the international pulp industry. The average net price in BRL in 2Q18 was R$2,688/ton, increasing 13.3% and 45.0% compared to 1Q18 and 2Q17, respectively, supported mainly by the higher list price for pulp and by the depreciation in the BRL against the USD. In 6M18, the net price stood at R$2,524/ton, increasing 46.6% from 6M17, reflecting the weaker BRL and the consecutive increases in the pulp list price in US dollar.
90 81 66 197 147
827 795 736
1.635 1.531917 876 802
1.8321.678
2Q17 1Q18 2Q18 6M17 6M18
Pulp Sales Volume ('000 ton)
Domestic Market Exports
139 177 154 290 3311.559 1.900 2.001 2.863
3.9011.6982.076 2.155
3.153
4.232
2Q17 1Q18 2Q18 6M17 6M18
Pulp Revenues (R$ million)
Domestic Market Exports
Europe37%
Asia40%
Brazil7%
North America
16%
South/Central America
0,4%
Pulp Sales Revenue (2Q18)
+3.8%
+34.2% +26.9%
-12.5%
-8.4%
-8.5%

Page 4 of 29
2Q18 EARNINGS RELEASE
PULP CASH COST
The consolidated cash cost of market pulp production in 2Q18 was R$630/ton excluding downtimes and R$683/ton including downtimes.
Consolidated cash cost of market pulp production in the last 12 months was R$593/ton excluding downtime (vs. R$589/ton in LTM 2Q17) and R$629/ton including downtime (vs. R$607/ton in LTM 2Q17).
Cash cost in 2Q18 rose by R$63/ton compared to 2Q17 (+11.0%), mainly reflecting the increases in input costs and fixed costs caused by the lower produced volume.
1 In line with market practices and for comparison purposes, the methodology for calculating cash cost was changed in 1Q18 and does not consider the depletion of the standing timber of third parties.
568 587 630 589 593
2Q17 1Q18 2Q18 LTM 2Q17 LTM 2Q18
Consolidated Pulp Cash Cost ex-maintence downtime (R$/ton)
277
(13)
264
182
14
196
129
4
133
589 593
LTM 2Q17Cash Cost
Δ Wood Δ Chemicals Δ Fixed Cost LTM 2Q18Cash Cost¹
Consolidated Pulp Cash Cost ex-maintenance (R$/ton)
Wood Chemicals Fixed Cost
261
4
265
178
46
223
129
13
142
568630
2Q17Cash Cost
Δ Wood Δ Chemicals Δ Fixed Cost 2Q18Cash Cost¹
Consolidated Pulp Cash Cost ex-maintenance (R$/ton)
Wood Chemicals Fixed Cost
+0.8% +7.4%
+11.0%
+R$63/ton
+R$5/ton

Page 5 of 29
2Q18 EARNINGS RELEASE
PULP SEGMENT EBITDA
Pulp Business 2Q18 2Q17 Δ Y-o-Y 1Q18 Δ Q-o-Q LTM 2Q18 LTM 2Q17 Δ Y-o-Y
Adjusted EBITDA (R$ '000) 1,319,798 946,576 39.4% 1,285,290 2.7% 4,672,289 2,731,478 71.1%
Sales Volume (ton) 801,751 916,529 -12.5% 876,037 -8.5% 3,460,733 3,545,829 -2.4%
Adjusted EBITDA (R$/ton) 1,646 1,033 59.4% 1,467 12.2% 1,350 770 75.3%
The performance of Adjusted EBITDA from pulp in the above periods reflects primarily the higher pulp list price and the effect from exchange variation in the period.
PULP OPERATING CASH GENERATION AND ROIC
The profitability of the pulp business was leveraged by the pulp price and by the effect from exchange variation in the period.
Pulp Business (R$ '000) 2Q18 2Q17 Δ Y-o-Y 1Q18 Δ Q-o-Q LTM 2Q18 LTM 2Q17 Δ Y-o-Y
Adjusted EBITDA 1,319,798 946,576 39.4% 1,285,290 2.7% 4,672,289 2,731,478 71.1%
Sustaining Capex (246,419) (208,028) 18.5% (213,801) 15.3% (958,169) (829,675) 15.5%
Operating Cash Flow 1,073,378 738,549 45.3% 1,071,489 0.2% 3,714,120 1,901,802 95.3%
Cash Taxes2 (66,950) (4,175) 1503.4%
Monetization of ICMS 24,637 - n.a.
Capital Employed 18,246,021 17,782,371 2.6%
Asset 18,927,168 18,506,827 2.3%
Liabilities 681,147 724,456 -6.0%
ROIC1 (%) 20.1% 10.7% 9.5 p.p.
1 ROIC = (Operating Cash Generation – Cash taxes) / Capital Employed (assets – liabilities). | 2 Income and Social Contribution taxes.
947 1.285 1.320
2.731
4.672
55,7%61,9% 60,3%
46,4%
58,4%
-10,0%
0,0%
10,0%
20,0%
30,0%
40,0%
50,0%
60,0%
-500
500
1.500
2.500
3.500
4.500
5.500
2Q17 1Q18 2Q18 LTM 2Q17 LTM 2Q18
Adjusted EBITDA (R$ million) and Adjusted EBITDA Margin (%) dof Pulp
8061.223 1.339
5361.073
2Q17 1Q18 2Q18 LTM 2Q17 LTM 2Q18
Operational Cash Generation of Pulp per ton (R$/ton)
+9.5% +100.1%
+66.1%

Page 6 of 29
2Q18 EARNINGS RELEASE
PAPER BUSINESS PERFORMANCE PAPER SALES VOLUME AND REVENUE
According to the Forestry Industry Association (Ibá), domestic sales of Printing & Writing paper and Paperboard declined 1.3% in 2Q18 compared to the same period of 2017, while imports fell 13.3%. In 6M18, sales by local producers grew 0.5% from 6M17, while imports contracted 1.1%. Suzano’s paper sales amounted to 283.6 thousand tons in 2Q18. Due to truck drivers’ strike the sales volume was in line compared to 1Q18. Compared to 2Q17, sales advanced 4.3%, driven primarily by tissue paper sales volume and the incorporation of the volumes from Facepa. In the year to date, sales volume came to 567.7 thousand tons, advancing 5.8% on 6M17.
The average net paper price in the domestic market in 2Q18 stood at R$3,755/ton, representing increases of R$415/ton (12.4%) and R$593/ton (18.7%) compared to 1Q18 and 2Q17, respectively, in line with the upward trend in prices in the global market. In 6M18, the average net paper price in the domestic market stood at R$3,552/ton, up 12.0% on the year-ago period. In USD, the average net paper price in the export market in 2Q18 was US$989/ton, representing increases of US$44/ton (4.7%) and US$101/ton (11.4%) from 1Q18 and 2Q17, respectively. In BRL, the average net paper price in the export market in 2Q18 was R$3,567/ton, representing increases of 16.4% and 25.0% from 1Q18 and 2Q17, respectively, explained by the effect from exchange variation in the period. In 6M18, the average net paper price in the export market stood at US$965/ton, up 10.7% from 6M17.
180 189 196361 38592 95 87
176 183
272 284 284
537 568
2Q17 1Q18 2Q18 6M17 6M18
Paper Sales Volume ('000 ton)
Domestic Market Exports
570 630 7371.143 1.368262 292 311
488603
832 923 1.049
1.6311.971
2Q17 1Q18 2Q18 6M17 6M18
Paper Revenues (R$ million)
Domestic Market Exports
Others; 9%
Brazil; 70%
North America;
4%
South/ Central
America; 16%
Paper Sales Revenue (2Q18)
+13.7%
+26.1% +20.8%
+4.3%
+5.8%
-0.2%

Page 7 of 29
2Q18 EARNINGS RELEASE
PAPER EBITDA
Paper Business 2Q18 2Q17 Δ Y-o-Y 1Q18 Δ Q-o-Q LTM 2Q18 LTM 2Q17 Δ Y-o-Y
Adjusted EBITDA (R$ '000) 252,932 192,831 31.2% 242,993 4.1% 1,039,706 924,591 12.5%
Sales Volume (ton) 283,610 271,948 4.3% 284,041 -0.2% 1,211,521 1,163,156 4.2%
Adjusted EBITDA (R$/ton) 892 709 25.8% 855 4.2% 858 795 8.0%
The performance of Adjusted EBITDA from paper in 2Q18 compared to 2Q17 is explained by the price increases successfully implemented in the domestic and international markets. Note that the paper business is incorporating the results from the consumer goods business, which is still in the ramp-up phase.
PAPER OPERATING CASH FLOW AND ROIC
The profitability of the paper business benefitted from higher paper prices in the domestic and export markets, which were offset by the higher costs and expenses generated primarily by the consumer goods business, which is still in the ramp-up phase.
Paper Business (R$ '000) 2Q18 2Q17 Δ Y-o-Y 1Q18 Δ Q-o-Q LTM 2Q18 LTM 2Q17 Δ Y-o-Y
Adjusted EBITDA 252,932 192,831 31.2% 242,993 4.1% 1,039,707 924,591 12.5%
Sustaining Capex (47,517) (38,361) 23.9% (49,818) -4.6% (227,287) (189,382) 20.0%
Operating Cash Flow 205,415 154,470 33.0% 193,176 6.3% 812,420 735,209 10.5%
Cash Taxes2 (8,138) (7,754) 4.9%
Monetization of ICMS 87,883 - n.a.
Capital Employed 6,520,944 5,608,484 16.3%
Asset 7,292,306 6,196,674 17.7%
Liabilities 771,362 588,190 31.1%
ROIC1 (%) 13.7% 13.0% 0.7 p.p.
1 ROIC = (Operating Cash Generation – Cash taxes) / Capital Employed (assets – liabilities). | 2 Income and Social Contribution taxes.
193 243 253
925 1.040
23,2% 26,3% 24,1% 25,9% 26,2%
-50,0%
-40,0%
-30,0%
-20,0%
-10,0%
0,0%
10,0%
20,0%
30,0%
40,0%
0
200
400
600
800
1.000
1.200
1.400
2Q17 1Q18 2Q18 LTM 2Q17 LTM 2Q18
Adjusted EBITDA (R$ million) and Adjusted EBITDA Margin (%) of Paper
568 680 724 632 671
2Q17 1Q18 2Q18 LTM 2Q17 LTM 2Q18
Operational Cash Generation of Paper per ton (R$/ton)
+6.5% + 6.1%
+ 27.5%
Page 8 of 29
2Q18 EARNINGS RELEASE
ECONOMIC AND FINANCIAL PERFORMANCE NET REVENUE
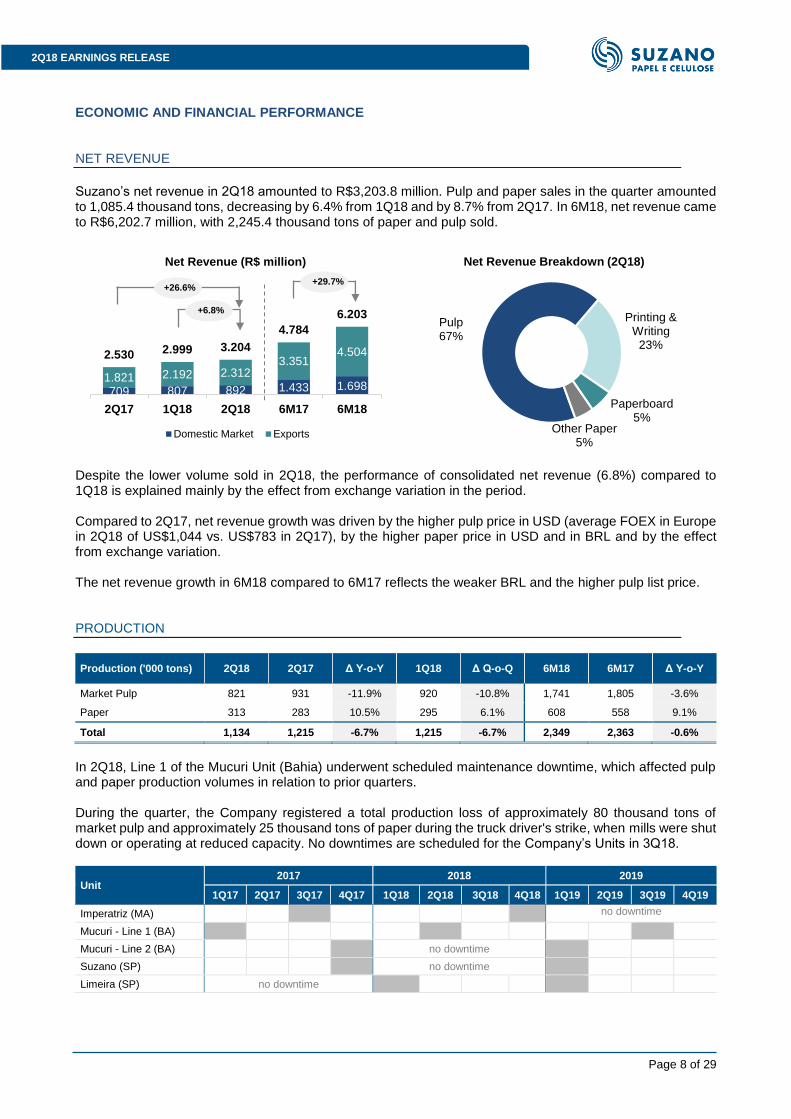
Suzano’s net revenue in 2Q18 amounted to R$3,203.8 million. Pulp and paper sales in the quarter amounted to 1,085.4 thousand tons, decreasing by 6.4% from 1Q18 and by 8.7% from 2Q17. In 6M18, net revenue came to R$6,202.7 million, with 2,245.4 thousand tons of paper and pulp sold.
Despite the lower volume sold in 2Q18, the performance of consolidated net revenue (6.8%) compared to 1Q18 is explained mainly by the effect from exchange variation in the period. Compared to 2Q17, net revenue growth was driven by the higher pulp price in USD (average FOEX in Europe in 2Q18 of US$1,044 vs. US$783 in 2Q17), by the higher paper price in USD and in BRL and by the effect from exchange variation. The net revenue growth in 6M18 compared to 6M17 reflects the weaker BRL and the higher pulp list price. PRODUCTION
Production ('000 tons) 2Q18 2Q17 Δ Y-o-Y 1Q18 Δ Q-o-Q 6M18 6M17 Δ Y-o-Y
Market Pulp 821 931 -11.9% 920 -10.8% 1,741 1,805 -3.6%
Paper 313 283 10.5% 295 6.1% 608 558 9.1%
Total 1,134 1,215 -6.7% 1,215 -6.7% 2,349 2,363 -0.6%
In 2Q18, Line 1 of the Mucuri Unit (Bahia) underwent scheduled maintenance downtime, which affected pulp and paper production volumes in relation to prior quarters. During the quarter, the Company registered a total production loss of approximately 80 thousand tons of market pulp and approximately 25 thousand tons of paper during the truck driver's strike, when mills were shut down or operating at reduced capacity. No downtimes are scheduled for the Company’s Units in 3Q18.
Unit 2017 2018 2019
1Q17 2Q17 3Q17 4Q17 1Q18 2Q18 3Q18 4Q18 1Q19 2Q19 3Q19 4Q19
Imperatriz (MA) no downtime
Mucuri - Line 1 (BA)
Mucuri - Line 2 (BA) no downtime
Suzano (SP) no downtime
Limeira (SP) no downtime
709 807 892 1.433 1.6981.821 2.192 2.312
3.3514.5042.530 2.999 3.204
4.784
6.203
2Q17 1Q18 2Q18 6M17 6M18
Net Revenue (R$ million)
Domestic Market Exports
Pulp67%
Printing & Writing
23%
Paperboard5%
Other Paper5%
Net Revenue Breakdown (2Q18)
+6.8%
+26.6% +29.7%

Page 9 of 29
2Q18 EARNINGS RELEASE
COST OF GOODS SOLD
Cost of goods sold (COGS) in 2Q18 amounted to R$1,678.6 million or R$1,546.6/ton. Compared to 2Q17 and 1Q18, COGS increased by 10.9% and 5.8% respectively, reflecting the lower sales volume in the period. In 6M18, COGS came to R$3,265 million, 6.0% higher than in 6M17, also due to the lower sales volume in the period.
COGS (R$ '000) 2Q18 2Q17 Δ Y-o-Y 1Q18 Δ Q-o-Q 6M18 6M17 Δ Y-o-Y
Pulp 980,974 920,630 6.6% 963,168 1.8% 1,944,142 1,894,359 2.6%
Paper 697,598 592,733 17.7% 622,758 12.0% 1,320,356 1,185,549 11.4%
Consolidated 1,678,574 1,513,364 10.9% 1,585,926 5.8% 3,264,500 3,079,908 6.0%
COGS (R$/ton) 2Q18 2Q17 Δ Y-o-Y 1Q18 Δ Q-o-Q 6M18 6M17 Δ Y-o-Y
Pulp 1,224 1,004 21.8% 1,099 11.3% 1,159 1,034 12.1%
Paper 2,460 2,180 12.9% 2,192 12.2% 2,326 2,209 5.3%
Consolidated 1,547 1,273 21.5% 1,367 13.1% 1,420 1,300 9.2%
OPERATING EXPENSES
Expenses (R$ '000) 2Q18 2Q17 Δ Y-o-Y 1Q18 Δ Q-o-Q 6M18 6M17 Δ Y-o-Y
Selling Expenses 150,305 94,418 59.2% 121,957 23.2% 272,262 195,042 39.6%
General and Administrative Expenses 203,667 120,691 68.8% 147,353 38.2% 351,020 232,288 51.1%
Total Expenses 353,972 215,109 64.6% 269,310 31.4% 623,282 427,330 45.9%
Total Expenses/Sales Volume (R$/ton) 326 181 80.2% 232 40.5% 278 180 53.8%
Total selling and administrative expenses stood at R$326/ton in 2Q18, representing increases of 80.2% in relation to 2Q17 and of 40.5% in relation to 1Q18. Compared to 2Q17, selling expenses increased by 59.2% or R$55.9 million, reflecting the additional expenses with structuring the consumer goods business of approximately R$31 million and the higher expenses with logistics in the domestic market due to hikes in freight costs after the truck drivers’ strike. Compared to 1Q18, the consumer goods business accounted for an increase of approximately R$22 million. The increases in general and administrative expenses compared to both 2Q17 (+68.8%) and 1Q18 (+38.2%) are explained by the higher expenses with profitability-based compensation due to higher stock prices (approximately R$50 million) and by the expenses with the consumer goods structure, especially after the incorporation of Facepa and the expenses with the Fibria transaction (approximately R$16 million). ADJUSTED EBITDA
Consolidated 2Q18 2Q17 Δ Y-o-Y 1Q18 Δ Q-o-Q LTM 2Q18 LTM 2Q17 Δ Y-o-Y
Adjusted EBITDA (R$ '000) 1,572,729 1,156,566 36.0% 1,528,283 2.9% 4,139,266 3,673,227 12.7%
EBITDA Margin (%) 49.1% 45.7% 3.4 p.p. 51.0% -1.9 p.p. 66.7% 76.8% -10.1 p.p.
Sales Volume (ton) 1,085,360 1,188,477 -8.7% 1,160,078 -6.4% 3,586,895 4,708,985 -23.8%
Adjusted EBITDA (R$/ton) 1,449 973 48.9% 1,317 10.0% 1,154 780 47.9%
The growth in Adjusted EBITDA in 2Q18 compared to the above periods was driven primarily by the higher pulp list price, the weaker BRL and the higher paper prices in the domestic market.

Page 10 of 29
2Q18 EARNINGS RELEASE
FINANCIAL INCOME AND EXPENSES
Resultado Financeiro (R$ mil)
2Q18 2Q17 Δ Y-o-Y 1Q18 Δ Q-o-Q 6M18 6M17 Δ Y-o-Y
Financial Expenses (325,521) (278,630) 16.8% (234,273) 38.9% (559,794) (560,793) -0.2%
Interest on loans and financing (local currency)
(61,163) (105,834) -42.2% (59,458) 2.9% (120,621) (230,968) -47.8%
Interest on loans and financing (foreign currency)
(127,764) (122,192) 4.6% (115,868) 10.3% (243,632) (237,990) 2.4%
Capitalized interest1 232 2,046 -88.7% 304 -23.7% 536 3,519 -84.8%
Other financial expenses
(136,826) (52,649) 159.9% (59,251) 130.9% (196,077) (95,354) 105.6%
Financial Income 45,007 83,611 -46.2% 36,726 22.5% 81,733 182,286 -55.2%
Interest on financial investments
40,788 78,817 -48.2% 33,082 23.3% 73,870 170,517 -56.7%
Other financial income 4,219 4,794 -12.0% 3,644 15.8% 7,863 11,769 -33.2%
Monetary and Exchange Variations
(1,139,051) (348,746) 226.6% (28,406) 3909.9% (1,167,457) (177,905) 556.2%
Foreign exchange variations (Debt)
(1,471,701) (372,288) 295.3% (37,911) 3782.0% (1,509,612) (119,367) 1164.7%
Other foreign exchange variations
332,650 23,542 1313.0% 9,505 3399.7% 342,155 (58,538) -684.5%
Derivative income (loss), net2
(2,550,067) (134,152) 1800.9% 68,603 -3817.1% (2,481,464) 3,669 -67733.2%
NDF (1,144,478) 11,110 -10401.3% - n.a. (1,144,478) 11,054 -10453.5%
Zero-Cost Collars (825,852) (104,309) 691.7% 24,937 -3411.8% (800,915) (15,095) 5205.8%
Foreign-Currency Debt Hedge
(579,698) (40,047) 1347.5% 43,500 -1432.6% (536,198) 5,686 -9530.1%
Other3 (39) (906) -95.7% 166 -123.7% 127 2,024 -93.7%
Net Financial Result (3,969,632) (677,917) 485.6% (157,350) 2422.8% (4,126,982) (552,743) 646.6%
1 Capitalized interest due to construction in progress.
2 Variation in mark-to-market adjustment plus adjustments paid and received, considering the end-of-month exchange rate (R$/US$3.8558 on 6/30/2018).
3 Other includes LIBOR operations.
Financial expenses increased by 38.9% in 2Q18 compared to 1Q18, explained by the effects from exchange variation in the period and by the expenses with the commitment for financing facilities worth US$9.2 billion made available for the business combination with Fibria. The 16.8% increase compared to 2Q17 reflects the lower interest rates in Brazil and the financial expenses with said commitment. Financial income in 2Q18 compared to 1Q18 was adversely affected by the lower interest rates in Brazil. Inflation adjustment and exchange variation generated a loss of R$2,550 million in the quarter due to the effect from foreign exchange variation, with a negative accounting effect from the mark-to-market adjustments of the portion of liabilities denominated in foreign currency, with cash effects limited to maturities or amortizations of liabilities. The Company posted a net financial expense of R$3,969.6 million in 2Q18, compared to the net financial expense of R$157.4 million in 1Q18 and the net financial expense of R$677.9 million in 2Q17. DERIVATIVE TRANSACTIONS
Suzano carries out derivatives transactions exclusively for hedging purposes. The Company’s currency exposure policy seeks to minimize the volatility of its cash generation and to impart greater flexibility to cash flow management. The policy currently stipulates that surplus dollars may be partially hedged (up to 75% of exchange variation exposure over the next 18 months) using plain vanilla instruments (Zero Cost Dollar and NDF) and matched with dollar inflows.

Page 11 of 29
2Q18 EARNINGS RELEASE
Zero Cost Dollar transactions minimize the adverse effects from slight variations in exchange rates. The instrument protects an exchange variation range that is favorable to cash flow, within which the Company does not pay or receive the adjustment. In addition to protecting the Company in such scenarios, this characteristic makes it possible to capture higher benefits on export revenue in any scenarios of U.S. dollar appreciation. The Company constantly monitors the market and analyzes the attractiveness at any given time of fully or partially reversing the transaction. At June 30, 2018, the value of the principal of operations involving forward dollar sales through Zero Cost Collars (ZCC) was US$2,315 million, whose maturities are distributed from April 2018 to October 2019 and were contracted in a range from R$3.00 to R$4.58.The current scenario of volatility in the BRL/USD exchange rate makes this the most adequate strategy for protecting the Company's cash flow.
Cash Flow Hedge Maturity Avarege Strike
Put Avarege Strike
Call Notional (million)
Zero-Cost Collars 3Q18 3.12 3.96 USD 295
Zero-Cost Collars 4Q18 3.07 4.02 USD 325
Zero-Cost Collars 1Q19 3.11 4.00 USD 380
Zero-Cost Collars 2Q19 3.18 4.00 USD 275
Zero-Cost Collars 3Q19 3.40 4.12 USD 520
Zero-Cost Collars 4Q19 3.30 4.08 USD 370
Zero-Cost Collars 1Q20 3.90 4.33 USD 150
Total USD 2,315
The Company also uses currency and interest rate swaps to mitigate the effects from exchange and interest rate variations on the balance of its debt and on its cash flow. Contracts swapping different interest rates and inflation indexes may be entered into as a way to mitigate the mismatch between financial assets and liabilities. At June 30, 2018, the Company held US$815.3 million in swaps of CDI for a fixed rate in USD. In 2Q18, derivative transactions posted a loss of R$793 million.
Debt Hedge Maturity Receive Pay Notional (million)
Swap 4Q20
Brazilian Real CDI
US Dollar Fixed USD 815
Total USD 815
In addition to hedge operations for cash flow and debt, we carried out new hedge operations for the transaction with Fibria. All derivative instruments to hedge the transaction are plain vanilla, as approved by the Company’s Derivatives Policy. At June 30, 2018, the value of the principal of operations involving forward dollar sales through NDFs was US$3,500 million, with average forward rate of R$3.64, whose maturities are distributed from April 2019 to November 2019, as well as ZCCs, whose value of the principal was US$1,250 million, with maturities distributed from May 2019 to October 2019 and contracted in a range from R$3.50 to R$4.16. At June 30, 2018, the Company held US$1,250 million in swaps of CDI for a fixed rate in USD.

Page 12 of 29
2Q18 EARNINGS RELEASE
Fibria’s Operation - Hedge Maturity Strike Range / Avarega Foward /
Index Notional (million)
Zero-Cost Collars 2Q19 3.50 – 4.02 USD 200
Zero-Cost Collars 3Q19 3.50 – 4.16 USD 900
Zero-Cost Collars 4Q19 3.50 – 4.00 USD 200
NDF 2Q19 3.80 USD 900
NDF 3Q19 3.60 USD 2.200
NDF 4Q19 3.54 USD 400
Swap 2Q26 Brazilian Real CDI - US Dollar Fixed USD 1,250
Total USD 6,050
TRANSACTION WITH FIBRIA
On March 15, 2018, the Company announced a transaction with Fibria worth R$29.0 billion (US$8.8 billion, at the exchange rate on the day) and informed that it already had credit facilities worth US$9.2 billion to cover the cash needs of the transaction, whose disbursement is subject, among other conditions, to the consummation of the Transaction. The guaranteed financing is divided into two tranches: the first (term loan) in the amount of US$2.3 billion with term of six years and the second (bridge loan) in the amount of US$6.9 billion with term of three years. In 2Q18, the Company carried out its 6th debentures issue (R$4.7 billion | US$1.25 billion) and, given the strong cash generation in the period and the guaranteed term loan (US$2.3 billion), as of June 30, 2018, the amount to be disbursed under the bridge loan was R$17.8 billion (US$4.6 billion).
¹ Cash tranche: each Fibria’s share will receive R$52.50, to be adjusted from 03/15/2018 until signing to closing. | ² Commitment: US$ 2,3 billion, exchange rate on 06/30/2018 (R$3.8558/US$).
Cash Flow2.315
Debt815
Fibria's Transaction
6.050
Derivatives Notional 06/30/2018(US$ million)
US$ 9,180(exchangfe rateR$3.5961/US$,
considering swaps)
Cash Flow Hedge-365
Debt Hedge-438
Fibria’s Operation -
Hedge-1.747
Results - 06/30/2018(R$ million)
(R$ 2,550)

Page 13 of 29
2Q18 EARNINGS RELEASE
NET INCOME (LOSS)
The Company posted a net loss of R$1,849.0 million in 2Q18, compared to the net income of R$813.1 million in 1Q18 and the net income of R$198.5 million in 2Q17. INDEBTEDNESS
On June 30, 2018, gross debt stood at R$18.0 billion (90.6% long-term maturities and 9.4% short-term maturities), with 55.6% denominated in foreign currency and 44.4% in local currency. The percentage of gross debt denominated in foreign currency, considering the adjustment for derivatives, was 96.3%. Net debt stood at R$9.9 billion (US$2.6 billion) on June 30, 2018, compared to R$9.3 billion (US$2.8 billion) on March 31, 2018.
Debt (R$ '000) 06/30/2018 06/30/2017 Δ Y-o-Y 03/31/2018 Δ Q-o-Q
Local Currency 7,979,130 4,110,856 94.1% 3,608,021 121.1%
Short Term 1,142,945 755,891 51.2% 636,178 79.7%
Long Term 6,836,184 3,354,965 103.8% 2,971,844 130.0%
Foreign Currency 9,983,341 9,531,570 4.7% 9,038,085 10.5%
Short Term 551,469 1,239,730 (55.5%) 796,796 (30.8%)
Long Term 9,431,872 8,291,840 13.7% 8,241,289 14.4%
Gross Debt 17,962,471 13,642,426 31.7% 12,646,106 42.0%
(-) Cash 8,027,522 3,630,769 121.1% 3,392,005 136.7%
Net Debt 9,934,949 10,011,657 (0.8%) 9,254,101 7.4%
Net Debt/Adjusted EBITDA1 (x) 1.7x 2.7x (1.0x) 1.7x 0.0x
1 Excludes nonrecurring items.
Suzano contracts debt in foreign currency as natural hedge, since net operating cash generation is denominated in foreign currency. This structural exposure allows it to contract export financing in USD to match financing payments with receivable flows from sales. Suzano actively and expressly demonstrates its commitment to deleverage sustainably and to adopt adequate and efficient structures and costs for its market positioning and operating and managerial capacity.
12.192
7.471 80 355
1.426
( 3.545 ) ( 17 )
17.962
Gross Debt onDez/17
Loans Addition fromacquisition ofsubsidiaries
InterestAccrual
ForeignExchangeVariation
Principal andInterestPayment
Others Gross Debt onJun/18
Gross Debt Evolution (R$ million)

Page 14 of 29
2Q18 EARNINGS RELEASE
The ratio of net debt to Adjusted EBITDA in BRL stood at 1.7x on June 30, 2018, stable in relation to March 31, 2018. In USD, the ratio of net debt to Adjusted EBITDA was 1.5x on June 30, 2018, compared to 1.7x on March 31, 2018. The reduction in the ratio in USD is explained by the effect from exchange variation in the period.
In June 2018, the average cost of debt in USD was 4.6% p.a. (debt in BRL adjusted by the market swap curve). The average term of consolidated debt ended the quarter at 90 months (vs. 85 months in March 2018).
INVESTMENTS
Capital expenditure amounted to R$1,282.0 million in the year to date, R$557.6 million of which was invested in industrial and forest maintenance. Expenditures on the Structural Competitiveness and Adjacent Businesses projects came to R$610.5 million, which primarily consisted of the acquisition of Facepa (R$267.9 million), the acquisition of land and forests from Duratex (R$150.3 million) and the Tissue (Maranhão and Bahia states) and Lignin projects.
1.233 372 4222.446
1.401
4.971
6.795
9191.799 137
64
4.802
8.028
630 1.291
2.222 2.582
1.465
9.773
Cash 6M18 2019 2020 2021 2022 2023 onward
Amortization Schedule (R$ million)
Foreign Currency Local Currency
10.012 9.283 9.484 9.254 9.935
3.026 2.930 2.867 2.784 2.577
2Q17 3Q17 4Q17 1Q18 2Q18
Net Debt(R$ and US$ million)
R$ US$
2,7 2,3 2,1 1,7 1,7
2,7 2,3 2,0 1,7 1,5
2Q17 3Q17 4Q17 1Q18 2Q18
Net Debt / Adjusted EBITDA in R$ and US$ (x)
R$ US$
Export financing; 20%
Bond; 31%
Debenture; 26%
Agribusiness Receivables
Certificates; 13%
Import financing; 5%
BNDES; 3%Others; 2%
Type Expousure on 06/30/2018
Libor; 24%
Fixed (US$); 31%
CDI; 41%
TJLP; 1%Fixed (R$); 2%
Basket of Currencies; 1%
Index Exposure on 06/30/2018

Page 15 of 29
2Q18 EARNINGS RELEASE
For 2018, capex is estimated at R$2.8 billion, of which R$1.2 billion corresponds to sustaining capex and R$1.6 billion to the Adjacent Businesses and Structural Competitiveness projects.
Capex (R$ '000) 2Q18 2Q17 Δ Y-o-Y 1Q18 Δ Q-o-Q 6M18 6M17 Δ Y-o-Y
Sustaining 293,937 246,388 19.3% 263,619 11.5% 557,555 471,871 18.2%
Industrial Maintenance 68,780 46,532 47.8% 54,779 25.6% 123,559 103,381 19.5%
Forestry Maintenance 225,156 199,856 12.7% 208,840 7.8% 433,996 368,490 17.8%
Structural Competitiveness and Adjacent Business
232,373 112,084 107.3% 378,169 -38.6% 610,541 234,782 160.0%
Other 47,148 29,570 59.4% 66,795 -29.4% 113,943 45,617 149.8%
Total 573,457 388,042 47.8% 708,582 -19.1% 1,282,040 752,270 70.4%
CASH FLOW AND ROIC
(R$ '000) 2Q18 2Q17 Δ Y-o-Y 1Q18 Δ Q-o-Q LTM 2Q18 LTM 2Q17 Δ Y-o-Y
Adjusted EBITDA 1,572,729 1,156,566 36.0% 1,528,283 2.9% 5,711,995 3,673,228 55.5%
Sustaining Capex (293,937) (246,388) 19.3% (263,619) 11.5% (1,185,456) (1,019,057) 16.3%
Operating Cash Flow 1,278,792 910,178 40.5% 1,264,664 1.1% 4,526,539 2,654,171 70.5%
Suzano’s operating cash generation (Adjusted EBITDA less sustaining capex) amounted to R$1.3 billion in 2Q18 and R$4.5 billion in the last 12 months. The variations in the comparison periods are explained by the depreciation in the BRL against the USD, the higher pulp list price, the higher paper price in the international and domestic markets and the consolidation of Facepa’s results as from 2Q18. Losses in market pulp and paper production and sales volumes caused by the truck drivers’ strike adversely affected operational cash generation and ROIC.
Consolidated ROIC stood at 18.4%. The 7.1 p.p. increase compared to the 12 months to 2Q17 is explained by the higher profitability of the pulp segment due to depreciation in the BRL against the USD, the higher pulp price and the successful implementation of paper price increases in the international and domestic markets. The consumer goods business unit (Tissue) adversely affected profitability, since it is still in the ramp-up phase.
7661.090 1.178
564969
2Q17 1Q18 2Q18 LTM 2Q17 LTM 2Q18
Operational Cash Generation per ton (R$/ton)
+8.1% +71.9%
+53.8%

Page 16 of 29
2Q18 EARNINGS RELEASE
Consolidated ROIC (R$ '000) LTM 2Q18 LTM 2Q17 Δ Y-o-Y
Operating Cash Flow 4,526,541 2,654,170 70.5%
Cash taxes² (75,088) (11,930) 529.4%
Monetization of ICMS 112,521 - n.a.
Capital Employed 24,766,964 23,390,854 5.9%
Asset 26,219,474 24,703,500 6.1%
Liabilities 1,452,510 1,312,646 10.7%
ROIC1 (%) 18.4% 11.3% 7.1 p.p.
1 ROIC = (Operating Cash Generation – Cash taxes) / Capital Employed (assets – liabilities).
² Income and Social Contribution taxes.

Page 17 of 29
2Q18 EARNINGS RELEASE
CAPITAL MARKETS On June 30, 2018, Suzano’s common stock (SUZB3) was quoted at R$44.97/share. The Company’s stock is listed on the Novo Mercado, the listing segment of the São Paulo Exchange (B3) with the highest corporate governance standards.
Source: Bloomberg.
Source: Bloomberg.
On June 30, 2018, the Company’s capital stock was represented by 1,105,826,145 common shares (SUZB3) traded on the B3, of which 12,042,004 were treasury shares. Suzano’s market capitalization was R$49.7 billion on June 30, 2018. In 2Q18, the free-float stood at 42.5% of the total capital.
Free-Float Distribution on 06/30/2018
0
50
100
150
200
250
300
350
400
Jun-17 Jul-17 Aug-17 Sep-17 Oct-17 Nov-17 Dec-17 Jan-18 Feb-18 Mar-18 Apr-18 May-18 Jun-18
Stock Performance
Ibovespa+16%
IBrX-50+16%
SUZB3+215%
59 62 71
137
211
12.296 9.840 12.034 15.717 17.561
-60.000
-50.000
-40.000
-30.000
-20.000
-10.000
0
10.000
20.000
0
50
100
150
200
250
300
2Q17 3Q17 4Q17 1Q18 2Q18
Liquidity
Avg. Daily Volume (R$ million) Number of Trades (Daily)
Local35%
Foreign65% Institutional Investors
96%
Individual Investors4%

Page 18 of 29
2Q18 EARNINGS RELEASE
Free-Float Distribution on 06/30/2018
* Latin America excluding Brazil.
FIXED INCOME
Unit Jun/17 Mar/18 Jun/18
Suzano 2021 - Price USD/k 105.9 105.3 104.1
Suzano 2021 - Yield % 4.0 3.9 4.3
Suzano 2026 - Price USD/k 103.4 104.9 102.0
Suzano 2026 - Yield % 5.3 5.0 5.4
Suzano 2047 - Price USD/k 101.3 113.3 113.5
Suzano 2047 - Yield % 6.9 6.0 6.8
Treasury 10 years % 2.3 2.7 2.9
RATING
Agency National Scale Global Scale Outlook
Fitch Ratings AAA BBB- Stable
Standard & Poor’s brAAA BBB- Stable
Moody’s Aaa.br Ba1 Stable

Page 19 of 29
2Q18 EARNINGS RELEASE
EVENTS EVENTS IN THE PERIOD
The Material Fact notices and the Notices to the Market mentioned below are available on the website of the Securities and Exchange Commission of Brazil (CVM) and on the Company’s IR website (www.suzano.com.br/ri). Conclusion of the acquisition of land and forests in the State of São Paulo On April 27, 2018, the Company informed its shareholders and the market that, complementing the Material Fact notice published on February 5, 2018, it had concluded the acquisition of approximately nine thousand five hundred hectares (9,500 ha) of rural areas and one million, two hundred thousand cubic meters (1,200,000 m³) of forests from Duratex. Truck drivers’ strike On May 24, 2018, the Company informed to its shareholders and the general market that the production and distribution of its products had been adversely affected by the truck drivers’ strike in Brazil. The Company emphasized it was taking all measures necessary to minimize any impacts from this situation. Shutdown of operations On May 28, 2018, pursuant to CVM Instruction 358, of January 3, 2002, as amended, and complementing the Notice to the Market disclosed on May 24, 2018, the Company informed its shareholders and the market that, despite adopting all measures to minimize the effects from the truck drivers' strike, Suzano had been forced to shut down its operations due to such event. Resignation of member of the Board of Directors On May 28, 2018, the Company informed its shareholders and the general market that Mr. Marco Antonio Bologna had tendered his resignation as a member of the Board of Directors and the Audit Committee of the Company. His letter of resignation was considered and accepted by Suzano’s Board of Directors. For the time being, the outgoing Director will not be replaced, with Suzano’s Board of Directors formed by eight (8) members, who were elected at the Annual Shareholders’ Meeting of the Company held on April 26, 2018. Amendment to the Calendar of Corporate Events On May 28, 2018, in response to Official Letter/CVM/SEP/nº02/2018 issued by the Securities and Exchange Commission of Brazil (CVM), dated February 28, 2018, the Company informed its shareholders and the general market that it had amended its Annual Calendar of Corporate Events 2018, to bring forward, to May 28, 2018, the date for the filing of its Reference Form, which previously was scheduled for May 30, 2018.
Authorization from U.S. antitrust authority On June 1, 2018, the Company informed its shareholders and the general market that it had received a notification from the Federal Trade Commission (FTC), the antitrust authority of the United States, of the early conclusion of the analysis of the transaction between Suzano and Fibria, which constitutes an authorization without restrictions for the transaction in the United States of America. Gradual resumption of operations On June 1, 2018, the Company informed its shareholders and the general market that, on May 31, 2018, it had started to gradually resume operations at all of its industrial plants, including the distribution and invoicing of its products.
Production Loss On June 7, 2018, the Company informed its shareholders and the general market that it had a total production loss of approximately 80 thousand tons of market pulp and approximately 25 thousand tons of paper during the truck driver's strike, when units were shut down or operating partially. 6th Debentures Issue On June 26, 2018, the Company informed its shareholders and the general market that, complementing the Material Fact notice published on March 16, 2018, its Board of Directors had approved, in connection with the transaction to combine the shareholder bases of the Company and Fibria Celulose S.A. through a corporate reorganization as disclosed in such Material Fact notice, the 6th issue of debentures of the Company, in the

Page 20 of 29
2Q18 EARNINGS RELEASE
amount of R$4,681,100,000.00, with a maturity of eight years, yield of 112.5% of the CDI rate and issue date of June 29, 2018. SUBSEQUENT EVENTS
The Material Fact notice mentioned below is available on the website of CVM and on the Company’s IR website (www.suzano.com.br/ri).
Acquisition of land and forests in the State of São Paulo On July 2, 2018, the Company informed its shareholders and the general market that exercised the option to acquire around twenty thousand (20,000) hectares of rural areas and five million, six hundred thousand cubic meters (5,600,000 m³) of Duratex’s forests, for R$749.4 million, adjusted in accordance with the Contract. Protocol and Justification of Merger On July 26, 2018, the Company informed its shareholders and the general market that the Board of Directors of Suzano, among other matters, approved the execution of the Merger Agreement (“Merger Agreement”) between Suzano, Fibria Celulose S.A. (“Fibria”), and Eucalipto Holding S.A. (“Holding”), which establishes the terms and conditions of the corporate restructuring that will enable the combination of the operations and shareholding bases of Suzano and Fibria, which is the object of the Commitment to Vote and Assumption of Obligations signed on March 15, 2018 and announced by the Company through a Material Fact notice on March 16, 2018 (“Operation”). Auction of Itaqui Port (State of MA) On July 27, 2018, the Company informed its shareholders and the general market that the bid submitted by it in connection with Auction 03/2018 conducted Brazil’s National Water Transport Agency (“ANTAQ”) received the best classification. Export Credit Note On July 31, 2018, the Company informed its shareholders and the general market that it obtained financing from Banco Safra S.A. through the issue of an Export Credit Note (“NCE”), in the total amount of seven hundred seventy million, six hundred thousand reais Reduction of Financial Commitment On July 31, 2018, the Company informed its shareholders and the general market that it approved, in connection with the transaction aimed at combining the operations and shareholder bases of the Company and Fibria Celulose S.A. (“Fibria”) through a corporate restructuring process, as per the terms disclosed in said Material Fact notice (“Operation”), the reduction from six billion, nine hundred million (US$ 6,900,000,000.00) to four billion, four hundred million (US$ 4,400,000,000.00) of the existing firm financial commitment with certain international financial institutions to finance the cash portion of the Operation, whose disbursement is subject, among other conditions, to the consummation of the Operation. Declaration of Effectiveness by the Securities Exchange Commission of the United States of America On August 9, 2018, the Company informed its shareholders and the general market that the declaration of effectiveness was issued on August 8, 2018, by the Securities Exchange Commission of the United States of America (SEC) for the registration statement filed by Suzano with SEC for purposes of calling and holding and approval the Extraordinary Shareholders’ Meetings of Suzano and of Fibria, to be held at first call on September 13, 2018, as provided for in the Call Notices published on August 9, 2018, of the proposed corporate reorganization for the combination of operations and shareholders bases of Suzano and of Fibria, which was the object of the Voting Agreement and Other Obligations entered into on March 15, 2018 disclosed by the Companies through Material Facts published on March 16, 2018, pursuant to the terms and conditions of the protocol and justification entered into by and between the managers of Suzano, Fibria and Eucalipto Holding S.A., approved by the Boards of Directors of Suzano and Fibria during the meetings held on July 26, 2018 and disclosed by the Companies on the same date.

Page 21 of 29
2Q18 EARNINGS RELEASE
UPCOMING EVENTS
Earnings Conference Call (2Q18) Date: August 9, 2018 (Thursday)
Portuguese (with simultaneous translation) 9:30 a.m. (Brasília time) 8:30 a.m. (New York time) 1:30 p.m. (London time) Tel: +55 (11) 3193-1001 or (11) 2820-4001
English 9:30 a.m. (Brasilia time) 8:30 a.m. (New York time) 1:30 p.m. (London time) Tel: +1 (646) 828-8246 (access code: Suzano)
Please connect 10 minutes before the conference call is scheduled to begin.
The conference call will be held in English, feature a slide presentation and be transmitted simultaneously via webcast. The access links will be available on the Company’s Investor Relations website (www.suzano.com.br/ri).
If you are unable to participate, the webcast link will be available for future consultation on the Company’s Investor Relations website. IR CONTACTS Marcelo Bacci Rafael Mastrocola Danielle Cheade Fernanda Brienza Matheus Chiderolli Tel: +55 (11) 3503-9061 [email protected] www.suzano.com.br/ri

Page 22 of 29
2Q18 EARNINGS RELEASE
APPENDICES APPENDIX 1 – Operating Data
Revenue breakdown (R$ '000) 2Q18 2Q17 Δ Y-o-Y 1Q18 Δ Q-o-Q 6M18 6M17 Δ Y-o-Y
Exports 2.312.191 1.821.048 27,0% 2.192.050 5,5% 4.504.241 3.350.956 34,4%
Pulp 2.001.072 1.558.835 28,4% 1.899.779 5,3% 3.900.851 2.862.978 36,3%
Paper 311.119 262.213 18,7% 292.271 6,4% 603.390 487.978 23,7%
Domestic Market 891.602 708.822 25,8% 806.809 10,5% 1.698.412 1.432.821 18,5%
Pulp 154.107 139.315 10,6% 176.547 -12,7% 330.654 289.611 14,2%
Paper 737.496 569.507 29,5% 630.262 17,0% 1.367.757 1.143.210 19,6%
Total Net Revenue 3.203.793 2.529.870 26,6% 2.998.859 6,8% 6.202.653 4.783.777 29,7%
Pulp 2.155.179 1.698.150 26,9% 2.076.326 3,8% 4.231.505 3.152.589 34,2%
Paper 1.048.615 831.720 26,1% 922.533 13,7% 1.971.147 1.631.188 20,8%
Sales volume (tons) 2Q18 2Q17 Δ Y-o-Y 1Q18 Δ Q-o-Q 6M18 6M17 Δ Y-o-Y
Exports 823.272 918.389 -10,4% 890.383 -7,5% 1.713.655 1.810.758 -5,4%
Pulp 736.056 826.529 -10,9% 795.030 -7,4% 1.531.086 1.634.664 -6,3%
Paper 87.215 91.861 -5,1% 95.353 -8,5% 182.568 176.094 3,7%
Paperboard 12.279 16.779 -26,8% 14.332 -14,3% 26.611 30.036 -11,4%
Printing & Writing 74.936 75.081 -0,2% 81.021 -7,5% 155.957 146.058 6,8%
Domestic Market 262.089 270.088 -3,0% 269.694 -2,8% 531.783 557.755 -4,7%
Pulp 65.694 90.000 -27,0% 81.007 -18,9% 146.701 197.254 -25,6%
Paper 196.394 180.088 9,1% 188.688 4,1% 385.082 360.500 6,8%
Paperboard 30.139 28.132 7,1% 30.021 0,4% 60.160 58.274 3,2%
Printing & Writing 143.457 144.808 -0,9% 148.364 -3,3% 291.822 288.867 1,0%
Other paper1 22.798 7.148 218,9% 10.303 121,3% 33.101 13.359 147,8%
Total sales volume 1.085.360 1.188.477 -8,7% 1.160.078 -6,4% 2.245.438 2.368.512 -5,2%
Pulp 801.751 916.529 -12,5% 876.037 -8,5% 1.677.787 1.831.919 -8,4%
Paper 283.610 271.948 4,3% 284.041 -0,2% 567.651 536.594 5,8%
Paperboard 42.418 44.911 -5,6% 44.353 -4,4% 86.771 88.309 -1,7%
Printing & Writing 218.393 219.889 -0,7% 229.385 -4,8% 447.779 434.925 3,0%
Other paper1 22.798 7.148 218,9% 10.303 121,3% 33.101 13.359 147,8%
Average net price (R$/ton) 2Q18 2Q17 Δ Y-o-Y 1Q18 Δ Q-o-Q 6M18 6M17 Δ Y-o-Y
Exports 2.809 1.983 41,6% 2.462 14,1% 2.628 1.851 42,0%
Pulp 2.719 1.886 44,1% 2.390 13,8% 2.548 1.751 45,5%
Paper 3.567 2.854 25,0% 3.065 16,4% 3.305 2.771 19,3%
Domestic Market 3.402 2.624 29,6% 2.992 13,7% 3.194 2.569 24,3%
Pulp 2.346 1.548 51,5% 2.179 7,6% 2.254 1.468 53,5%
Paper 3.755 3.162 18,7% 3.340 12,4% 3.552 3.171 12,0%
Total 2.952 2.129 38,7% 2.585 14,2% 2.762 2.020 36,8%
Pulp 2.688 1.853 45,1% 2.370 13,4% 2.522 1.721 46,6%
Paper 3.697 3.058 20,9% 3.248 13,8% 3.472 3.040 14,2%
1 Paper from other manufacturers sold by the distributor and tissue paper.

Page 23 of 29
2Q18 EARNINGS RELEASE
APPENDIX 2 – Consolidated Statement of Income
Consolidated Financial Statement (R$ '000)
2Q18 2Q17 Δ Y-o-Y 1Q18 Δ Q-o-Q 6M18 6M17 Δ Y-o-Y
Net Revenue 3.203.795 2.529.870 26,6% 2.998.859 6,8% 6.202.654 4.783.778 29,7%
Cost of Goods Sold (1.678.574) (1.513.364) 10,9% (1.585.926) 5,8% (3.264.500) (3.079.908) 6,0%
Gross Profit 1.525.221 1.016.506 50,0% 1.412.933 7,9% 2.938.154 1.703.870 72,4%
Gross Margin 47,6% 40,2% 7,4 p.p. 47,1% 0,5 p.p. 47,4% 35,6% 11,8 p.p.
Operating Expense/Income (354.713) (208.188) 70,4% (279.230) 27,0% (633.943) (426.865) 48,5%
Selling Expenses (150.305) (94.418) 59,2% (121.957) 23,2% (272.262) (195.042) 39,6%
General and Administrative Expenses
(203.667) (120.691) 68,8% (147.353) 38,2% (351.020) (232.288) 51,1%
Other Operating Income (Expenses)
(673) 2.917 -123,1% (9.867) -93,2% (10.540) (4.357) 141,9%
Equity Equivalence (68) 4.004 -101,7% (53) 28,3% (121) 4.822 -102,5%
EBIT 1.170.508 808.318 44,8% 1.133.703 3,2% 2.304.211 1.277.005 80,4%
Depreciation, Amortization & Depletion
374.932 332.615 12,7% 384.938 -2,6% 759.870 698.343 8,8%
EBITDA 1.545.440 1.140.933 35,5% 1.518.641 1,8% 3.064.081 1.975.348 55,1%
EBITDA Margin (%) 48,2% 45,1% 3,1 p.p. 50,6% -2,4 p.p. 49,4% 41,3% 8,1 p.p.
Adjusted EBITDA1 1.572.729 1.156.566 36,0% 1.528.283 2,9% 3.101.011 2.003.916 54,7%
Adjusted EBITDA Margin1 49,1% 45,7% 3,4 p.p. 51,0% -1,9 p.p. 50,0% 41,9% 8,1 p.p.
Net Financial Result (3.969.632) (677.917) 485,6% (157.350) 2422,8% (4.126.982) (552.743) 646,6%
Financial Expenses 45.007 83.611 -46,2% 36.726 22,5% 81.733 182.286 -55,2%
Financial Revenues (325.521) (278.630) 16,8% (234.273) 38,9% (559.794) (560.793) -0,2%
Exchange Rate Variation (1.139.051) (348.746) 226,6% (28.406) 3909,9% (1.167.457) (177.905) 556,2%
Net Proceeds Generated by Derivatives
(2.550.067) (134.152) 1800,9% 68.603 -3817,1% (2.481.464) 3.669 -67733,3%
Earnings Before Taxes (2.799.124) 130.401 -2246,6% 976.353 -386,7% (1.822.771) 724.262 -351,7%
Income and Social Contribution Taxes
950.153 68.143 1294,4% (163.226) -682,1% 786.927 (75.571) -1141,3%
Net Income (Loss) (1.848.971) 198.544 -1031,3% 813.127 -327,4% (1.035.844) 648.691 -259,7%
Net Margin -57,7% 7,8% -65,6 p.p. 27,1% -84,8 p.p. -16,7% 13,6% -30,3 p.p.
1 Excluding non-recurring items.

Page 24 of 29
2Q18 EARNINGS RELEASE
APPENDIX 3 – Consolidated Balance Sheet
Assets (R$ '000) 06/30/2018 03/31/2018 12/31/2017 09/30/2017 06/30/2017
Current Assets
Cash and Cash Equivalent 3.624.737 2.000.336 1.076.833 1.439.776 1.001.883
Financial Investments 4.402.785 1.391.669 1.631.505 2.410.173 2.628.886
Accounts Receivable 2.325.251 2.389.398 2.303.810 1.862.202 1.891.698
Inventories 1.477.406 1.321.436 1.207.961 1.408.791 1.336.768
Recoverable Taxes 365.551 320.038 306.140 423.523 415.056
Prepaid Expenses 132.027 182.593 37.016 52.317 51.823
Other Current Assets 451.108 278.188 233.610 398.580 339.164
Total Current Assets 12.778.865 7.883.658 6.796.875 7.995.362 7.665.278
Non-Current Assets
Other Accounts Receivable 1.022.984 816.295 770.792 793.692 784.042
Biological Assets 4.697.542 4.579.097 4.548.897 4.248.989 4.228.301
Investments 6.643 6.712 6.764 5.706 5.716
Property, Plant and Equipment 16.648.885 16.415.548 16.211.228 16.195.420 16.172.254
Intangible Assets 389.624 375.027 188.426 204.202 208.777
Total Non-Current Assets 22.765.678 22.192.679 21.726.107 21.448.009 21.399.090
Total Assets 35.544.543 30.076.337 28.522.982 29.443.371 29.064.368
Liabilities and Equity (R$ '000) 06/30/2018 03/31/2018 12/31/2017 09/30/2017 06/30/2017
Current Liabilities
Accounts Payable 646.969 600.564 610.476 641.537 614.587
Loans and Financing 1.694.415 1.432.974 2.115.067 1.785.368 1.995.621
Tax Liabilities 281.530 185.541 125.847 199.090 147.489
Salaries and Payroll Taxes 204.016 154.829 196.467 194.926 177.470
Other Payable 1.277.304 696.906 660.506 593.297 673.846
Total Current Liabilities 4.104.234 3.070.814 3.708.363 3.414.218 3.609.013
Non-Current Liabilities
Loans and Financing 16.268.057 11.213.131 10.076.789 11.347.543 11.646.806
Deferred Taxes 682.040 1.857.237 1.789.960 1.775.084 1.548.263
Provision 797.148 726.336 706.652 675.062 649.041
Other Liabilities 2.981.611 742.506 619.664 625.390 783.753
Total Non-Current Liabilities 20.728.856 14.539.210 13.193.065 14.423.079 14.627.863
Shareholders’ Equity
Share Capital 6.241.753 6.241.753 6.241.753 6.241.753 6.241.753
Capital Reserve 380.563 380.564 394.801 197.837 197.475
Treasury shares (218.265) (218.265) (241.088) (241.006) (241.006)
Profit Reserve 2.897.784 2.927.760 2.927.760 1.657.125 1.657.125
Equity Valuation Adjustment 2.395.646 2.295.927 2.298.328 2.273.885 2.308.364
Retained Earnings/Accumulated Losses 41.868 16.675 - 26.913 15.090
Retained Earnings/Losses of the period (1.036.430) 813.127 - 1.449.567 648.691
Total Equity 10.702.919 12.457.541 11.621.554 11.606.074 10.827.492
Non-controlling shareholders interests 8.534 8.772 - - -
Total Liabilities and Equity 35.544.543 30.076.337 28.522.982 29.443.371 29.064.368

Page 25 of 29
2Q18 EARNINGS RELEASE
APPENDIX 4 – Consolidated Statement of Cash Flow
Cash Flow Statement (R$ '000) 2Q18 2Q17 6M18 6M17
Cash flow from operating activities
Net income/(loss) for the period (1.848.971) 198.544 (1.035.844) 648.691
Depreciation, depletion and amortization 374.932 332.615 759.870 698.343
Income from sale of fixed and biological assets 4.573 (740) 5.079 (4.128)
Equity pick-up in subsidiaries and affiliates 68 (4.004) 121 (4.822)
Exchange and monetary variations, net 1.302.367 319.673 1.319.020 59.521
Interest expenses, net 168.368 196.353 329.057 376.873
Derivative gains, net 2.550.067 134.152 2.481.464 (3.669)
Expenses from deferred income and social contribution taxes (1.175.250) (124.958) (1.109.800) (10.833)
Interest on actuarial liabilities 8.617 9.506 17.234 19.012
Provision/ (reversal) for contingencies 27.727 8.868 27.960 17.092
Provision/ (reversal) for share-based payments 57.395 12.155 76.657 18.756
Addition to allowance for doubtful accounts, net (1.369) 5.105 4.923 8.609
Provision/ (reversal) for discounts - loyalty program 27.903 20.689 11.286 (15.876)
Provision/ (reversal) for inventory losses and write-offs 21.418 1.132 18.373 1.705
Provision for losses and write-off with fixed and biological assets 3.317 769 12.299 3.923
Fair value adjustment of biological assets (5.954) 25.268 (5.954) 25.268
Other provisions /(reversals) (7.248) (44.980) (14.631) (22.702)
Increase / (decrease) in accounts receivable 59.661 (280.014) 45.422 (289.674)
Decrease/ (increase) in inventories (177.958) (85.839) (266.244) (28.357)
Decrease/ (increase) in recoverable taxes (6.999) (22.942) (5.758) (26.683)
Increase / (decrease) in other current and non-current assets 39.370 232.822 (191.703) 330.593
Decrease / (increase) in trade accounts payable 2.576 117.796 (8.327) 85.902
Increase/(decrease) in other current and non-current liabilities 130.161 (264.870) 350.890 (196.128)
Taxes payable 402.361 433.560 402.361 433.560
Payment of interest (175.720) (261.169) (370.122) (507.637)
Payment of other taxes and contributions (84.171) (126.912) (238.652) (265.931)
Payment of income and social contribution taxes (53.035) (34.650) (64.080) (52.836)
Net cash from operating activities 1.644.206 797.929 2.550.901 1.298.572
Cash flow from investing activities
Financial investments (2.981.934) 482.326 (2.716.934) (430.037)
Cash from the acquisition of subsidiaries - - 21.436 -
Acquisition of subsidiaries (6.032) - (315.904) -
Additions to fixed assets, intangible assets and biological assets (749.620) (470.743) (1.098.623) (824.102)
Proceeds from asset divestment 16.822 1.038 31.865 9.547
Net cash (used in) / provided by investment activities (3.720.764) 12.621 (4.078.160) (1.244.592)
Cash flow from financing activities
Funding 5.015.119 76.591 7.491.201 1.085.960
Settlement of derivative operations (182.398) 65.379 (169.362) 162.333
Payment of loans (1.079.938) (585.756) (3.214.568) (1.528.449)
Payment of dividends (210.205) (370.739) (210.205) (370.739)
Dividends (acquisition) of own shares - - 8.514 8.514
Payment of debts with acquisition of assets (3.071) (50.446) (3.071) (50.446)
Net cash (used in) / provided by financing activities 3.539.507 (864.971) 3.902.509 (692.827)
Exchange variation on cash and cash equivalents 161.452 50.960 172.654 26.033
Increase (reduction) in cash and cash equivalents 1.624.401 (3.461) 2.547.904 (612.814)
Cash and cash equivalents at the beginning of the period 2.000.336 1.005.344 1.076.833 1.614.697
Cash and cash equivalents at the end of the period 3.624.737 1.001.883 3.624.737 1.001.883
Statement of the increase (reduction) in cash 1.624.401 (3.461) 2.547.904 (612.814)

Page 26 of 29
2Q18 EARNINGS RELEASE
APPENDIX 5 – EBITDA
(R$ '000, except where otherwise indicated) 2Q18 2Q17 6M18 6M17
Net Income (1.848.971) 198.544 (1.035.844) 648.691
Net Financial Result 3.969.632 677.917 4.126.982 552.743
Income and Social Contribution Taxes (950.153) (68.143) (786.927) 75.571
EBIT 1.170.508 808.318 2.304.211 1.277.005
Depreciation, Amortization and Depletion 374.932 332.615 759.870 698.343
EBITDA1 1.545.440 1.140.933 3.064.081 1.975.348
EBITDA Margin 48,2% 45,1% 49,4% 41,3%
Write-downs of inventories. 17.092 - 17.092 -
Expenses with Fibria's transaction 16.248 - 17.787 -
Equity equivalence 68 (4.004) 121 (4.822)
Adjustment of the fair value of biological assets (5.954) 25.268 (5.954) 25.268
Provision (Reversion) for losses with fixed assets, write-offs, taxes - - 7.366 1.157
Land conflict agreement - - - 11.779
Others (165) (5.631) 518 (4.814)
Adjusted EBITDA 1.572.729 1.156.566 3.101.011 2.003.916
Adjusted EBITDA Margin 49,1% 45,7% 50,0% 41,9%
1 The Company's EBITDA is calculated in accordance with CVM Instruction 527 of October 4, 2012.

Page 27 of 29
2Q18 EARNINGS RELEASE
APPENDIX 6 – Segmented Statement of Income
Financial Statement (R$ '000) 2Q18 2Q17
Pulp Paper Non
Segmented Total
Consolidated Pulp Paper
Non Segmented
Total Consolidated
Net Revenue 2.155.179 1.048.615 - 3.203.793 1.698.150 831.720 - 2.529.870
Cost of Goods Sold (980.974) (697.598) - (1.678.572) (920.630) (592.733) - (1.513.364)
Gross Profit 1.174.205 351.017 - 1.525.222 777.519 238.986 - 1.016.506
Gross Margin 54,5% 33,5% 47,6% 45,8% 28,7% 40,2%
Operating Expense/Income (122.660) (232.054) - (354.714) (78.443) (146.904) 17.159 (208.188)
Selling Expenses (55.256) (95.049) - (150.305) (34.731) (59.687) - (94.418)
General and Administrative Expenses (67.495) (136.173) - (203.668) (42.242) (78.449) - (120.691)
Other Operating Income (Expenses) 91 (764) - (673) (1.470) (12.772) 17.159 2.917
Equity Equivalence - (68) - (68) - 4.004 - 4.004
EBIT 1.051.545 118.962 - 1.170.508 699.076 92.082 17.159 808.318
Depreciation, Amortization & Depletion 263.145 111.788 - 374.932 240.626 91.990 - 332.615
EBITDA 1.314.690 230.818 - 1.545.508 939.702 180.068 17.159 1.136.929
EBITDA Margin (%) 61,0% 22,0% 48,2% 55,3% 21,7% 44,9%
Adjusted EBITDA1 1.319.798 252.932 - 1.572.729 946.576 192.831 17.159 1.156.566
Adjusted EBITDA Margin1 61,2% 24,1% 49,1% 55,7% 23,2% 45,7%
Net Financial Result - - (3.969.632) (3.969.632) - - (677.917) (677.917)
Earnings Before Taxes 1.051.545 118.962 (3.969.632) (2.799.124) 699.076 92.082 (660.758) 130.401
Income and Social Contribution Taxes - - 950.153 950.153 - - 68.143 68.143
Net Income (Loss) 1.051.545 118.962 (3.019.479) (1.848.971) 699.076 92.082 (592.615) 198.544
Net Margin 48,8% 11,3% -57,7% 41,2% 11,1% 7,8%
1 Excluding non-recurring items.

Page 28 of 29
2Q18 EARNINGS RELEASE
Financial Statement (R$ '000) 6M18 6M17
Pulp Paper Non
Segmented Total
Consolidated Pulp Paper
Non Segmented
Total Consolidated
Net Revenue 4.231.505 1.971.148 - 6.202.653 3.152.589 1.631.189 - 4.783.778
Cost of Goods Sold (1.944.142) (1.320.356) - (3.264.498) (1.894.358) (1.185.550) - (3.079.908)
Gross Profit 2.287.364 650.792 - 2.938.155 1.258.231 445.639 - 1.703.870
Gross Margin 54,1% 33,0% 47,4% 39,9% 27,3% 35,6%
Operating Expense/Income (231.988) (401.956) - (633.944) (172.336) (271.688) 17.159 (426.865)
Selling Expenses (103.087) (169.175) - (272.262) (75.132) (119.911) - (195.042)
General and Administrative Expenses (118.191) (232.830) - (351.021) (81.301) (150.987) - (232.288)
Other Operating Income (Expenses) (10.710) 170 - (10.540) (15.903) (5.613) 17.159 (4.357)
Equity Equivalence - (121) - (121) - 4.822 - 4.822
EBIT 2.055.375 248.836 - 2.304.211 1.085.895 173.951 17.159 1.277.005
Depreciation, Amortization & Depletion 537.337 222.534 - 759.871 503.808 194.535 - 698.343
EBITDA 2.592.712 471.491 - 3.064.203 1.589.703 363.664 17.159 1.970.526
EBITDA Margin (%) 61,3% 23,9% 49,4% 50,4% 22,3% 41,2%
Adjusted EBITDA1 2.605.088 495.925 - 3.101.013 1.608.264 378.492 17.159 2.003.915
Adjusted EBITDA Margin1 61,6% 25,2% 50,0% 51,0% 23,2% 41,9%
Net Financial Result - - (4.126.982) (4.126.982) - - (552.743) (552.743)
Earnings Before Taxes 2.055.375 248.836 (4.126.982) (1.822.771) 1.085.895 173.951 (535.584) 724.262
Income and Social Contribution Taxes - - 786.927 786.927 - - (75.571) (75.571)
Net Income (Loss) 2.055.375 248.836 (3.340.055) (1.035.844) 1.085.895 173.951 (611.155) 648.691
Net Margin 48,6% 12,6% -16,7% 34,4% 10,7% 13,6%
1 Excluding non-recurring items.

Page 29 of 29
2Q18 EARNINGS RELEASE
Corporate Information Suzano Pulp and Paper, which reported net revenue of R$10.5 billion in 2017, is one of the largest vertically integrated producers of paper and eucalyptus pulp in Latin America, with annual production capacity of 3.6 million tons of market pulp and 1.2 million tons of paper. Suzano Pulp and Paper offers a broad range of pulp and paper products for the domestic and export markets: (i) eucalyptus pulp;(ii) hardwood fluff pulp;(iii) uncoated printing and writing paper;(iv) coated printing and writing paper;(v) paperboard;and (vi) tissue paper. Forward-looking Statements This release may contain forward-looking statements. Such statements are subject to known and unknown risks and uncertainties that could cause the expectations expressed not to materialize or to differ substantially from the expected results. These risks include changes in future demand for the Company’s products, changes in factors affecting domestic and international product prices, changes in the cost structure, changes in the seasonal patterns of markets, changes in prices charged by competitors, foreign exchange variations, changes in the political or economic situation of Brazil, and changes in emerging and international markets. The forward-looking statements were not reviewed by our independent auditors.