3 exsiting ports and shipping services - jicaopen_jicareport.jica.go.jp/pdf/11868650_02.pdf · 3...
TRANSCRIPT

The Study for Development of the Greater Surabaya Metropolitan Ports in the Republic of Indonesia Final Report
3-1
3 EXSITING PORTS AND SHIPPING SERVICES
3.1 Overall Metropolitan Ports System
1) Port Classification and Port Jurisdiction
a. Port Classification
In the study area of Surabaya, Gresik, Lamongan, Bangkalan, there are one Hub International Port (Tanjung Perak), two National Ports (Gresik, Kamal), one Regional Ports (Telagabiru) and one Local Port (Sepulu) (see Table 3.1.1 and Figure 3.1.1). There are also one Special Port at Gresil (Semen Gresil) and two Ferry Terminals (Kamal and Gresik). Port of Brondong is located at the north shore of Lamongan and faces to the Jawa Sea, so it can be excluded from the list of study ports
Port of Tanjung Perak and Port of Gresik are managed by PELINDO III and others are managed directly by the central government.
Table 3.1.1 Port Classification in the Study Area
Class Type of Port Name of Port I International Hub Port Tanjung Perak II International Port Main Port III National Port Gresik, Kamal I Regional Port Telaga, Biru Feeder
Port II Local Port Sepulu Note: based on the Government Decree Number KM.53 of 2002
Figure 3.1.1 Existing Ports Location in the Study Area
Source: JICA Study Team

The Study for Development of the Greater Surabaya Metropolitan Ports in the Republic of Indonesia Final Report
3-2
b. Port Jurisdiction
Surabaya Port Area was designated for ship navigation and safety based on No.KM22 of 1990. and is managed by the Ministry of Transport. This area consists of land and water areas which are designated as government and economic activity areas used for ship transportation, passenger movement, cargo handling and other relevant activities. It is classified into the Port Working Area (DLKR) and Port Interest Surrounding Area (DLKP) – although technically, DLKP includes the DLKR (see Figure 3.1.2). DLKR is the waters and land area in the public port used directly for port activity, and DLKP is the waters area surrounding waters working area used for facilitating ship safety and possible future development areas thereby the DLKP is inclusive of DLKR.
Figure 3.1.2 Port Area
Source: Ministry of Transport
DLKR of Tanjung Perak Port is designated pursuant to the Joint Ministerial Decree of Communication and the Minister of Home Affairs No. 91 of 1981 and No. KM. 110/AL. 106/Phb-81 dated April 21, 1981. Meanwhile, DLKR of Gresik Port is designated pursuant to the Joint Decree, the Minister of Communication and the Minister of Home Affairs No. 169 of 1996 and No. KM. 63 of 1996 dated October 2, 1996. The area sizes of the two DLKR is summarized in Table 3.1.2. The DLKP exclusive of the two DLKR is 35,125 ha (i.e. north of DLKR of Gresik).
Table 3.1.2 Area Size of DLKR
Tanjung Priok Gresik Land Area (ha) 517.64 96.4 Water Area (ha) 4,675.59 8,149.5 Source: PELINDO III
The port working area (DLKR) of Tanjung Perak consists of land and water areas of 517.64 ha and 4675.59 ha, respectively. Breakdown of land area usage is specified as shown Table 3.1.3. The water area is managed by PELINDO III and the land is owned by the central government,

The Study for Development of the Greater Surabaya Metropolitan Ports in the Republic of Indonesia Final Report
3-3
ritim eransportation
○
assport C ontrol ○
nternationalading
○○ (Anim al/Plant/ Food)
afety & Security ○ ○(Sm uggling) ○ ○
Health &Environm ent
○ (O il SpillAccident)
○ ○
Relevant O rganization
upervising Field
but land management is entrusted to PELINDO III. Presently, some parts of the lands are leased to industrial companies, maritime business companies and individuals by PELINDO III.
Table 3.1.3 Land Use of Port of Tanjung Perak
Land Use Area (m2) Share (%) Terminal 2,227,395 43.0 Port Related Industry 553,606 10.7 Maritime Business Complex 645,782 12.5 Business Center 146,124 2.8 Cargo Distribution District 487,253 9.4 Truck Terminal 64,650 1.2
Sub Total 4,124,810 79.7 Others 1,051,590 20.3
Total 5,176,400 100.0 Source: PELINDO III
2) Port Management, Maritime Safety and Security
a. Port Related Government Agency
M aT
P
ITr
S
S PortAdm inistrator
C ustom s O fficeIm m igration
O fficePort Doctor Q uarantine O ffice Port Police
Port is a gateway for international and domestic trade and a junction for various transportation modes through maritime transportation. Therefore port activities are related to various administrative organizations and business sectors. Therefore port activities are supervised and controlled from various points of view, such as maritime transportation, passport control, international trade, safety & security and health & environment by relevant government agencies. (see Table 3.1.4)
Table 3.1.4 Port Related Government Agency
Source: Based on the hearing by the Study Team
In the Study Area, there are two ADPEL offices at Tanjung Perak and Gresik. There are 6 classes of port administrator and Tanjung Perak is designated as ‘Class Main’ together with three other offices, Tanjung Priok, Belawan and Makassar, while Gresik is designated as ‘Class II’. The ADPEL office has four divisions and except for administration division are respectively under three directorates of DGST, Ministry of Transport..
As for maritime transportation, Port Administrator (ADPEL) Office of Tanjung Perak has the responsibility of making sure of smooth and safe ship navigation and cargo handling in cooperation with other relevant agencies. The Tanjung Perak ADPEL has the following organization:

The Study for Development of the Greater Surabaya Metropolitan Ports in the Republic of Indonesia Final Report
3-4
Table3.1.5 Number of Personnel of ADPEL Tanjung Perak
Administration Div.
Sea Transport & Traffic Div.
Marine Safety Div.
Coast Guard Div. Total
Number of Personnel 51 38 55 229 373
Source: ADPEL, as of Aug. 2007
The Sea Transport & Traffic Division is in charge of supervision of maritime transportation by giving permission for port arrival and departure. In addition to that, it oversees the TKBM (Tenaga Kerjasama Bongkar Muat; Cargo Handling Workers Cooperation) in order to secure both efficient port activity and stable port worker’s employment condition.. Its main tasks are as follows:
• Supervising sea transportation, traffic activities and relevant port activities
• Tariff implementation monitoring
• Monitoring harbor workers’ employment condition through TKBM’s activity and supervising sea employment agreement
• Supervising port facility safety, development and modification of port facilities, port operation and shipping lines.
The Coast Guard Division is in charge of harbor-mastering and security patrol, as well as, overseeing the handling of dangerous cargo and pollution prevention. Its main tasks are as follows:
• Executing orders and rules related to security and safety in the field of shipping and sea, port crime
The Tanjung Perak ADPEL Cost Guard Divisions has about 229 officials and four patrol boats (300 HP), two patrol cars and two X-ray inspection units (which were donated by JICA and are installed at the passenger terminal, but are not working now for the reason of lack of maintenance and spare parts).
Finally, the Marine Safety Division is in charge of supervising shipping requirement, shipping certificate and shipping security management verification. Its main tasks are as follows.
• Supervising shipping requirement and shipping license
• Checking ship development and modification, shipping security management verification and international certificate
• Executing measurement of ships in order to give them legal status, national certificate
• Setting up hypothec of ship including seamen document

The Study for Development of the Greater Surabaya Metropolitan Ports in the Republic of Indonesia Final Report
3-5
Figure 3.1.3 Relationship between DGST and ADPEL
Source: DGST & ADPEL
Additionally, the District Navigation Office is another frontline division but is directly under Directorate of Navigation、MOT. The office has the responsibility to promote marine security in accordance with Decree of KM Transportation No. 64, 2002. It operates and maintains sea navigational supporting facilities and maritime telecommunication, including 20 lighthouses, 38 buoys and a coastal radio station.
b. Port Management Body
PELINDO III was at first established as a State Enterprise in 1960, but after changes to its institutional nature, it was established as a state owned port corporation supervised by the Ministry of Communication and Ministry of State-Owned Enterprise in 1992. Its ownership is still 100% Indonesian Government. Its business covers a wide-range of port activities through providing water basin, wharfs, handling equipment and equipment for passengers, warehouses and stacking yards.
PELINDO III has 18 branch offices and 1 container terminal of Semarang. It also has 5 subsidiary companies including TPS and BJTI. Port of Tanjung Perak and Port of Gresik are each managed by a branch office of PELINDO III.
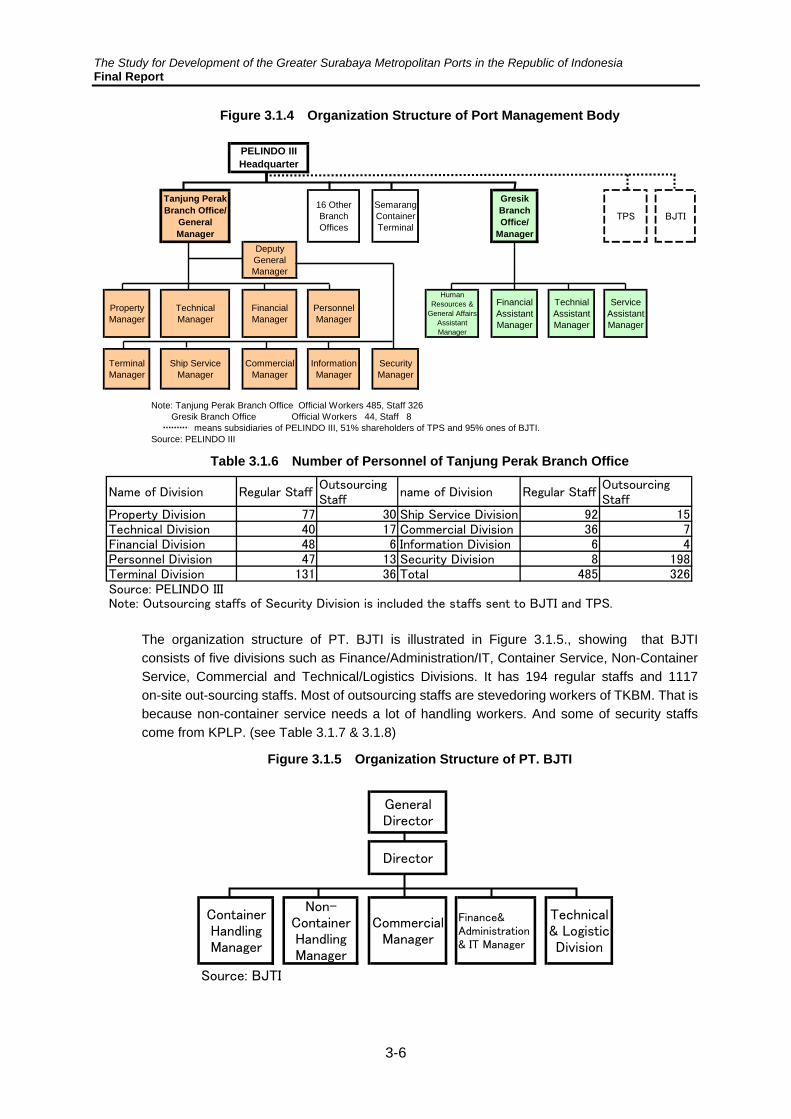
The Tanjung Perak Branch Office has eight divisions with 485 official workers and 198 outsourced staffs. However, TPS is managed completely by PT. TPS, which is one of PELINDO III’s subsidiary companies. Similarly, Berlian Terminal is managed by BJTI, which is also its subsidiary, but its berth allocation is controlled by Tanjung Perak Branch Office. (see Figure 3.1.4- 3.1.6, Table 3.1.6)
Meanwhile, Gresik Port is operated by its respective branch office, including cargo handling, but the coal handling is done by a private company. Gresik Branch Office has four divisions with 44 official workers and 8 staffs.
The Study for Development of the Greater Surabaya Metropolitan Ports in the Republic of Indonesia Final Report
3-6
Figure 3.1.4 Organization Structure of Port Management Body
GeneralDirector
Director
ContainerHandlingManager
Non-ContainerHandlingManager
CommercialManager
Finance&Administration& IT Manager
Technical& LogisticDivision
Source: BJTI
Name of Division Regular StaffOutsourcingStaff
name of Division Regular StaffOutsourcingStaff
Property Division 77 30 Ship Service Division 92 15Technical Division 40 17 Commercial Division 36 7Financial Division 48 6 Information Division 6 4Personnel Division 47 13 Security Division 8 198Terminal Division 131 36 Total 485 326Source: PELINDO IIINote: Outsourcing staffs of Security Division is included the staffs sent to BJTI and TPS.
Tanjung PerakBranch Office/
GeneralManager
16 OtherBranchOffices
SemarangContainerTerminal
GresikBranchOffice/
Manager
TPS BJTI
DeputyGeneralManager
PropertyManager
TechnicalManager
FinancialManager
PersonnelManager
HumanResources &
General AffairsAssistantManager
FinancialAssistantManager
TechnialAssistantManager
ServiceAssistantManager
TerminalManager
Ship ServiceManager
CommercialManager
InformationManager
SecurityManager
Source: PELINDO III
PELINDO IIIHeadquarter
Note: Tanjung Perak Branch Office Official Workers 485, Staff 326 Gresik Branch Office Official Workers 44, Staff 8 means subsidiaries of PELINDO III, 51% shareholders of TPS and 95% ones of BJTI.
Table 3.1.6 Number of Personnel of Tanjung Perak Branch Office
The organization structure of PT. BJTI is illustrated in Figure 3.1.5., showing that BJTI consists of five divisions such as Finance/Administration/IT, Container Service, Non-Container Service, Commercial and Technical/Logistics Divisions. It has 194 regular staffs and 1117 on-site out-sourcing staffs. Most of outsourcing staffs are stevedoring workers of TKBM. That is because non-container service needs a lot of handling workers. And some of security staffs come from KPLP. (see Table 3.1.7 & 3.1.8)
Figure 3.1.5 Organization Structure of PT. BJTI

The Study for Development of the Greater Surabaya Metropolitan Ports in the Republic of Indonesia Final Report
3-7
Table 3.1.7 BJTI’s Regular Member Table 3.1.8 BJTI’s Outsourcing Staff
Name of DivisionNumber ofEmployee
Finance & Administration &IT Division 24
Commercial Division 19
Container HandlingDivision
82
Non-Container HandlingDivision
35
Technical & LogisticDivision
34
Total 194
Source: BJTI
Note: General director & Director areincluded in the administration division.
JobNumber ofPersons Provider
Tally 75 Private CompanyStevedor 948 TKBM
Security 54KPLP &Private Company
Cleaning 40 Private CompanyTotal 1117
Source: BJTI
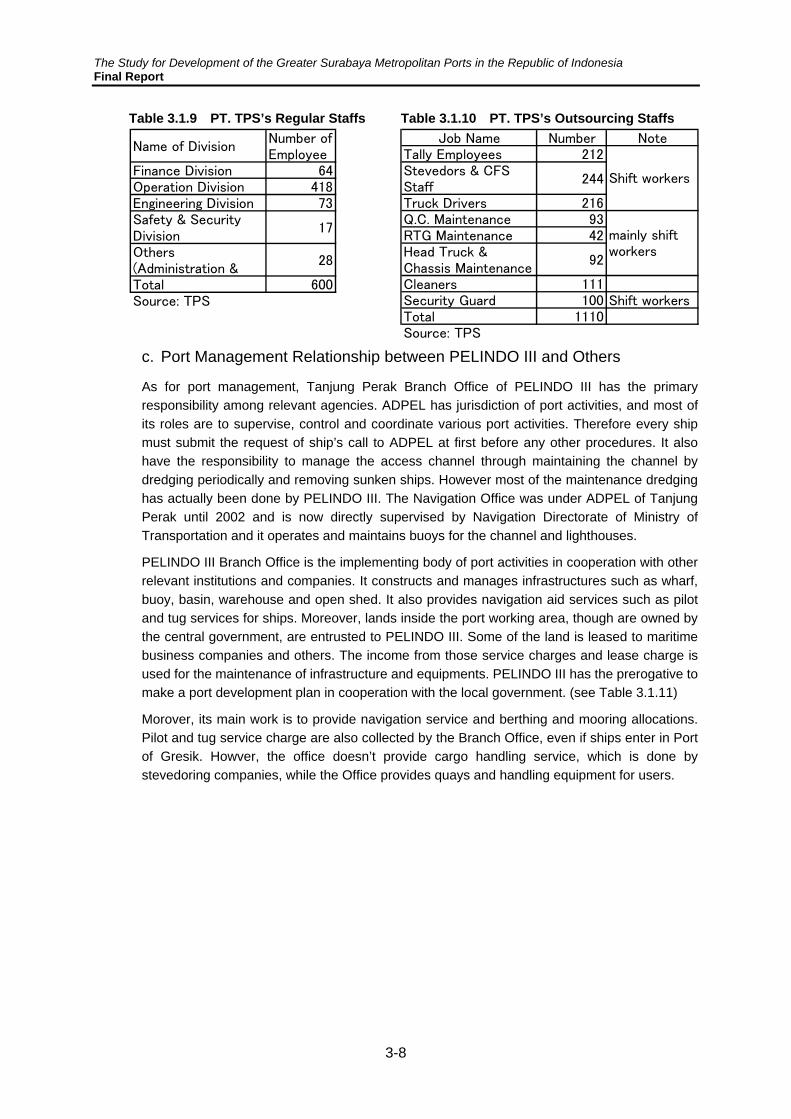
Figure 3.1.6 depicts the organization structure of PT. TPS, wherein TPS consists of 6 divisions, including Administration, Finance, Operation, Engineering, Human Resources and Safety/Security Divisions. Total regular staffs are 600 persons and 70% of the staffs are assigned to the operation division. Most of them are shift workers including some managers, operation planners, superintendents, drivers of quay-gantry cranes, RTGs and forklifts and document services staffs. Total outsourced staffs are 1110 persons, with most of them are shift workers, including tally clerks, stevedores and CFS staffs, chassis-truck drivers, equipment maintenance staffs, cleaners and security guards. Shifting is done at intervals of 8 hours by 4 groups, working 6 days and with 2 days off. Stevedores carry out all the work on board vessels and in the CFS, there are 6 workers per gantry crane. (see Table 3.1.9 & 3.1.10)
It is notable that TPS contributes to the community through TPS community development fund. It is said to have provided for road renovation and school construction and so on.
Figure 3.1.6 Organization Structure of PT. TPS
PresidentDirector
VicePresidentDirector
OperationDirector
FinanceDirector
EngineeringDirector
AdministrationManager
TerminalOperationManager
FinanceManager
EngineeringManager
HumanResourceManager
Safety &SecurityManager
YardOperationManager
FinanceDeputyManager
ShipsOperationManager
InformationTechnology
DeputyManager
CommunityDevelopment
FundAssisstantManager
Source: TPS
ShiftManagers(4 Groop
Managers)
The Study for Development of the Greater Surabaya Metropolitan Ports in the Republic of Indonesia Final Report
3-8
Table 3.1.9 PT. TPS’s Regular Staffs Table 3.1.10 PT. TPS’s Outsourcing Staffs
Name of DivisionNumber ofEmployee
Finance Division 64Operation Division 418Engineering Division 73Safety & SecurityDivision
17
Others(Administration &
28
Total 600Source: TPS
Job Name Number NoteTally Employees 212Stevedors & CFSStaff
244
Truck Drivers 216Q.C. Maintenance 93RTG Maintenance 42Head Truck &Chassis Maintenance
92
Cleaners 111Security Guard 100 Shift workersTotal 1110Source: TPS
Shift workers
mainly shiftworkers
c. Port Management Relationship between PELINDO III and Others
As for port management, Tanjung Perak Branch Office of PELINDO III has the primary responsibility among relevant agencies. ADPEL has jurisdiction of port activities, and most of its roles are to supervise, control and coordinate various port activities. Therefore every ship must submit the request of ship’s call to ADPEL at first before any other procedures. It also have the responsibility to manage the access channel through maintaining the channel by dredging periodically and removing sunken ships. However most of the maintenance dredging has actually been done by PELINDO III. The Navigation Office was under ADPEL of Tanjung Perak until 2002 and is now directly supervised by Navigation Directorate of Ministry of Transportation and it operates and maintains buoys for the channel and lighthouses.
PELINDO III Branch Office is the implementing body of port activities in cooperation with other relevant institutions and companies. It constructs and manages infrastructures such as wharf, buoy, basin, warehouse and open shed. It also provides navigation aid services such as pilot and tug services for ships. Moreover, lands inside the port working area, though are owned by the central government, are entrusted to PELINDO III. Some of the land is leased to maritime business companies and others. The income from those service charges and lease charge is used for the maintenance of infrastructure and equipments. PELINDO III has the prerogative to make a port development plan in cooperation with the local government. (see Table 3.1.11)
Morover, its main work is to provide navigation service and berthing and mooring allocations. Pilot and tug service charge are also collected by the Branch Office, even if ships enter in Port of Gresik. Howver, the office doesn’t provide cargo handling service, which is done by stevedoring companies, while the Office provides quays and handling equipment for users.

The Study for Development of the Greater Surabaya Metropolitan Ports in the Republic of Indonesia Final Report
3-9
Table 3.1.11 Port Management Relationship between PELINDO III and Others at Tg. Perak
Port ManagementProcedure
ADPEL PELINDO III TPS BJTI
Permission ofPort's Call
◎ ○TPS also gets its copy through
agents.BJTI also gets its copy
through agents.
ProvidingNavigation Service
- ◎ - -
Allocation ofBerthing/Mooring
Every ship using KalimasTerminal must get permission of
its using from ADPEL andPELINDO III one day before itsarrival. But there is no berthallocation and ship owner can
berth anywhere if it is possible.
◎◎ (TPS make berthing
allocation on its own plan.)Berthing/Mooring allocation
is done by PELINDO III.
Providing of CargoHandling/YardOperationService
ADPEL supoervises TKBM.
PELINDO III doesn't makecargo handling service.
Stevedors provide the workersthrough TKBM.
◎ (TPS uses stevedors andalso asked TKBM to provide
workers directly.)
◎ (BJTI asked stevedorsand also asked TKBM toprovide workers directly.)
Permission ofHandlingDangerous Cargo
◎◎ (PELINDO III designate the
place to handle for ships.)
Water SupplyService
-
◎ (PELINDO III supply watersto not only ships ,but also
other institution and companywhich work in port area.)
○ (PELINDO III supply waterto TPS and TPS supply water
to ships).)
PELINDO III supply water toBJTI's shipping users.
Safety & SecurityControl
◎ (ADPEL has primaryresponsibility on safety and
security, especially in water area.)
◎ (PELINDO III has theresponsibility on safety and
security in the DKLR,especially terminal area except
for TPS.)
◎ (TPS has responsibilityonsafety and security in TPS's
terminal.)
○ (BJTI control its terminalbased on the direction of
PELINDO III.)
Source: Based on the hearing by the Study Team
TPS and BJTI is delegated some parts of roles of the Branch Office related to their leasing of terminal. TPS’s and BJTI’s users must rely on navigation assistance of the Branch Office from the entrance of the channel to berthing. After berthing, every operation is done by TPS and BJTI themselves, for instance TPS and BJTI do the stevedoring work by themselves. TPS can assign berths to ship users, but the berth assignment of Berlian Terminal is still managed by the Branch Office. And Water supply service in the port area is done by the Branch Office. (see Table 3.1.12)

The Study for Development of the Greater Surabaya Metropolitan Ports in the Republic of Indonesia Final Report
3-10
Table 3.1.12 Terminal Management of Tanjung Perak
ConventionalTerminal BJTI TPS
P3 P3/BJTI TPSAccess ChannelWater Basin
CG entrusted P3 touse the land.
P3 leased the land toBJTI. P3 leased the land to TPS
Terminal Infrastructure
Handling EquipmentP3 & PS (Most of
equipment areprovided by PS)
P3 & BJTI & PS TPS
ChannelNavigation Aid EquipmentAnchorage AreaBasin
Berthing FacilityImprovement &
maintenance of the quayis done by P3
Construction of new quaywould be done by P3, butthe maintenance work by
TPS.
Access BridgeBridge improvement andmaintenance works by
TPS.
Quay-side (Gantry) Crane P3
Procurement of newcranes would be done by
BJTI. Management isdone by BJTI.
TPS
Other Cargo HandlingEquipment
P3 & PS (Most ofequipment are
provided by PS)BJTI TPS
Terminal Security (Water)
(Land) P3 BJTI TPSPilot ServiceTug ServiceCargo Handling Service PS BJTI TPS
Laber Supply ServiceTPS except onboard
stevedoring service byTKBM
Water Supply Service P3 P3 P3/TPS
Public Service Port Landlord Port (PublicPartly Initiative Operation)
Landlord Port (PrivateInitiative Operation)
Note: Source:
P3P3
TKBM
CG - Central Government, P3 - PELINDO III, PS - Private Sector or JV Company
(Not applicable)
CG (ADPEL)
P3Water area is managed and operated by P3
P3Large scale improvementwould be done by P3, butsmall scale one by BJTI.
Yard and CFS should beimproved by TPS
CG
P3
CG & P3CG
Making Port Development Plans CG/P3Making Terminal Development Plan
OwnershipLand
CG
Compiled information of PELINDO III, ADPEL, TPS, NAVIGASI
Tanjung Perak Name of TerminalItems
Yard Area & relatedBuilding
OperationalService
CG
Type of Port Management
Constructionor
Procurement/Management

The Study for Development of the Greater Surabaya Metropolitan Ports in the Republic of Indonesia Final Report
3-11
d. Channel Management and Operation
Channel management and operation is one the most important jobs for port activities in Surabaya. Most of ships except for the traffic to and from Madura Island must pass through the West Channel in order to enter in and depart from various public and private terminals and those ships must follow the navigation rules at Surabaya.
District Navigation Class I Surabaya operates 20 lighthouses and 38 buoys and provides the necessary information to ships by radio in order to secure safety of navigation. Meanwhile, channel maintenance is primarily responsible to DGST but, as a matter of fact, it is done by PELINDO III, Tanjung Perak Branch Office. The cost incurred is settled later by following the respective procedure between the central government and a state-owned enterprise. The Branch Office also provides pilot service and tug service for not only ship users of Tanjung Perak Port, but also those of Gresik Port. TPS users just send their information of ship-calls to the Branch Office, then, the Office will provide a pilot boat and tug boats based on their request. However users, who use BJTI terminal, other conventional terminal and private facilities at Tanjung Perak Port and Gresik Port must send their information of ship-calls and the Office will decide the ship service operation plan in coordination with users every previous day before the scheduled ship arrival.
ADPEL supervises the marine traffic with patrol boats and if a ship accident happens in the channel, ADPEL must clear the ships out from the channel in order to restore channel navigation as soon as possible.
Table 3.1.13 Responsible Body of Channel management & Operation
Responsible Body Services Periodical dredging for channel maintenance (on behalf of DGST)
Tg. Perak Office, PELINDO III
Navigational aids (pilotage, tug) ADPEL of Tg. Perak Supervision of channel traffic (patrol)
Visible aids to navigation (lighthouse, buoy) District Navigation Office Navigation information (radio, VTS)
Source: Based on the hearing by the Study Team
e. Ship and Cargo Service Procedure
Ship and cargo service procedure at Tanjung Perak Port is as follows;
• Shipping agents must submit the information of their ship’s call with necessary documents 48hours before their arriving.
• ADPEL of Tanjung Perak accepts or denies permission for ship call.
• Shipping agents submit the request of operational services to the Branch Office of PELINDO III with the copy of ship’s call permission by ADPEL and the information on the loading/unloading plan 24 hours before ship’s arrival.
• Shipping agents also submit the copy of the permission to Customs Office, Immigration Office, Quarantine Office, Animal/Plant Quarantine Office and Port Police.
• The copy of the permission is also sent to the terminal operator like TPS and BJTI.
• The Branch Office of PELINDO III decides on the operation plan including pilot service, tug service, berth allotment and water supply service. BJTI also decides the operation plan, based on the decision of the Branch Office. TPS also then decides the plan of the berth allotment, the stevedoring work and the yard operation.

The Study for Development of the Greater Surabaya Metropolitan Ports in the Republic of Indonesia Final Report
3-12
• Stevedoring companies request TKBM to provide workers. TPS and BJTI also request TKBM to provide workers directly, if they supervise the cargo handling by themselves.
• Shipping agents naturally negotiate with terminal operators and stevedoring companies within a certain time before starting the process.
Figure 3.1.7 Ship and Cargo Service Procedure
TKBM ⑦
④ ⑥
⑥ ③④ BJTI
⑦
①
StevedorShippingAgent
ADPELPELINDO
IIITPS
②③
CIQPort
DoctorPort
Police⑤
⑥
① Information of Ship's Call (48 hours before arrival)
② Permission of Ship's Call
④ Decision of Operation Plan
⑤ Informatio of Loading /Unloading Plan
⑥ Request of providing workers and/or equipments
⑦ Provide workers
③ Request of Operational Service attached Ship's Call Permission and Information ofLoading/Unloading Plan (24 hours before arrival)
Source: Based on the hearing by the Study Team
Necessary documents for processing ship call are as follows;
• Name of ship, GRT, Length and Draft
• IMO Number, Liner or Tramper
• Name of ship owner, agent and operator
• Kind of sea transportation (domestic, special, international navigation)
• Arrival & departure date and time
• Previous calling port & destination port
• Name of scheduled wharf and duration of its usage
• Handling goods (non-container, container (20’, 40’, boxes and tons, loading and unloading)
• Name of stevedoring company
• Business certification No. and issued date
• Disembarkation and embarkation of passengers (number, purpose and origin place)
• Loading and unloading plan (volume and means of transportation outside port)
• Attached paper (Copy)

The Study for Development of the Greater Surabaya Metropolitan Ports in the Republic of Indonesia Final Report
3-13
• Master Cable (Arrival news of ship by radio or ship’s master)
• Cargo manifest (shippers, consignees, quantity, description, weight, freight term)
• International ship security certificate
• Ship activity certificate (only for international and tramper)
The loading and unloading plan is submitted at request of terminal operation services. The followings are necessary information at that time.
• Cargo manifest
• Storage plan
• Special cargo list
• Loading list and shipping order
The Branch Office of PELINDO III provides one-stop service for shipping lines, stevedoring companies and forwarding companies. That means port users can request several port services to the Branch Office simultaneously at the same place. The services that users can request to the Branch Office are pilot service, tug service, berthing service and ship-water supply service. The request document should be submitted a day before operation. Every morning except for weekends the terminal manager of the Branch Office and the terminal users have a meeting together in one place to determine the operations for the next-day of each terminal. Loading and unloading activity is controlled and supervised by branch officers and measurement and correctness of goods are also checked together with the stevedoring company at the terminal.
As for pilot and tug services, TPS’s users have the first priority to use them. They would simply inform of the the arrival and departure time of their ships to the Branch Office 48 hours before ship’s arrival. The Branch Office provides a pilot boat and tug boats for a TPS user in accordance with its request. The rest of users likewise follows the same one-stop procedure. If a ship is grater than 500 GT, is then a requirement for pilot assistance. Simialrly, shipping companies or agents must submit application forms 48 hours before its arrival. The meeting for coordination is likewise held every morning. Ships of private berth users must follow the same procedures as well.
Figure 3.1.8 shows the procedure of one-stop service, while Table 3.1.14 enumerates necessary documents at certain steps on the ship service procedure.

The Study for Development of the Greater Surabaya Metropolitan Ports in the Republic of Indonesia Final Report
3-14
Figure 3.1.8 One-Stop Service Procedure by the Branch Office
Agent/Shipping
Company/StevedoringCompany
1
One-point Service (PPSA)Ship-water
Service6
Issuing Invoiceof Ship-water
Service
2 45
Bank(Cheque)
3
Application Form (PPKB) & CompleteDocuments
5Goods/
ContainerService
6
Issuing Invoiceof Goods/ContainerService
5
Pilotage/Tug
Service6
Issuing Invoiceof pilotage/tug Service
Source: PELINDO III Note: Number means the sequence of the procedure.
Table 3.1.14 Necessary Information for Ship Service Procedure
I Outer side to Anchoring Area 6 Notification of Loading/Unloading Work1 A Letter of Credit 7 Declaration Letter of Loading/Unloading Work2 Ship Charterd Document 8 Receipt of partial payment on a Debt3 Ship Schedule 9 International Ship Security Certificate4 Ship Master III Mooving from Mooring Pool 5 Bill for Payment 1 Details of Bank Check
II Mooring Service from Anchoring Area 2 Original Additional Bank Check1 A Letter of Credit 3 Receipt of partial payment on a Debt2 Cargo Manifesto IV Going out from Mooring Pool3 Shipping Instruction 1 Details of Bank Check
4 Notification of Ship Arrival 2 Original Bank Check
5 Master Cable 3 Receipt of partial payment on a Debt
Source: Based on the information of ADPEL, PELINDO III
f. Business Entity of Port Management
Port management is a profitable business, but various port facilities in good condition need a certain amount of money. And the management body also needs funds for future capital investment, including funds to recoup past investments.
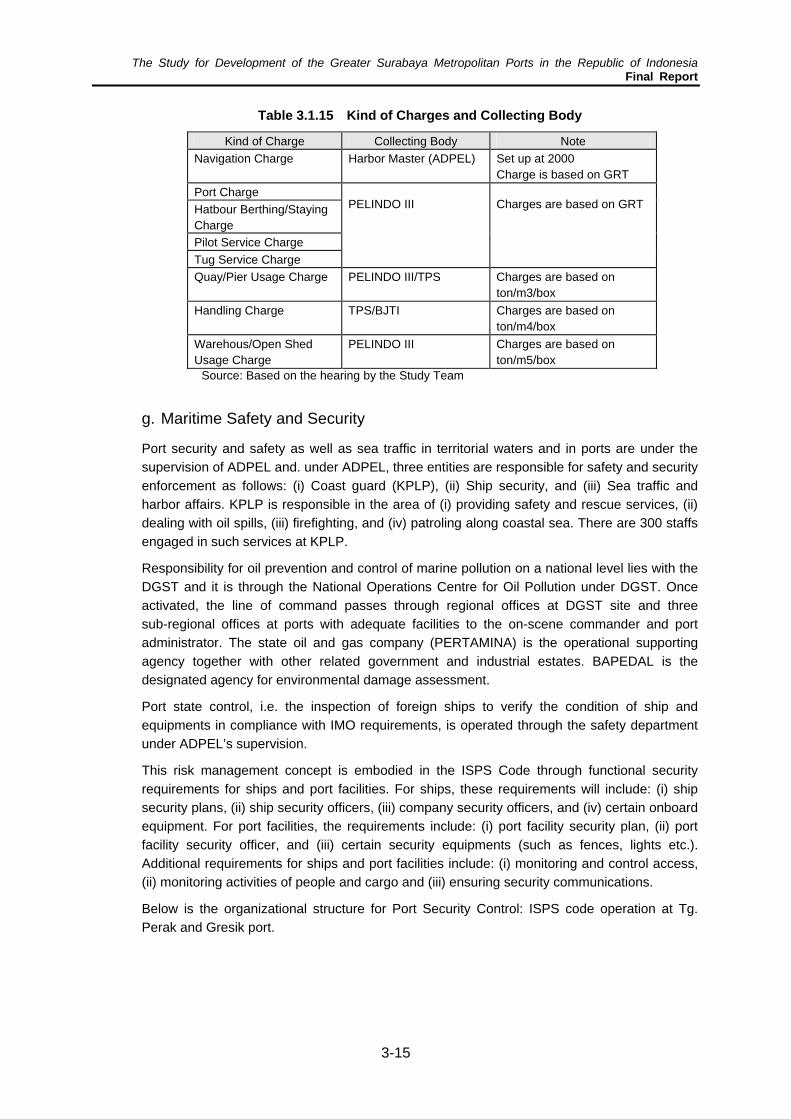
Port charges are collected by port management bodies, and most of charges are collected by the Branch Office of PELINDO III. The navigation charge is collected by ADPEL Tanjung Perak, but it is forwarded to DGSC. However, there funds are not earmarked and it is not certain that the collected navigation charge would be used for maintenance of the channel and navigation aid equipment.
Moreover, TPS and BJTI collect charges for handling service as shown in Table 3.1.15.
The Study for Development of the Greater Surabaya Metropolitan Ports in the Republic of Indonesia Final Report
3-15
Table 3.1.15 Kind of Charges and Collecting Body
Kind of Charge Collecting Body Note Navigation Charge Harbor Master (ADPEL) Set up at 2000
Charge is based on GRT Port Charge Hatbour Berthing/Staying Charge Pilot Service Charge
PELINDO III
Tug Service Charge
Charges are based on GRT
Quay/Pier Usage Charge PELINDO III/TPS Charges are based on ton/m3/box
Handling Charge TPS/BJTI Charges are based on ton/m4/box
Warehous/Open Shed Usage Charge
PELINDO III Charges are based on ton/m5/box
Source: Based on the hearing by the Study Team
g. Maritime Safety and Security
Port security and safety as well as sea traffic in territorial waters and in ports are under the supervision of ADPEL and. under ADPEL, three entities are responsible for safety and security enforcement as follows: (i) Coast guard (KPLP), (ii) Ship security, and (iii) Sea traffic and harbor affairs. KPLP is responsible in the area of (i) providing safety and rescue services, (ii) dealing with oil spills, (iii) firefighting, and (iv) patroling along coastal sea. There are 300 staffs engaged in such services at KPLP.
Responsibility for oil prevention and control of marine pollution on a national level lies with the DGST and it is through the National Operations Centre for Oil Pollution under DGST. Once activated, the line of command passes through regional offices at DGST site and three sub-regional offices at ports with adequate facilities to the on-scene commander and port administrator. The state oil and gas company (PERTAMINA) is the operational supporting agency together with other related government and industrial estates. BAPEDAL is the designated agency for environmental damage assessment.
Port state control, i.e. the inspection of foreign ships to verify the condition of ship and equipments in compliance with IMO requirements, is operated through the safety department under ADPEL’s supervision.
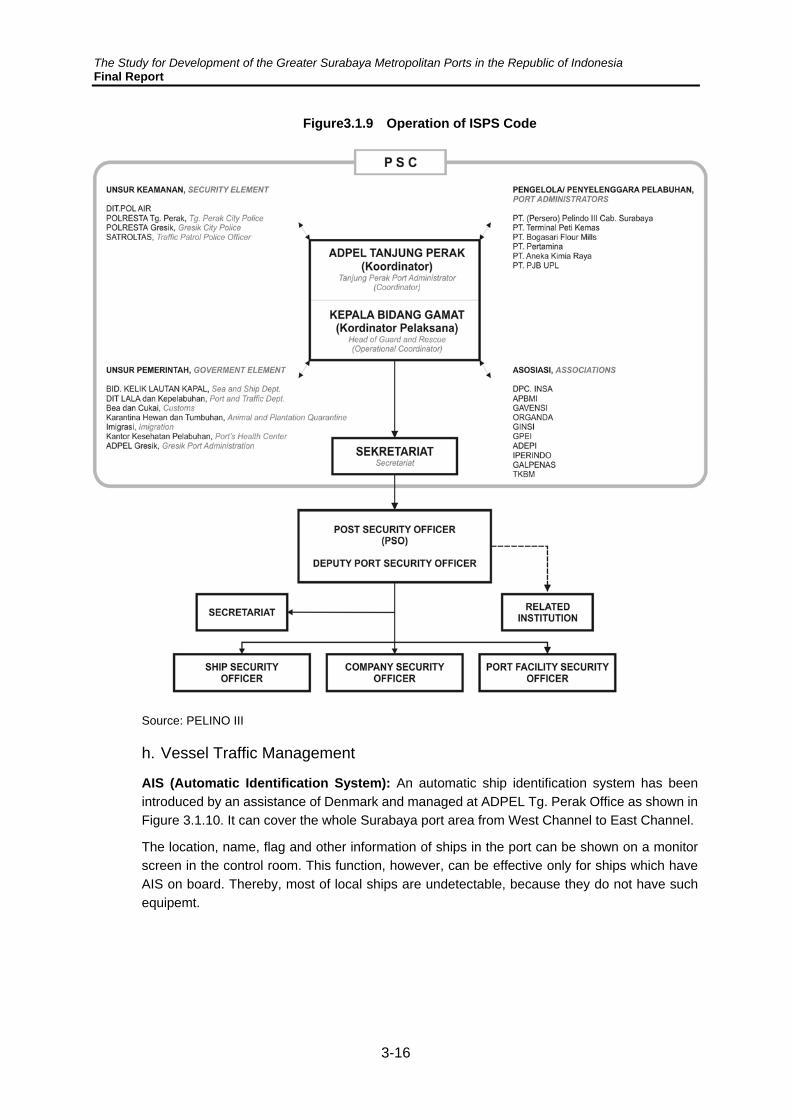
This risk management concept is embodied in the ISPS Code through functional security requirements for ships and port facilities. For ships, these requirements will include: (i) ship security plans, (ii) ship security officers, (iii) company security officers, and (iv) certain onboard equipment. For port facilities, the requirements include: (i) port facility security plan, (ii) port facility security officer, and (iii) certain security equipments (such as fences, lights etc.). Additional requirements for ships and port facilities include: (i) monitoring and control access, (ii) monitoring activities of people and cargo and (iii) ensuring security communications.
Below is the organizational structure for Port Security Control: ISPS code operation at Tg. Perak and Gresik port.
The Study for Development of the Greater Surabaya Metropolitan Ports in the Republic of Indonesia Final Report
3-16
Figure3.1.9 Operation of ISPS Code
Source: PELINO III
h. Vessel Traffic Management
AIS (Automatic Identification System): An automatic ship identification system has been introduced by an assistance of Denmark and managed at ADPEL Tg. Perak Office as shown in Figure 3.1.10. It can cover the whole Surabaya port area from West Channel to East Channel.
The location, name, flag and other information of ships in the port can be shown on a monitor screen in the control room. This function, however, can be effective only for ships which have AIS on board. Thereby, most of local ships are undetectable, because they do not have such equipemt.

The Study for Development of the Greater Surabaya Metropolitan Ports in the Republic of Indonesia Final Report
3-17
Figure3.1.10 AIS at ADPEL Tg. Perak
Source: JICA Study Team
VTS (Vessel Traffic Service) System: In addition to AIS, ADPEL has a radar and a VHF communication system. Unfortunately the radar system has problems in its coverage and image on screen. The coverage is not enough for the whole Surabaya Channel area and the image is not clear with strong shadows.
For the VTS system, a wide range and high resolution radar is indispensable. It is also necessary to discuss various institutional arrangements for effective operation and management of the system to control vessel traffic in the port, including the channels.
Figure3.1.11 Radar Image at ADPEL Tg. Perak
Source: JICA Study Team

The Study for Development of the Greater Surabaya Metropolitan Ports in the Republic of Indonesia Final Report
3-18
3.2 Tanjung Perak Port
1) Port Infrastructure and Equipment
a. Port Overview
Port of Tanjung Perak is located along the strait of Madura, to the north of the city of Surabaya with Madura Island acting as a natural breakwater for the port.
The water current along the strait is so high that the depth of the strait has been maintained to sufficient level for ship navigation for some time. However calling-ship sizes have been increasing year by year, thereby requiring some part of the channel to be periodically dredged.
Both sides of the Port are adjacent to the navy area and the front side faces the channel and those water areas are now used for anchorage for a lot of ships. That means there is no space available to enlarge the port territory in Port of Tanjung Perak and that is why a new development project is considered in Lamong Bay which is located close to Tanjung Perak, but not adjacent to it.
b. History of Port Expansion
The first sea-port at Surabaya area was opened at Jembatan Merah adjacent to the old city center of Surabaya. It was located along Kalimas River. In 1875, the plan to construct an outer port at Tanjung Perak was proposed in order to be able to handle sea-cargoes directly without using barges or small boats. At the beginning of the 20th century, a more realistic plan was introduced and the construction work started in 1910 by the Dutch government and resulted in the current configuration of the existing port.
After the independence of the country, a state company was established for managing the port. In 1985, Mirah terminal was completed as interisland terminal using ADB fund and the passenger terminal was opened at the north of Jamrud Terminal. Next to the passenger terminal, a ferry terminal was built for passenger traffic between Surabaya and Madura with 24 hours service.
In 1992 and 1994, new facilities for interisland traffic and dry bulk handling were constructed at Gresik Port. The handling of dry-bulk cargos were then partially transferred from Tanjung Perak Port to Gresik Port.
In 1992, the container terminal was constructed in order that Tanjung Perak would have more strategic role as one of the national gateway port, and a further 500m of quay was constructed in 1997 to deal with the increasing container traffic.
In 1995, PELINDO III was established as a private company though it is owned by the central government, but nonetheless has certain autonomy to construct facilities and manage the ports. In 1999, PELINDO III corporatised the container terminal operations, hence forming PT Terminal Petikemas Surabaya (TPS) and an additional 500m of international quay and 450m of domestic wharf were commissioned to TPS. At the same time 49% of its shareholdings were purchased by P&O Ports, Australia.
In 2002, PT Berlian Jasa Terminal Indonesia (BJTI) was established and commissioned to operate Berlian Terminal. It was a former working division of PELINDO III Tanjung Perak Office and the division has operated the terminal since 1974. The division stood on its own and started the terminal operation business. PELINDO III owns 95% of its shares.
The Study for Development of the Greater Surabaya Metropolitan Ports in the Republic of Indonesia Final Report
3-19
In 2006, P&O Ports was purchased by Dubai Port World (DPW), and TPS terminal is now operated by the joint company owned by PELINDO III and DPW.
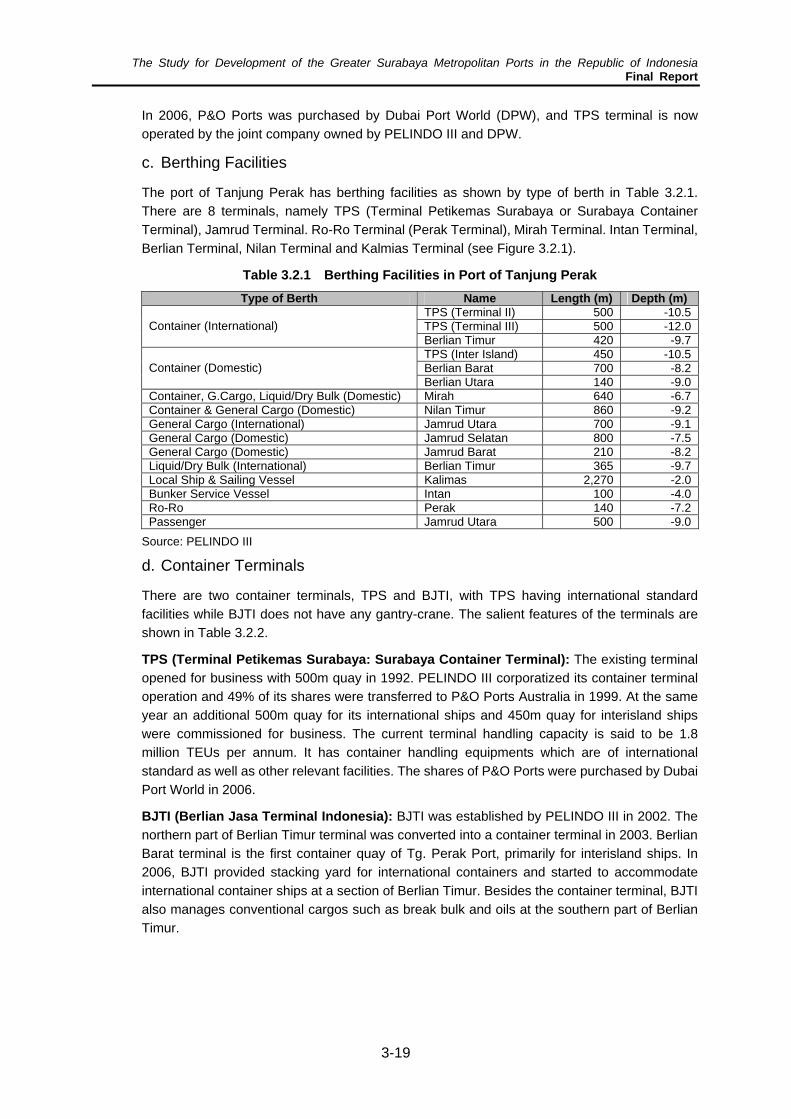
c. Berthing Facilities
The port of Tanjung Perak has berthing facilities as shown by type of berth in Table 3.2.1. There are 8 terminals, namely TPS (Terminal Petikemas Surabaya or Surabaya Container Terminal), Jamrud Terminal. Ro-Ro Terminal (Perak Terminal), Mirah Terminal. Intan Terminal, Berlian Terminal, Nilan Terminal and Kalmias Terminal (see Figure 3.2.1).
Table 3.2.1 Berthing Facilities in Port of Tanjung Perak Type of Berth Name Length (m) Depth (m)
TPS (Terminal II) 500 -10.5 TPS (Terminal III) 500 -12.0 Container (International) Berlian Timur 420 -9.7 TPS (Inter Island) 450 -10.5 Berlian Barat 700 -8.2 Container (Domestic) Berlian Utara 140 -9.0
Container, G.Cargo, Liquid/Dry Bulk (Domestic) Mirah 640 -6.7 Container & General Cargo (Domestic) Nilan Timur 860 -9.2 General Cargo (International) Jamrud Utara 700 -9.1 General Cargo (Domestic) Jamrud Selatan 800 -7.5 General Cargo (Domestic) Jamrud Barat 210 -8.2 Liquid/Dry Bulk (International) Berlian Timur 365 -9.7 Local Ship & Sailing Vessel Kalimas 2,270 -2.0 Bunker Service Vessel Intan 100 -4.0 Ro-Ro Perak 140 -7.2 Passenger Jamrud Utara 500 -9.0
Source: PELINDO III
d. Container Terminals
There are two container terminals, TPS and BJTI, with TPS having international standard facilities while BJTI does not have any gantry-crane. The salient features of the terminals are shown in Table 3.2.2.
TPS (Terminal Petikemas Surabaya: Surabaya Container Terminal): The existing terminal opened for business with 500m quay in 1992. PELINDO III corporatized its container terminal operation and 49% of its shares were transferred to P&O Ports Australia in 1999. At the same year an additional 500m quay for its international ships and 450m quay for interisland ships were commissioned for business. The current terminal handling capacity is said to be 1.8 million TEUs per annum. It has container handling equipments which are of international standard as well as other relevant facilities. The shares of P&O Ports were purchased by Dubai Port World in 2006.
BJTI (Berlian Jasa Terminal Indonesia): BJTI was established by PELINDO III in 2002. The northern part of Berlian Timur terminal was converted into a container terminal in 2003. Berlian Barat terminal is the first container quay of Tg. Perak Port, primarily for interisland ships. In 2006, BJTI provided stacking yard for international containers and started to accommodate international container ships at a section of Berlian Timur. Besides the container terminal, BJTI also manages conventional cargos such as break bulk and oils at the southern part of Berlian Timur.

The Study for Development of the Greater Surabaya Metropolitan Ports in the Republic of Indonesia Final Report
3-20
Figure 3.2.1 Terminals in Port of Tanjung Perak
Source: PELINDO III

The Study for Development of the Greater Surabaya Metropolitan Ports in the Republic of Indonesia Final Report
3-21
Table 3.2.2 Container Terminals of Tanjung Perak
Location Terminal I Berlian Utara Terminal II TPS Terminal III TPS Inter Island TPS
Managing Company PT. BJTI PT. Terminal Petikemas Surabaya Draft -9.0m -10.5m -12.0m -10.5m Berth Length 420m 500m 500m 450m Quay Crane 2 Units (35T) 11Units (40t) Apron Width 25m 50m 50m 50m RTG/Yard Crane 4/2 23 RTGs Reefer Plug 113 *112 CFS 4,400m2 10,000m2 Head Truck 48 52 Units Chassis 20”//40” 103 Units Container Yard 0.2ha 12ha 12ha 10ha Block 4 8 9 Lot 28 60 63 Row 3 7 7 Ground Slot 33.6 9,500 Capacity 40,000TEUs 500,000TEUs 500,000TEUs 400,000TEUs
Source: Port of Tanjung Perak Profile, TPS
e. Conventional Terminals
There are 5 terminals for conventional cargos; namely, Jamrad, Mirah, Berlian, Nilam and Kalimas Terminals in addition to the Intan (for bunkering) and Ro-Ro Terminal (see. Table 3.2.3).
Table 3.2.3 Conventional Terminals of Tanjung Perak
Name of Terminal Jamrud Mirah Berlian Nilam Kalimas Intan Ro-Ro Terminal
Construction Time 1910s 1985 1920s 1910s 1910s 1910s 1910s Length(m) 2,209 640 1,625 860 2,270 100 140 Depth(m) -7.5~9.1 -6.7 -17.9 -9.2 -2.0 -4.0 -7.2 Apron Width (m) 15 20 15 15 20 20
Type of Structure Caisson Pile Structure Caisson Caisson Caisson Caisson Caisson
Max Ship Length to Accommodate (m) 240 140 270 240 40 120
Handling Commodities
General Cargo /Passenger(-9m deep, 500m long)
Container/ General Cargo
Container/Bulk Cargo/ Liquid Cargo
General Cargo/ Bulk Cargo/ Log
General Cargo
Bunker Service
Passenger
Facilities at Yard
Ware Houses/Cargo Yard/Passenger Terminal
Container Yard/Ware Houses
Container Yard/Ware Houses
Ware Houses/Cargo Yard
Ware Houses
Passenger Terminal
Source: PELINDO III
Jamrud Terminal: Jamrad Terminal is the busiest among conventional terminals. It is for general cargos and its warehouses are fully used for temporary storage. Container cargos are also handled there, because domestic general cargos have been increasingly containerized year by year. The depth of berth is -9m which is enough for interisland ships, but its length is not long enough. The quayline of Jamrad North is 1,200m, but 500m is used for passenger boats.
Mirah Terminal: Mirah Terminal is the newest of the conventional terminals when it was reworked in 1985. A part of the terminal was recently modified for interisland container ships which arrive twice a week. There are two warehouses but are mostly empty. The port is not

The Study for Development of the Greater Surabaya Metropolitan Ports in the Republic of Indonesia Final Report
3-22
suited for container handling, because the breadth of the terminal is not wide enough .Other parts of the terminal are used for general cargo handling and for offshore equipment base.
Berlian Terminal: As mentioned earlier, Berlian Terminal is managed by BJTI and handles both container cargos and conventional cargos.
Nilan Terminal: Nilam area has the widest area among the conventional terminals. The shoreline of the terminal is almost 3km long, but the public berth is limited only 930m. The rest of the shoreline is used exclusively by industrial companies. It is also the only break-bulk terminal in the port, though handling of break-bulk cargos have been mostly transferred to Gresik Port already.
Kalimas Terminal: Tanjung Perak started their port activity at Kalimas Terminal in the middle of 19 century. It is located along the river of Mas and during its heyday a lot of boats sailed up the river to Jembatan Merah which was the old city center.The length of the terminal is more than 2.5km long and half of the terminal is used for small interisland ships. Those ships are berthed vertically and the cargos are handled mannually. But these days some of the general cargos are being transported in modified small containers (not suitable for standard container handling), which means that some form unitization is being looked into even for small cargo lots. The rest of the terminal is used for ship repairing work and mooring. These ships are not being charged for mooring at present.
Intan Terminal: Intan Terminal is adjacent to Jamrud terminal. The berth is 100m long and is used as a tanker berth.
Ro-Ro Terminal: Ro-Ro Terminal was previously called Perak Terminal and used for general cargos and passengers, but now it has been changed to a Ro-Ro Terminal.
Passenger Terminal: There are two passenger terminals, Jamrud and Kalmias. Jamrud terminal is for interisland passenger ships and Kalimas terminal is for ferry boats.
f. Exclusive Use Facilities
There are 5 facilities used exclusively by certain firms in Tanjung Perak Port. Those lands are owned and leased to specific companies by PELINDO III. Some berthing facilities are owned by PELINDO III while others are constructed by BOT scheme. However, all of superstructures are owned by the respective firms. Table 3.2.4 shows the major firms, which have exclusive facilities at Tanjung Perak Port.
Table 3.2.4 Direct Marine Activities of Main Companies in Tanjung Perak Port
Company name PT. Pertamina AKR BOGASARI, PT. PUSRI PT. DOK
Company type State-owned Private Private State-owned State-owned Land Property PELINDO III PELINDO III PELINDO III PELINDO III PELINDO III Business Activity Oils Chemical/ Fuel Oil Flour Fertilizer Ship Yard Berthing Facility D: 9-11m L: 100m, D: 9-11m L: 250m, D: 9-11m L: 100m, D:6-7m L: 140m, D: 6-7m Handling facility Pump Pump Pneumatic Conventional Handling Capacity 1,500 l/day 6,000 t/day 3,000 t/day
Handling Record (2006)
Chemical 251,937t, Fuel Oil: 91,000t
1,1174,614t 48,704t Maximum ship building: 17500DWT
Remarks
The area will be enlarged in the near future and be used as multi purpose berth
Land: 57ha, Water: 35ha, consession will be finished in 2015
Source: PELINDO III

The Study for Development of the Greater Surabaya Metropolitan Ports in the Republic of Indonesia Final Report
3-23
g. Port Facility Security System
Tg.Perak: Indonesia is a member of the International Maritime Organization (IMO). The IMO adopted “the International Ship and Port Facility Security Code” in 2002, which prescribed necessary security measures to be taken at the ports of the member countries. The code was scheduled to be implemented by 1 July 2004, including such measures as introduction of gate check system, security facilities (such as fences, lights and the closed-circuit television (CCTV) system, X-ray inspection system for checking cargoes, etc.) and others
There are 13 organizations in Tg. Perak which are related to security of the port, i.e. ADPEL, Coast Guard, the Navy, Port Police (KPPP), Pelindo III, etc. The Port Security Committee (PSC) is organized to coordinate their activities. Security facilities are operated by Tg. Perak Branch Office of Pelindo III, in which the Port Facility Security Officer (PFCO) is assigned.
In Tg. Perak, a CCTV system with 32 cameras was introduced at most of the wharves already in 1998. In 2005, additional CCTV system was installed at five gates in the port with 20 CCTV cameras, were installed by a grant of JICA. These facilities are controlled and managed by Pelindo III at the central control room.
Figure 3.2.2 Arrangement of CCTV Cameras in Tg. Perak
Nilam Berlilan
Jamrud Passenger Terminal
Mirah
Source: PELINDO III (right: installed by a grant of JICA)
TPS: The security system of TPS consists of the following :
i) Fences: TPS is enclosed by fences. Introduction of an Infra-red sensor system is under consideration.
ii) Gate check: Registration and check of the trailer/truck drivers, issuance of an admission card to vehicles, weight check of trailers by 15 weigh bridges, personnel check by name card and Hand Punch Recognition System, etc.
iii) CCTV system: There are 26 cameras in TPS, in which six are arranged on the jetty. The monitor is managed in the control room.
iv) Radio communication among security officers
v) Patrol by three pickup trucks
In TPS an independent CCTV system is installed and managed by the Customs. An X-ray inspection system was introduced in 1998 by a grant from the Dutch Government. It has been used only by the Customs for checking contraband in containers.

The Study for Development of the Greater Surabaya Metropolitan Ports in the Republic of Indonesia Final Report
3-24
2) Port Traffic
a. Non-Container Cargo Throughput
Import
Export
Unloading
Loading
Port activity has been growing year by year until 1997. After the economic recession, the international trade and the domestic trade through the port has been decreasing at a significant rate as illustrated in Figure 3.2.3. The cargo throughput in 2006 is almost 11 million tons, less than 60% of the peak year. The international and domestic cargos are account for 40% and 60% respectively; and, domestic unloaded cargo exceeding domestic loaded cargo. As shown in (Figure 3.2.4).
Figure 3.2.3 Perak Cargo Throughput (1965-2006)
Source: PELINDO III
Figure 3.2.4 Perak Cargo Throughput in 2006
Source: PELINDO III Note: Import and Export cargo are intenational-bound cargo; while, Loading and Unloading cargo are domestic-bound cargo
International
Domestic
0
50
100
150
200
1965
1969
1973
1977
1981
1985
1989
1993
1997
2001
2005
Year
Milli
on T
on
b. Container Cargo
Containerization is a worldwide phenomenon and the current situation in Surabaya port is almost same as in in other major ports. Figure 3.2.5 shows the container throughput at Tanjung Perak Port, wherein container throughput has been increasing gradually, and reached 1.85

The Study for Development of the Greater Surabaya Metropolitan Ports in the Republic of Indonesia Final Report
3-25
0
200
400
600
800
1,000
1,200
1,400
1,600
1,800
2,000
1997 1998 1999 2000 2001 2002 2003 2004 2005 2006
Year
Con
tain
er
Vol
(Th
TEU
)
Convtional
PT. BJTI
PT. TPS
million TEUs (1.51 million boxes) in 2006, including international and domestic containers. The growth of domestic containers is much higher than that of international containers.
Most of container handling is done at TPS, but since BJTI opened its container terminal in 2003, it has rapidly increased its share of container cargo handling because of its cheaper charge than that of TPS. Interisland containers are mostly handled at BJTI, but because of lack of space, some of the interisland containers have to be handled at conventional terminals This is the primary reason why since 2003 container being handled at conventional terminals is increasing (see Figure 3.2.6).
Figure 3.2.5 Container Throughput at Tj. Perak (1997-2006)
Source: PELINDO III ,TPS and BJTI
Figure 3.2.6 Increase of Container Handling per Terminal since 2003
Note: 2003 values = 1.00 Source: PELINDO III ,TPS and BJTI
0
0.5
1
1.5
2
2003 2004 2005 2006Year
TPS BJTI Convebtinal Terminal

The Study for Development of the Greater Surabaya Metropolitan Ports in the Republic of Indonesia Final Report
3-26
One of the parameters to be taken into consideration in container port planning is the composition of container box sizes, i.e. ratio of 20 and 40 footers. The Figure 3.2.7 shows the trend of the ratio of 40 footers for the past 10 years at PT. TPS, PT. BJTI and conventional berths.It seems characteristic of Tanjung Perak that the ratio of 40 footers has not increased in the past years, maintaining about 40% at TPS, and 4% to 5 % at other berths As a result, the average TEUs per box has more or less remained unchanged, and it is almost constant both at inbound and outbound at TPS (see Figure 3.2.8).
Figure 3.2.7 Ratio of 40 Footers at Tj. Perak
0
10
20
30
40
50
60
70
80
90
100
1997 1998 1999 2000 2001 2002 2003 2004 2005 2006
Year
Rat
io o
f 40' (
%)
PT. TPS
PT. BJTI
Convtional
0.00
0.20
0.40
0.60
0.80
1.00
1.20
1.40
1.60
2000 2001 2002 2003 2004 2005 2006
Year
TEU
s/B
ox
Discharged at TPS
Loaded at TPS
PT. BJTI
Conventional
Source: PELINDO III ,TPS and BJTI
Figure 3.2.8 Average TEUs per Box at Tj. Perak
Source: PELINDO III ,TPS and BJTI
Another important parameter is the ratio of empty containers against total containers handled. Figure 3.2.9 and Figure 3.2.10 shows the ratio of empty container for various classifications of containers through TPS, illustrating that the empty container ratio (TEU basis) of foreign

The Study for Development of the Greater Surabaya Metropolitan Ports in the Republic of Indonesia Final Report
3-27
containers are small, i.e. less than 20 %, whereas, the empty container ratio of domestic containers is high, i.e. increasing up to 40 % in 2006. Figure 3.2.11 illustrates the same empty container ratio at BJTI and conventional terminals with more or less a stable ratio of 25% to 35%.
Figure 3.2.9 Empty Container Ratio at TPS in Aggregate
0
10
20
30
40
50
60
70
80
90
100
1997 1998 1999 2000 2001 2002 2003 2004 2005 2006
Year
Em
pty
Conta
iner
Rat
io (
%)
Foreign Total
Domestic Total
Overall Average
Source: TPS Note: TEU basis
0
10
20
30
40
50
60
70
80
90
100
1997 1998 1999 2000 2001 2002 2003 2004 2005 2006
Year
Em
pty
Conta
iner
Rat
io (
%)
Import
Export
Discharging
Loading
Figure 3.2.10 Empty Container Ratio at TPS by Traffic Movement
Source: TPS
Figure 3.2.11 Empty Container Ratio at BJTI and Conventional Terminals
0
10
20
30
40
50
60
70
80
90
100
1997 1998 1999 2000 2001 2002 2003 2004 2005 2006
Year
Em
pty
Con
tain
er R
atio
(%)
Foreign
Domestic
Total
Source: Tg. Perak Office, Pelindo III

The Study for Development of the Greater Surabaya Metropolitan Ports in the Republic of Indonesia Final Report
3-28
c. Ship Call Characteristics
The number of ship calls in 2006 was 15,467 units but the number of vessels entering the port has almost remained constant in these last 10 years as shown in Figure 3.2.12. However ship type composition has been steadily changing as container ships has been increasing, while non-container ships and passenger ships have been gradually decreasing.
Figure 3.2.12 Number of Ships Calling at Tg. Perak (97-06)
0
4000
8000
12000
16000
2000019
97
1998
1999
2000
2001
2002
2003
2004
2005
2006
Year
Uni
ts
OtersTankerPasengerNon-ContainerContainer
Source: Tg. Perak Office, Pelindo III
The number of ocean-going ships calling at Tanjung Perak decreased suddenly in 2001 as shown in Figure 3.2.13, however average cargo handled per ship increased in 2001 as shown in Figure 3.1.14. This is a result of larger ships being assigned to call at Tanjung Perak. On the other hand the average ship size for interisland services has been decreasing year by year.
Figure 3.2.13 Number of Ship Call & Average Ship Size (97-06)
0
2000
4000
6000
8000
10000
12000
14000
16000
1997
1998
1999
2000
2001
2002
2003
2004
2005
2006
Year
Units
0
2000
4000
6000
8000
10000
12000
14000
16000
G.T
./Uni
t
Ocean-going Ships
Inter-island Ships
Ave. Ocean-goingg. ShipSize
Ave. Inter-island Ship Size
Source: Tg. Perak Office, Pelindo III

The Study for Development of the Greater Surabaya Metropolitan Ports in the Republic of Indonesia Final Report
3-29
Figure 3.2.14 Average Cargo Handled per Ship (97-06)
0
500
1000
1500
2000
2500
3000
1997
1998
1999
2000
2001
2002
2003
2004
2005
2006
Year
Ton/
Uni
tInternatinalDomestic
Source: Tg. Perak Office, Pelindo III
Figure 3.2.15 shows ship call and average container cargo handled per ship at TPS. The number of ship call is around 1500 vessel per year, while the average cargo handled per ship is around 360 TEUs for loading and 350 TEUs for discharging. Average loading cargo volume has been almost unchanged for the last 5 years, while the average discharging volume has been increasing a little year by year. It is noted that the TPS’s data includes international and interisland figures in calculating for the average.
Figure 3.2.15 Average Container Cargo Handled per Vessel (TPS)
0
50
100
150
200
250
300
350
400
2000
2001
2002
2003
2004
2005
2006
Ave
rage
han
dlin
g V
olu
me
(TEU
/V
ess
el)
0
500
1000
1500
2000
2500
Ship
Cal
l (U
nit)
Discharged
Loaded
Ship's Call
Source: TPS
Figure 3.2.16 average container cargo handled per ship, and differentiating between international and interisland traffic, though based only on one shipping company’s data. The average number of the international container cargo handled is 560 TEUs/vessel for loading and 450 TEUs/vessel for discharging. The boxes handled per vessel is about 30% smaller than the number based on TEU, which means that about 30% containers are bigger than 20 foot containers, such as 40 foot containers. On the other hand, the number of interisland container is handled 200 boxes/vessel and less than 300 TEUs/ vessel.

The Study for Development of the Greater Surabaya Metropolitan Ports in the Republic of Indonesia Final Report
3-30
0
100
200
300
400
500
600
Box
Cargo
Load
Box
Cargo
Disch
TEUs
Cargo
Load
TEUs
Cargo
Disch
TEU
/V
ess
el o
r B
ox/
Vess
el
International
Interisland
Figure 3.2.16 Container Handled Volume per Vessel (International and Interisland Traffic)
Source: Tg. Perak Office, Pelindo III
Looking at the ship type, the average size of non-container ships has not changed much; however, the average container ship size has been recently decreasing to some extent as shown in Figure 3.2.17. This is due to the introduction of smaller container ships to interisland transport services.
Figure 3.2.17 Average Ship Size of Entering in Tanjung Perak Port
02000
40006000
800010000
1200014000
1997
1998
1999
2000
2001
2002
2003
2004
2005
2006
Year
G.T
./Uni
t
ContainerNon-ContainerPasengerTanker
Source: Tg. Perak Office, Pelindo III
As for the maximum size of calling ships, a bulk cargo ship of 87,052 DWT and 225m long, was recorded as the largest ship to call at Surabaya in 2006. The largest container ship size is 32,085 GRT. Details are shown in Table 3.2.5.
Table 3.2.5 Largest Ships Called at Tanjung Perak Port in 2006 Type of Ship Name of Ship DWT GRT LOA (m)
Bulk Cargo Alam Pesona 87,052 46,982 225 Container Jubilee Glory 33,271 32,085 211 General Cargo Nirefs 40,570 189 Tanker Energy Power 51,318 30,008 183 Passenger Bukit Siguntang 14,649 147 Source: PELINDO III

The Study for Development of the Greater Surabaya Metropolitan Ports in the Republic of Indonesia Final Report
3-31
d. Terminal Working Characteristics
Table 3.2.6 shows ship call ratio by terminal for conventional terminals or Tj. Perak. Among them, Jamraud is the main terminal for conventional cargos, not only as international trade, but also as interisland trade. Nilam, Berlian and Mirah terminals are also busy ones, but they are mostly used for interisland trade. Kalimas Terminal is used only for local ships.
Table 3.2.6 Ship Call Ratio by Terminal
Item Terminal International Domestic Total Jamrud 11.5 26.4 37.9 Nilan/Berlian/Mirah 4.2 38.1 42.3 Kalimas 19.8 19.8
Ship Call (15,466 Units)
Total 15.7 84.3 100.0 Jamrud 36.8 28.5 65.3 Nilan/Berlian/Mirah 10.4 22.1 32.5 Kalimas 2.2 2.2
GT (60,005,606 GT)
Total 47.2 52.8 100.0 Note: Based on PELINDO III Statistical Data
Table 3.2.7 shows ship call and container traffic at TPS. TPS terminal handled more than 700 TEUs per ship on average. Its berth occupation ratio is said to be 37% and CY occupancy ratio 32% according to the TPS public relations department.
Table 3.2.7 Ship Call & Container Flow at TPS
Year Ship Call (A) Container Flow (B) B/A 2003 1,387 980,706 707 2004 1,522 1,074,505 706 2005 1,493 1,066,908 715 2006 1,471 1,053,466 716
Source: TPS
Table 3.2.8 shows ship staying average time at Tj. Perak, excluding TPS. In all, turnaround time for conventional vessels is around 80 hours, while for domestic container vessels is about 40 hours. The average waiting time of ships calling at Tanjung Perak was 2 hours, based on the information from PELINDO III. There were no ships waiting for berth for more than half a day and only 0.8% of ships waited for 6-12 hours for berthing.
Table 3.2.8 Average Staying Time of Ships at Tanjung Perak Port (excl. TPS)
Item International Conventional
Domestic Container
Domestic Conventional
Turn Round Time 78 39 87 Waiting Time 1 0 1 Postpone Time 21 5 16 Approach Time 4 4 4 Berthing Time 52 30 66 (Effective Time) 39 20 52
Note: Units in hours Source: Statistical Paper of PELINDO III (2006, Actual Data)
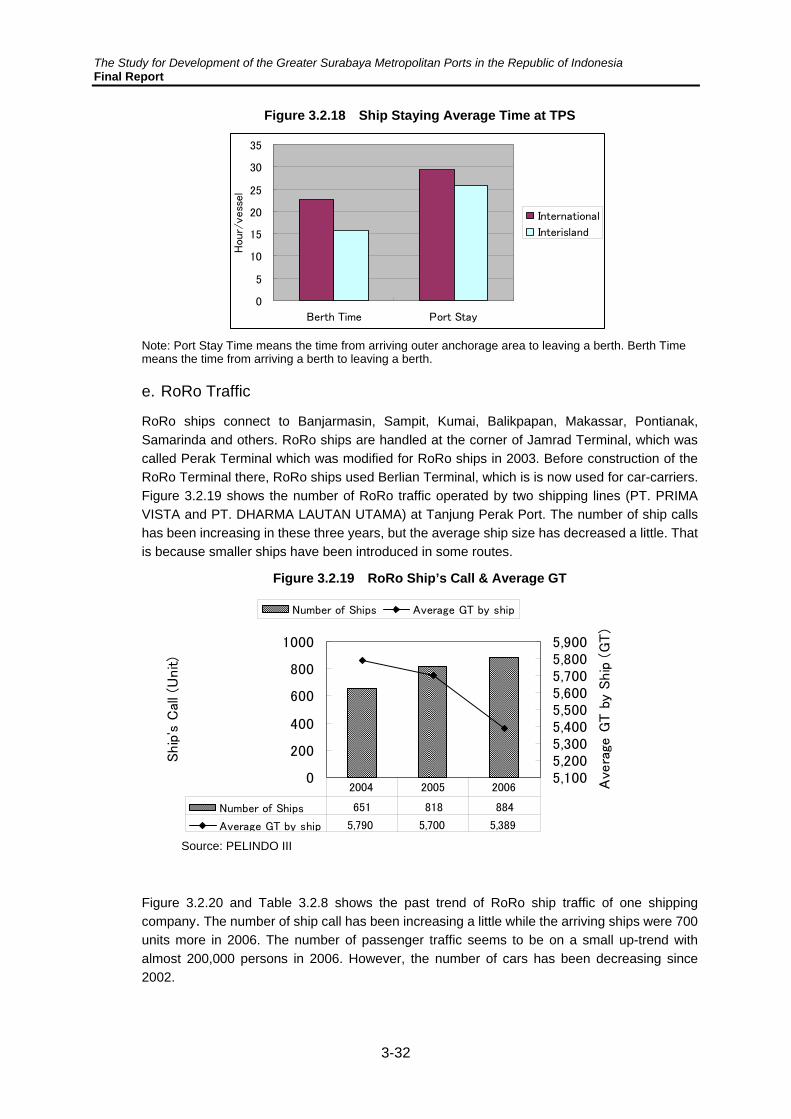
At TPS, international container ships stay at the port for 29 hours including 23 hours berthing time on average, based on an example of a shipping company operating as shown in Figure 3.2.18. Meanwhile, interisland container ships have shorter port stay duration than the international container ships.
The Study for Development of the Greater Surabaya Metropolitan Ports in the Republic of Indonesia Final Report
3-32
Figure 3.2.18 Ship Staying Average Time at TPS
0
5
10
15
20
25
30
35
Berth Time Port Stay
Hou
r/ves
sel
International
Interisland
Note: Port Stay Time means the time from arriving outer anchorage area to leaving a berth. Berth Time means the time from arriving a berth to leaving a berth.
e. RoRo Traffic
RoRo ships connect to Banjarmasin, Sampit, Kumai, Balikpapan, Makassar, Pontianak, Samarinda and others. RoRo ships are handled at the corner of Jamrad Terminal, which was called Perak Terminal which was modified for RoRo ships in 2003. Before construction of the RoRo Terminal there, RoRo ships used Berlian Terminal, which is is now used for car-carriers. Figure 3.2.19 shows the number of RoRo traffic operated by two shipping lines (PT. PRIMA VISTA and PT. DHARMA LAUTAN UTAMA) at Tanjung Perak Port. The number of ship calls has been increasing in these three years, but the average ship size has decreased a little. That is because smaller ships have been introduced in some routes.
Figure 3.2.19 RoRo Ship’s Call & Average GT
0
200
400
600
800
1000
Ship
's C
all (U
nit)
5,1005,2005,3005,4005,5005,6005,7005,8005,900
Ave
rage
GT b
y Ship
(G
T)
Number of Ships Average GT by ship
Number of Ships 651 818 884
Average GT by ship 5,790 5,700 5,389
2004 2005 2006
Source: PELINDO III
Figure 3.2.20 and Table 3.2.8 shows the past trend of RoRo ship traffic of one shipping company. The number of ship call has been increasing a little while the arriving ships were 700 units more in 2006. The number of passenger traffic seems to be on a small up-trend with almost 200,000 persons in 2006. However, the number of cars has been decreasing since 2002.

The Study for Development of the Greater Surabaya Metropolitan Ports in the Republic of Indonesia Final Report
3-33
Figure 3.2.20 RoRo Traffic (PT. DHARMA LAUTAN UTAMA)
0
100
200
300
400
500
600
700
800
1999 2000 2001 2002 2003 2004 2005 2006
Ship
Cal
ls (
units)
or
Pas
senge
rs (
1000 p
ers
ons)
0
2000
4000
6000
8000
10000
12000
14000
Vehic
les
(car
s)
Shp Calls (units) Passenger (persons) Vehicle (cars)
Source: PT. DHARMA LAUTAN UTAMA
Table 3.2.9 RoRo Traffic (PT. DHARMA LAUTAN UTAMA) Items 199 2000 2001 2002 2003 20049 2005 2006
Shp Calls (units) 209 422 477 434 634 616 637 705Passenger (persons) 121.179 181.674 193.303 175.729 157.766 161.345 198.431 197.113
Vehicle (cars) 6914 11026 12246 11133 11321 10004 8245 6837
Source: PT. DHARMA LAUTAN UTAMA
There are 12 routes of RoRo ship services from/to Surabaya operated by one shipping company. The passenger traffic to/from Banjarmasin is biggest among them, but its traffic has been drastically decreasing since 2000. On the contrary, the passenger traffic to/from Sampit, Kumai and Batulicin have been increasing favorably. The traffic to/from Balikpapan decreased a lot until 2004 and after that it has been recovering. (see Figure 3.2.21)
Figure 3.2.21 Passenger Traffic Changes by Direction (From Surabaya)
0
10000
20000
30000
40000
50000
60000
70000
1999
2000
2001
2002
2003
2004
2005
2006
Num
ber
of
Pas
senge
r (p
ers
on)
Banjarmasin
Balikpapan
Batlicin
Kumai
Sampit
Makassar
Source: PT. DHARMA LAUTAN
Figure 3.2.22 shows the number of cars carried by RoRo ships by one shipping company. The number of carried cars to/from Banjarmasin is more than 2000 for boarding and 1000 more for alighting in 2006. Strangely, boarding cars are more than landing cars to/from Banjarmasin.

The Study for Development of the Greater Surabaya Metropolitan Ports in the Republic of Indonesia Final Report
3-34
0
500
1000
1500
2000
2500
Banjarmas
in
Balik
papa
n
Batlicin
Kumai
Sampit
Mak
assa
r
Others
Num
ber
of
Vehic
les
(Car
s) Boarding Landing
Figure 3.2.22 Number of Cars Carried by RoRo Ships
Source: PT. DHARMA LAUTAN
f. Passenger Traffic
0
200,000
400,000
600,000
800,000
1,000,000
1997
1999
2001
2003
2005
Year
pers
ons
0
500
1,000
1,500
2,000
pers
ons
/sh
ip
Embarkation
Debarkation
passenger per ship
Figure 3.1.23 shows the number of maritime passengers and average passengers on board a ship calling at Tanjung Perak (excluding ferry transport to Madura). After the volume of maritime passengers peaked in 2000, it has been decreasing year by year, though it has somewhat stabilized in recent years. The reason is said to be the strong competition coming from airline services. The number of the passenger throughput in 2006 was 863 thousands in 2006 which is less than half of throughput during the peak year. As personal income increases, people would tend to prefer much faster and more convenient modes transportation, which means that the number of passengers may continue to decrease or at least maintain its current ridership hereafter.
Figure 3.1.23 Number of Passengers and Passengers on Board a Ship (97-06)
Source: Tg. Perak Office, Pelindo III

The Study for Development of the Greater Surabaya Metropolitan Ports in the Republic of Indonesia Final Report
3-35
3.3 Other Ports
1) Gresik Port
a. Port Overview
Gresik Port was opened in 1931 by the Netherlands Government, and its management was assigned to the Surabaya Regional Government. After that, it was transferred to PELINDO III based on the port regulation in 1996.
Gresik Port has been playing a significant role as a bulk cargo terminal. After the completion of the Curah quay, the handling of coals was transferred from Tanjung Perak to Gresik. A new quays for logs and unprocessed woods will be constructed adjacent to the coal terminal in the near future. Other quays are used for traditional local cargos and passengers to/from Bawean island. Table 3.3.1 outlines the public port facilities at Gresik Port.
Table 3.3.1 Public Port Facilities at Gresik Port
Name of Quay Nusantara Curah Penumpang Pelra Talud Tegak
Commodities Handled General cargo Coal Passenger, General cargo General cargo General cargo
Max Ship to Accommodate 3,200GT 3,500GT 320GT 280GT 2,500GT
Construction Year 1,992 1,999 2,002 2,002 1,994 Length 265 70 60 120 800 Facility Depth -6 -4 -4 -4 -3
Type of Structure Floor Concrete Concrete Pile Concrete Pile Concrete Pile
Yard Facilities Warehouse 1400m2
Yard 22,710m2
Source: Gresik Office, Pelindo III
b. Cargo Throughput
Cargo throughput at Gresik Port was more than 6 million tons before 1996. After that, it had been decreasing year by year, and was recorded at 3 million tons/year at its minimum in 2003 as illustrated in Figure 3.3.1. Then the port started to handle coal, and cargo throughput has been increasing rapidly. Figure 3.3.2 shows the throughput by cargo items. Half of the cargos are conventional freight, while the volume of coals is increasing and presently its share is almost 1/3. No international cargos are handled there at present.
In Gresik Port there are several companies, some of them are state-owned companies, and some are private companies, that operate special use facilities at Gresik (i.e private berth). Figure 3.3.3 shows the cargo throughput at public and private berths, with the share of private berths at 42% in 2005.
Figure 3.3.1 Cargo Throughput at Gresik Port
0.01.02.03.04.05.06.0
2001 2002 2003 2004 2005 Year
Mill
ion
Ton
LoadingUnloadingInternational
Source: Gresik Office, Pelindo III

The Study for Development of the Greater Surabaya Metropolitan Ports in the Republic of Indonesia Final Report
3-36
Figure 3.3.2 Throughput by Cargo Items at Gresik
0
1000000
2000000
3000000
4000000
5000000
2003 2004 2005
Ton
General CargosCoalsLogsTimbers
5.0
4.0
3.0
2.0
1.0
Million
Ton
Source: Gresik Office, Pelindo III
Figure 3.3.3 Cargo Throughput at Public and Private Berths in Gresik
010000002000000300000040000005000000
2003 2004 2005
Ton Private Berth
Public Berth
5.0
4.0
3.0
2.0
1.0 0
Million
Ton
Source: Gresik Office, Pelindo III
c. Ship Calls
Figure 3.3.4 shows number of ship calls and average ship size at Gresik Port. Gresik Port was formerly used for the international trade, but nowadays it is for domestic use only. Moroever, a lot of traditional ships use the quay as their base port. The average calling ship sizes are 500GT on non-traditional interisland ships and 170GT for traditional ships.
Figure 3.3.4 Number of Ship Calls and Average Ship Size at Gresik Port
0500
100015002000250030003500
2001 2002 2003 2004 2005
Year
No.
of S
hip
calls
(Uni
ts)
0
2000
4000
6000
8000
10000
12000
Ave
. Shi
p S
ize
(GT)
International
Interisland
TraditinalShippingInternational
Interisland
TraditinalShipping
Source: Gresik Office, Pelindo III
d. Passenger Traffic
Figure 3.3.5 shows the number of passengers at Gresik Port. It is noted that the number of passengers had been decreasing to only 150 thousands persons by 2003.

The Study for Development of the Greater Surabaya Metropolitan Ports in the Republic of Indonesia Final Report
3-37
Figure 3.3.5 Number of Passengers at Gresik Port
0
50000
100000
150000
200000
250000
300000
2001 2002 2003 2004 2005
Per
sons
DepartureArrival
Source: Gresik Office, Pelindo III
2) Other Public Ports
In the Study Area, there are some other public ports and major ones includes, Port of Kamal which is a ferry terminal for the traffic between Surabaya and Madura, and another 2 public ports, Port of Telagabiru and Port of Sepulu.
a. Port of Telagabiru
Facility Description
Office Used building owned by PELINDO3, 388m2
Breakwater Total 5775m3 in the east & west
Port Basin Area 145,000m2, Depth 4m
Wharf 30x10m, Depth 2.5m
Warehouse 37,500m3
OthersGovernment ship /Floating equipment/Speed boat 1 unit
Port of Telagabiru is located at the northern coast of Madura, about 60km from the Port of Kamal, and it is directly managed by DGST, MOT.
It has 2 breakwaters, made of crushed stone, on the left and right side for protection of the port basin. Its area is 145,000m2 and its depth is 4m. There is a wharf (BxLxD=10x30x2.5m) at the left side of the basin. The warehouses are located along the coast and cows and sheep are stored there. The total area of the warehouses is 37,500m2. There are also a few government ships, floating equipment and a speed boat. (see Table 3.3.2)
Table 3.3.2 Facilities List of Telagabiru
Source: Technical Plan, Institute Technology Sepuluh, 2002

The Study for Development of the Greater Surabaya Metropolitan Ports in the Republic of Indonesia Final Report
3-38
Figure 3.3.6 Telagabiru Port
b. Port of Sepulu
Source: Technical Plan, Institute Technology Sepuluh, 2002
Port of Sepulu is located at the northern coast of Madura, about 10km to the west from the Port of Telaga Biru. The port was initially developed during the Dutch era. The Netherland government constructed a breakwater on the left side of the port basin. Presently, it is under the supervision by Telagabiru Port.
It has 2 breakwaters that make a port basin. Those breakwaters were made from crushed stone from highway works. This port has no wharf.and loading/unloading activity is done by small ships. There are some warehouses owned by private parties. They are used for the storage of wood from Kalimantan. There is likewise a dock which is owned by a local businessman. The dock is used for motor vessel with maximum 200m3 capacity of wood.
Figure 3.3.7 Sepulu Port
Source: Technical Plan, Institute Technology Sepuluh, 2002

The Study for Development of the Greater Surabaya Metropolitan Ports in the Republic of Indonesia Final Report
3-39
c. Traffic characteristics of both ports
The number of ship calls at Sepulu is larger than that at Telagabiru, but the average ship size at Sepulu is much smaller than that of Telagabiru, most of them are small boats. The number of ship calls at Telagabiru jumped up at 2003. That was because an oil company, KODECO’s tankers came in during that time. (see Figure 3.3.8)
Considering the recent traffic trend, Telagabiru Port is said to be a base for animal and crude oil shipment. Cows and sheeps produced in Madura are carried out to Southern Sumatra and Kalimantan, while the incoming ships load wood from Kalimantan. The crude oil is produced at KODECO’s oil terminal which is located 23 miles from Tenagabiru Port in the Java Sea. There is also a floating storage which consists of about 15 tankers and tanker sizes between 23,000 and 50,000 DWT. The statistics bel;ow hows just unloading volume, not loading one. Finally, Sepulu Port is said to handle raw woods from Kalimantan.
Figure 3.3.8 Ship’s Call & Average Ship Size of Local Ports
0
200
400
600
800
1995
1996
1997
1998
1999
2000
2001
2002
2003
2004
2005
2006
Num
ber
of
Ship
's C
all
0.0500.01000.01500.02000.02500.03000.03500.0
Ave
rage
Ship
Siz
e
Ship Call Telaga Biru Ship Call Sepulu
Average Ship Size Telaga Biru Average Ship Size Sepulu
Source: Telaga Biru Port Office
Figure3.3.9 Handling Volume at Two Local Ports (No1)
05,000
10,00015,00020,00025,00030,00035,000
1995
1996
1997
1998
1999
2000
2001
2002
2003
2004
2005
2006
Wood
(m3)
05,00010,00015,00020,00025,00030,00035,000
Anim
al (
Head
)
Wood (Unloading) Telaga Biru Wood (Unloading) Sepulu
Animal (Loading) Telaga Biru Animal (Loading) Sepulu
Source: Telaga Biru Port Office

The Study for Development of the Greater Surabaya Metropolitan Ports in the Republic of Indonesia Final Report
3-40
Figure 3.3.10 Handling Volume at Two Local Ports (No2)
0
5001,000
1,5002,000
2,5003,000
3,5004,000
4,500
1995
1997
1999
2001
2003
2005
Bre
ak-bu
lk C
argo
(to
n)
0
1000
2000
3000
4000
5000
6000
Cru
de O
il (B
rl)
Sepulu Others (ton)
Tenaga Biru Corn (ton)
Tenaga Biru Crude Oil(Brl)
Source: Telaga Biru Port Office
3) Private Ports and Jetties
There are several exclusive use facilities in Surabaya Port Area, not only at Tanjung Perak Port as mentioned before, but also at Gresik Port. Table 3.3.3 details these facilities at Gresik Port. Based on the data of Gresik Port Office of PELINDO III, total cargo throughputs of these private facilities was 1.8 million tons in 2005.
Table 3.3.3 Private Facilities at Gresik Port Facility
Company Name Product Length(m) Depth(m) Max Draft(m)
Type of Structure
Area Size(m2)
10x5 10 Trestle 4x8x8 10 Trestle PT. SIAM MASPION
TERMINAL Chemical Industry 6x6x6 10 8 Trestle
238x24 12 10 Trestle PT. SMELTING CO. Iron & Copper 1920x6 12 10 Trestle 285x25 14 12 Trestle 21,165 PT. PETROKIMIA GRESIK
(PERSERO) Fertilizer, Urea, Ammonia 390x36 14 12 Trestle
40x38.7 9 7.5 Trestle PT. PERTAMINA ASPHALT Asphalt Factory 400x5 9 7.5 Trestle
50.3x30 8 7 Trestle 2,596.5 59x15 8 7 Trestle 15x9 8 7 Trestle PT. PLN PJB II UP GRESIK Power
Electricity 15x9 8 7 Trestle
PT. SEMEN GRESIK Cement 289x13 9 9 Trestle 3,757 PT. INDONESIA MARINA SHIPYARD
Shipbuilding & Maintenance
Breakwater 352.52+140 12 10 Dry Dock 7,678
PT. NUSANTARA PLYWOOD Plywood 0.5 Timber Pond 2,850 Source: Based on the hearing by the Study Team

The Study for Development of the Greater Surabaya Metropolitan Ports in the Republic of Indonesia Final Report
3-41
Figure 3.3.11 Alignment of Private Jetties in Gresik
Source: Based on the hearing by the Study Team

The Study for Development of the Greater Surabaya Metropolitan Ports in the Republic of Indonesia Final Report
3-42
3.4 Existing Shipping Services
0
20
40
60
80S
ingapore
Port K
elang
Hong K
ong
Tanjung Pelepas
Dili
Hongkong
Busan
Bangkok
Mum
bay
Om
aezaki
Shim
izu
Tokyo
Ulsan
Yokoham
a
Khor Fakkan
Manila-N
orth
Manila-S
outhport
Others
1) Overseas Shipping
Increasing container ship calls and diversifying trading ports. During the post-Economic Crisis period (1998 – 2005), container ship calls have doubled at Tanjung Perak, i.e., 2,075 ship calls in 1998 and 4,018 ship calls in 2005. During the same period, direct trading ports have been diversified from regional hub ports of Singapore and Hongkong.
As of January 2007, 180 container ship calls were reported. Taking account of their origin ports, Singapore (79 ship calls or dominantly 43.9%), Tanjung Pelepas (10 ship calls), Port Klang (16 ship calls) and Hongkong (18 ship calls) are regards as hub ports for Tanjung Perak. Beside those hub ports, Tanjung Perak received ship calls from other ports and countries directly without transferring to feedering services at the nearby hub ports already mentioned. They include Khor Fakkan (UAE), Mumbai (India), Bangkok (Thailand), Shanghai, Qindao and other mainland China ports, Busan and Ulsan (South Korea), Tokyo, Yokohama, Shimizu, Omaezaki and Hakata (Japan), Kaohsiung, Keelung (Taiwan) directly or dropping by Manila ports, New Zealand ports and Dili (Timor Leste). According to the voyage records compiled in DGST in 2005, the container ships calling at Tanjung Perak are relatively small feeder ships ranging from 14 TEU to 2,002 TEU and 341 TEU on the average.
Figure 3.4.1 International Container Shipping Calls
Source: Indonesia Sailings January 2007
Distribution of International Container at TPS. Table 3.4.1 shows the distribution of international container throughput at TPS. TPS only has “Port to Port Data” for imported container cargo, because a part of the cargo is consolidated at hub ports such as Singapore, Tanjung Pelepas and Hongkong. The share of imported container from Singapore is significantly higher than other ports. Moreover, 12.1% share of imported container is from Malaysia. Therefore, it seems that the imported container to/from TPS is served by feeder service.
On the other hand, for exported container cargo, TPS have an accurate export container cargo volume and true destination data. Export container volume is highest to Japan and United States. but, the ships directly callings to these countries are not so many, so it seems that export container also goes through hub ports such as Singapore, Tanjung Pelepas and Hongkong.
Ship Calls (Per/Mon.)
Port Origin

The Study for Development of the Greater Surabaya Metropolitan Ports in the Republic of Indonesia Final Report
3-43
Table 3.4.1 Distribution of International Container Throughput at TPS Import (Port of Loading) Export (True Destination Port)
No. Name of Port TEU/Year Percentage No. Country TEU/Year Percentage 1 SINGAPORE 238,000 52.7% 1 JAPAN 62,000 13.0%
2 MALAYSIA 55,000 12.1% 2 UNITED STATES 59,000 12.2%
3 PHILIPPINES 35,000 7.7% 3 SINGAPORE 50,000 10.3% 4 PTP 27,000 5.9% 4 CHINA 47,000 9.7% 5 HONG KONG 22,000 4.9% 5 MALAYSIA 42,000 8.8% 6 TAIWAN 14,000 3.1% 6 KOREA 24,000 5.0% 7 KOREA 13,000 2.8% 7 HONG KONG 22,000 4.5% 8 WSP 11,000 2.4% 8 TAIWAN 20,000 4.1% 9 CHINA 10,000 2.1% 9 AUSTRALIA 17,000 3.5% 10 AUSTRALIA 5,000 1.0% 10 VIET NAM 11,000 2.4% 11 MJJ 4,000 1.0% 11 NETHERLAND 11,000 2.3% 12 SGP 4,000 0.9% 12 INDIA 10,000 2.1% 13 MNN 3,000 0.7% 13 GERMANY 9,000 1.9% 14 VIET NAM 2,000 0.5% 14 PHILIPPINES 8,000 1.7% 15 QIN 2,000 0.5% 15 BELGIUM 8,000 1.6% 16 HKN 2,000 0.4% 16 UK 8,000 1.6% 17 LYG 2,000 0.3% 17 THAILAND 6,000 1.3% 18 UNKNOWN 1,000 0.3% 18 CANADA 6,000 1.2% 19 JAPAN 1,000 0.2% 19 FRANCE 5,000 1.1%
20 YYT 1,000 0.1% 20 NEW ZEALAND 4,000 0.9%
Source: TPS in 2006
International Non-container Shipping Service. The following table shows the distribution of international non-container volume estimated using Tg.Perak throughput cargo volume by PELINDO III and the voyage record from DGST. For both exports and the imports, the share of Singapore is high; however, it is not exceptionally high compared to the case of international container. Meanwhile, non-container cargos are directly transported to/from Asian countries.
Table 3.4.2 Estimated Distribution of International Non-Container Throughput
Import Export
No. Name of Port 000 Ton /Year % No. Name of Port 000 Ton
/Year % 1 Singapore 474 13.3% 1 Singapore 171 19.6% 2 China 280 7.9% 2 Korea 116 13.3% 3 Philippines 258 7.2% 3 China 78 8.9% 4 Taiwan 256 7.2% 4 Hongkong 62 7.1% 5 Japan 229 6.4% 5 Kaohsiung, Taiwan 44 5.0% 6 Hongkong 215 6.0% 6 Vietnam 41 4.7%
7 Australia 196 5.5% 7 Tg. Pelepas, Malaysia 39 4.5%
8 Thailand 174 4.9% 8 Thailand 30 3.4% 9 Port Klang, Malaysia 166 4.7% 9 Japan 29 3.3% 10 Brazil 97 2.7% 10 Australia 17 1.9% 11 Argentina 94 2.6% 11 Philippines 5 0.6%
12 Korea 91 2.6% 12 Port Klang, Malaysia 1 0.1%
13 Amerika Serikat 72 2.0% 13 Others 0 0.0% 14 Malaysia 71 2.0% Total 873 100.0% 15 Kandla 54 1.5% 16 India 36 1.0% 17 Vietnam 26 0.7% 18 New Zealand 21 0.6% 19 Tg. Pelepas, Malaysia 9 0.3% 20 Others 744 20.9%
Total 3561 100.0%
Source: Voyage Record DGST in 2005, PELINDO III Data in 2005

The Study for Development of the Greater Surabaya Metropolitan Ports in the Republic of Indonesia Final Report
3-44
0
10
20
30
40
50
Banjarm
asin
Makassar
Jakarta
Benoa
Sam
arinda
Balikpapan
Medan
Kum
ai
Kupang
Pantoloan
Sam
pit
Benete
Biak
Jayapura
Kendari
Sorong
Tarakan
Timika
Bitung
Bontang
2) Domestic Cargo Shipping
Domestic container ship calls and network. As of January 2007, 150 domestic container ship calls were reported, with the following primary trading ports: (i) Banjarmasin (45 ship calls or dominantly 30.0%), (ii) Makassar (22 ship calls), (iii) Jakarta (13 ship calls) and (iv) Benoa (12 ship calls). The number of ship calls from Banjarmasin is significantly higher than that of other domestic routes.
Figure 3.4.3 shows domestic container shipping network. The density of the network from Surabaya Port to Kalimantan island and Sulawesi island are substantial compared to other islands, demonstrating the influence of Surabaya port to East Indonesia. Furthermore, it seems that Surabaya port is the center of East Indonesia for domestic container movement.
Figure 3.4.2 Domestic Container Shipping Calls
Source: Indonesia Sailings January 2007
Figure 3.4.3 Domestic Container Shipping Network
Ship Calls (Per/Mon.)
Port Origin
To/From Surabaya
Source: STRAMINDO, 2002
Domestic Cargo Distribution. Figure 3.4.4 illustrates domestic cargo distribution to/from East Java. Cargo volume from East Java (Loading) is remarkably high for routes going to DKI Jakarta and eastern Kalimantan, and South Sulawesi. On the other hand, the cargo volume to East Java (Unloading) is predominantly coming from eastern Kalimantan. In addition, they also have connection with Sumatra Island. Therefore, trip distance of inbound cargo volume is longer than that of outbound cargo volume.
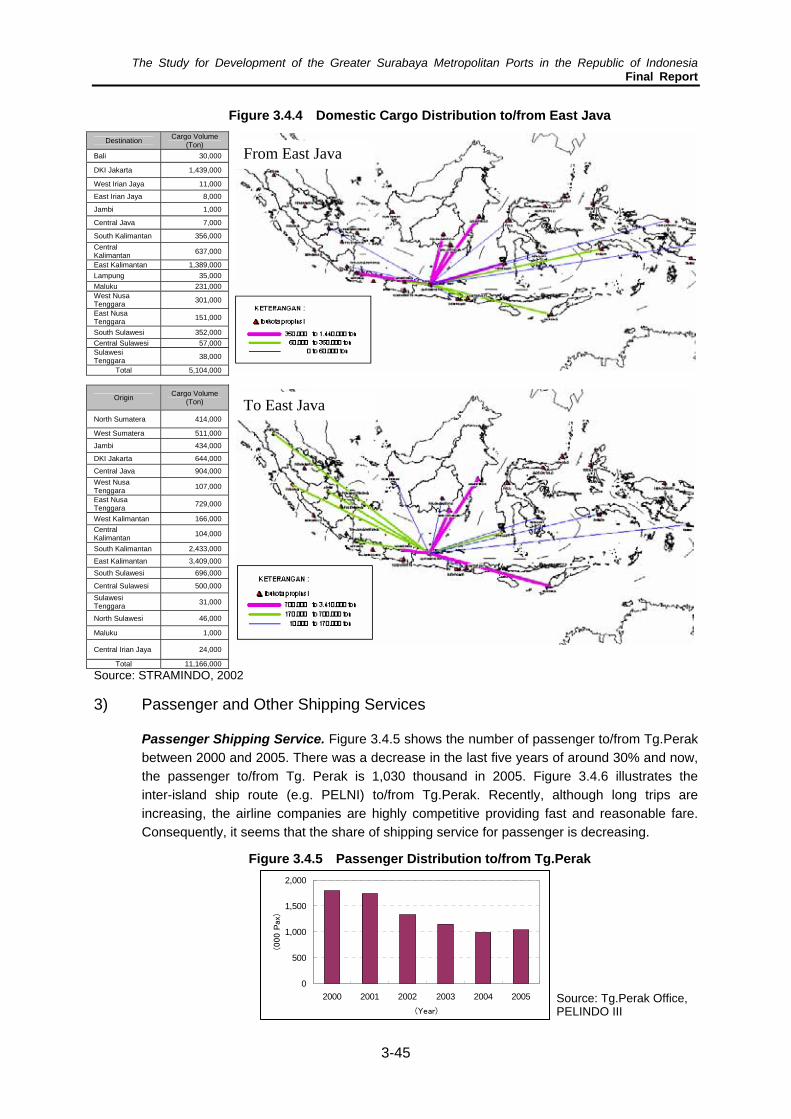
The Study for Development of the Greater Surabaya Metropolitan Ports in the Republic of Indonesia Final Report
3-45
Figure 3.4.4 Domestic Cargo Distribution to/from East Java
Destination Cargo Volume (Ton)
Bali 30,000
DKI Jakarta 1,439,000
West Irian Jaya 11,000
East Irian Jaya 8,000
Jambi 1,000
Central Java 7,000
South Kalimantan 356,000 Central Kalimantan 637,000
East Kalimantan 1,389,000 Lampung 35,000
0
500
1,000
1,500
2,000
2000 2001 2002 2003 2004 2005r)
(000 P
ax)
(Yea
Maluku 231,000 West Nusa Tenggara 301,000
East Nusa Tenggara 151,000
South Sulawesi 352,000 Central Sulawesi 57,000 Sulawesi Tenggara 38,000
Total 5,104,000
Origin Cargo Volume (Ton)
North Sumatera 000 414,
West Sumatera 511,000
Jambi 434,000
DKI Jakarta 644,000
Central Java 904,000 West Nusa Tenggara 107,000
East Nusa Tenggara 729,000
West Kalimantan 166,000 Central Kalimantan 104,000
South Kalimantan 2,433,000
East Kalimantan 3,409,000 South Sulawesi 696,000
Central Sulawesi 500,000 Sulawesi Tenggara 31,000
North Sulawesi 46,000
Maluku 1,000
Central Irian Jaya 24,000
Total 11,166,000
To East Java
From East Java
Source: STRAMINDO, 2002
3) Passenger and Other Shipping Services
Passenger Shipping Service. Figure 3.4.5 shows the number of passenger to/from Tg.Perak between 2000 and 2005. There was a decrease in the last five years of around 30% and now, the passenger to/from Tg. Perak is 1,030 thousand in 2005. Figure 3.4.6 illustrates the inter-island ship route (e.g. PELNI) to/from Tg.Perak. Recently, although long trips are increasing, the airline companies are highly competitive providing fast and reasonable fare. Consequently, it seems that the share of shipping service for passenger is decreasing.
Figure 3.4.5 Passenger Distribution to/from Tg.Perak
Source: Tg.Perak Office, PELINDO III

The Study for Development of the Greater Surabaya Metropolitan Ports in the Republic of Indonesia Final Report
3-46
Figure 3.4.6 Passenger Ship Route to/from Tg.Perak
Source: JICA Study Team
RoRo Shipping Service. Table 3.4.3 features the RoRo shipping service to/from Tg.Perak of the two existing operators for RoRo at Tg.Perak. Almost all RoRo shipping services are to/from Kalimantan island such as Banjarmasin, Balikpapan and etc., while others are to/from Maumere in Flores island. RoRo shipping service is characterized by relatively short distance routes compared to other shipping service types.
According to the interview on a RoRo shipping company, the number of passenger and number of vehicles which use RoRo services have been decreasing during the past 10 years. Even though the travel time of RoRo shipping service is shorter than other shipping services, the fare of RoRo shipping service is a little bit expensive, resulting in decreased patronage.
Table 3.4.3 RoRo Shipping Service to/from Tg. Perak No. of Vehicle (Car/Mon.) Operator Route Frequency
(Per Mon.) To Tg.Perak From Tg.Perak Banjarmasin 13 371 562 Balikpapan 5 103 206 Makasar 5 89 154 Sampit 3 77 88 Batulicin 3 49 100 Kumai 4 59 88
PT.DHARMA LAUTAN UTAMA
Maumere 3 79 174 Banjarmasin 10 167 270 Balikpapan 11 325 540 PT.PRIMA
VISTA Maumere 3 93 156 Total 60 1,412 2,338
Source: PELINDO III Tg. Perak Branch, Jan. 2007

The Study for Development of the Greater Surabaya Metropolitan Ports in the Republic of Indonesia Final Report
4-1
4 EXSITING ACCESSIBILITY TO PORTS
4.1 Existing Access Channels, Anchorages and Basins
1) Surabaya Access Channels, Anchorages and Basins
The Surabaya Access Channels consist of “the West Channel” and “the East Channel” and are parts of the Madura Strait. The West Channel is the access to/from the Java Sea for the port while the East Channel is the access to the Bali Sea. At the center of the Strait, are the ports of Tg. Perak and Gresik.
a. Surabaya West Channel
The Surabaya West Channel starts at Buoy No. 5 with a water depth of about 12m, orienting at the direction of 215°-035°. At the 2,000m point, there is Buoy No. 2 and the channel turns towards the direction of 020°-200°. At 11,800m the channel again bends as marked by Buoy No. 11. After passing Buoy No. 6 at the 16,300m point the channel resumes with a depth of about 15m. This portion of the West Channel constitutes the primary access to the port, which has a normal water depth of about 9.5m and a width of about 50m only. Hence, maintenance dredging is programmed for this portion to a depth of 10.5m with a width of 100m. In order to protect the channel from siltation, a training wall was constructed on the eastern side of the channel during the Dutch colonial time from Ujung Piring to Pulau Karang Jamuang, i.e. Pilot Station, which has a total length of about 13km.
b. Central Portion of Channel and Anchorages
After passing Buoy No. 6, the channel enters into a narrow deep area surrounded by Tg, Sawo on the Java Island and Tg. Slempit and Tg. Bulu on Madura Island. Then, the channel becomes relatively wide and deep becoming the anchorage areas of Gresik and Tg. Perak Ports. At the bend in front of Gresik and Lamong, the water depth is greater than 20m. There are five anchoring zones located on the northern side of the access channel in Tanjung Perak Port with designations as shown in Figure 4.1.1. Zone A is available for ships of length overall (LOA), less than 100m; Zone B is for ships of LOA between 100m and 151m, and Zone C, D and E are for barges.
Figure 4.1.1 Anchorage Areas in Gresik and Tg. Perak Ports
Source: Pelimdo III

The Study for Development of the Greater Surabaya Metropolitan Ports in the Republic of Indonesia Final Report
4-2
c. Surabaya East Channel
To the east of Tg. Perak Port the water area has a gradually wide width like a horn aperture, entering into the Bali Sea; however, the natural water depth is shallow. The deep portion of the channel is separated into three branches, The northern branch is blocked by a prohibited area where mines were once planted and the southern route is short near the beach of Surabaya City. Thus, only the central branch constitutes the Surabaya East Channel. The East Channel has a natural water depth of about 3m below CDL. Maintenance dredging has not been programmed in the East Channel, hence, only small ships can take the East Channel route.
2) Management, Operations and Maintenance of Access Channels and Basins
a. Management of Access Channels, Anchorages and Basins
The water area of the Access Channel is in the Port Interest Area (DLKP) and is managed by the Harbor Master in Administrator Pelabuhan Tg. Perak (ADPEL Tg. Perak) under DGST. ADPEL collects “Navigation Charge” from all the ships entering the port amounting to US$ 0.027/GRT for foreign ships, Rp. 220/GRT for domestic ships, and Rp.100/GRT for rakyats or traditional ships). The collected charge is transferred to the central government, or the Ministry of Finance, every week.
The anchorage is located in the Port Working Area (DLKR) and is managed by Pelindo III. Pelindo III charges “Port Entry Charge” to all the ships entering the port at a rate of US$0.084/GRT/call. Official procedures for a ship to enter/leave a port are under the management of ADPEL, while berth assignment is conducted by Pelindo which charges “Dockage Charge.”
b. Ship Operations at the West Channel
The ship operations at the West Channel are practically controlled as follow:
i) Pilotage is compulsory for ships larger than 500 GRT. A pilot commonly embarks a ship, for an arriving ship, at the Pilot Station and disembarks at the pier, and, for a leaving ship, embarks at the pier and disembarks the ship at Buoy No. 5, as far as it is possible. “Pilotage Fee” is charged by Pelindo.
ii) The right to enter and pass the West Access Channel is given to the ship that arrived first, based on the principle of “First Come –First Service.” The ship that arrived later shall wait until the former ship passes through the channel. Exception is small ships which can enter the channel even if a large ship is passing the channel. The distance between the passing ships shall be larger than 100m.
iii) Large ships which have drafts deeper than 8m shall not pass or cross each other in the West Access Channel.
iv) In the channel, ship navigation speed is maintained at less than 8 knots.
c. Maintenance of Access Channels and Basins
According to the Dredging Plan of Pelindo III, the access channel is scheduled to be maintained by regular dredging as shown in Table 4.1.1. The West Access Channel is to be dredged to a depth of 10m every 4 years by the Government. It is, however, actually dredged by Pelindo III, utilizing the dividends of Pelindo III allotted to the government.

The Study for Development of the Greater Surabaya Metropolitan Ports in the Republic of Indonesia Final Report
4-3
Table 4.1.1 Maintenance Plan of Channels and Basins by Pelindo III
Facility Depth (m)
Volume (m3)
Interval (year) Remarks
1. West Access Channel 10.0 750,000 Once 4 years By the Government 2. Tg. Perak Basins 6.0 -10.0 300,000 Every year By Pelindo III 3. Kalimas North 3.0-3.5 100,000 Once 2 years Ditto Kalimas South 2.0-3.0 100,000 Ditto Ditto 4. Gresik Pelra Wharf Basin 5.0 100,000 Ditto Ditto Gresik Nusantara Wharf 6.0 100,000 Ditto Ditto
In the past the maintenance dredging at the West Access Channel was carried out in 1997, 2002, and 2005. The records of maintenance dredging before 1997 are not available. The dredged volume in 2005 was 687,000 m3 according to “the Dredging Report” of Pelindo III. For reference, the list of available navigation charts and bathymetric maps is presented in Table 4.1.2, Table 4.1.3, and Table 4.1.4.
Source: Pelimdo III

The Study for Development of the Greater Surabaya Metropolitan Ports in the Republic of Indonesia Final Report
4-4
Table 4.1.2 List of Navigation Chart and Bathymetric Maps at Surabaya West Access Channel (1)
Location Publisher Data Type No. Version Scale Time Surveyed
Survey Area (Spot No.)
Minimum Depth (m) Remarks
70 9th 1/500,000 Sept 2005 All East Jawa - - 82 8th 1/200,000 Mar 2006 Surabaya and Madura - - 96 8th 1/75,000 Dec 2004 West and East Channels - - The Navy Navigation
Charts 84 5th 1/12,500 Dec 2004 Tg. Perak and Gresik - Incl. Lamong Bay.
72231 8th 1/75,000 - Port of Surabaya and Approaches -
USA Navigation Charts 72234 2nd 1/12,508 - Pelabuhan Surabaya and
Gresik -
From Indonesian and British Admiralty charts to
1996.
975 1st 1/80,000 - Approaches to Surabaya -
Edition Date:20th Jan. 2005.
This Chart and No.96 of the Navy are the same
almost.
Surabaya Approach Channel
(West and East)
United Kingdom
Navigation Charts
921 4th 1/15,000 - Pelabuhan Surabaya and Approaches -
Edition Date:24th Nov. 2005.
This Chart and No.84 of the Navy are the same
almost. 0 – 3,500 9.7
3,500 – 7,000 9.8 7,000 – 10,500 11.8
Surabaya West
Approach Channel
Pelindo III Bathymetric Charts - - 1/2,500
09 Sep. 1987 -
13 Nov. 1987 10,500 – 14,000 10.2
Data collection Inner Channel
Source: JICA Study Team

The Study for Development of the Greater Surabaya Metropolitan Ports in the Republic of Indonesia Final Report
4-5
Table 4.1.3 List of Navigation Chart and Bathymetric Maps at Surabaya West Access Channel (2)
Location Publisher Data Type No. Version Scale Time Surveyed
Survey Area (Spot No.)
Minimum Depth (m) Remarks
0 – 4,000 8.0 4,000 – 8,000 8.6
8,000 – 12,000 9.4 - - 1/2,500 25 Oct. 1988
- 20 Nov. 1988
12,000 – 16,000 9.6
Data collection The corner: 8.4m Outer Channel
0 – 4,000 7.4 4,000 – 8,000 8.6
8,000 – 12,000 8.7 - - 1/2,500
11 Sep. 1990 -
10 Oct. 1990 12,000 – 16,000 8.9
Data collection The corner: 9.9m Outer Channel
0 – 4,000 8.4 4,000 – 8,000 8.2 - - 1/2,500 Sep. 1995
8,000 – 12,000 6.5
Data collection The corner: 6.5m Outer Channel
0 – 4,000 7.0 4,000 – 8,000 8.1
8,000 – 12,000 10.0 - - 1/2,500
8 May 1996 -
1 June 1996 12,000 – 16,000 10.1
Before dredging The corner: 10.2m
Outer Channel
0 – 4,000 8.0 4,000 – 8,000 9.2
8,000 – 12,000 9.7
Surabaya West
Approach Channel
Pelindo III Bathymetric Charts
- - 1/2,500 Jan. 2002
- Jan. /2002
12,000 – 16,000 9.3
Before dredging The corner: 9.5 m.
Outer Channel
Source: JICA Study Team

The Study for Development of the Greater Surabaya Metropolitan Ports in the Republic of Indonesia Final Report
4-6
Table 4.1.4 List of Navigation Chart and Bathymetric Maps at Surabaya West Access Channel (3)
Location Publisher Data Type No. Version Scale Time Surveyed
Survey Area (Spot No.)
Minimum Depth (m) Remarks
0 – 4,000 10.1 4,000 – 8,000 10.2
8,000 – 12,000 10.0 - - 1/2,500 05 Apr. 2002
- 16 Apr. 2002
12,000 – 16,000 10.1
After dredging The corner: 10.3 m.
Outer Channel
0 - 2,600 9.3 2,600 – 6,000 9.7 6,000 – 9,000 9.9
9,000 – 11,900 9.5 - - 1/2,500
29 Aug. 2005 -
7 Sep. 2005
12,000 – 15,000 10.0
Before dredging The corner: 9.3 m
Outer Channel
0 - 2,600 10.5 2,600 – 5,900 10.5 6,000 – 9,500 11.0
9,600 – 12,400 10.7
Surabaya West
Approach Channel
Pelindo III Bathymetric Charts
- - 1/2,500 14 Feb. 2006
- 23 Feb. 2006
12,500 – 15,700 10.5
After Dredging The corner: 10.8 m
Outer Channel
Tg. Bulupandan
Univ. Gadlah Mada
A3-size Drawing - - 5.9/100,000 2004 Tg. Modung –Tg.
Bulupandan - For East Jawa Province.
Source: JICA Study Team

The Study for Development of the Greater Surabaya Metropolitan Ports in the Republic of Indonesia Final Report
4-7
3) Navigation Aids in Access Channels and Harbor Areas
a. Arranged Navigation Aids
The navigation aids (Nav, Aids) in and around the Access Channel and Anchorages are summarized in Table 4.1.3, which are all maintained by the government through the District of Navigation Surabaya under DGST. They are divided into four kinds, i.e. two light houses, 24 light buoys, 13 unlighted buoys, and 13 light beacons. These Nav.Aids are playing a vital role to assist safety navigation of ships in the port.
b. Maintenance of Navigation Aids
The light buoys are all equipped with solar battery systems.The buoys are maintained regularly at intervals of three months; however, it is said that there are no extra buoys for stocking and spares. There are other minor navigation aids such as caution buys showing the submarine cables of PT. PLN. At this moment, there is no Vessel Traffic Management System (VTS) equipped with radar in Surabaya Port.
4) Obstacles and Prohibited Areas in Access Channels and Anchorages
a. Sunken Ships
On the navigation chart, there are 14 wrecks and 5 obstructions along the West Access Channel. Additionally, there are 24 wrecks and obstacles at the anchorages in front of Jamrud Wharf and TPS Pier of Tg. Perak Port.
b. Submerged Pipeline and Power Cables
There are some red-letter infrastructure buried under the seabed The one is the gas pipeline laid along the channel on its west side from the Java Sea to the Power Station at Gresik. A strip covering the pipeline is designated as the prohibited area, forming the substantial limit of port facilities on the west bank of the Madura Strait.
The other is the 150,000-volt electric power cables crossing the channel at Gresik from PLN Wharf to Tanjung Tanjungan on Madura Island. There are three cables, one of which was abandoned after the cut-off accident in 1997. Two lines are now operational, which constitute vital lifelines for the people of Madura. Their coordinates are (7°9’ 57”S, 112°40’12”E) and (7°9’ 36”S, 112°40’53”E). A belt of 800m to 1,130m wide crossing the channel in which the cables are laid is designated to be no anchoring area, which are indicated by yellow caution buoys.
It is agreed among the parties concerned that this anchor-prohibited area for protection of the power cables is to be patrolled by the patrol boats of the Harbor Master three times a day as agreed in “Safety Procedure (PROTAP) for Submarine Cable 150,000 Volt between Jawa - Madura” dated 18 May 2006.
c. Other Obstacle
An important natural obstacle in the West Channel is an invisible shoal of hard seabed material with a depth of only 4.7m (surrounding water has 12m-depth) located in front of PT Smelting Pier. There is no marker buoy on the spot.
The above-mentioned obstacles are illustrated in Figure 4.1.2.

The Study for Development of the Greater Surabaya Metropolitan Ports in the Republic of Indonesia Final Report
4-8
Table 4.1.5 List of Navigation Aids Arranged at Madura Strait
No Name Co-ordinate (Degree-Minute-Second) Color Elev.
(m) Light (NM)
Year Built Loca- tion
1. Light House
1 Karang Jamuang 06-55-35S 112-43-42E White 41 20 1970 Pilot St.
2 Sembilangan 07-03-30S 112-40-30E White 53 20 1879 Bangkaln 2. Light Buoy 1 MPMT 06-45-00S 112-44-00E White 6 6 - 2 No.1 06-46-30S 112-44-10E Green 6 6 - 3 Pelsu. No 1 06-46-06S 112-42-50E Yellow 3 5 1995
4 No.3 06-49-31S 112-44-32E Green 6 4 -
5 Pelsu. No.2 06-49-53S 112-43-23E Yellow 3 3 - 6 No.5 06-52-38S 112-44-40E Green 6 6 - 7 No.2 06-53-20S 112-44-20E Red 6 6 - 8 Pelsu. No.3 06-53-13S 112-43-16E Yellow 3 3 - 9 No.7 06-54-8.5S 112-43-46E Green 6 6 - 10 No.4 06-57-50S 112-42-30E Red 6 6 - 11 Pelsu. No.4 06-57-51S 112-41-25.4E Yellow 3 5 - 12 No.9 06-57-45S 112-42-23E Green 6 6 - 13 No.11 06-58-22S 112-42-08E Green 6 6 - 14 No.6 07-00-15S 112-41-00E Red 6 6 - 15 No.15 07-05-07S 112-39-10E Green 6 6 - 16 No.13 07-02-08S 112-39-47E Green 6 6 - 17 Pelsu. No.5 07-03-38S 112-39-30E Yellow 3 3 - 18 No.8 07-07-46S 112-39-36E Red 6 6 - 19 No.10 07-10-52S 112-41-19E Red 6 6 - 20 Typison 07-10-30S 112-40-50E Green 6 6 - 21 No.12 07-11-20S 112-42-48E Red 6 6 -
West Ch.
22 Kamal 07-11-04S 112-43-40E Red 6 6 - 23 Kawitan 07-11-38S 112-43-29E 6 6 - Tg. Perak
24 MPMT 07-11-04S 112-43-40E Red 6 6 - East Ch. 3 Unlighted Buoy 1 Green 06-52-42S 112-44-21E Green 2 Gr. Budi Mumi 06-52-14S 112-44-35E Green West Ch.
3 Kamal 07-11-09S 112-43-28E 4 Kamal 07-11-06S 112-43-40E
Kamal Water
No Name Location (Degree-Minute-Second) Color Elev.
(m) Light (NM)
Year Built Notes
5 No.1 07-23-35S 112-57-15E 6 No.2 07-21-22S 112-35-12E 7 No.3 07-19-08S 112-53-20E 8 No.4 07-15-50S 112-50-01E 9 No.5 07-14-35S 112-51-45E 10 No.6 07-13-25S 112-50-35E 11 No.7 07-15-15S 112-45-59E 12 No.8 07-11-27S 112-48-07E
East Ch.
13 HMMD 07-12-14S 112-43-44E Mirah Port 4. Light Beacon 1 Ug.Pangka 06-50-28.4S 112-32-49.4E White 33 16 1997 Jawa S. 2 Maphia 06-59-18S 112-42-00E White 11 8 1997 West Ch. 3 Ug. Piring 07-22-00S 112-41-00E White 14 7 1974 Bangkalan 4 Kuning No.6 07-08-26.8S 112-39-16.8E Yellow 7 5 1993 5 Kuning N0.7 07-08-33.5S 112-39-21.1E Yellow 7 5 1993 6 Kuning No.8 07-08-48.8S 112-39-26.4E Yellow 7 5 1993
Gresik
7 Pisang 07-11-11S 112-41-14E Green 12 10 2003 West Ch. 8 Ujung 07-11-48S 112-44-20E Red 9 4 1982 Lantamal 9 Queen Olga 07-10-52S 112-43-52E Red 11 7 - Kamal 10 Kesek 07-09-44S 112-45-57.5E White 23 10 1983 Komplek 11 Sirumpa 07-24-32S 113-04-11E White 13 10 - 12 Karang Koko 07-28-18S 113-07-00E White 13 12 1985 13 Manila 07-21-36S 113-10-11E White 12 10 1998
East Madura Strait
Source: District Navigasi Kelas Surabaya

The Study for Development of the Greater Surabaya Metropolitan Ports in the Republic of Indonesia Final Report
4-9
Figure 4.1.2 Existing Obstacles against Seaborne Traffic at Madura Strait

The Study for Development of the Greater Surabaya Metropolitan Ports in the Republic of Indonesia Final Report
4-10
5) Accidents in Access Channels
The Surabaya West Access Channel is considered as one of the most dangerous places for ships, because of its narrow and shallow channel dimensions and other obstacles. The most critical black spot is the entrance of the Channel, or the segment between Buoys No. 5 and No.7. Maritime accidents which took place in the Access Channel, Gresik and Tg. Perak ports are summarized in Table 4.1.4. The most frequent accidents are brushing and crashing between two ships. Running aground happened sometimes.
Another critical aspect is the submarine cables. The PLN power cables have been cut off by anchors of drifting ships 10 times since their installation in 1987 (see Table 4.1.5). The most serious incident occurred in February 1999, when both of the two submarine cables were cut by a container ship named “Kota Indah,” resulting in a complete black out of Madura Island for almost four (4) months. It is planned that the new cable lines will be laid on the Suramadu Bridge, which is expected to be operational in 2009. The existing cable lines, however, will be continually used as maintenance circuits, even after the new lines on the Bridge will start to operate
Table 4.1.6 Record of Maritime Accidents in Surabaya Port
No. Name of Ship Loa (m) Year Situation
1 MT Bruce Savarino 158 1979 Ran aground between Buoy No 7 and Buoy No. 2. Foggy weather:.
2 MV Ned Lloyd 170 1987 Ran aground nearby Buoy No 8. 3 MV Banones 165 1999 Banones ship’s prow brushed against MV Ganda Satria. 4 MV Bogasari V 200 2000 Bogasari Nilam brushed against two pilot boats.
5 MV Challenger 165 2000 The ship was out of control and brushed against Neptunus Ship.
6 MT Banda Sea 175 2000 The ship brushed against Buoy No. 2 while entering outer gate.
7 MT Clarice 121 2000 The ship brushed against MT Bali Hua that anchored in Gospear.
8 MT Clarity 174 2000 The ship brushed Buoy No. 5.
9 Caraka Jaya Niaga III-7 98 2000 Wharf position is against current, it caused the ship toss aside.
10 Asian Oil I 81 2001 Leaving Berlian wharf, Asian Oil’s right prow brushed against the next ship’s prow.
11 MV Atlantic 168 2001 It caught on Buoy No. 2 and dragged it along anchoring area “Tanjung Perak”.
12 KM Permai III 132 2002 Crashed TK Rima Mega 27 in Anchor Buoy “ Surabaya”.13 Perdana 107 2002 While anchoring, crashed KM Fudi.
14 MV Uni Chart 153 2003 The ship crashed KM Mandiri Nusantara in front of Petro Kimia Gresik wharf.
15 KM Pangrango and KM Seiko 74 2003 KM Paranggo leaving the wharf without anchor guide, it
crashed KM Seiko that anchored near by.
16 MT Panca Samudra and MT Apal 176 2003 Both ships entering the wharf at the same time and
crashed with each other. 17 Wan Hai 263 198 2004 Ran aground nearby Buoy No. 7. 18 MT Madina and MT MR I 170 2005 Crashed nearby Buoy No. 4 at 12.20 am. 19 MV Jubire Glory 211 2005 While mooring in TPS, right prow brushed against crane.
20 MV. Peach Mountain and MV. Uni Premier 195 2006 MV Peach Mountain crashed MV Uni Premier between
Palkah 4 and Palkah 5. Source: Pelindo III Tg. Perak Branch Office Commercial Department Note: MT: Motor Tanker, MV (KM): Motor Vessel, TK: Barge

The Study for Development of the Greater Surabaya Metropolitan Ports in the Republic of Indonesia Final Report
4-11
Table 4.1.7 Record of Accidents of PLN Submarine Cables Cable No.
Date of Accident Cause and Conditions Date of
Recovery Remarks 2/12/94 Steel Pile contacted and damaged the cable 94 Started operation on
2/12/87 19/2/99 Cut by anchor of container ship “Kota Indah” 10/6/99 All the two cables were cut
to Madura Island 3/8/99 Cut by anchor of tug boat “Anoman
VII” 8/99
24/4/02 Damaged by anchor of Dredger owned by PJB
2/12/02
No.1
150 kV, 120 MVA
18/2/05 Ditto 4/10/05 10/6/94 Cut by anchor of “Ocean Competence” 15/10/96 Started operation on
3/6/87 19/2/99 Cut by anchor of “Kota Indah” 29/4/99 Cut simult. with No.1
No.2 150 kV,
120 MVA 30/11/05 Cut by anchor of barge “Taurus” 19/5/06
7/10/96 Cut by anchor of “Festivity” 25/7/97 Started operation on 25/6/97
No.3 150 kV,
120 MVA
30/11/05 Cut by anchor of “Bali Sea” - Could not be repaired
Source: PT PLN
4.2 Existing Land Access Transport
1) Distribution Patterns
In order to understand the existing condition of land access transport, a truck driver interview survey and a truck count survey in Tg. Perak was conducted. The results of the survey are described as follows.
Container Cargo: The number of sampled container trailer was 2,585 drivers and the sample rate is 5.3% in TPS, Berlian and Jamrud. Table 4.2.1 and Figure 4.2.1 shows the estimated container cargo distribution pattern between Tg. Perak and its direct hinterland. Overall, the container cargo volume to/from Surabaya city is the highest. In the surrounding areas of Surabaya city, such as Gresik and Sidoarjo, the unloaded container volume is higher than the loaded container volume. In other areas, i.e. Mojokerto city, Pasuruan, Malang and Probolinggo, the unloaded container volume is lower than the loaded container volume. It shows that industrial estates from these areas contribute to the high number of exports and these industrial estates support the transportation of container cargo. Thereby, exported goods tend to traverse longer distance than imported goods.
Table 4.2.1 Estimated Container Volume Distribution Container Total TEU/Year Loading Unloading
Kota Surabaya 385,000 370,000 Gresik 177,000 233,000 Kota Mojokerto 89,000 28,000 Other East Java 65,000 127,000 Pasuruan 58,000 37,000 Malang 55,000 32,000 Sidoarjo 46,000 72,000 Probolingggo 27,000 1,000 Central Java 14,000 5,000 Bojonegoro 7,000 3,000 Kab. Mojokerto 6,000 18,000 Lamongan 3,000 3,000

The Study for Development of the Greater Surabaya Metropolitan Ports in the Republic of Indonesia Final Report
4-12
Non-container Cargo: The number of sampled non-container truck was 1,255 drivers and sample rate is 10.8% in Berlian and Jamrud. The highest volume of non-container cargo is towards Surabaya city and Sidoarjo has the second highest share. Mojokerto, Jombang and Pasuruan also generate quite a high volume of non-container cargo. On the other hand, the volume in Gresik is quite low because there is another public port located in Gresik. Estimated non-container cargo distribution is shown in Table 4.2.2 and Figure 4.2.2.
Table 4.2.2 Estimated Non-Container Volume Distribution Ton/Year Loading Unloading
Kota Surabaya 4,928,000 1,696,000 Gresik 46,000 119,000 Kota Mojokerto 411,000 11,000 Kab. Mojokerto 34,000 0 Sidoarjo 1,465,000 457,000 Bangkalan 20,000 4,000 Pasuruan 264,000 225,000 Malang 26,000 11,000 Jombang 288,000 31,000 Sampang 10,000 0 Sumenep 9,000 5,000 Other East Java 325,000 352,000 Jakarta 21,000 15,000 Central Java 20,000 87,000 Yogyakarta 27,000 5,000
RoRo Cargo: The number of sampled Ro-Ro truck was 153 drivers and with a sample rate of 5.3% in Jamrud RoRo terminal. The results show that Surabaya city has significantly the highest share of cargo. The access distance to/from the direct hinterland is shorter than other cargo types. Estimated RoRo cargo distribution is shown at Table4.2.3.
Table 4.2.3 Estimated RoRo Cargo Distribution
Truck Using RoRo Terminal Loading Unloading Kota Surabaya 82.8% 77.6% Kota Mojokerto 0.5% 2.7% Sidoarjo 0.4% 3.6% Bangkalan 0.5% - Pasuruan 2.9% 2.7% Malang 0.6% 4.7% Jombang 0.1% 1.0% Probolingggo 1.0% 1.4% Other East Java 10.1% 1.0% Container Station 0.0% 0.0% Central Java 1.2% 5.3% Total 100.0% 100.0%

The Study for Development of the Greater Surabaya Metropolitan Ports in the Republic of Indonesia Final Report
4-13
Figure 4.2.1 Estimated Container Cargo Distribution Pattern in 2006
To Tg.Perak (Loading (Import))
From Tg.Perak (Unloading Export)

The Study for Development of the Greater Surabaya Metropolitan Ports in the Republic of Indonesia Final Report
4-14
Figure 4.2.2 Estimated Non-Container Cargo Distribution Pattern in 2006
To Tg.Perak (Loading) From Tg.Perak (Unloading)
Figure 4.2.3 Estimated RoRo Cargo Distribution Pattern in 2006
From Tg.Perak (Unloading) To Tg.Perak (Loading)
2) Other Characteristics
a. Cargo Consignor/Consignee Type
Container Loading (Export): In the Study area, excluding Surabaya city, the highest percentage of container cargo comes from factory. On the other hand, in Surabaya city, the percentage is higher for warehouse rather than factory.
Container Unloading (Import): In general, the main destination for the unloaded container cargo is truck terminal. From the truck terminal, the cargo is further distributed in smaller lots by small trucks which can conveniently distribute the cargo to the final destination. In Surabaya city and other East Java, depots (which is similar to truck termimal) plays a major role as destination for unloaded container cargo.

The Study for Development of the Greater Surabaya Metropolitan Ports in the Republic of Indonesia Final Report
4-15
Figure 4.2.4 Container Cargo by Origin & Destination Type
oading
31.4%
69.6%
79.9%
29.9%
38.0%
15.1%
10.7%
11.1%
11.5%
4.5%
32.2% 13.0%
5.2%
0.7%
4.6%
5.9%
2.2%
0% 20% 40% 60% 80% 100%
Surabaya
Study Area
Other East Java
Others
Loading (Origin)
Unloading
18.2%
15.7%
12.1%
10.9%
34.1%
55.9%
14.5%
35.5%
47.0%
29.9%
43.6% 9.1%
0.8%
3.5%
22.7%
4.7%
2.3%
3.1%
0% 20% 40% 60% 80% 100%
Surabaya
Study Area
Other East Java
Others
Unloading (Destination)
Office market factory warehouseDepo rail station port truck terminalcontainer terminal industrial zone agriculture area estateothers
Figure 4.2.5 shows the distribution of non-container cargo by OD type between Tg. Perak and its direct hinterland.
Non-container Loading: Overall, the percentages of factory and warehouse as OD type for loaded non-container cargo are significantly higher than other types. In the Study area, the share of depot is 75.4%, and it is especially high in Sidoarjo. The share of railway station as OD type in Surabaya is only 7.2%.
Non-container Unloading: Overall, the percentages of factory and warehouse as OD type for unloaded non-container cargo are significantly higher than other OD type.
Figure 4.2.5 Non-Container Cargo of Origin & Destination Type
Loading
41.7%
54.0%
33.8%
31.8%
10.7%
11.8%
44.9%
2.1%
75.4%
7.2%
3.7%
4.0%
18.6%
0% 20% 40% 60% 80% 100%
Surabaya
Study Area
Other East Jawa
Others
loading
27.1%
40.7%
35.7%
40.5%
29.9%
27.7%
36.0%
22.7%
30.4%
19.7%
4.8%
6.2%
0% 20% 40% 60% 80% 100%
Surabaya
Study Area
Other East Jawa
Others
※Study area excludes Surabaya city.
Loading (Origin)
Unloading (Destination)
※Study area excludes
Surabaya city. Office market factory warehouseDepo rail station port truck terminalcontainer terminal industrial zone agriculture area estateothers

The Study for Development of the Greater Surabaya Metropolitan Ports in the Republic of Indonesia Final Report
4-16
b. Vehicle Type
Figure 4.2.6 shows the vehicle types to/from Tg. Perak and the location map of the counting stations used in the truck count survey. In the container berths such as TPS, Jamrud and Berlian, there are only two types of vehicles, i.e. 40 foot container trucks and 20 foot container trucks. On the other hand, the truck types for non-container cargo are varied, e.g. pickups, medium trucks, large trucks, and bulky cargo. For Ro-Ro cargo, the vehicle size is appreciably smaller than the vehicle size used in other cargo types. The figure shows that most of the vehicles in the RoRo terminal are pickup trucks, small box trucks, and medium trucks.
Figure 4.2.6 Vehicle Type to/from Major Berth in Tg.Perak
39.3%
24.2%
16.2%
4.8%
37.0%
12.8%
18.0%
47.3%
52.7%
26.2%
9.8%
0% 20% 40% 60% 80% 100%
Container(TPS & Jamrud &
Belian)
Non-container (Jamrud & Belian)
RoRo(Jamrud)
TC-3
TC-1 TPS Export
TC-1 TPS Import
TC-2
TC-4 TC-5 Barge, Bulk
(Domestic)
(International)
CFS
TPS
RoRo Jamrud
Berlian
Barge, Bulk
Pickup
Small Box Truck
Medium Truck (2 axle)
Large Truck (3 axle)
Container Truck 20 Feet
Container Truck 40 Feet
Bulky Cargo
Tank trailer
Other Truck
Pickup
Small Box Truck
Medium Truck (2 axle)
Large Truck (3 axle)
Container Truck 20 Feet
Container Truck 40 Feet
Bulky Cargo
Tank trailer
Other Truck
Note: TC-X shows A survey point
It is noted that the mud spouting and outflow incident in Porong, Kabupaten Sidoarja, which up to present has not been solved, discouraged the use of Tg. Perak port in 2006. The results of the truck counting and interview survey which was conducted on 16-20 December 2007. may have been affected by the incident.
3) Rail and Rail Freight Service
Intra-regional Freight Rail. Railway transports cargo to Tanjung Perak through two ways. For container haulage, rail service is extended to Kalimas Station and then containers are transferred by truck. For other cargoes, Pasar Turi Station works as a transfer point between rail and truck. The central container handling station is located at Pasar Turi in Surabaya City. In Gresik, there is no branch line connecting to Gresik Port; however, some large industrial cargo shippers have siding lines such as Semen Gresik and Petrokimia.
Port Branch Line. There exists a railway track in the premises of Tg. Perak Port as illustrated in Figure 4.2.7. According to PT. KAI, this branch line is being rehabilitated and expanded to

The Study for Development of the Greater Surabaya Metropolitan Ports in the Republic of Indonesia Final Report
4-17
double tracks by the Directorate General of Railways, MOT in 2007. After resumption, PT. KAI plans to revive the operation of freight train to deal with the container traffic in Tg. Perak port i.e. the berth of Nilam, Berlian and TPS. (Refer to Figure 4.2.7)
Figure 4.2.7 Railway Tracks in Tg. Perak
4) Port Access Hampered by Mud Spouting and Outflow
a. Incident TImeline
The mud outflow started on 29 May 2006 at the natural gas field operated by PT Lapindo Brantas Inc. along the Gempol-Porong segment of Surabaya-Gempol Toll Road in Sidoarjo around 36 km south from Tanjung Perak. The mudflow has been continuing to date, and no effective technical solution to stop this mudflow has been found yet.
There are 23 drilling rigs operating in and around this area for crude oil or gas. Of which 8 wells have been extracting natural gas already. One of the drilling rigs reached a depth of over 3,000 meters underground in May 2006. Two days after the earthquake which killed over 6,000 people in Yogyakarta, neighboring Central Java, the mud started seeping into the well at a depth around 1,800 meters, and cement plugs were put in to stop it. However this was ineffective, as pressurized hot mud forced its way to the surface near the well.
A large number of people were affected by the high level of hydrogen sulfide which escaped when the mudflow broke through to the surface, and 900 people required medial treatment. The mud flowed continuously at a rate of 1.5 cubic meters per second or 65,000 cubic meters per day and the mud has inundated eight villages covering an area of 400 hectares already. Around 3,300 families or 16,500 people had to be relocated by October 2006, and at present the number of people affected directly by this mudflow disaster reached almost 30,000
On 22 November 2006, the gas pipeline (28 inch diameter) owned and operated by East Java Gas Pipeline (EJGP) crossing over the area inundated by mud was broken and exploded killing

The Study for Development of the Greater Surabaya Metropolitan Ports in the Republic of Indonesia Final Report
4-18
of 12 persons. The EJGP has been shutdown following the explosion. This gas pipeline explosion has disrupted upstream gas production and deliveries to users in the surrounding area. Several gas production operations have been shut down as well. As the gas production and delivery was disrupted, it has impacted major consumers of gas such as PT PLN for power generation and PT Petrokimia Gresik for fertilizer production. Industries in the provinces of East Java have been greatly affected, particularly in and around Surabaya.
In March 2007, the jumper pipeline of around 2.5 km was installed tentatively to restore the gas distribution situation and 140 MMSCFD of gas is channeled through the pipeline to the customers in the province.
Because of so called “Sidoarjo Mudflow Disaster”, the southern part of Surabaya – Gempol toll road, national highway, railroad, water transmission line, and power transmission line have lost their function and are required to be relocated.
The following vividly depicts the extent and magnitude of the devastation caused by the Sidoarjo Mudflow Disaster..
Figure 4.2.8 Disastrous Conditions
Residential Area covered by mud
Toll road inundated by mud Mudflow Disaster Area
b. Restoration Effects
The Board of the Sidoarjo Mud Control (BPPLS) was established in April 2007 and is directly under the presidential office to undertake coordination of various measures to restore the situation and remedy the failure of infrastructures in and around disaster area. The realignment of highways, railways, water and power transmission lines, and gas pipeline is being planned and the emergency budget for the implementation of restoration works has been earmarked from the national budget although it is not sufficient for full recovery
At present the construction and maintenance of dikes have been going on to prevent further overflow of mud to the surrounding area. Figure 4.2.9 illustrates the scheme for the construction of such dikes to prevent further outflow of mud.

The Study for Development of the Greater Surabaya Metropolitan Ports in the Republic of Indonesia Final Report
4-19
The height of the dike constructed just around the mudflow well reached already 18 meters. Meanwhile, the height of dike preventing the outflow of mud is 7 meters but it is going to be increased to 9 to 11 meters in this year.
Figure 4.2.9 Area-wide Restoration Scheme
Source: Board of the Sidoarjo Mud Control (BPPLS)
c. Infrastructure Restoration and Alternative Development
Toll Road: The detailed implementation plan of relocation of toll way has completed yet. Nontheless, the new toll road section is planned to be relocated 3.5 km west from the outer dike, with a length of around 12 km. Assuming a unit cost per km is around Rp. 72 billion or US$ 8 million per km, the total cost for the relocation of the toll road is around Rp. 864 billion or US$ 96 million. The closure of a part of Surabaya – Gempol toll road at southernmost portion has increased transport time by around 2.5 hours; while, transport cost increased by 20% or more, substantially impacting shippers and business entities especially the manufacturers located in the PIER where many Japanese manufactures are concentrated (27 Japanese companies).
Railroad: The railroad segment affected by the mudflow is located at markers km 33+400 – km 34+000, a total length of around 600 meters between Tanggulangin – Porong line. 46 trains pass this section daily. The relocation of the railroad is planned on west side of the mud flow center by distance of 4 km. The total length of the railroad bypass is around 18 km, at as estimated cost of around Rp. 450 billion or US$ 50 million. Rp. 100 billion or US$ 11.0 million has been already allocated from the supplemented national budget and the balance will be arranged from the budget of the Ministry of Transport.

The Study for Development of the Greater Surabaya Metropolitan Ports in the Republic of Indonesia Final Report
4-20
Gas Pipeline: The jumper gas pipeline was constructed as a tentative solution for the transmission of gas mostly to Gresik industrial consumers at a cost of Rp. 50 billion or US$ 5 million. The cost of a long-term gas pipeline bypass is planned to be located at 12 km east of the affected area at a cost of around Rp. 300 billion or US$ 33.3 million.
Therfore, the total cost for relocation of these transport infrastructures alone will be around Rp. 2.05 trillion or US$ 230 million.
5) Impact Estimation on Hampered Port Access
Location of Industrial Estate in GKS: There are seven (7) industrial estates in East Java province. The outlines of these industrial estates are tabulated in Table 4.2.4.
Table 4.2.4 Outlines of Industrial Estate in East Java
Name of Industrial Estate Location Area Number of Tenant
Distance to
Tanjung Perak Port
Distance to
Juanda Airport
Surabaya Industrial Estate Benowo, Surabaya 24 ha. 100 15 km 30 kmSurabaya Industrial Estate Rungkut, Surabaya 332 ha. 371 19 km 5 kmSurabaya Industrial Estate Brebek, Sidoarjo Gresik Industrial Estate Gresik, Gresik 91 ha. 13 20 km 34 kmMaspion Industrial Estate Gresik, Gresik 140 ha. 14 23 km 38 kmNgoro Industrial Persada Mojokerto, Mojokerto 213 ha. 52 55 km 40 kmPasuruan Industrial Estate Rembang, Pasuruan 170 ha. 52 60 km 45 kmSuri Mulia Industrial Estate Tandes, Surabaya 200 ha. 150 9 km 15 kmTotal 1,170 ha. 752 Note: Various sources collected by JICA Study Team
Foreign manufacturers accounts for around 22% of the total number of tenants in the industrial estates in GKS as an average, while Japanese manufacturers totaling 27 is concentrated in Pasuruan. The industrial estate of Pasuruan so called Pasuruan Industrial Estate Rembang (PIER) was developed and managed by a Japanese industrial estate development company. Therefore, the share of foreign manufactures in this industrial estate is quite high as it accounts for around 68% of which 40% are Japanese manufacturers.
Location of Mudflow Disaster Area: The location of mudflow disaster flow area in relation to the industrial zones of GKS is illustrated in Figure 4.2.10. The toll road, which closed due to the Sidoarjo Mudflow Disaster, is thought to be the most important toll road segment connecting Tanjung Perak Port and the southern part of GKS as depcited in the figure. The factories most affected by the disaster and closure of the toll road near Gempol are those in Pasuruan and Probolinggo. As Japanese manufactures are concentrated in these areas, the manufacturers or shippers who have been most adversely affected by the closure of the southern part of Surabaya – Gempol Toll Road can be considered to be Japanese manufacturers.

The Study for Development of the Greater Surabaya Metropolitan Ports in the Republic of Indonesia Final Report
4-21
Figure 4.2.10 Sidoarjo Mudflow Disaster Area and Industrial Zone
Sidoarjo Mudflow Disaster Area
Questionnaire Survey: A questionnaire survey was carried out to examine further the adverse affects of Sidoarjo Mudflow Disaster on Japanese companies in Surabaya. Twenty questionnaires were sent to Japanese companies and obtained nine (9) respondents. Seven out of 9 responded companies are located in PIER. The result of this questionnaire survey is summarized in Table 4.2.5.
Based on the responses, most of Japanese manufacturers in Pasuruan or in PIER would continue to be in PIER although the inland transport cost has increased by almost 20%, added 2.5 hours to transport time, and caused inconvenience to employees
However, there a lot of complaints against the delay of restoration works which is to be carried out by the government agencies.

The Study for Development of the Greater Surabaya Metropolitan Ports in the Republic of Indonesia Final Report
4-22
Table 4.2.5 Summary of Questionnaire Survey Results on Mudflow Disaster Items Answers Remarks
Smallest number of staff 100 Wooden furniture Largest number of staff 2,300 Lighting equipment, lamps, etc. Average number of staff 590 Export of goods by container per month 68 TEU per month Import of goods by container per month 8 TEU per month Average container transport cost (Rp.) 1,800,000 Pasuruan – Tj. Perak Port per TEU Average container transport cost (US$) 200 Per 20’ container Estimated transport cost per month 15,200 Inland transport cost in US$ Transport time before closure 1.90 Hours per trip (Pasuruan – Tj.
Perak) Transport time after closure 4.22 Hours per trip Increased time needed for transport 2.32 Hours per trip Average cost increase in % 18 Toll road should be relocated at first and urgently 100 Plural answer National road should be improved urgently 67 Plural answer Barge transport should be provided 22 Plural answer Railway transport should be improved 11 Plural answer Intending to expand the business (%) 22 Plural answer Intending to business to continue at same location (%)
89 Plural answer
Intending to shrink the business (%) 22 Plural answer Intending to move to other country 22 Plural answer Intending to transfer to other location in Indonesia (%) 11 Plural answer Source: JICA Study Team
Assuming the total annual handling volume of loaded container in Tj. Perak Port in 2006 is 1.5 million TEU and the southern area beyond Gempol accounts for say 15% of generation of export container and 10% of destination of import container judging from the distribution of number of manufacturing companies having factories in the industrial estate in East Java. Thereby the total container traffic volume generated by the area which is adversely affected by Sidoarjo Mudflow Disaster can be estimated to 12.5 % of the total container volume of Tj Perak. Port. As the estimated increase in cost for land transport due to mudflow problem is US$ 36 per TEU, the total increased transport cost for container transport passing this area would be around US$ 6.75 million per year which is quite a large financial loss.
The financial loss estimated above covers only the direct loss. Indirect loss due to the detour of land transport include increased labor cost due to overtime pay for the workers as a result of dealyed deliveries of materials and goods, longer commutes by staff commuting, longer period of stocking of materials and products in warehouses, reduction of productivity due to fatigue of staff as a result of longer traveling time and hardship, etc.
If these indirect economic losses are accounted and added to the direct financial loss, the figure could be 2 – 3 times of the direct financial loss or say US$ 13 – 20 million per year. This is more than the total income of laborers working in the Pasuruan industrial estates.

The Study for Development of the Greater Surabaya Metropolitan Ports in the Republic of Indonesia Final Report
5-1
5 ASSESSMENT ON GREATER SURABAYA METROPOLITAN PORTS
5.1 Cost and Service
1) Users’ Costs
a. Service and Revenue
PELINDO-III provides various services including navigation, berthing, cargo handling and supply of water and fuel, and are its sources of revenues. In addition, large dividends are made from its subsidiaries container terminal operation, which accounts for more than 55% of total operating revenue, wherein loading and unloading of container is nearly 70% as shown in the table below. Of the Container Terminal revenue of 988 billion Rp, TPS accounts for 739 million Rp and the rest is from TPK in Semarang Port.
For navigation services such as pilotage and tug, PELINDO-III is responsible for and provides all tugs and pilots for calling vessels including container vessels going to TPS. Vessels pay directly to PELINDO-III, which covers 16% of its revenues. For the conventional terminal, berthing service and cargo handling services constitute 5% and 10% of revenues respectively.
Table 5.1.1 Revenue Detail from Services in PELINDO III
(Mil Rp) 2003 2004 2005 2006 CompositionVessel Navigation Service 158,415 206,052 257,262 290,745 16% Berthing Service 66,983 67,390 71,855 89,083 5% Cargo Handling Service 84,888 115,471 147,016 172,174 10% Water & Electricity etc 32,011 44,431 54,341 63,182 4% Joint operation 88,700 29,646 16,560 67,212 4% Dedicated Berth 9,253 31,378 34,292 34,760 2% Various other business 52,112 31,002 34,148 45,474 3% Container Terminal (TPS+TPK) 877,692 958,966 1,055,732 988,306 55% Hospital & related company 13,833 18,533 22,257 31,964 2% Operational Revenue Total 1,383,887 1,502,869 1,693,463 1,782,900 100%
Source: Financial Statements, PELINDO III
Table 5.1.2 Service and Revenue of TPS
(Mil Rp) 2003 2004 2005 2006 CompositionLoading and Unloading 591,172 652,194 698,775 508,731 69% Storage and facility service 32,090 26,516 31,502 83,622 11% Supplementary Service 22,593 25,559 27,898 105,120 14% Electricity etc 12,492 17,506 15,795 14,729 2% Buoy & Mooring Service 14,394 14,376 14,174 13,951 2% Others 9,752 10,838 18,105 13,116 2% Operational Revenue Total 682,493 746,989 806,249 739,269 100%
Source: Financial Statements, PELINDO III
TPS revenue in 2006 represented a drop of 7 % compared with year 2005 figures. According to TPS, the most significant contributor to the revenue decrease is the regulated tariff reduced by 25% which was determined by the Minister of Transport in November 2005.

The Study for Development of the Greater Surabaya Metropolitan Ports in the Republic of Indonesia Final Report
5-2
Table 5.1.3 Per TEU Revenue by Container Handling and Vessel Navigation at TPS
(Rp/TEU throughput) 2005 2006 Average Loading and Unloading 656,066 483,603 590,583 Storage and facility service 29,577 79,492 41,762 Supplementary Service 26,193 99,928 43,362 Electricity etc 14,830 14,001 14,546 Mooring Service 13,308 13,262 13,730 Others 16,998 12,468 12,428 Estimated Navigation Revenue from Vessel to TPS 18,224 20,083 19,153 Operational Revenue Total Per TEU (TPS+Nav) 775,195 722,837 749,016
Source: JICA consultant’s calculation based on Cargo data and Financial Statements, PELINDO III Note: Based on vessel sizes of ships calling at TPS
b. Service and Expense
PELINDO III accounting records of expense does not correspond to service items. At any rate, composition of major expense items and their respective shares are as follows “Salary and Wages” at 20%, “Operation” and “maintenance” together at 23%, “Depreciation” at 15%, and “Lease charges” at 21%.
Meanwhile, TPS Operating expense consists of several major items, including ”Royalty Payment”, “Salary and wages”, and “Lease payment”. Each having an allocation of not more than 17% each and in aggregate comprise more than 50%. “Maintenance”, “Spare parts” and “depreciation” account for one third of total operating costs. The operating expense has grown by a rate of 16% per annum.
Table 5.1.4 Operating Expense Detail in PELINDO III
(Mil Rp) 2003 2004 2005 2006 CompositionSalary and Wages 173,177 201,490 192,644 227,124 20% Operational Material 102,617 100,737 125,417 163,228 14% Maintenance Cost 84,003 92,824 103,308 100,050 9% Depreciation 128,061 146,158 167,822 167,042 15% Insurance 14,082 20,793 41,116 48,810 4% Lease Charges 145,247 165,443 183,179 240,342 21% Administration Office 17,029 14,781 16,376 17,041 2% General expense 159,872 154,099 164,590 166,527 15% Total Operating Expense 824,088 896,325 994,452 1,130,165 100%
Source: Financial Statements, PELINDO III
Table 5.1.5 Per TEU Expense by Container Handling and Vessel Navigation at TPS
(Rp/TEU throughput) 2005 2006 Average Contribution under the Sharing Agreement with PELINDO III 75,737 70,468 73,102 Salary and Wages 66,167 62,826 64,496 Lease Payment 67,348 65,996 66,672 Maintenance Cost 41,458 37,923 39,690 Spare Parts and Fuel 32,291 43,978 38,134 Depreciation 32,202 31,698 31,950 General expense 27,883 24,456 26,170 Insurance 14,610 18,301 16,455 Social Development Contribution 7,373 2,603 4,988 Admin Office 3,284 2,837 3,060 Estimated Navigation Expense for TPS (Per TEU) 10,704 12,732 11,718 Operational Expense Total (TPS+Nav) 379,056 373,816 376,436
Source: JICA consultant’s calculation based on Cargo data and Financial Statements, PELINDO III

The Study for Development of the Greater Surabaya Metropolitan Ports in the Republic of Indonesia Final Report
5-3
c. User’s Costs in Comparison
Port tariff in Indonesia for container handling is applied uniformly at all ports, thus charges at Surabaya Container Terminal and at Tg Priok is the same. Ports in Indonesia do not have function of hub port, and mainly works as feeder ports to Singapore, thus price negotiation is not effective for port users.
Government has control over Container Handling Charges (CHC) which is set uniformly for all container terminals in Indonesia. Based on this tariff, shipping companies set a uniform Terminal Handling Charge (THC), and is paid for by shippers. Similarly, the rate is the same at Jakarta International Container Terminal (JICT) in Tg. Priok and Terminal Petikemas Surabaya (TPS) in Tg. Perak in Surabaya as a result of uniform CHC.
These rates had been often criticized as very high in the early 2000’s. So the government declared to lower the CHC by 25% in 2005. In relation to this change, shipping companies voluntarily offered to lower the THC by 25%, but the government pushed for it to be lowered by 37%.
It was a rather aggresive action on the part of the government by intervening in private-to-private trade and appears that the government was giving benefit to importers, at the expense of shipping companies. As a result, THC in Indonesia has become comparable to that of Malaysia and lower than that of Singapore.
Figure 5.1.1 THC for 20' and 40' Container
0 50 100 150 200
Thai
Singapore
Malaysia
Indonesia
40' in USD20' in USD
Source: JICA Study Team
However, at the same time, the government allowed PT PELINDO (Indonesia Port Corporations as State-own Company) to increase its tariff of Lift-on/off charges and resulted in a 500% increase on average. As a result, the total cost at port remained high or even increased especially for cargoes in the red channel. Figures below illustrate THC plus lift-on/off charges based on typical movement of cargo, showing that the total cost at Indonesian Ports being higher than other ports in neighboring countries, especially in red channeled cargo.
Based on typical cargo movement at major ports in SE Asia, and considering that majority of containers are 40 footers for international cargo, comparisons are made by 40’ containers. Total charges related to port operations reached USD 200 for green channeled cargo in Indonesia. This is slightly higher than those in other countries being approximately at USD 160 at Malaysia and USD 170 at Thailand. Here green channel means that there is no physical inspection and process of custom clearance is smooth and generally quick within a few days, thereby storage charge is minimum and lift on/off charges are also minimum.

The Study for Development of the Greater Surabaya Metropolitan Ports in the Republic of Indonesia Final Report
5-4
On the other hand, in the case of red channel wherein there is physical inspection of contents of container, lift-on/off charges would be more than double and many other labor cost and storage charges are added, and thereby costs could reach USD300 per 40 feet container in Jakarta and 270 in Surabaya. This is significantly expensive compared with Port Klang in Malaysia (USD 220), and Laem Chabang in Thailand (USD170). Obtained data from the customs office at Tg. Perak indicates that the imported containers cleared through red channel account for as large as 27%. Thus, this issue should not be underestimated.
In other countries, even at red channel, additional days are less than one day, and after inspection, cargo release will be immediately possible. In Indonesia, port operation takes time and lift-on/off charges are extremely expensive in Tg. Priok. Surabaya TPS is better with less congestion and quick inspection, but still behind international level service, in terms of cost to customers.
Figure 5.1.2 Port Related Charges Compared (in US$)
Green Channel: 40 feet Container: Red Channel: 40 feet Container
0 50 100 150 200 250 300 350
Malaysia (PortKlang)
Thailand (LaemChabang)
Surabaya (TPS)
Jakarta (JICT)
THC+EDI Port Charges0 50 100 150 200 250 300 350
Malaysia (PortKlang)
Thailand (LaemChabang)
Surabaya (TPS)
Jakarta (JICT)
THC+EDI Port Charges
Source: JICA Study Team
2) Productivity of Port Operation
a. Container Cargo Handling
As for terminal efficiency and productivity for container operations, total working hour of gantry cranes are 40 hours for international ships and 23 hours for interisland at TPS. Two gantry cranes are used for a ship. That means average working hour per crane per ship is 20 hours. Gross working production is 25 boxes/crane/hour for international and 30 boxes/crane/hour for interisland. The production ratio of interisland cargos is much bigger than that of international cargos, wherein it is surmised that handling time of interisland container is faster because of smaller ship sizes. (see Table 5.1.6)
It is noted that net working production ratio is larger than gross working production ratio, because gross working time includes idle time and break time, but net working time is actual working time of container handling.

The Study for Development of the Greater Surabaya Metropolitan Ports in the Republic of Indonesia Final Report
5-5
Table 5.1.6 Efficiency of Container Handling Item International Inter-island
Total Crane Working Hour (hr) per Ship 40 23 Berth Time (hr) (from arriving berth to leaving berth) 23 16
Port Stay (hr) (from Karangjamuang to leaving berth) 29 26
Gross Working Production (Boxes/Crane/hr) 25 30 Net Working Production (Boxes/Crane/hr) 30 35 Note: Example of some shipping company
Productivity of container handling at TPS is 25.35 boxes/ crane/ hour, and is rather good performance, compared to the world-class container terminals. Some big terminals like Hong Kong, Singapore don’t reach 30 boxes/ crane/hour. However, even if the productivity of those terminals are less than 30 boxes/crane/hour, these terminals can use 3 cranes or more at one time for a ship, and that makes a ship stay shorter than the case of using 2 high productivity cranes. It is however noted that sizes of ship arriving at Surabaya are not so big. Most of container ships are less than 2000 TEUs capacity. It is therefore not considered to be efficient to use more than 2 cranes. (see Table 5.1.7)
Table 5.1.7 Comparison of Productivity of Container Handling (boxes/crane/hr)
Port Name Source International TPS 25.35 Average number of one of TPS uer’s
in 2006 JICT (Tg. Priok) 20.56 Koja (Tg. Priok) 25.71 The Study for Development of the
Greater Jakarta Metropolitan Ports Hong Kong 21-25 (Data shows the number of 2001) Singapore 22-24 Kaohshiung 25-28 Busan 22-25 Tokyo 35-38 MICT (Philippines) 35
The Study for Development of the Manila Metropolitan Port (Data show the number of 2000 (2001)
South Harbor (Philippines) 25
Figure 5.1.3 shows comparison of berth productivity among world-famous container terminals. Berth productivity of TPS is 179,000 TEUs/berth and 790 TEUs/m. That indicates rather low productivities, compared to other terminals. Shanghai, Hong Kong, and Laem Chabang are some of the high production terminals, as they are world hub ports or mother ports handling huge cargo volume. Thus, it is not appropriate to pit those ports, against Surabaya as it is mostly used for a feeder port. For example, the berth and yard occupancy ratio of TPS is 36.9% and 32.3 %, respectively, in 2006. Thereby the terminal is not so busy now, but if it is used fully, the possible berth productivity is projected to be 400,000 to 500,000 TEUs/berth and 1000 -1500 TEUs/m.

The Study for Development of the Greater Surabaya Metropolitan Ports in the Republic of Indonesia Final Report
5-6
Figure 5.1.3 Comparison of Berth Productivity among Container Terminal
0 500 1000 1500 2000 2500 3000 3500
Shanghai (Waigaogiao Terminal)
Hong Kong (Terminal 8)
Laem Chabang (TIPS Terminal B4)
Qingdao (Dianwan Terminal)
Dalian Port
Port klang (Westports Terminal)
Singapore
Busan (Jasungdae Container Terminal)
Tanjung Pelepas Port
Kaohsiung Port
Incheon (Incheon Container Terminal)
Tokyo (Berth 2-OC)
Colombo (South Asia Gateway Terminal)
Manila (Manila International Terminal)
Chennai Port
Tanjung Perak (TPS Terminal)
Tanjung Priok (Jakarta International Terminal)
Osaka (Terminal C-8/9)
Throughput per Berth Length (TEU/m/year) Throughput per Berth (1000TEU/berth/year)
Source: Data of Tg. Perak is based on PELINDO III’s Information. Data of Tg. Priok is based on The Study for Development of the Greater Jakarta Metropolitan Ports
Source: Based on Containerization International 2007
b. Non-Container Cargo Handling
For non-containerized cargo operation, the cargo handling efficiency is shown in Table 5.1.8. International cargo handling is much efficient than domestic cargo on every type of cargo.
Table 5.1.8 Cargo Handling Efficiency (ton/ship/day; 2006) Type of Cargo International Domestic
General Cargo 2,793 753 Bag Cargo 1,694 718 Grain/Powder Type Bulk 7,019 1,966 Liquid Bulk 1,679 1,217 Pallet/Unit 505 136
Source: PELINDO III
Table 5.1.9 shows comparison of productivity of conventional cargo handling between Tanjung Perak and Tanjung Priok. Productivity of dry bulk at Tanjung Perak is higher than that at Tanjung Priok, but other cargo’s productivity shows the contrary. Cargo handling productivity should therefore be improved more.
Table 5.1.9 Comparison of Productivity of Conventional Cargo Handling
Tg. Perak Tg. Priok Cargo Items ((ton / gang / hr)) International Domestic 2002 March
Bag 30 20 37.34 Liquid Bulk 88 72 150.03 Dry Bulk 123 58 101.84 General Cargo 27 12 33.3

The Study for Development of the Greater Surabaya Metropolitan Ports in the Republic of Indonesia Final Report
5-7
Table 5.1.10 shows average productivity of conventional terminals. Jamrud Terminal has the best productivity indicators except for berth occupancy ratio among conventional terminals. BOR of Nilam and Berlian terminals is larger than that of Jamrud terminal, but their BTP is noticeably lower. This means the former are occupied longer by ships than the latter terminal, but the latter terminal is much busier in terms of cargo handled.
Table 5.1.10 Average Productivity of Terminal (2006) Jumrud Nilam/Berlian Mirah/Kalimas Notes
BOR (%) 58 65 - Berth Occupancy Ratio BTP (t/m) 5,614 3,612 871 Berth Throughput SOR (%) 11.55 2.23 6.03 Shed Occupancy Ratio STP(t/m2) 16.23 5.68 12.11 Shed Throughput YOR (%) 5.24 3.58 0.67 Yard Occupancy Ratio YTP (t/m2) 33.04 5.47 2.41 Yard Throughput
Note: Based on PELINDO 3 Statistical Data
At any rate, BORs of Jamrud and Nilam/Berlian terminals are over 50% and BTPs of both terminals are over 3000 ton/m, which means that the terminals are so busy that some ships must wait for berthing at times. BTP of Kalimas Terminal is only 871t/m as it is a traditional terminal and the cargo handling is mostly done manually without any equipment. Even though the handling system is very primitive, its BTP indicates a rather high level, as the terminal is always crowded with traditional local ships.
Jamrud terminal indicates high levels of SOR, STP, YOR and YTP. That means sheds and yards at Jamrud are almost full. On the other hand, SOR of Nilam/Berlian terminal for non-container cargos is less than that of Kalimas terminal, so sheds at Nilam/Berlian is not being used effectively.
c. Working Shift
Another aspect of operation of conventional terminals is the work shifts of longshoremen. Based on an agreement, longshoremen must be provided by TKBM (Stevedoring Workers Cooperation). The process of acquiring their services is as follows. Firstly, shipping companies request stevedore companies for longshoremen a day before the ships arrive at the port. Then the stevedore companies request TKBM to provide longshoremen for their cargo handling. Then TKBM provides longshoremen for the cargo handling of ships. Working hours is based on are three shifts a day, but the longshoremen service is not the full 24 hours in a day due to to long-standing custom, wherein they would work only 15 hours a day. (see Table 5.1.11)
Table 5.1.11 Actual Working Hours of Longshoremen at Tg. Perak Shift Rules Actual Example 1 Actual Example 2
8:30 - 11:30 8:00 - 11:30 (11:30 - 13:00 Lunch Break) (11:30 - 12:00 Lunch Break) 1st Shift 8:00 - 16:00
13:00 -16:00 12:00 - 16:00 16:00 - 17:00 16:00 - 17:30
(17:00 - 19:00 Dinner Break) (17:30 - 18:00 Dinner Break) 2nd Shift 16:00 - 24:00 19:00 - 23:00 18:00 - 23:30
3rd Shift 0:00 - 8:00 1:00 - 5:00 0:00 - 7:00 Total Hour 24 hours 15 hours 21.5 hours
Note: Based on our interview research

The Study for Development of the Greater Surabaya Metropolitan Ports in the Republic of Indonesia Final Report
5-8
5.2 Port Users’ Assessment
1) Assessment from Shipping Companies
An interview survey was conducted on shipping companies to analyze user’s satisfaction of Surabaya port. In this survey, the answers were given by 20 container shipping companies and 14 bulk and break bulk (B/BB) shipping companies.
a. Time in Port and Yard
Vessel Waiting time & Staying time: Table 5.2.1 shows the vessel waiting time at anchorage point and vessel staying time in Tg. Perak by shipping company types (Container & Break Bulk). 44% of container shipping companies answered less than 6 hours waiting time at anchorage; while, half of B/BB shipping companies answered 1 day to 2days. It means that the container ships can berth at the port more easily than breakbulk and bulk cargo ships. The vessel staying time also shows a similar tendency.
Table 5.2.1 Vessel Waiting Time & Staying Time
50.0%
50.0%
80.0% 20.0%
37.5%
50.0%
12.5%
0% 20% 40% 60% 80% 100%
Import container (document process only)
Import container(with cargo inspection)
Export Container
1days
2-3days
4-5days
more than6 days
Shipping Company Shipping Company (Container) (B/BB)
0 - 6 hours 44% 13% 6 - half day 0% 0% half day - 1 day 11% 25%
Vessel Waiting Time at Anchorage Point
1 day - 2 days 11% 50% more than 2 days 33% 13% Total 100% 100% 1 day 67% 20% 2 - 3 days 22% 40% 4 - 5days 11% 30%
Vessel Staying Time (day) (Average)
more than 6 days 0% 10% Total 100% 100%
Source: JICA Study Team
Container Dweling Time (Import/Export Permission): Figure 5.2.1 illustrates the import/export container dweling time. For imported container with cargo inspection, only 50% of shipping companies spent one day, while other companies had to spend longer time, some up to five days. On the other hand, the dweling time for most of the exporting container ships is quite short. 80% of them spent only one day, and just 20% of them spent two until three days. It shows that the export container ships can move more smoothly through the port compared to importing container ships.
Figure 5.2.1 Import/Export Container Dwelling Time
Ave. of Days
1.9
2.7
1.2
Source: JICA Study Team
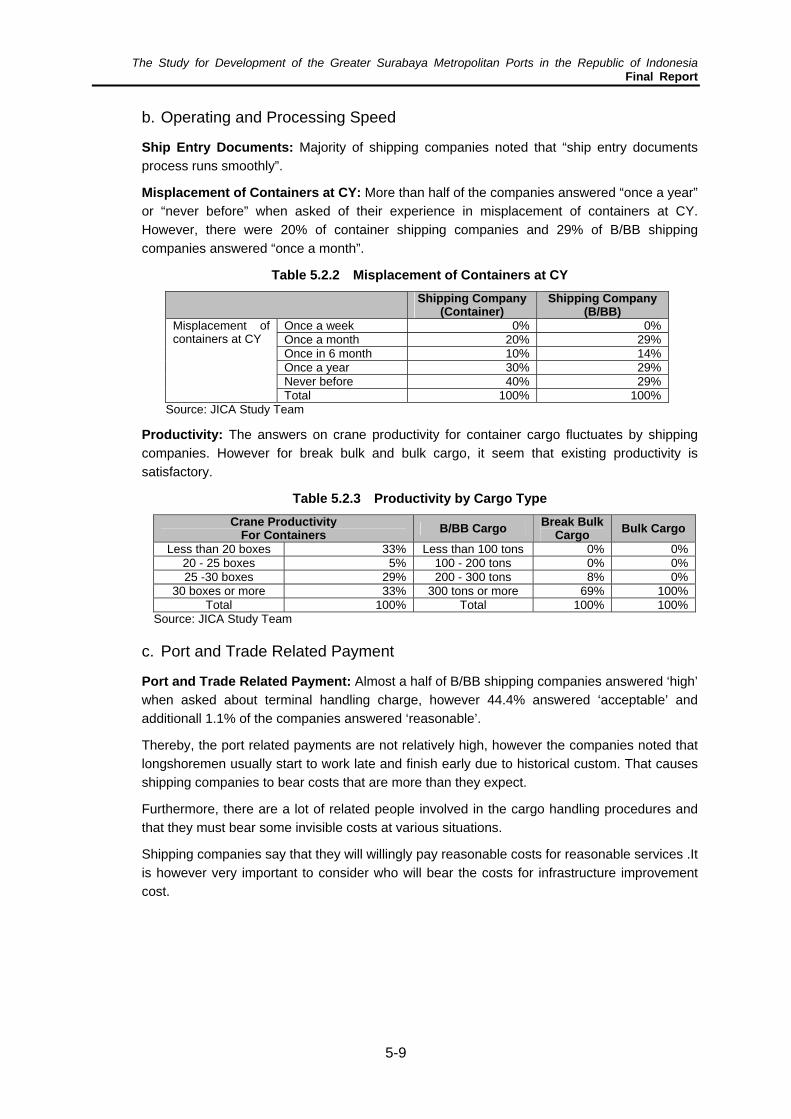
The Study for Development of the Greater Surabaya Metropolitan Ports in the Republic of Indonesia Final Report
5-9
b. Operating and Processing Speed
Ship Entry Documents: Majority of shipping companies noted that “ship entry documents process runs smoothly”.
Misplacement of Containers at CY: More than half of the companies answered “once a year” or “never before” when asked of their experience in misplacement of containers at CY. However, there were 20% of container shipping companies and 29% of B/BB shipping companies answered “once a month”.
Table 5.2.2 Misplacement of Containers at CY Shipping Company Shipping Company
(Container) (B/BB) Once a week 0% 0% Once a month 20% 29% Once in 6 month 10% 14%
Misplacement of containers at CY
Once a year 30% 29% Never before 40% 29% Total 100% 100%
Source: JICA Study Team
Productivity: The answers on crane productivity for container cargo fluctuates by shipping companies. However for break bulk and bulk cargo, it seem that existing productivity is satisfactory.
Table 5.2.3 Productivity by Cargo Type Crane Productivity
For Containers Break Bulk B/BB Cargo Bulk Cargo Cargo
Less than 20 boxes 33% Less than 100 tons 0% 0% 20 - 25 boxes 5% 100 - 200 tons 0% 0% 25 -30 boxes 29% 200 - 300 tons 8% 0%
30 boxes or more 33% 300 tons or more 69% 100% Total 100% Total 100% 100%
Source: JICA Study Team
c. Port and Trade Related Payment
Port and Trade Related Payment: Almost a half of B/BB shipping companies answered ‘high’ when asked about terminal handling charge, however 44.4% answered ‘acceptable’ and additionall 1.1% of the companies answered ‘reasonable’.
Thereby, the port related payments are not relatively high, however the companies noted that longshoremen usually start to work late and finish early due to historical custom. That causes shipping companies to bear costs that are more than they expect.
Furthermore, there are a lot of related people involved in the cargo handling procedures and that they must bear some invisible costs at various situations.
Shipping companies say that they will willingly pay reasonable costs for reasonable services .It is however very important to consider who will bear the costs for infrastructure improvement cost.

The Study for Development of the Greater Surabaya Metropolitan Ports in the Republic of Indonesia Final Report
5-10
Figure 5.2.2 User’s Satisfaction for Port and Trade Related Payments
2.50
3.00
3.50
4.00
Vessel Entry Procedure (manifest EDI)
Vessel Entry & Berthing Operation
Cargo Loading/Unloading Speed
Cargo Handling Facility
Yard Stacking and Storage
EDI Port Processing
Customs Document (EDI)Processing
Custom Cargo Inspection
Port Tariff
t Payment Procedure
Safety of Commodities
Access Roads
Shipping Company(Container)Shipping Company(B/BB)
40.0%
41.7%
25.0%
36.4%
27.3%
50.0%
41.7%
50.0%
45.5%
45.5%
16.7%
25.0%
18.2%
27.3%
10.0%
0% 20% 40% 60% 80% 100%
Cargo handling charge (for shipping company)
Terminal handling charge (for forwarders)
Yard Trucking Charge (for forwarders)
Customs Due
Electronic Data Interchange (EDI) processing fee
44.4%
55.6%
33.3%
50.0%
37.5%
44.4%
33.3%
33.3%
37.5%
50.0%
33.3%
12.5%
12.5%
11.1%
11.1%
0% 20% 40% 60% 80% 100%
High
Acceptable
Reasonable
Shipping Company (B/BB)
Shipping Company (Container)
Source: JICA Study Team
d. Evaluation of the Service in Tg.Perak
Evaluation of the Service in Tg.Perak: Figure 5.2.3 shows the evaluation of service of Tg. Perak compared with other ports using a five-point evaluation score. The evaluation value of custom inspection is significantly worse than the other factors, because 38% - 42% of shipping companies graded it as poor. The customs document processing and port tariff are also worse than other factors. Nevertheless, the services in other areas are not so bad if compared with other ports. Similar trends in Container shipping companies and B/BB shipping companies are observed.
Figure 5.2.3 Evaluation of the Service in Tg.Perak Compared with Other Ports
(Very Good: 5 ~ Very Poor: 1)
Source: JICA Study Team

The Study for Development of the Greater Surabaya Metropolitan Ports in the Republic of Indonesia Final Report
5-11
Table 5.2.4 Dissatisfaction Ratio for Each Factor
Shipping Shipping Company Company (Container) (B/BB) Vessel Entry Procedure (manifest EDI) - - Vessel Entry & Berthing Operation - - Cargo Loading/Unloading Speed - - Cargo Handling Facility - - Yard Stacking and Storage - - EDI Port Processing - - Customs Document (EDI) Processing - - Custom Cargo Inspection 38% 42% Port Tariff 13% 17% Port Payment Procedure - - Safety of Commodities 5% 7% Access Roads 6% 7%
Source: JICA Study Team
e. Urgent Matters to be Improved
Figure 5.2.5 illustrates a summary of the opinion of shipping companies on urgent matters that need to be improved in Tg. Perak. Users’ expectation can be separated into four groups: infrastructures, systems, costs and safety. Among them, the items which a lot of users are expecting to be urgently improved are showed as follows.
Table 5.2.5 Four Groups User’s Expectations (1) Infrastructure (2) Systems (3) Costs (4) Security
a. Invisible costs 1. Port security a. Old facilities b. Berthing space is not enough c. Road outside the port area d. depth of channel
Source: JICA Study Team
Detailed comments from shipping companies on the major issues above are as follows:
i) For berthing space, issues on the condition of berths, the length and depth are all considered requiring immediate attention.
ii) Another critical issue is ‘the old port’. Tg. Perak Port which is almost 100 years-old. Most terminals, except Mirah Terminal, have been unchanged, while containerization is increasing. Container cargo handling need wider spaces than usual cargo handling system, therefore, many shipping companies desire wider spaces at the conventional terminals. Channel is another big problem, not only its shallow depth, but also its narrow width. Some parts of channel are not wide enough for two-way sailings. As the channel is not deep enough for some ships, those ships must wait for high tide to enter the port.
iii) Tg Perak Port has good access road connection, but many port users think that access road is also very important infrastructures for port activities and therefore needs to be further improved.
iv) Most users claim unreasonable costs during customs cargo inspection and cargo handling especially at conventional terminals. Some users say that the tariff here is more expensive than other countries.

The Study for Development of the Greater Surabaya Metropolitan Ports in the Republic of Indonesia Final Report
5-12
v) Most of users think the security system at the land area is rather good, but that of at the water area is not good. When ships are waiting for berthing at the anchorage area at night, their ship cargos and equipments are said to be stolen sometimes.
In order to further understand the current port problems more specifically, consultations was done with 10 shipping companies. The result is showed on Table 3.5.6.
Most shipping companies worry about inadequate navigation aid system/facilities and insufficient access channel for navigation. The water area between Buoy No. 5 and Buoy No. 7 is said to be very dangerous for navigation and the area around Buoy No. 2 is very narrow. The lights of those critical buoys sometimes do not work well or are dead.
There are also claims against pilot and tug services. It is said that it sometimes takes a long time for the pilot to arrive and get on a ship. It causes shipping company to incur avoidable cost. During high wave conditions some pilot boats do not have enough capacity, so a pilot cannot board the ship sometimes. Furthermore, tug boats in use are of small capacity that large ships that require strong tug boats experience problems in navigation.
Most of shipping companies say that the access channel should be always kept -9.7m as is publicly announced. However, shipping companies have to keep their ship’s draft to be less than -9.7m, because deeper drafts would require their ships to wait for high tide. Moreover, some parts of the channel are only capable of one way traffic, and this especially affects large ships.
As for berthing facilities, there are not many complaints against the international container terminals except for expensive handling charges, but the same could not be said of the interisland terminals. Full-container ships have gradually become popular mode of transportation for interisland transport, but still a lot of semi-container ships and conventional ships play a large part of the transportation, because they are more economical transportation mode than container ships under certain conditions. Particular comments on interisland container berth are as follows:
i) Some shipping companies say that Jamrud terminal has necessary depth for those ships, and its berth length is 1200m long. However, since 500m of the berth is used for passenger ships; only 700m is available for cargo ships – thereby sometimes ships have to wait for a berth and because. Jamrud terminal congested cargo handling efficiency is rather low.
ii) TPS has a 500m long berth for interisland container ships but half of it is very shallow due to sedimentation so some shipping companies have already cancelled some of their ship calls at TPS because of lack of interisland container berths.
iii) One of the major carriers points out that TPS should do their best to improve their cargo handling efficiency. The standard handling rate is 40 boxes/hour, but TPS’s current operation is only 35 boxes/hour. It is observed to be because of the long distance between the berth and the terminal.
With regard to the EDI system, there are not so many comments on the TPS system. Some users say that it will be better if users can get the information about their cargo movement in the terminal, such as arrival and departure time of their cargos. On the other hand, there are a lot of complaints against customs processing. The EDI system for customs processing has just started several years ago and the system for import cargos has improved gradually, but export movements still have a lot of problems. However, if the EDI system gets on the right direction, the invisible cost problem will be minimized.

The Study for Development of the Greater Surabaya Metropolitan Ports in the Republic of Indonesia Final Report
5-13
Figure 5.2.4 Urgent Matters to be Improved
0 2 4 6 8 10
Old facility
High rate of invisible cost
Berthing space is not enough
Road outside the port area
Depth & Breadth of channel
Depth of berth & Length of berth
Port security
Customs related operation
EDI utilization is not enough
Yard space is not enough
Loction of basin
Vehicle parking space is not enough
Container handling equipment
Navigation aid system
Lack of carrying capacity
Warehouses are not enough
Area of basin
Lack of skils of operators
Bonded area/Warehouses
Lack of man-power
Calmness of channel
Caalmenss of basin
Location of berth
Lack of fund to operate as a whole
Shipping Company(Container)Shipping Company(B/BB)
Source: JICA Study Team
Table 5.2.6 Bottlenecks at Surabaya Port No. of Items Comments Answers
Navigation Aid System • Sometimes No2 and No5 buoy lights do not work. They are not repaired at once. Straight channel is better. 9
Depth 7 • Current Depth -10.5m should be always maintained. • Desired depth is -12m.
Channel
Breadth • Narrow channel causes ship's delay and ship accidents. 6 • Expected width is to allow 2 way navigation. Calmness 1 • Outer channel is not good during monsoon time. Location 3 • Sometimes a pilot cannot board from a pilot boat to a ship. Area Size 1 • Inner anchorage area is not enough for waiting ships.
Basin
Calmness • Current speed is rather fast, so sometimes anchoring ships drift during strong wave. 1
Location 1 • TPS location is good. Half of interisland terminal of TPS cannot be used because of its shallow depth.
Berth
Length • Total length of conventional terminal is not enough for demand. 2
• Some shipping companies have already cancelled some of their ship calls at TPS because of lack of available berths with necessary depth
Depth • Depth of conventional terminal is not enough for international/interisland ships. 2
Container Handling 2 • Handling speed is a little bit slow than users' expectation. Vessel Operation • Piloting service is not good and sometimes capacity of tug
boat is enough for a large ship. 4
EDI System • Vessel entry procedure is rather good. EDI system of customs clearance does not work well. 5
Port Security • Port security of land area is good, but that of water area is not good. Sometimes commodities and equipments are stolen at anchorage area at night.
1
Source: JICA Study Team

The Study for Development of the Greater Surabaya Metropolitan Ports in the Republic of Indonesia Final Report
5-14
2) Assessment from Forwarders
The total number of forwarding companies forming the Forwarder Association of Surabaya is around 300. Of these 220 companies exclusively work for the customs clearance and 20 companies are international companies. Forty-four companies exclusively work for air cargo. This means that the number of forwarding companies handling of sea borne freight is only 36, which includes 20 international companies. Most of the forwarders are concentrated in the SMA because of the international container terminal and international airport.
To analyze the user’s satisfaction of Surabaya port from a freight forwarder’s point of view an interview survey. was conducted with a total of 32 responding forwarders. The following are the salient results of the survey.
a. Time in Port
Container Dweling Time (Import/Export Permission): Figure 5.2.5 illustrates the import/export container doweling time based on the interview survey. For an imported container with cargo inspection, a quarter of the forwarder answered from four to five days, and the longest time for an imported container with document process only is 2-3 days. Meanwhile, exported container requires only 2-3 days at the maximum and most of them can be handled in one day.
Figure 5.2.5 Import/Export Container Dwelling Time
71.4%
62.5%
77.8% 22.2%
25.0%
12.5%
28.6%
0% 20% 40% 60% 80% 100%
Import container (documentprocess only)
Import container (with cargoinspection)
Export Container
1days
2-3days
4-5days
more than6 days
Ave. Days
1.4 2.2
1.3
Source: JICA Study Team
b. Operating and Processing Speed
Ship Entry Documents: Majority of shipping companies said “ship entry documents process runs smoothly”.
Misplacement of Containers at CY: A quarter of forwarders answered that they experience misplacement of container at CY once a week and a quarter of forwarders experience the problem once a month. However the other 50% experienced mislocated containers much less frequently or never.
Table 5.2.7 Misplacement of Containers at CY Frequency Forwarders
Once a week 25% Once a month 25% Once in 6 month 6%
Misplacement of containers at CY
Once a year 19% Never before 25% Total 100%
Source: JICA Study Team

The Study for Development of the Greater Surabaya Metropolitan Ports in the Republic of Indonesia Final Report
5-15
c. Port and Trade Related Payment
Port and Trade Related Payment: Overall, three out of four forwarders commented it to be acceptable or reasonable. Meanwhile, 38.9% of forwarders said terminal handing charge is high.
Figure 5.2.6 User’s Satisfaction for Port and Trade Related Payments
38.9%
16.7%
29.4%
23.5%
44.4%
58.3%
52.9%
52.9%
25.0%
17.6%
23.5%
16.7%
0% 20% 40% 60% 80% 100%
Terminal handling charge
Yard Trucking Charge
Customs Due
Electronic Data Interchange (EDI) processing fee
HighAcceptableReasonable
Forwarders
Source: JICA Study Team
d. Evaluation of the Service in Tg.Perak
Evaluation of the Service in Tg.Perak: The figure shows the evaluation of the service in Tg. Perak compared with other ports using a five point scale. The evaluation value of custom inspection and port tariff is significantly lower than the other factors. The customs document processing and port tariff are also lower than the other factors. This is a similar assessment as that of the shipping companies.
Figure 5.2.7 Evaluation of the Service in Tg.Perak Compared with Other Port
2.50
3.00
3.50
4.00
Vessel Entry Procedure (manifest EDI)
Vessel Entry & Berthing Operation
Cargo Loading/Unloading Speed
Cargo Handling Facility
Yard Stacking and Storage
EDI Port Processing
Customs Document (EDI)Processing
Custom Cargo Inspection
Port Tariff
Port Payment Procedure
Safety of Commodities
Access Roads
Forwarder
(Very Good: 5 ~ Very Poor: 1)
Source: JICA Study Team
e. Urgent Matters to be Improved
Figure 5.2.8 illustrates the summary of opinion of forwarders regarding urgent matters that need be improved at Tg. Perak. Primarily, forwarders are not satisfied with old facilities,

The Study for Development of the Greater Surabaya Metropolitan Ports in the Republic of Indonesia Final Report
5-16
invisible costs and channel. In addition, there are issues that have been brought up regarding r berth space. The results mirror that of the shipping companies.
Figure 5.2.8 Urgent Matters to be Improved
0 2 4 6 8 10 12 14 16
Old facility
High rate of invisible cost
Depth & Breadth of channel
Port security
Berthing space is not enough
Depth of berth & Length of berth
Road outside the port area
Navigation aid system
Lack of carrying capacity (Shortage of facility)
EDI utilization is not enough
Customs related operation
Loction of basin
Lack of skils of operators
Yard space is not enough
Vehicle parking space is not enough
Container handling equipment
Area ob basin
Location of berth
Warehouses are not enough
Calmness of channel
Lack of man-power
Bonded area/Warehouses
Lack of fund to operate as a whole
Caalmenss of basin
Forwarder
Source: JICA Study Team
5.3 Port Business and Investment
1) Financial conditions of Pelindo III
Based on published financial statements, PELINDO III as a State-Own Enterprise shows good performance financially.
Balance Sheet: The amount of current asset is influenced by the turnover from operation and decreased in 2003, but since then, the current assets is making a steady increase. Fixed asset and total asset grew by nearly 9 % and 5% per year respectively over the past 5 years.
Profit and Loss: Operational revenue of PELINDO-III is making a steady increase in the past 5 years by a rate of 10% per annum. However, operating expense has also increased every year especially in 2003. As a result, income amount dropped in 2003 but during the past 5 years, profit before tax has grown at a rate of 3% annually.
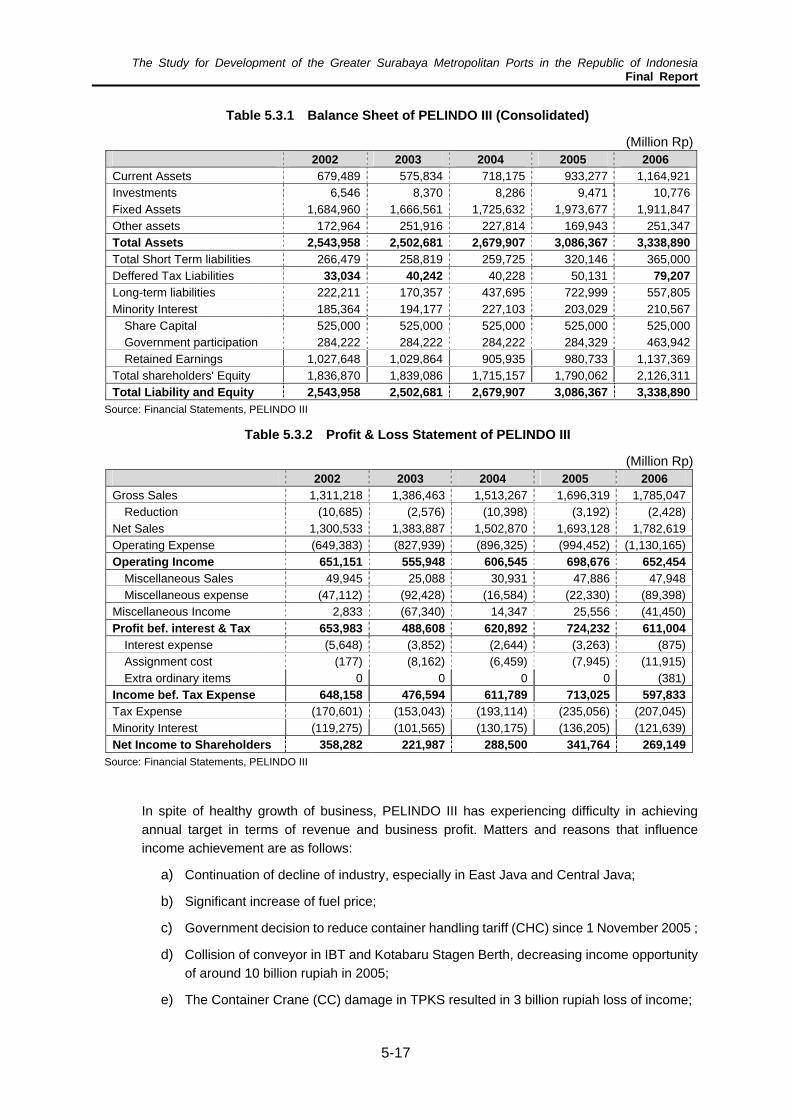
The Study for Development of the Greater Surabaya Metropolitan Ports in the Republic of Indonesia Final Report
5-17
Table 5.3.1 Balance Sheet of PELINDO III (Consolidated)
(Million Rp) 2002 2003 2004 2005 2006 Current Assets 679,489 575,834 718,175 933,277 1,164,921 Investments 6,546 8,370 8,286 9,471 10,776 Fixed Assets 1,684,960 1,666,561 1,725,632 1,973,677 1,911,847 Other assets 172,964 251,916 227,814 169,943 251,347 Total Assets 2,543,958 2,502,681 2,679,907 3,086,367 3,338,890 Total Short Term liabilities 266,479 258,819 259,725 320,146 365,000 Deffered Tax Liabilities 40,228 50,131 33,034 40,242 79,207 Long-term liabilities 222,211 170,357 437,695 722,999 557,805 Minority Interest 185,364 194,177 227,103 203,029 210,567
Share Capital 525,000 525,000 525,000 525,000 525,000 Government participation 284,222 284,222 284,222 284,329 463,942 Retained Earnings 1,027,648 1,029,864 905,935 980,733 1,137,369
Total shareholders' Equity 1,836,870 1,839,086 1,715,157 1,790,062 2,126,311 Total Liability and Equity 2,543,958 2,502,681 2,679,907 3,086,367 3,338,890
Source: Financial Statements, PELINDO III
Table 5.3.2 Profit & Loss Statement of PELINDO III
(Million Rp) 2002 2003 2004 2005 2006 Gross Sales 1,311,218 1,386,463 1,513,267 1,696,319 1,785,047
Reduction (10,685) (2,576) (10,398) (3,192) (2,428) Net Sales 1,300,533 1,383,887 1,502,870 1,693,128 1,782,619 Operating Expense (649,383) (827,939) (896,325) (994,452) (1,130,165) Operating Income 651,151 555,948 606,545 698,676 652,454
Miscellaneous Sales 49,945 25,088 30,931 47,886 47,948 Miscellaneous expense (47,112) (92,428) (16,584) (22,330) (89,398)
Miscellaneous Income 2,833 (67,340) 14,347 25,556 (41,450) Profit bef. interest & Tax 653,983 488,608 620,892 724,232 611,004
Interest expense (5,648) (3,852) (2,644) (3,263) (875) Assignment cost (177) (8,162) (6,459) (7,945) (11,915) Extra ordinary items 0 0 0 0 (381)
Income bef. Tax Expense 648,158 476,594 611,789 713,025 597,833 Tax Expense (170,601) (153,043) (193,114) (235,056) (207,045) Minority Interest (119,275) (101,565) (130,175) (136,205) (121,639) Net Income to Shareholders 358,282 221,987 288,500 341,764 269,149
Source: Financial Statements, PELINDO III
In spite of healthy growth of business, PELINDO III has experiencing difficulty in achieving annual target in terms of revenue and business profit. Matters and reasons that influence income achievement are as follows:
a) Continuation of decline of industry, especially in East Java and Central Java;
b) Significant increase of fuel price;
c) Government decision to reduce container handling tariff (CHC) since 1 November 2005 ;
d) Collision of conveyor in IBT and Kotabaru Stagen Berth, decreasing income opportunity of around 10 billion rupiah in 2005;
e) The Container Crane (CC) damage in TPKS resulted in 3 billion rupiah loss of income;

The Study for Development of the Greater Surabaya Metropolitan Ports in the Republic of Indonesia Final Report
5-18
a. Profitability by Branches and Business Units
Revenue from TPS is outstanding as it records 800 billion rupiah and the profit amounts to nearly 300 billion. Both revenue and profit mark steady growth in the past several years. Together with the container terminal in Semarang, the revenue from these container terminal amounts to nearly two thirds of total revenue of PELINDO III. Actual account of each branch and port is given in the table below. It can be clearly said that the financial impact of container terminal is outstanding.
Figure 5.3.1 Financial Performance by Ports of PELINDO-III (2005, in billion Rp.)
(600.0)
(400.0)
(200.0)
-
200.0
400.0
600.0
800.0
TPS
TPK
Sem
aran
g
Tanj
ung
Pera
k
Kot
abar
u
Banj
arm
asin
Tanj
ung
Emas
BJTI
Tanj
ung
Inta
n
Beno
a
RSPH
Kum
ai
Lem
bar
Mau
mer
e
Celu
kan
Baw
ang
Prob
olin
ggo
Pula
ng p
isau
Gre
sik
Bim
a
Tanj
ung
wan
gi
Tega
l
Sam
pit
Tena
u/ K
upan
g
Revenue
Expense
Profit (in dot)
Source. Financial Report 2005, PELINDO-III Note: Profit is indicated by diamond dot calculated by Revenue minus Expense. There are some
deviations in figures of branches because of transaction between head office is not fully net accounted yet.

The Study for Development of the Greater Surabaya Metropolitan Ports in the Republic of Indonesia Final Report
5-19
Table 5.3.3 Financial Performance by Ports of PELINDO III Ports (Business Unit) Revenue (mil Rp) Cost (mil Rp) Profit (mil Rp)
TPS 814,089 540,395 273,694 TPK Semarang 255,811 85,137 170,674 Tanjung Perak 281,777 160,755 121,022 Kotabaru 64,211 33,330 30,881 Banjarmasin 83,409 63,313 20,096 Tanjung Emas 55,408 36,576 18,832 BJTI 102,701 88,998 13,703 Tanjung Intan 29,717 17,475 12,242 Benoa 14,146 10,507 3,639 RSPH 59,772 9,088 684 Kumai 2,951 2,819 132 Lembar 2,400 2,593 -193 Maumere 1,529 1,755 -226 Celukan Bawang 1,242 1,486 -244 Probolinggo 3,013 3,422 -409 Pulang pisau 284 1,082 -798 Gresik 13,831 14,770 -939 Bima 988 1,999 -1,011 Tanjung wangi 4,985 6,532 -1,547 Tegal 1,128 2,853 -1,725 Sampit 4,261 8,004 -3,743 Tenau/ Kupang 6,545 11,688 -5,143
Source : Financial Report 2005 PELINDO III Note: Because of inclusion of 3 business units in Tg Perak, and lack of off-setting information between the central office and these units, information of central unit is omitted from this table.
Among these 22 business units, half of them are making profit and the rests are operating at loss. However, the amount of profit from the former half is very large to cover the loss from the latter. The total balance of PELINDO III is resulting in a good amount of profit.
2) Investment Activities
The business climate of year 2006 is not as bright as previous years, therefore, in the Stakeholder Meeting (RUPS) it has been approved to revise income and profit targets and it is predicted to decrease. However, PELINDO III Management will not continue to invest in order to increase service and maintenance for existing facility and equipment. Such decisions is made based on consideration of growth of cargo and shipcall in the future.
In the year 2006, PELINDO-Ill conducted various facility developments, with investment allocation of 311.8 billion rupiah, while it finances facility development and improvement in priority branch ports. 115.0 billion rupiah will be invested to the continuing projects from the previous year, and new projects are 196.8 billion rupiah.
Development and improvement of PELINDO III facility for year 2006 covers the following:
i) Tanjung Perak Branch, undertakes work for west channel entering Tanjung Perak, entrance gate arrangement to port areas, development of dolphin mooring, improvement of caisson Jamrud berth, ship docking, and channel dredging of buoy 5-7;
ii) Semarang Container Terminal Branch (TPKS), Container Crane (CC) purchase, and road leveling of West and East Coaster;
iii) Tanjung Emas Semarang Branch, procuring of pilot and tug boat and breakwater reparation;
iv) Banjarmasin Branch: development of pilot station, basin dredging, ship docking

The Study for Development of the Greater Surabaya Metropolitan Ports in the Republic of Indonesia Final Report
5-20
As for dredging, PELINDO-III spends approximately 20 billion Rp every year for maintenance dredging at the following ports.
Table 5.3.4 Maintenance Dredging Cost by PELINDO-III (Mil Rp) 2005 2006 Average
Tg. Perak 4,586 4,527 4,556 Tg. Emas 1,558 229 893 Banjarmasin 1,751 0 876 Tg. Intan 1,467 1,434 1,450 Gresik 1,794 994 1,394 Tg. Wangi 616 616 616 Sampit 2,849 2,849 2,849 Tegal 1,371 1,301 1,336 TPKS 4,694 8,046 6,370 Total: Annualized Maintenance Dredging Cost 20,686 19,995 20,340 Maintenance Cost in the Surabaya DLKR 6,380 5,520 5,950
Source: PELINDO-III Financial Division
In addition to these dredging work, central government orders PELINDO-III to conduct dredging work outside the responsible area.
Regarding Tanjung Perak west channel dredging, the DG Port & Dredging asked the Ministry of State-Own-Enterprise (BUMN) to conduct the dredging work to be done by PELINDO Ill. The cost was all shouldered by PELINDO-III, even though the expenses was supposed to be regarded as advance payment and deducted from the dividend to the government. In the financial report of PELINDO-III in 2006, the expenditure of dredging at DLKP was recorded as “Government responsibility shouldered by PELINDO-III” (Biaya Penugasan) in the amount of approximately 9 billion Rp.
The central government has annual dredging schedule which covers entire country and requires 126 Bil Rp. every year.
Table 5.3.5 Dredging Schedule by the Central Government in 2007 Area Volume (m3) Total Cost (Mil Rp) Requested by
1 Jawa Timur: Pasuruan 250,000 3,864 PELINDO-III 2 1 Package PELINDO-III Jawa Timur: Surabaya 20,000 3 Jawa Timur: Brondong 325,000 5,030 4 Jawa Timur: Kalbut 100,000 1,590 5 Jawa Tengah: Juwana 380,000 5,898 6 Banten: Karangantu 125,000 1,951 7 NAD: Lhok Seumawe 500,000 6,663 PELINDO-I 8 NAD: Kuala Langsa 350,000 4,664 PELINDO-I 9 Jambi: Muara Sabak 300,000 4,910 PELINDO-II
10 Jambi: Kuala Tungkal 300,000 4,910 PELINDO-II 11 Sumatera Selatan 1,250,000 16,656 12 Bangka Belitung 150,000 2,424 13 Bangkulu 500,000 6,663 14 Kalimantan Barat: Polon/Sekua 280,000 4,619 15 Kalimantan Barat: Kendawangan 150,000 2,504 16 Kalimantan Barat: Ketapang 400,000 6,363 PELINDO-II 17 Kalimantan Timur: Samarinda 1,000,000 13,325 18 Kalimantan Tengah: Sampit 700,000 9,328 PELINDO-II 19 Sulawesi Tengah: Leok 250,000 4,606 Total 125,965
Source: DG Port & Dredging

The Study for Development of the Greater Surabaya Metropolitan Ports in the Republic of Indonesia Final Report
5-21
There is another government cost shouldered by PELINDO-III, which is one unit of Patrol Boat, purchased by PELINDO-III and used by ADPEL. Because the boat is listed as one of the assets in PELINDO, depreciation in the amount of 83 million Rp is accounted for in the expense item
3) Estimated Port Investment Capability
Judging from the financial condition of PELINDO-III, investment potential is high and possible to make new infrastructure investment.
The following cash-flow statement shows sound and sufficient cash inflow for the new development. For Example, Teluk Lamong Project expects a contribution of PELINDO III in the amount of 300 billion Rp. The Ending cash balance in 2006 is nearly 900 billion Rp. So the contribution would be easy and even possible to shoulder the portion of local government for infrastructure development.
Table 5.3.6 Cash-Flow Statement of PELINDO-III (Rp Million) 2005 2006 Cash Beginning 357,663 683,924 Operational Cash Inflow 1,286,006 1,247,828 Non-Operational Cash Inflow 955,853 1,549,428 Total Cash Available 2,599,522 3,481,180 Operational Cash Outflow 631,425 912,630 Investment on Routine work 71,911 283,675 Loan to outside 63 1,677 Non-Operational Cash-Outflow 1,212,200 1,392,704 Total Cash Utilized 1,915,598 2,590,685 Cash Ending Balance of the year 683,924 890,495
Source: Financial Statements, PELINDO III
4) Lessons Learned
There are two typical port developments which will make good contrast for the methodology of development. Development of TPS was supported by international development Loan and leased to privatized subsidiary company with participation of private terminal operator. So the fixed asset is still at hands of PELINDO-III. Development of TPS was successful in the sense that PELINDO-III developed container terminal without exchange risk of the international loan and, later on, it was able to afford to expand the terminal by the own fund. Privatization and private investment by terminal operator was successfully realized and has established reputation for efficient terminal operation now.
In the case of Bojonegara, from the very beginning of infrastructure development and procurement of land, private participation was anticipated. Negotiation is reported to be underway during the year 2007. Project risk including marketing and political instability still remains to be large unless liberalization were realized as to investment and entry of foreign companies.
Case 1: Development and Privatization of Terminal Petikemas Surabaya (TPS)
TPS was planned by PELINDO-III in 1984 and started construction with ADB loan at total equivalent amount of 275.9 billion Rp. The loan consists of four units of slightly different components exhibited in the table below. PELINDO-III had a subsidiary loan agreement with GI
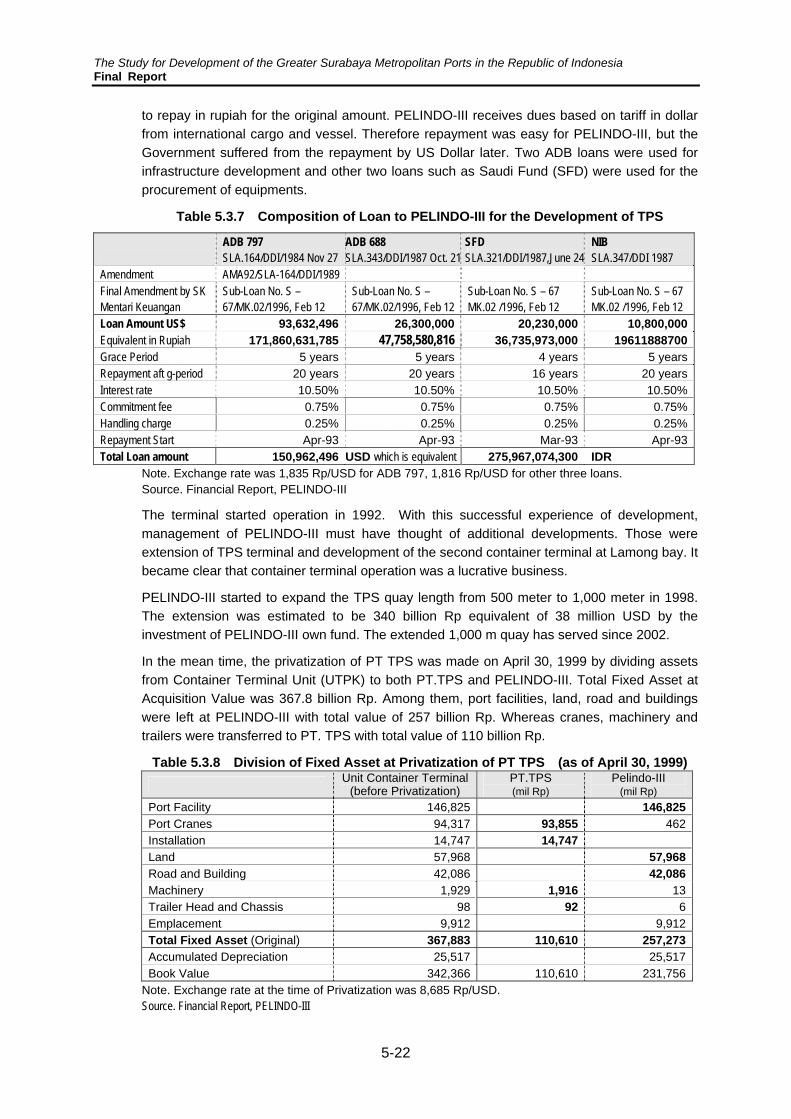
The Study for Development of the Greater Surabaya Metropolitan Ports in the Republic of Indonesia Final Report
5-22
to repay in rupiah for the original amount. PELINDO-III receives dues based on tariff in dollar from international cargo and vessel. Therefore repayment was easy for PELINDO-III, but the Government suffered from the repayment by US Dollar later. Two ADB loans were used for infrastructure development and other two loans such as Saudi Fund (SFD) were used for the procurement of equipments.
Table 5.3.7 Composition of Loan to PELINDO-III for the Development of TPS
ADB 797 SLA.164/DDI/1984 Nov 27
ADB 688 SLA.343/DDI/1987 Oct. 21
SFD NIB SLA.347/DDI 1987 SLA.321/DDI/1987,June 24
Amendment AMA92/SLA-164/DDI/1989 Final Amendment by SK Mentari Keuangan
Sub-Loan No. S – 67/MK.02/1996, Feb 12
Sub-Loan No. S – 67/MK.02/1996, Feb 12
Sub-Loan No. S – 67 MK.02 /1996, Feb 12
Sub-Loan No. S – 67 MK.02 /1996, Feb 12
Loan Amount US$ 93,632,496 26,300,000 20,230,000 10,800,00047,758,580,816 Equivalent in Rupiah 171,860,631,785 36,735,973,000 19611888700
Grace Period 5 years 5 years 4 years 5 years Repayment aft g-period 20 years 20 years 16 years 20 years Interest rate 10.50% 10.50% 10.50% 10.50% Commitment fee 0.75% 0.75% 0.75% 0.75% Handling charge 0.25% 0.25% 0.25% 0.25% Repayment Start Apr-93 Apr-93 Mar-93 Apr-93 Total Loan amount USD which is equivalent150,962,496 275,967,074,300 IDR
Note. Exchange rate was 1,835 Rp/USD for ADB 797, 1,816 Rp/USD for other three loans. Source. Financial Report, PELINDO-III
The terminal started operation in 1992. With this successful experience of development, management of PELINDO-III must have thought of additional developments. Those were extension of TPS terminal and development of the second container terminal at Lamong bay. It became clear that container terminal operation was a lucrative business.
PELINDO-III started to expand the TPS quay length from 500 meter to 1,000 meter in 1998. The extension was estimated to be 340 billion Rp equivalent of 38 million USD by the investment of PELINDO-III own fund. The extended 1,000 m quay has served since 2002.
In the mean time, the privatization of PT TPS was made on April 30, 1999 by dividing assets from Container Terminal Unit (UTPK) to both PT.TPS and PELINDO-III. Total Fixed Asset at Acquisition Value was 367.8 billion Rp. Among them, port facilities, land, road and buildings were left at PELINDO-III with total value of 257 billion Rp. Whereas cranes, machinery and trailers were transferred to PT. TPS with total value of 110 billion Rp.
Table 5.3.8 Division of Fixed Asset at Privatization of PT TPS (as of April 30, 1999) Unit Container Terminal
(before Privatization) PT.TPS Pelindo-III (mil Rp) (mil Rp)
Port Facility 146,825 146,825 Port Cranes 94,317 462 93,855 Installation 14,747 14,747 Land 57,968 57,968 Road and Building 42,086 42,086 Machinery 1,929 13 1,916 Trailer Head and Chassis 98 6 92 Emplacement 9,912 9,912 Total Fixed Asset (Original) 367,883 110,610 257,273 Accumulated Depreciation 25,517 25,517 Book Value 342,366 110,610 231,756
Note. Exchange rate at the time of Privatization was 8,685 Rp/USD. Source. Financial Report, PELINDO-III

The Study for Development of the Greater Surabaya Metropolitan Ports in the Republic of Indonesia Final Report
5-23
Soon after the privatization, in May 1999 after negotiation with several private companies, P & O Australia agreed to purchase 49% of shares of PT. TPS at a cost of 173 million USD. Original intention of P&O was to provide good feeder service keeping up with the economic growth of East Java. Total asset at the time of sales of share was 127.8 billion rupiah which was equivalent of 70 million USD by the exchange rate at the time of loan to develop the terminal. Currently P & O, now DP World, receives dividend at the estimated rate of 7 to 8 % of the investment annually.
Based on the Lease Agreement with the PELINDO-III, PT. TPS pays the following every year.
a. Lease payment of 2.8 million USD for the rental of 837.520 square meters of port area. Payment is made every 6 months during the contract period of 20 years.
b. Contribution or royalty of managing container terminal according to the Authorization Agreement in the amount 10% of gross sales are to be paid every 6 months during the contract period of 20 years.
c. Retainer fee based on the technical service agreement since June 22, 2004 for 5 years. The tariff ranges from USD 470 to USD 750 per man days for the services including advice, recruitment, survey and operation analysis.
After P&O was taken over by Dubai Port World in 2006, the terminal has being operated continuously for both the private investor and PELINDO-III.
Case Study – 2: Bojonegara New Port Development
The Bojonegara Development as an international trade port was recommended by the relevant JICA port study completed in 2004 and planned by PELINDO-II, then approved by the government as one of the first PPP Projects in Indonesia. Even though it might be premature to discuss, the outline of project is hoped to provide us with some insights in the aspect of private participation.
The Bojonegara New Port is planned as complementary twin international trade port of Tanjung Priok to be ASEAN Regional Hub ports considering the following aspects:
- spatial constraints for new development in the existing Tanjung Priok Port and huge cost for new development outside Tanjung Priok Port,
- avoiding intensive concentration of cargo traffic especially large container trailers on the roads of the metropolitan area, and contribute as strategic logistic infrastructure for national and regional development of Banten Province.
New Bojonegara Port is planned to handle mainly international containers. The forecast of international container traffic have been worked out considering the national and ASEAN, regional economic growth by investment, potential growth of manufacturing products, and export/import automobiles with related industrial in the hinterland of Tanjung Priok Port, i.e. the provinces of Banten Province, Jakarta and West Java. Out of the forecast of container cargo volume, the exceeded volume to be reached by 2008, beyond the capacity of Tanjung Priok Port is allocated to handle through Bojonegara Port.

The Study for Development of the Greater Surabaya Metropolitan Ports in the Republic of Indonesia Final Report
5-24
Figure 5.3.2 Demand and Capacity of International Container at DKI Jakarta, West Java and Banten
0
1,000
2,000
3,000
4,000
5,000
6,000
7,000
2000
2001
2002
2003
2004
2005
2006
2007
2008
2009
2010
2011
2012
2013
2014
2015
2016
2017
2018
2019
2020
2021
2022
2023
2024
2025
Container Throughput ('000TEU)
N ecessary C apacity to be added
Tanjung Priok C apacity
D em and of Export/Im port C ontainer
Bojonegara Operation
Tanjung PriokRehabilitation
Completion of newcontainer berths
Bojonegara Operation From 2010, to handle
Source. The Study for Development of Greater Jakarta Metropolitan Ports, JICA, 2004 January
Based on the analysis of optimum balance of the traffic demands and development capacity of port facilities, the required berthing facilities for 2025 of the master plan is estimated 8 container berths and in 2012 of the short term plan is estimated 2 container berths and one (1) multipurpose berth which shall be made operational in 2008.
Investment amounts are estimated in the following infrastructure. The tender process is underway and the result will be announced when the negotiation is settled.
Usually in a project of this kind, Government responsibility is listed to build infrastructure such as “Breakwater” “Channel Dredging” “Access Road” and “Railway construction”. However in the recent lack of government budget, these items are also expected to be covered by the private investment.
In order to ensure the cargo amount for the New Bojonegara Port, hinterland development was planned and industrial estate is planned to be simultaneously developed. Then, land acquisition becomes one of the issues for the development. Generally land acquisition is one of the basic responsibilities of the government. The land price was 20,000 Rp/m2 in 1994 but after the project was announced, the price soared to 83,000 Rp/m2 in 2005. Therefore it is not easy to purchase land by the budget of the regional government. Procurement of land and development to make industrial estate is included in the item of the private investments, but it may take time that the government and private investors agree to a condition both feels satisfied as to the balance of responsibility and benefit.
Investment tends to become too large so that the risk premium is also large. Feasibility of the investment might never meet to the criteria of private investors. In this occasion, international investors have options to move to other country. But on the other hand port development is tied to the land and constraints of regulations. PPP scheme sounds attractive to the government side but often it will delay the schedule of development and thereby cause a slow-down of economy.

The Study for Development of the Greater Surabaya Metropolitan Ports in the Republic of Indonesia Final Report
5-25
Figure 5.3.3 Future Bojonegara Development View (2015)
Source: The Presentation document for the Indonesian Infrastructure Conference and Exhibition, Dep of Transportation 2006
Cost estimation is difficult for the land purchase and road construction. Breakwater and Channel Dredging is difficult too, because the volume of underwater condition and unit price is uncertain and easy to inflate when the project starts and demand increases.
Based on the interview to officers of PELINDO-II, cost of Access Road construction and Land procurement is added to the estimate made in the JICA study report in 2004.
Table 5.3.9 Preliminary Estimate of Investment for the Phased Construction at Bojonegara
Phase-1 Infrastructure Land 61 Access Road Total 17km 600
390 Channel Dredging 322 Break-water
1000 m 200 1,573 Berth 45 45 Equipment Cranes and Machinery
Total Phase-1 investment 1,618 Bil Rp Phase-2
260 Infrastructure Channel Dredging 214 Break-water 313 Railway construction
2,000m 400 1,187 Berth 90 90 Equipment Cranes and Machinery
Total Phase-2 investment 1,277 Bil Rp Phase-3
1,200m 240 240 Infrastructure Berth 45 45 Equipment Cranes and Machinery
Total Phase-3 investment 285 Bil Rp Note. This is a preliminary calculation based on the interview survey to the officers in PELINDO-II by the consultant for updating the cost estimates of the JICA report for the development of Greater Jakarta Metropolitan Ports in 2004 January.

The Study for Development of the Greater Surabaya Metropolitan Ports in the Republic of Indonesia Final Report
5-26
5.4 Environmental Considerations
1) Biodiversity
a. Biodiversity along the coastal area
Stretching from the northern part of East Java province along the coastal line to the southeastern end of the province and encompassing Madura island across the channel, continues flat land with low-lying mangrove swamps and fishponds. Industrial and residential estates can also be found along the coastal line of Surabaya and Gresik city in between the coastal ecological zones. Common vegetation within the country’s bid-diversity rich coastline can be found along the coast, including mangroves, lagoons, sea grasses bed, sea birds and coral reefs etc.
Much of the coastline along the region is fringed with mangroves, which has been supporting many coastal communities, small-scale fisheries as well as industrial fisheries. Mangroves along the coastline act as biological filters and buffers against coastal erosion as repositories of high biodiversity and critical areas, and as spawning and nurseries for many kind of fish, including prawns, crabs, and milkfish etc. In particular, villagers along the coastline of Madura as well as North Gresik regency, being highly dependent on fishing (both aquaculture known as tambak or salty water pond and sea fishing) for livelihood, mangroves have long played key roles for their fisheries production and coastal protection. Mangroves trees have been planted along the riverbanks and dikes of the fishpond through a regreening program initiated by the villagers often with the support of the local government.
Although coral reefs are not found along the coastal zones of the study area, they were identified around Karng Jumang area (5-11 km west of Bangkalan district, water depth: 1.5 m, to 6km, near pilot station) through direct observation (based on Technical and Environmental Study against Channel, Sedimentation and Reclamation Phases Performance in Madura, 2001). 15 families and 35 species1 were found in the area. Among the three sites observed in the area, ratio of live corals varied between 30% and 66% (the water clarity, brightness, salinity etc., was identified to be in a moderate condition at the time). In other areas close by, such as Modung on Kangean island on the utmost eastern Madura, and Pasirputih in Probolinggo district (towards eastern end of the East Java province) and Bawean island, live corals in good conditions can be identified.
The Madura Straits have a specific sediment characteristic—an extremely soft, fluid mud bottom with very high silt content. Mud-dwelling species adapt to this environment with light, flattened shapes or appendages that adhere to the surface of mud. According to Oceanography Research Centre Report, 78 species of those kinds are found in the region.
Crustaceans collected in the Java Sea and Madura Straits identified 17 orders covering 52 genus and 109 species2.
1 Indonesia, being a coral diversity center of the world, has 70 families and 450 species of corals. 2 Portunidae in the Madura has the most (19 species), of which 3 have economic value—2 species of swimming crab (Portunus pelagicus and Charybdis feriatus) and mud crabs (Scylla serrata). Fewer mollusk species live in the Java Sea and Madura Straits. In Indonesia, around 2,000 species of crustaceans have been discovered.

The Study for Development of the Greater Surabaya Metropolitan Ports in the Republic of Indonesia Final Report
5-27
Figure 5.4.1 Ecological Map of the Study Area
Source: JICA study team
b. Anticipated socio-environmental degradation of the coastal area.
Despite the importance of marine ecosystem to global biodiversity and to the country’s environment, these resources are often not managed in a sustainable way. Excess resource use often leads to destruction of coral reefs and important associated sea grasses and mangrove ecosystem, depletion of fish stock, water pollution and biodiversity loss. The coastal area in the study area has also been affected by land-based activities. Industrial and urban wastes and runoff containing chemicals have polluted coastal waters and impaired the ecological function of the some of the precious marine biodiversity. Decline in fish catch in the sea is one of the prominent signals of the ecological changes that have taken place over the years. It was confirmed through interviews with the fishermen in the study area in Bangkalan Regency that polluted coastal water had lead to severe decline in fish catch over the years and this is leading to severe decline in fish catch. For example, in Bangkalan, the fisheries production had declined from 31.4million ton in 2004 to 19.4million ton in 2005.
Table 5.4.1 Fisheries Production in Bangkalan Regency (2005)
Year Type of fishing Total Sea water Fishpond Others
2005 19,381,661 191,761 16,905 19,435,847 2004 22,530,410 14,247,925 53,999 31,425,275
Note: in tons Source: Bangkalan in Figures (2005)

The Study for Development of the Greater Surabaya Metropolitan Ports in the Republic of Indonesia Final Report
5-28
Small-scale fishing is the occupation of last resort for many people in the region. The average income of coastal fishers is below the average national level. Various studies show that the coastal fishing communities are among the poorest segment of society in the country.
In the view of the linkage between environmental degradation and the socio-economic condition of the coastal communities, it is worth mentioning that those vulnerable local poor people who have limited capacity to explore alternative livelihood or new subsistence needs, are the first to be adversely affected from depletion of biological resources.
2) Marine water pollution
Environmental impacts of maritime transport activities arise in three main areas: (i) environmental degradation caused by oil spills (ii) disposal at sea of ship wastes and (iii) dredging and the disposal of contaminated dredged material.
a. Oil spill
Marine water pollution by oil spill is now of worldwide concern. In most cases, oil penetration into the marine environment occurs during their marine transportation and related activities. This includes tanker operational discharges, drydock discharges, as well as those that take place during loading and unloading operations. Discharge of oil could also occur as a consequence of various types of marine accidents and during refinery and terminal operations. According to PELINDO and KPLP, there has not been any serious oil discharge into the sea in Tg. Perak, only occasional discharge from the ships at the dry docks have been discovered.
b. Maritime accidents
Scarcity and poor maintenance of navigation aids makes transit a trying task As a consequence, ship collisions are relatively frequent in these waters; total of 18 accidents have occurred in the East Java province during the last 9 years, of which “brush” is the mostly frequently occurred accidents (8 times), followed by collision (7 times). The type of ship and the damage of the accidents are not available, however, according to PELINDO and KPLP, no accidents leading to serious human causalities or oil and other hazardous spills have occurred until now.
Table 5.4.2 Maritime Accident Data (between 1999 to 2007)
Type 1999 2000 2001 2002 2003 2004 2005 2006 2007 Total Collision 1 1 3 1 1 0 7
Grounding 1 1 Capsize 1 1 Dragged 1 1
Brush 1 6 1 8 Total 1 7 2 1 3 0 2 1 1 18
Source: ADPEL
c. Disposal at sea of ship wastes
Ships calling at the port generate oil wastewater such as bilge water. Other solid and liquid wastes will also be generated by the port community including ships’ crews. As for operation at Tg. Perak, KPLP is handling discharge of oil. For wastes, two waste reception facilities are established to deal with solid wastes at Tg. Perak. They are generated at the port and collected and disposed by a third party company on a daily basis. The water quality at the port is relatively in good condition compared to the provincial standard.

The Study for Development of the Greater Surabaya Metropolitan Ports in the Republic of Indonesia Final Report
5-29
d. Sea-mining and dredging operations
Often, the rearrangement of bottom topography and the other effects by sea-mining or dredging operations can cause changes in the character of the sea bottom as well as flora and fauna etc.
e. Eco-system susceptible to oil pollution
Oil can be carried to considerable depths in the water and be deposited in sediments thereby affecting organisms as much as 20 m below the surface and as a consequence, this can drastically change the composition of existing ecosystem over time. Within the ecosystem along the coastline of East Java, mangroves are said to be extremely vulnerable towards oil pollution so as tambak (brackish water fish pond), a traditionally practiced aquaculture (said to be originated in the Eastern Java region) for milkfish and shrimp.
f. Lessons from Precedent Oil Spill Accidents
Below is the case that well illustrates the threat of the oil spill accidents that can lead to huge and immediate disasters at the expense of environment and society.
An oil tanker, chartered by the Philippines’ oil refiner PETRON, was carrying 2.2 million liters of oil to the southern island of Mindanao, when it sank in rough waters off Guimaras Island on the 11th of August 2006. It is said that around 200,000 liters of oil leaked from the tanker, contaminating 24km2 area. The Guimaras Strait is one of the most productive fishing grounds in the country, and also famous for its rich marine resource, which makes it a very popular tourist spot. The oil spill not only damaged the rich marine resource, but also severely affected the lives of the local residents who deeply rely their livelihood on marine resources including fisheries and tourism. As of July 2007, the oil spill have said to have caused damage to over 650 ha of mangrove areas, 20 ha of sea grasses, 100 hectares of coral reefs and 1,000 ha of fishponds along 235km of coastlines. It also socially and economically displaced over 15,000 villagers in the area. It is reported to be the worst oil spill in the country’s history. A task force was set up by the government to for the cleanup of the oil spill and the retrieval of the 1.5 million liters or so of oil still remaining inside the tanker. The clean up cost was said to be around 250 million pesos (approx. 5 million USD). Compensation programs through International Oil Compensation Fund as well as PETRON have been set up to assist and compensate the affected people3, however, not all affected people are said to have been properly compensated. An alternative livelihood program for the affected people as well as “cash for work program” (to engage in cleaning up of the oil-spill affected shorelines) have been implemented by the central and local governments and other donors. The Philippine government is also trying to pass the bill for the establishment of the Oil Management Fund, which will be used to cover the contaminant clean up and the compensation for the damages to health and livelihoods due to the oil spill incidents.
A 200,000 liters of oil spill can lead to a devastating environmental impact, which will linger for years, even decades, where its pristine waters were once home to coral reefs, a vast variety of fish and marine life, seaweed farms, sea grass beds and beaches.
3 The affected people who have been compensated are said to have received around 4,800 pesos to 32,000pesos.

The Study for Development of the Greater Surabaya Metropolitan Ports in the Republic of Indonesia Final Report
5-30
3) Natural Resource Development
Oil and Gas Development in East Java: East Java contains the third biggest oil deposit in Indonesia after East Kalimantan and Riau. Table 5.4.3 shows the volume of oil and gas deposit in East Java. Oil and gas development therefore is the major natural resource development sector and the most sensitive natural resource development activities with relation to the port development or channel development planning in East Java in general and in GKS in particular. In this regard, this section discusses about the oil and gas development in East Java and in GKS.
Table 5.4.3 Oil and Gas Deposit in East Java Reserves Unit Proven Probable Total
Oil and condensate MSTB 161,384 422,091 583,475 Natural Gas BSCF 5,542 4,759 10,301
Source: BAPPEDA, East Java Note: MSTB: Thousand Stock Tank Barrels (6.3 barrel equals 1 metric ton)
BSCF: Billion Standard Cubic Feet (1 cubic meter of natural gas equals 1/2 ton of gas)
Present Situation of Oil and Gas Production: The oil and gas concession area of East Java is divided into 28 blocks. The proven deposit of major exploration blocks in East Java is as described in Table 5.4.3
Crude Oil Production of East Java: The total volume of crude oil and condensate production in East Java in 2004 was around 230,000 barrels per day. As the total crude oil production in Indonesia in the same year was around 900,000 barrels per day, the crude oil production of East Java accounts almost 24% of the total crude production volume of Indonesia. The oil and condensate production volume by operating companies in East Java is as shown in Table 5.4.5.
Natural Gas Production in East Java: Indonesia has some of the largest known pools of natural gas in the world, with a total estimated reserve of 187 trillion standard cubic feet (TCF) with breakdown as follows: proven (91 TCF), probable (43 TCF) and possible (44 TCF). Indonesia produced 8.16 TCF of gas in 2006 and ranked eighth in the. 45% of production is used domestically, particularly for power generation, fertilizer production and other industrial use.
In Indonesia, natural gas production has been rising constantly at a modest four percent in these years. Liquefied natural gas (LNG) exports remained stable and it accounts for around 55% of the country’s total gas production and generating foreign exchange amounting US$ 6 billion per year. LNG is exported to Japan (71%), South Korea (20%) and Taiwan (9%). Indonesia also exports natural gas via pipeline to Singapore and Malaysia, reaching 118 BCF. As such the revenue from LNG and natural gas exportation is substantial.
The proven reserve of natural gas in East Java is estimated at around 29.0 TCF in total, thus, it accounts almost 15% of the total gas reserve of Indonesia. The gas production of Indonesia is dominated by seven major companies, namely TotalFinaElf (28%), ExxonMobil (19%), VICO (12%), Pertamina (11%), Conoco-Philips (9%), EMP (8%), and Unocal (5%), which account for 92% of all production.
The present gas production of East Java is around 300 MSCFD and with Indonesia production being around 2,600 MSCFD, thus, it East Java accounted for 11% of the total gas production volume in Indonesia. The production of gas by operating companies in East Java is as shown in Table 5.4.6 as of 2006.

The Study for Development of the Greater Surabaya Metropolitan Ports in the Republic of Indonesia Final Report
5-31
Table 5.4.4 Deposit of Oil and Gas Concession Block Deposit Reserve (Potential)
Oil Gas Oil Gas No.
Developer/ Operator
Name of Block
MBBLS MMCF MBBLS TCF
Type Area (km2)
1 Amerada Hess Pangkah 14,300 0.44 PSC 3,924 2 EMP Bawean Bawean I 10,120 PSC 3 EMP Kangean Kangean 2.75 PSC 18,035 4 EMP Muriah Ltd Muriah PSC 14,457 5 Conoco-Philips Ltd Ketapang No finding No finding PSC 4,433 6 INDO Pacific
Resources Bawean 3.25 PSC 15,130
7 Pertamina-MEDCO Madura
On-shore Madura
No finding No finding JOB 2,728
8 Pertamina-PETROCHINA
Tuban 20,000 9,240 JOB 2,728
9 KODECO Energy West Madura 1,487,000 9,698 22,618 1.51 JOA 6,460 10 KODECO Poleng Poleng 1,487 9,698 2.44 TAC 40 11 LAPINDO Brantas Brantas 0.12 PSC 14,950 12 LUNDIN Blora Blora No finding No finding 13 Mobil CEPU Central East
Java 248 250 0 TAC 1,670
14 Mobil Madura Strait Madura Strait 2,060,000 483 No finding No finding PSC 13,970 15 RIMS Energy Karapan Karapan No finding No finding PSC 3,803 16 Santos Madura
Offshore No finding No finding PSC 4,426
17 Santos Sampang No finding No finding PSC 2,677 Note: PSC: Production Sharing Contract, TAC: Technical Assistance Contract, JOA: Joint Operation Assistance
JOB: Joint Operation Body, MMCF: Million Million Cubic Feet, TCF: Trillion Cubit Feet
Table 5.4.5 Crude Oil Production in East Java Crude Oil Production (BBLS/day) No. Operator
Oil Condensate Total 1 Doh Jabati 4,304 0 4.304 2 Petro-China EJ 38,118 0 38,118 3 Tac – Kodeco Poleng 47,328 0 47,328 4 EMP Kengean 0 12,798 12,798 5 Kodeco Energi 122,127 1,728 123,855 6 Indo Pacific Resource 2,438 0 2,438
Total 214,315 14,526 228,841 Source: BAPPEDA, East Java Note: 1) BBLS: barrels (1 barrel equal 159 liter)
2) Condensate is a substance of hydrocarbon and exists normally underground in a form of gas but when it is appeared on the ground surface it is condensed in a form of liquid. Its character is similar to the crude oil produced to which this liquid is associated with.
Table 5.4.6 Natural Gas Production of East Java in 2004
Source: BAPPEDA, East Java Note: 1) MSCFD means Million Standard Cubic Feet per Day
2) EMP Kengean was formally formed by Atlantic Richfield but BP acquired this firm the present major owner is BP.
No. Operator Gas Production (Unit: MSCFD)
Share (%)
1 EMP Kengean 118,586 40.6 2 KODECO Poleng 75,868 26.0 3 LAPINDO Brantas 64,527 22.0 4 KODECO Energi 22,828 7.8 5 PetroChina East Java 7,832 2.7 6 Indo Pacific Resource 1,293 0.0 7 Doh Jabati 914 0.0 8 Total 291,848 100.0

The Study for Development of the Greater Surabaya Metropolitan Ports in the Republic of Indonesia Final Report
5-32
Profile of Oil and Gas Development in East Java: As discussed in the preceding section, the oil and gas production of East Java accounts for 24% of total crude oil production and 11% of total gas production of Indonesia. The use of natural gas produced in East Java is dominated by electric power generation (PT. PLN) and fertilizer production (PT. Petrokemia). Production of LNG for export in East Java is not feasible because of the size of gas reserve and the production wells are scattered over a wide area. This implies that the gas pipe network is imperative and plays an important role to support the industry of East Java.
The peculiar condition of domestic gas use in East Java as that the major user of natural gas is concentrated in one place, i.e. Gresik, therefore, the gas pipelines is to be installed along the narrow channel and/or through populous area. For instance, a combined 16 blocks for oil and gas exploration among the 28 blocks in East Java, is populated by around 13 million people which is quite unusual in the world. The population density per one square kilometer in oil and gas exploration or production block on land in Indonesia, especially in East Java is quite high, considering that many of the crude oil and gas production area on land in the world exist in deserts, jungle, barren land, or the like.
Gas Transmission System in East Java: A number of gas pipelines supplying natural gas to major gas users, mainly PT. PLN and PT. Petrolkemia Gresik in Gresik, have been operating in East Java since 1990. The profiles of the gas pipeline by pipeline operator are as outlined as follows.
At present in East Java, the production of natural gas is dominated by KODECO (Korean Development Corporation, China National Off-shore Oil Corporation (CNOOC) and Pertamina and EMP Kangean. The share of gas production by KODECO is around 35% and EMP Kangean is around 45% of the total gas production volume per year.
Figure 5.4.2 illustrates the present and future network of gas transmission pipelines in East Java. Figure 5.4.3 details the pipelines in the Madura Channel, as indicated by a black circle in FRigure 5.4.2 as a general location reference.
Figure 5.4.2 Gas Transmission Pipeline System in East Java
Note: JICA Study Team added new pipeline (Red dotted line) on Pertamina’s base figure.

The Study for Development of the Greater Surabaya Metropolitan Ports in the Republic of Indonesia Final Report
5-33
Figure 5.4.3 Existing and Planned Gas Transmission Pipeline in the Madura Channel
Source: JICA Study Team
The feature of each gas transmission pipelines in East Java is summarized in Table 5.4.7.
Table 5.4.7 Feature of Gas Transmission Pipelines in East Java
Route Length Capacity
Pipe Dia. Operation Status (km) (MMSCFD)
KE-5 (KODECO) – Gresik 14” 65 120 Since 1990 Pagerungan (EMP) – Porong 28” 380 300 Since 1994 Porong (EJGP) – Surabaya 28” 52 300 Since 1994 Pangkah (Amerada Hess) – Gresik 18” 48 100 Since 2006 Poleng (KODECO) – Gresik 16” 70 120 Preparation Note: 1) Maximum operating pressure is 1,800 psig for off-shore portion and 900 psig for on-shore portion. 2) KODECO’s new pipeline has got a construction permit from Departmen Dan Sumber Daya Mineral Republik
Indonesia, Direktorat Jendral Minyak Dan Gas Bumi (MIGAS) in November 2006. 3) The construction of KODECO’s new pipeline which run along the western coast of Madura Island and cross
the Madura Channel along the same alignment of submersible power cable at the depth of 20 meter from the sea bed with its length of about 2 km.
The details of gas transmission pipeline operation by owner or by operator are as follow.
KODECO started to supply natural gas to PT. PLN and PT. Petrokemia Gresik since 1990 through their own gas pipeline of 14” – 65 km which connects their off-shore gas production

The Study for Development of the Greater Surabaya Metropolitan Ports in the Republic of Indonesia Final Report
5-34
platform KE-5 and their own on-shore receiving facilities (ORF) at Gresik located beside PT. PLN. Thus, KODECO is the first gas producer, supplier and transporter in East Java.
KODECO planned and obtained a permit to construct other gas pipeline of 16” – 70 km which runs from Poleng Processing Platform to the existing ORF in August 2006. This pipeline is designed to be laid down along the shore of western Madura Island as illustrated in Figure 5.4.3 as “new pipeline”.
As indicated in the figure, the alignment of the new gas pipeline is quite close to the designated area for the construction of new ports along the western coast of Madura Island, as it crosses the Madura Channel at the depth of 20 m from the sea bed along the existing submerged power cable connecting Java and Madura Island. Taking such critical situations into account, DGST has decided not to allow extension of the technical permit specifying pipeline alignment. For reference, the technical permit has one year’s validity before construction and it was issued in August 2006.
AMERADA HESS has started to supply natural gas to PT. PLN and PT. Petrokemia Gresik since November 2006 through their own gas pipeline of 18” - 40 km which connects their off-shore gas production platform at Pangkah to their ORF located at Maspion Industrial Estate in Gresik and through 18” – 8 km on-shore pipeline to their client in Gresik. The pipeline is designed to transmit 100 MMSCFD of natural gas.
East Java Gas Pipeline (EJGP) was designed in 1990 and developed by PT. Transjava Gas Pipeline (TJP). EJGP is built as open access and a common carrier for gas that is produced in Kangean block (western part of off Madura Island) and other companies such as Santos supplying gas in East Java. The first gas sale was commissioned in January 1994. Presently, EJGP is used by two gas producers namely EMP Kangean Ltd., and PT. Santos Maleo that holds a concession in the Madura Strait. The gas is transferred through a 28” - 370 km pipeline from Pagerungan Besar Island in Kangean to Porong where Onshore Receiving Facilities (ORF) is located, then transmitted to the customer through on-shore pipeline. The design capacity of this pipeline is 600 MMSCFD with an operating pressure of 1,800 psig off-shore part and 900 psig on-shore.
In November 2006, the gas pipeline of EJGP at near Porong ORF located in the area of the Sidoarjo Mudflow Disaster broke and exploded due to deformation of gas pipeline caused by mudflow. As this gas pipeline is a primary lifeline of Surabaya, urgent repair was undertaken place by afixing a 2.5 km jumper line. The permanent gas pipeline to by-pass the mudflow area is planned to be constructed with an amount of US$ 17 million. Construction will commence soon but it will take around 2 years to complete.