shipping & ports presentation june 2008 v3
TRANSCRIPT

8/2/2019 Shipping & Ports Presentation June 2008 v3
http://slidepdf.com/reader/full/shipping-ports-presentation-june-2008-v3 1/41
Global Trends in Shipping and Ports
June 2008
Transport & Logistics

8/2/2019 Shipping & Ports Presentation June 2008 v3
http://slidepdf.com/reader/full/shipping-ports-presentation-june-2008-v3 2/41
Agenda
• Trends in shipping- General trends
- Tanker sector
- Dry bulk sector
- Container sector
- LNG sector
• Trends in ports

8/2/2019 Shipping & Ports Presentation June 2008 v3
http://slidepdf.com/reader/full/shipping-ports-presentation-june-2008-v3 3/41
Trends in shipping

8/2/2019 Shipping & Ports Presentation June 2008 v3
http://slidepdf.com/reader/full/shipping-ports-presentation-june-2008-v3 4/41
4PricewaterhouseCoopers
9 June 2008
2007 – Another strong year in world shipping
• Long-term growth trend in tonnage demand hasincreased from 3 to 4% in the 1990s to 7 to 8% inthe current decade.
• Worldwide tonnage demand for the worldmerchant fleet up 9% in 2007, compared to 7.6%
in 2006, 5.6% in 2005 and 9–10% in 2003 and2004.
• Slight improvement of utilisation rate in 2007.
• 2007 has been an extremely strong year for thedry bulk market, also other shipping marketsegments very probably gave owners asatisfactory profitability.
• 2008 will bring a slowdown of global economicgrowth.
• In the first four months of 2008 shipping freightrates have been record-high, despite the globaleconomic problems.
Supply, demand and utilisation rate – worldmerchant fleet (in cgt* million), 1990-2007
■ Supply ■ Demand■ Utilisation rate
cgt million Utilisation rate
Trends in shipping – general trends
* cgt = compensated gross tonnes
Source: R.S Platou Economic Research, 2008

8/2/2019 Shipping & Ports Presentation June 2008 v3
http://slidepdf.com/reader/full/shipping-ports-presentation-june-2008-v3 5/41
5PricewaterhouseCoopers
9 June 2008
More pronounced downside risk for shipping sector in 2008
• Market for world shipping still is primarily driven by
emerging economies and especially China.
• Two largest uncertainties for 2008 are the
seriousness of the US economic slowdown and
the resulting impact on the rest of the world.
• Therefore more pronounced downside risk for
world seaborne trade in 2008.
• The worldwide fleet is expected to grow by 9% in
2008, compared to 8.4% in 2007, while tonnage
demand is expected to increase at a lower rate,
leading to a moderate decline in utilisation rates
and profitability for ship-owners.
Worldwide seaborne tonnage demand growthversus world economic growth, 1992-2007
World economic growth
Tonnage demand growth world merchant fleet
Trends in shipping – general trends
Source: R.S Platou Economic Research, 2008

8/2/2019 Shipping & Ports Presentation June 2008 v3
http://slidepdf.com/reader/full/shipping-ports-presentation-june-2008-v3 6/41
6PricewaterhouseCoopers
9 June 2008
Record high ordering activity of new vessels in 2007
• Healthy freight markets fuelled demand for tonnage in all newbuilding segments in 2007: thedemand for new tonnage was 53% higher compared to 2006.
• New record high ordering of bulk carriers andcontainer vessels in 2007.
• The demand for new ships by far exceeded thedelivery capacity and the shipyards order backlogbecame even longer.
• High ordering activity led to an upward pressureon newbuilding prices.
• Abnormal variation in the price developmentbetween different types of tonnage:
- Huge demand for bulk carriers pushed pricesin this segment up by 30 to 40%.
- Prices for tankers only increased by 6 to 16%.
• Building costs have risen because of increased
wages, steel prices and equipment costs.• Orders at the end of 2007 represented 41% of the
existing fleet.
• High ordering activity in 2007 is not expected tocontinue at the same level in 2008.
Worldwide new orders by vessel type incgt* (30,000 dwt+**) , 1998-2007
Trends in shipping – general trends
*cgt = compensated gross tonnes
** dwt = deadweight tonnes
Source: R.S Platou Economic Research, 2008

8/2/2019 Shipping & Ports Presentation June 2008 v3
http://slidepdf.com/reader/full/shipping-ports-presentation-june-2008-v3 7/41
7PricewaterhouseCoopers
9 June 2008
Significant increase of fleet on order as a percentage of the
worldwide active fleet
Percentage of the worldwide active fleet on order by type (% dwt* of fleet on order)
* dwt = deadweight tonnes
Source: BRS, 2008
Trends in shipping – general trends
8/2/2019 Shipping & Ports Presentation June 2008 v3
http://slidepdf.com/reader/full/shipping-ports-presentation-june-2008-v3 8/41
8PricewaterhouseCoopers
9 June 2008
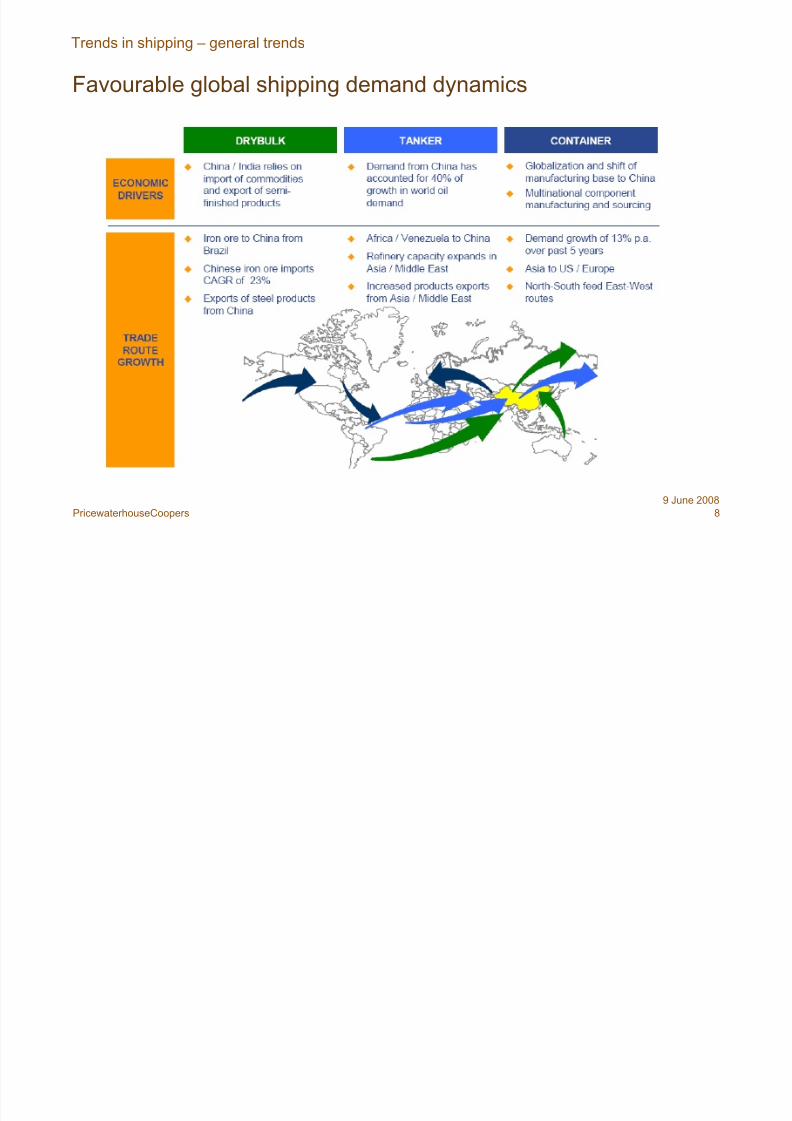
Favourable global shipping demand dynamics
Trends in shipping – general trends

8/2/2019 Shipping & Ports Presentation June 2008 v3
http://slidepdf.com/reader/full/shipping-ports-presentation-june-2008-v3 9/41
9PricewaterhouseCoopers
9 June 2008
Slight decrease of foreign-flagged deadweight tonnage in 2007
• In general , the motivation touse a foreign flag may includemore favourable tax regimes,conditions to finance ships andthe possibility of employingforeign seafarers.
• Further growth in the use of
foreign flags is limited bymarket restrictions in manycountries with importantcabotage traffic as well asgovernment-controlled trade.
• At the same time, severalcountries have reduced the taxburden on nationally flaggedvessels, thus achieving in
some cases a return of previously foreign-flaggedships to the national flag.
Worldwide share of foreign-flagged deadweight tonnage, 1989 – 2007*
*Cargo-carrying vessels of 1,000 gross tonnes and above
Source: Compiled by the UNCTAD secretariat on the basis of data
supplied by Lloyd’s Register – Fairplay, 2007
Trends in shipping – general trends

8/2/2019 Shipping & Ports Presentation June 2008 v3
http://slidepdf.com/reader/full/shipping-ports-presentation-june-2008-v3 10/41
10PricewaterhouseCoopers
9 June 2008
Increasing attention on the issues of climate change and
emissions
• In terms of ton-miles, emissions from ships are very limited compared with other transport sectors.
• With the rapid growth in world shipping, the relative contribution of emissions from ships to the totalpollutants’ burden is rising.
• There is increased pressure from all around the globe to reduce emissions (NOx, SOx and CO2) fromships.
• EU will not include shipping in its Emission Trading Scheme yet.
• Broad efforts are being made by the shipping industry to reduce emissions of greenhouse gasses, e.g.:
- A number of technical improvements for main engines, hull shapes and propulsion systems.
- A stepwise switch from heavy fuel oil to other fuels.
- More optimised weather routing systems.
• These combined efforts could reduce emissions by some 15 to 30% within the next 10 to 15 years.
• However, the simplest effort is to reduce the speed of ships:
- A speed reduction of 20%, e.g. down from 25 to 20 knots for container vessels, will almost halvebunker consumption and consequently of emissions of greenhouse gasses.
- The net effect is a reduction of about 35% since more ships are needed to carry on without changingtransportation work.
Trends in shipping – general trends

8/2/2019 Shipping & Ports Presentation June 2008 v3
http://slidepdf.com/reader/full/shipping-ports-presentation-june-2008-v3 11/41
11PricewaterhouseCoopers
9 June 2008
The tanker market in 2007 took another step on its declining
trend since its peak in 2004
• World oil industry has been almost close to its fullcapacity since 2004, oil consumption increased byonly 1.0% in 2007.
• The worldwide tanker fleet in 2007 increased by 5%,while tonnage demand grew by 3.5%.
• The utilisation rate for the total tanker fleet fell by 1.5
percentage point.• Worldwide transport distances increased by 2%,
mainly driven by a rise in Chinese import distances.
• OPEC reduced output in 2007 to let the high level of commercial oil stocks from 2006 come down to amore manageable level in 2007.
• After a relatively strong first half of 2007, tanker freight rates fell to the lowest level in many yearsduring the second half.
• As of mid-November, rates improved stronglybecause of a sudden rise in oil production, longer transport distances and a lot of slowsteaming due tomuch higher bunker prices.
Supply, demand and utilisation rate worldwidetanker fleet (10.000 dwt+*), 1998 - 2007
Trends in shipping – tanker sector
* dwt = deadweight tonnes
Source: R.S Platou Economic Research, 2008

8/2/2019 Shipping & Ports Presentation June 2008 v3
http://slidepdf.com/reader/full/shipping-ports-presentation-june-2008-v3 12/41
12PricewaterhouseCoopers
9 June 2008
Tanker freight rates are out of line with owners’ heavy
investments
• Another reason for the improving rates as of mid-November 2007 may be the growing number of conversions of single-hull tankers into bulkcarriers.
• The healthy state of the offshore market alsocontinues to attract units for transformation intoFPSOs and FSOs*.
• Tanker freight rates are indisputably out of linewith owners’ heavy investments.
• Finding qualified officers and crew has addedanother burden to the tanker operators.
• For 2008 a tonne-mile growth of 4-6% and a fleetgrowth of 5% is expected.
• In the next few years, the trend of conversions willcontinue to dilute the impact of the massive arrivalof new tankers.
• Constant threat of geopolitical uncertainties, e.g.Middle East and Nigeria.
• Full implementation of the IMO rules have toeliminate single-hull ships by 2010.
* FPSO = Floating Production Storage and Offloading, FSO = Floating Storage and Offloading
Trends in shipping – tanker sector
Freight rates crude carriers – singlevoyage, 1998 - 2007
Source: R.S Platou Economic Research, 2008
■ 300,000 dwt ■ 150,000dwt■ 105,000 dwt
8/2/2019 Shipping & Ports Presentation June 2008 v3
http://slidepdf.com/reader/full/shipping-ports-presentation-june-2008-v3 13/41
13PricewaterhouseCoopers
9 June 2008
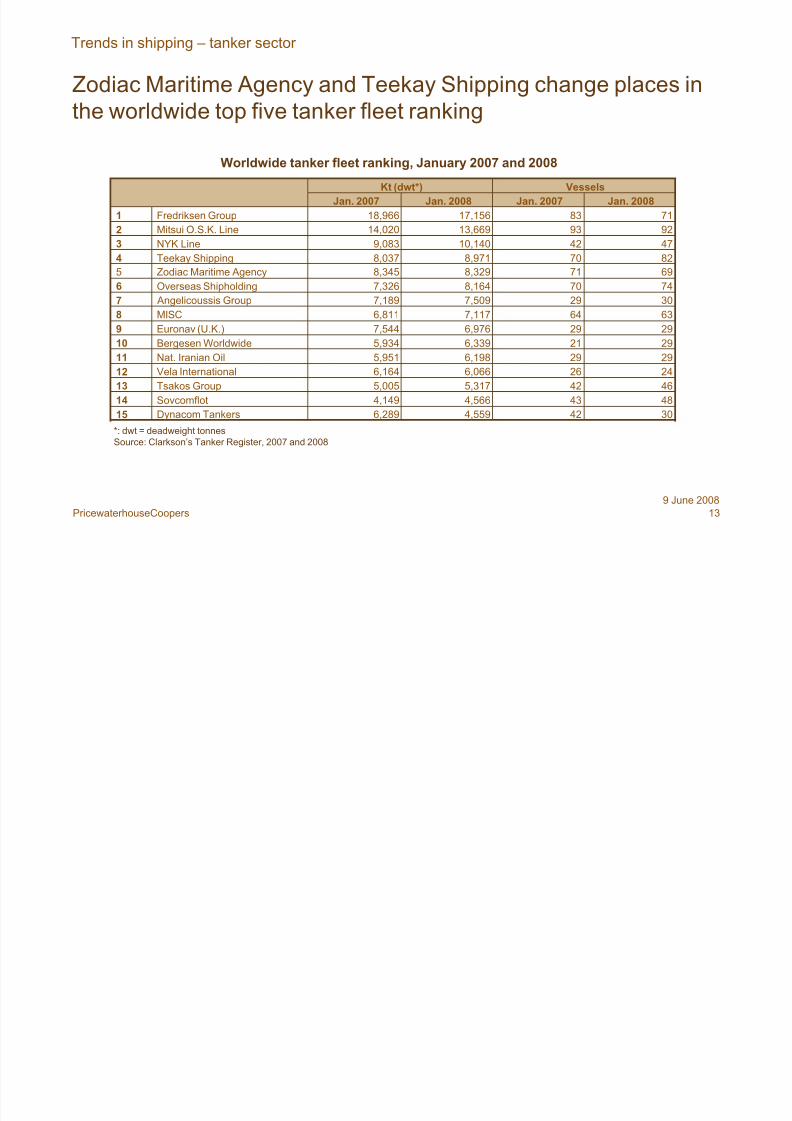
Zodiac Maritime Agency and Teekay Shipping change places in
the worldwide top five tanker fleet ranking
48434,5664,149Sovcomflot14
46425,3175,005Tsakos Group13
24266,0666,164Vela International12
29296,1985,951Nat. Iranian Oil11
29216,3395,934Bergesen Worldwide10
63647,1176,811MISC8
30297,5097,189 Angelicoussis Group7
74708,1647,326Overseas Shipholding6
69718,3298,345Zodiac Maritime Agency5
VesselsKt (dwt*)
30424,5596,289Dynacom Tankers15
29296,9767,544Euronav (U.K.)9
82708,9718,037Teekay Shipping4
474210,1409,083NYK Line3
929313,66914,020Mitsui O.S.K. Line2
718317,15618,966Fredriksen Group1
Jan. 2008Jan. 2007Jan. 2008Jan. 2007
*: dwt = deadweight tonnes
Source: Clarkson’s Tanker Register, 2007 and 2008
Worldwide tanker fleet ranking, January 2007 and 2008
Trends in shipping – tanker sector
8/2/2019 Shipping & Ports Presentation June 2008 v3
http://slidepdf.com/reader/full/shipping-ports-presentation-june-2008-v3 14/41
14PricewaterhouseCoopers
9 June 2008
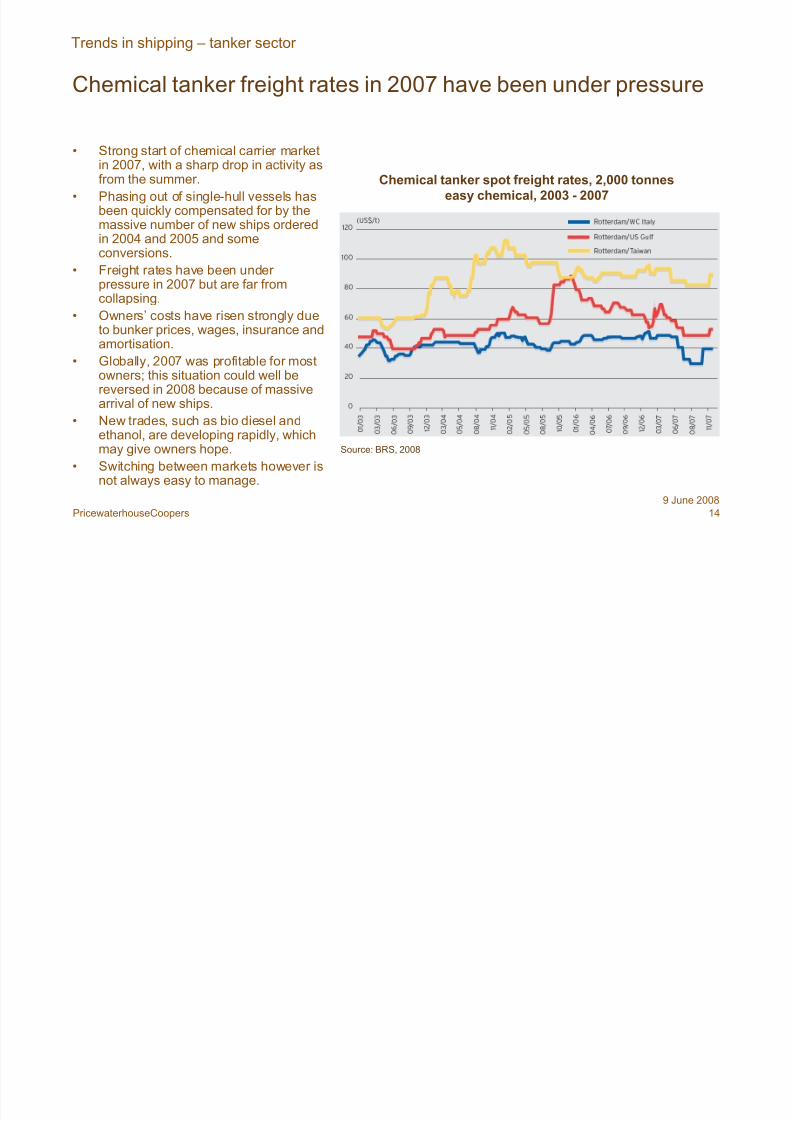
Chemical tanker freight rates in 2007 have been under pressure
• Strong start of chemical carrier marketin 2007, with a sharp drop in activity asfrom the summer.
• Phasing out of single-hull vessels hasbeen quickly compensated for by themassive number of new ships orderedin 2004 and 2005 and someconversions.
• Freight rates have been under pressure in 2007 but are far fromcollapsing.
• Owners’ costs have risen strongly dueto bunker prices, wages, insurance andamortisation.
• Globally, 2007 was profitable for mostowners; this situation could well bereversed in 2008 because of massivearrival of new ships.
• New trades, such as bio diesel andethanol, are developing rapidly, whichmay give owners hope.
• Switching between markets however isnot always easy to manage.
Chemical tanker spot freight rates, 2,000 tonneseasy chemical, 2003 - 2007
Source: BRS, 2008
Trends in shipping – tanker sector

8/2/2019 Shipping & Ports Presentation June 2008 v3
http://slidepdf.com/reader/full/shipping-ports-presentation-june-2008-v3 15/41
15PricewaterhouseCoopers
9 June 2008
Strong growth of basis chemicals and plastics production
expected for the next few years
JO Tankers;3,6%
Tokyo
Marine; 3,9%
Other
majors;
23,4%
Stolt-Nielsen;
10,1%
Odfjell; 10,6%
Other; 48,6%
* Only deep sea ships of 13.000 dwt (deadweight tonnes) and above** dwt = deadweight tonnes
Source: Odfjell, 2008
Market shares chemical tanker* owners, 2007Total fleet 21.3 million dwt**, 773 ships
Trends in shipping – tanker sector
Worldwide basis chemicals and plasticsindex versus GDP growth, 1985 - 2012
Source: Odfjell, 2008

8/2/2019 Shipping & Ports Presentation June 2008 v3
http://slidepdf.com/reader/full/shipping-ports-presentation-june-2008-v3 16/41
16PricewaterhouseCoopers
9 June 2008
2007 strongest year ever for seaborne dry bulk transport
• Growth of seaborne transport of dry bulk commoditiesin 2007 estimated at around 7%.
• A significant increase was noticed in sailing distancesin 2007: Asian sourcing in iron ore from Brazil andlonger trades in steel and cement because of China’sincrease in exports to Europe and the Middle East.
• Iron ore transports increased by 10%, China
accounted for 85% of the total increase.• Seaborne coal transport in 2007 climbed 7%,strongest relative growth in coal imports came fromChina and India.
• As sourcing countries Brazil for iron ore andIndonesia for coal held the key to increases in 2006and 2007.
• Australian ports were saturated, leading to recorddelays.
• The active dry bulk fleet increased by 6.6% from2006 to 2007.
• Fleet utilisation rate in 2007 increased by 6percentage points.
Supply, demand and utilisation rate worldwidebulk carrier fleet (10.000 dwt+*), 1998 - 2007
Trends in shipping – dry bulk sector
* dwt = deadweight tonnes
Source: R.S Platou Economic Research, 2008

8/2/2019 Shipping & Ports Presentation June 2008 v3
http://slidepdf.com/reader/full/shipping-ports-presentation-june-2008-v3 17/41
17PricewaterhouseCoopers
9 June 2008
Firm growth of worldwide seaborne coal and iron ore trade in
2007
Worldwide seaborne dry bulk trade, 1998 - 2007
Trends in shipping – dry bulk sector
Source: R.S Platou Economic Research, 2008

8/2/2019 Shipping & Ports Presentation June 2008 v3
http://slidepdf.com/reader/full/shipping-ports-presentation-june-2008-v3 18/41
18PricewaterhouseCoopers
9 June 2008
Yearly average bulk freight rates more than doubled in 2007
• Yearly average bulk freight rates in 2007 morethan doubled compared to the previous year; insome cases freight costs per tonne were higher than the price of the cargo.
• Record high ordering of bulk carriers in 2007which pushed prices for new vessels up by 30 to40%.
• Conversion of VLCCs – and subsequentlySuezmax, Aframax and even Panamax tankers –into bulkers: 148 converted tankers set to enter the dry cargo markets during 2008 and 2009.
• With the subprime credit crisis that broke duringthe summer of 2007, will all the newbuildingprojects secure financing?
• Supply and demand parameters for 2008 seemrelatively balanced; it will prove much more
challenging to obtain the kind of returns that 2007offered.
• Critical factor is a possibly more significantsetback in the world economy.
Timecharter rates bulk carriers(12 months), 1998 - 2007
Trends in shipping – dry bulk sector
Source: R.S Platou Economic Research, 2008
8/2/2019 Shipping & Ports Presentation June 2008 v3
http://slidepdf.com/reader/full/shipping-ports-presentation-june-2008-v3 19/41
19PricewaterhouseCoopers
9 June 2008
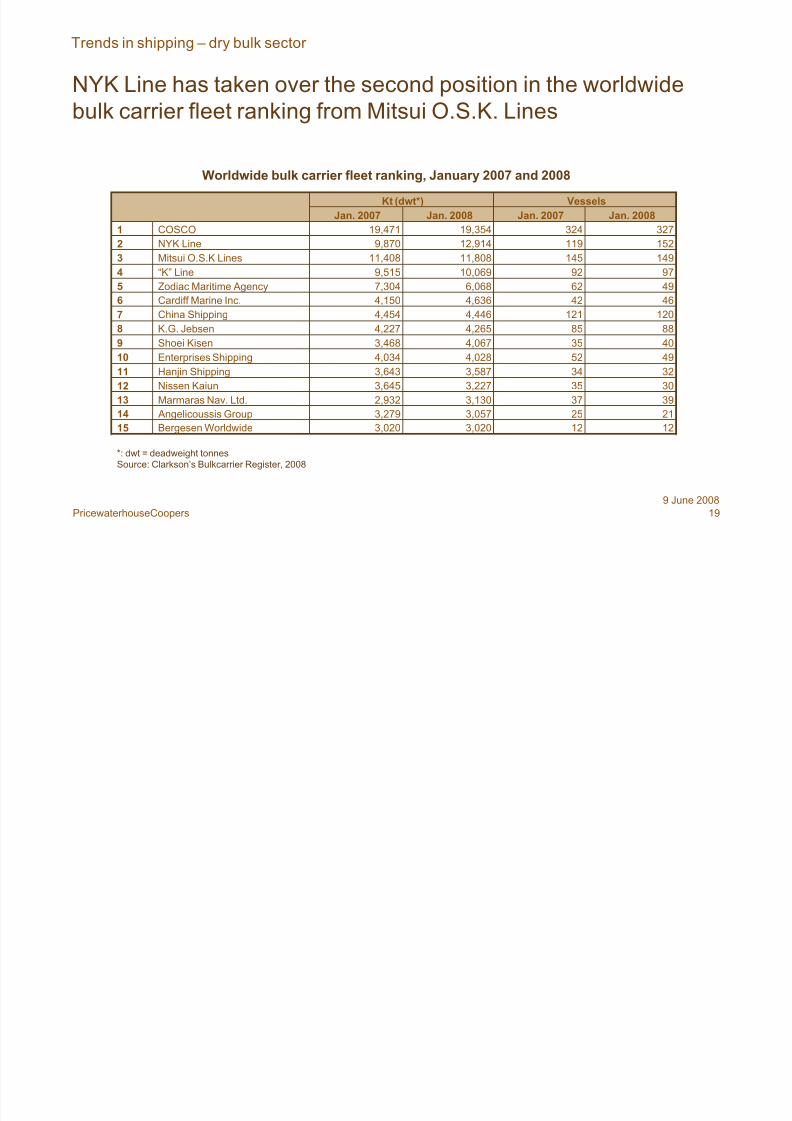
NYK Line has taken over the second position in the worldwide
bulk carrier fleet ranking from Mitsui O.S.K. Lines
39373,1302,932Marmaras Nav. Ltd.13
12123,0203,020Bergesen Worldwide15
32343,5873,643Hanjin Shipping11
40354,0673,468Shoei Kisen9
46424,6364,150Cardiff Marine Inc.6
15211912,9149,870NYK Line2
VesselsKt (dwt*)
30353,2273,645Nissen Kaiun12
21253,0573,279 Angelicoussis Group14
49524,0284,034Enterprises Shipping10
88854,2654,227K.G. Jebsen8
1201214,4464,454China Shipping7
49626,0687,304Zodiac Maritime Agency5
979210,0699,515“K” Line4
14914511,80811,408Mitsui O.S.K Lines3
32732419,35419,471COSCO1
Jan. 2008Jan. 2007Jan. 2008Jan. 2007
*: dwt = deadweight tonnes
Source: Clarkson’s Bulkcarrier Register, 2008
Worldwide bulk carrier fleet ranking, January 2007 and 2008
Trends in shipping – dry bulk sector

8/2/2019 Shipping & Ports Presentation June 2008 v3
http://slidepdf.com/reader/full/shipping-ports-presentation-june-2008-v3 20/41
20PricewaterhouseCoopers
9 June 2008
Fall of the dollar continued to have a positive effect on ship
occupancy ratios in the container shipping sector
• Worldwide container ship demand in 2007increased by 14-15%, while the increase in worldcontainer ship capacity amounted to 14.5%.
• The strongest increase in demand was noted onthe trade lane from Asia to Europe.
• Fall of the dollar continued to have a positiveeffect on ship occupancy ratios.
• Container trade from Asia to the US in 2007 grewby only 2%, while trade in the other direction jumped 15%.
• European volumes to the US were basicallyunchanged while US exports to Europe rose 30%.
• Container ship fleet productivity in 2007 wasreduced by increased port congestion, especiallyin Europe.
• This forced some operators to reschedule and
expand their capacities by adding extra ships inorder to better maintain schedules and save fuelcosts.
• Freight rates in 2007 were slightly higher compared with the prior year, with wide variationsbetween the different trade lanes.
Container freight rates (quarterly)in $ / teu*, 1998 - 2007
Trends in shipping – container sector
* teu = twenty foot equivalent unit
Source: R.S Platou Economic Research, 2008
8/2/2019 Shipping & Ports Presentation June 2008 v3
http://slidepdf.com/reader/full/shipping-ports-presentation-june-2008-v3 21/41
21PricewaterhouseCoopers
9 June 2008
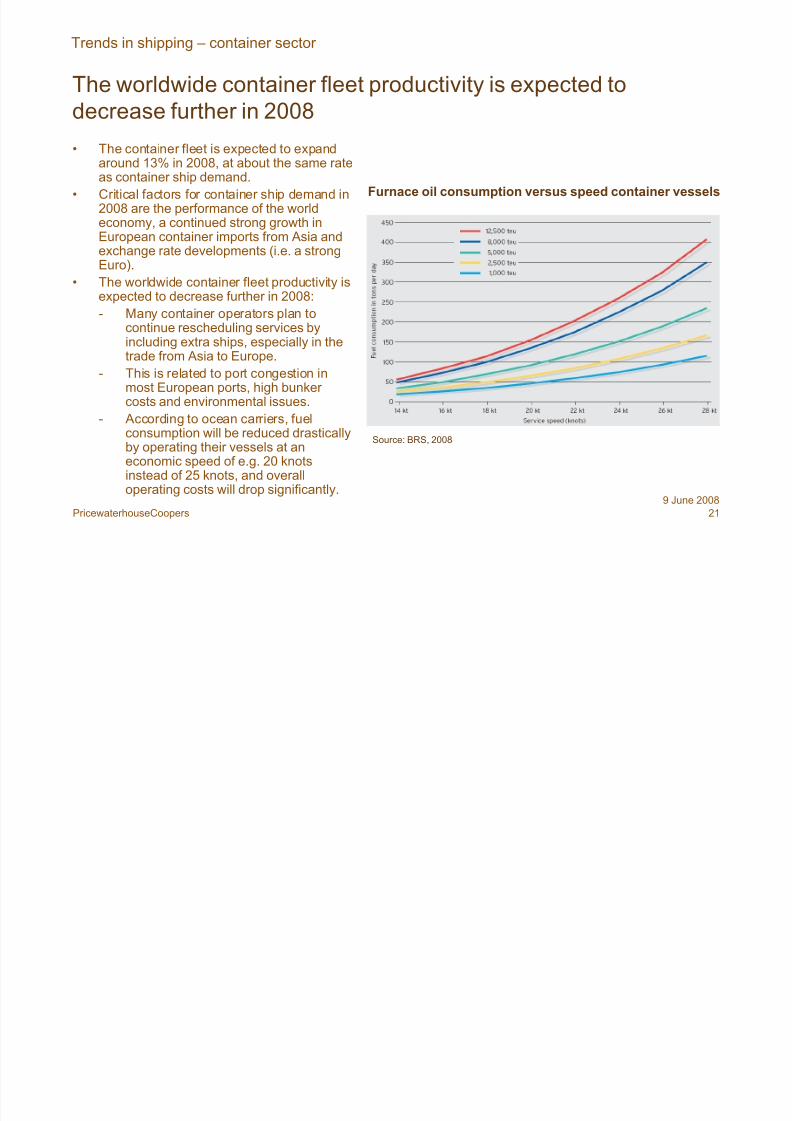
The worldwide container fleet productivity is expected to
decrease further in 2008
• The container fleet is expected to expandaround 13% in 2008, at about the same rateas container ship demand.
• Critical factors for container ship demand in2008 are the performance of the worldeconomy, a continued strong growth inEuropean container imports from Asia andexchange rate developments (i.e. a strongEuro).
• The worldwide container fleet productivity isexpected to decrease further in 2008:
- Many container operators plan tocontinue rescheduling services byincluding extra ships, especially in thetrade from Asia to Europe.
- This is related to port congestion inmost European ports, high bunker costs and environmental issues.
- According to ocean carriers, fuelconsumption will be reduced drasticallyby operating their vessels at aneconomic speed of e.g. 20 knotsinstead of 25 knots, and overalloperating costs will drop significantly.
Furnace oil consumption versus speed container vessels
Source: BRS, 2008
Trends in shipping – container sector

8/2/2019 Shipping & Ports Presentation June 2008 v3
http://slidepdf.com/reader/full/shipping-ports-presentation-june-2008-v3 22/41
22PricewaterhouseCoopers
9 June 2008
Firm growth of worldwide cellular container fleet in 2007
Worldwide fully cellular container fleet by year of built, 1998 - 2007
Trends in shipping – container sector
Source: R.S Platou Economic Research, 2008

8/2/2019 Shipping & Ports Presentation June 2008 v3
http://slidepdf.com/reader/full/shipping-ports-presentation-june-2008-v3 23/41
23PricewaterhouseCoopers
9 June 2008
Several other factors have an effect on the container shipping
sector
• The hike in bulk carrier charter rates has driven conbulkers and large multipurpose ships out of thecontainer trades into the bulk trades; the shift of cargoes from bulkers to boxes remains modest, however.
• The increase in bulk carrier rates also provides an incentive to shift containerisable cargoes, like agroproducts, forest products, steel products and other minor bulks as commodities, from bulk carriers tocontainers.
• Further increase in container ship sizes.• Persisting trade imbalance in container trades on east – west routes, e.g. transpacific and Europe - Asia.
• Introduction of the Authorised Economic Operator status by the EU in January 2008.
• Because of the abolition of European conferences in October 2008, container carriers will have to competewithout cartel arrangements.
• Controlling terminals increasingly is a key to success for carriers in the seaborne container trade market:
- Controlling terminals helps operators avoid the disruptions in schedules caused by the ‘first come, firstserved’ principle or fixed berthing windows, with other carriers seeking the same window.
- A number of carriers set up terminal operating subsidiaries a while ago, others try their best to either
enter or develop their existing activities in this sector.- Trend was reinforced in 2007 with further initiatives in this direction in the years to come.
Trends in shipping – container sector
8/2/2019 Shipping & Ports Presentation June 2008 v3
http://slidepdf.com/reader/full/shipping-ports-presentation-june-2008-v3 24/41
24PricewaterhouseCoopers
9 June 2008
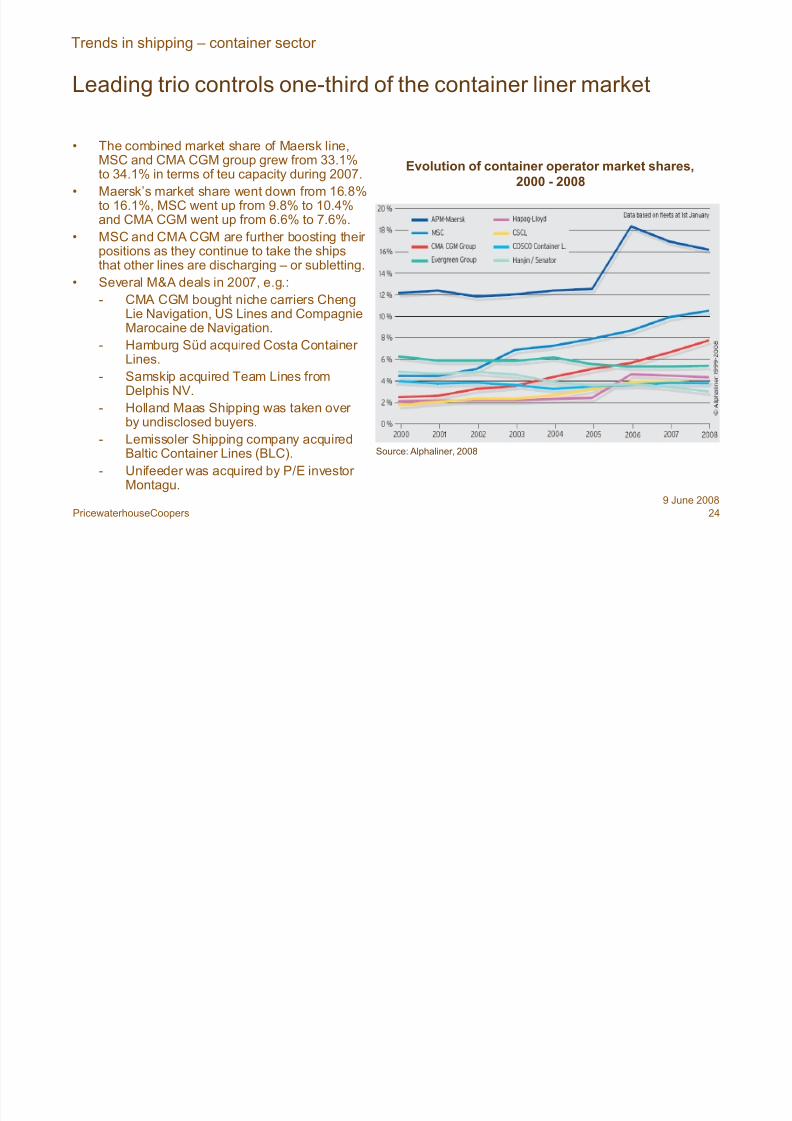
Leading trio controls one-third of the container liner market
• The combined market share of Maersk line,MSC and CMA CGM group grew from 33.1%to 34.1% in terms of teu capacity during 2007.
• Maersk’s market share went down from 16.8%to 16.1%, MSC went up from 9.8% to 10.4%and CMA CGM went up from 6.6% to 7.6%.
• MSC and CMA CGM are further boosting their positions as they continue to take the shipsthat other lines are discharging – or subletting.
• Several M&A deals in 2007, e.g.:- CMA CGM bought niche carriers Cheng
Lie Navigation, US Lines and CompagnieMarocaine de Navigation.
- Hamburg Süd acquired Costa Container Lines.
- Samskip acquired Team Lines fromDelphis NV.
- Holland Maas Shipping was taken over by undisclosed buyers.
- Lemissoler Shipping company acquiredBaltic Container Lines (BLC).
- Unifeeder was acquired by P/E investor Montagu.
Evolution of container operator market shares,2000 - 2008
Source: Alphaliner, 2008
Trends in shipping – container sector
8/2/2019 Shipping & Ports Presentation June 2008 v3
http://slidepdf.com/reader/full/shipping-ports-presentation-june-2008-v3 25/41
25PricewaterhouseCoopers
9 June 2008
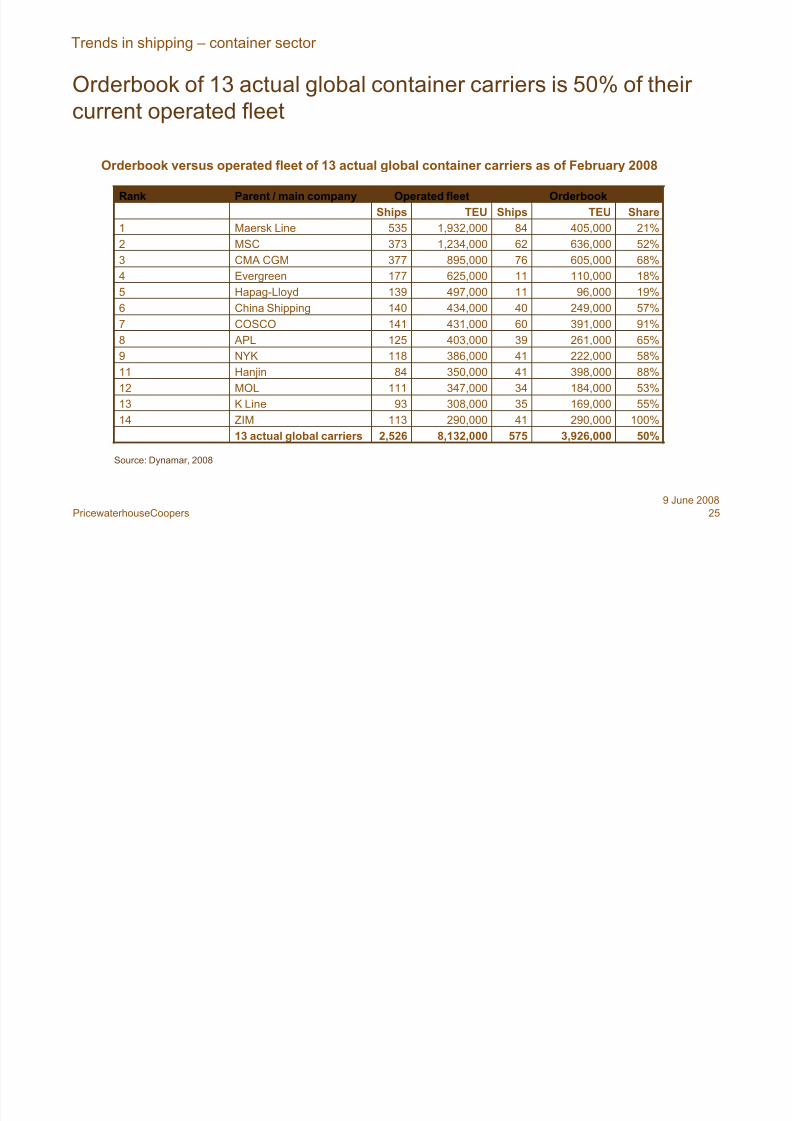
Orderbook of 13 actual global container carriers is 50% of their
current operated fleet
Orderbook versus operated fleet of 13 actual global container carriers as of February 2008
50%3,926,0005758,132,0002,52613 actual global carriers100%290,00041290,000113ZIM14
55%169,00035308,00093K Line13
53%184,00034347,000111MOL12
88%398,00041350,00084Hanjin11
58%222,00041386,000118NYK9
65%261,00039403,000125 APL8
91%391,00060431,000141COSCO7
57%249,00040434,000140China Shipping6
19%96,00011497,000139Hapag-Lloyd518%110,00011625,000177Evergreen4
68%605,00076895,000377CMA CGM3
52%636,000621,234,000373MSC2
21%405,000841,932,000535Maersk Line1
ShareTEUShipsTEUShips
OrderbookOperated fleetParent / main companyRank
Source: Dynamar, 2008
Trends in shipping – container sector
8/2/2019 Shipping & Ports Presentation June 2008 v3
http://slidepdf.com/reader/full/shipping-ports-presentation-june-2008-v3 26/41
26PricewaterhouseCoopers
9 June 2008
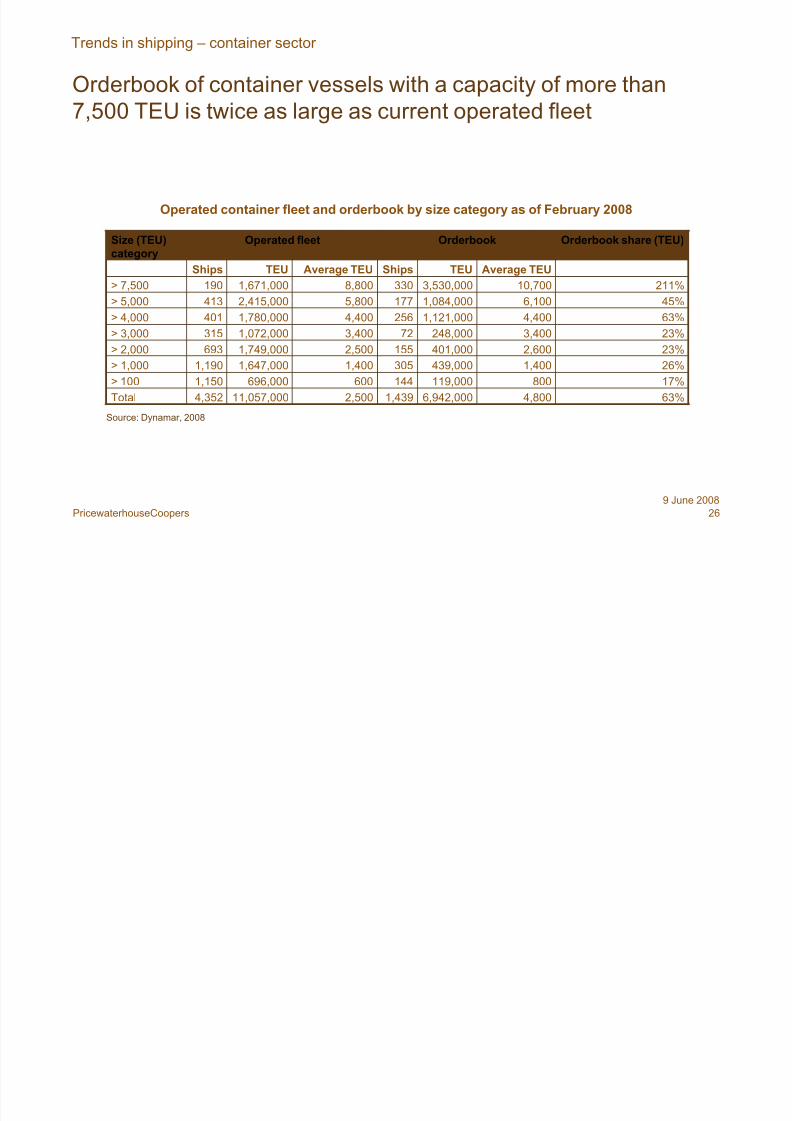
Orderbook of container vessels with a capacity of more than
7,500 TEU is twice as large as current operated fleet
63%4,8006,942,0001,4392,50011,057,0004,352Total
17%800119,000144600696,0001,150> 100
26%1,400439,0003051,4001,647,0001,190> 1,000
23%2,600401,0001552,5001,749,000693> 2,000
23%3,400248,000723,4001,072,000315> 3,000
63%4,4001,121,0002564,4001,780,000401> 4,000
45%6,1001,084,0001775,8002,415,000413> 5,000
211%10,7003,530,0003308,8001,671,000190> 7,500
Average TEUTEUShipsAverage TEUTEUShips
Orderbook share (TEU)OrderbookOperated fleetSize (TEU)category
Operated container fleet and orderbook by size category as of February 2008
Source: Dynamar, 2008
Trends in shipping – container sector
8/2/2019 Shipping & Ports Presentation June 2008 v3
http://slidepdf.com/reader/full/shipping-ports-presentation-june-2008-v3 27/41
27PricewaterhouseCoopers
9 June 2008
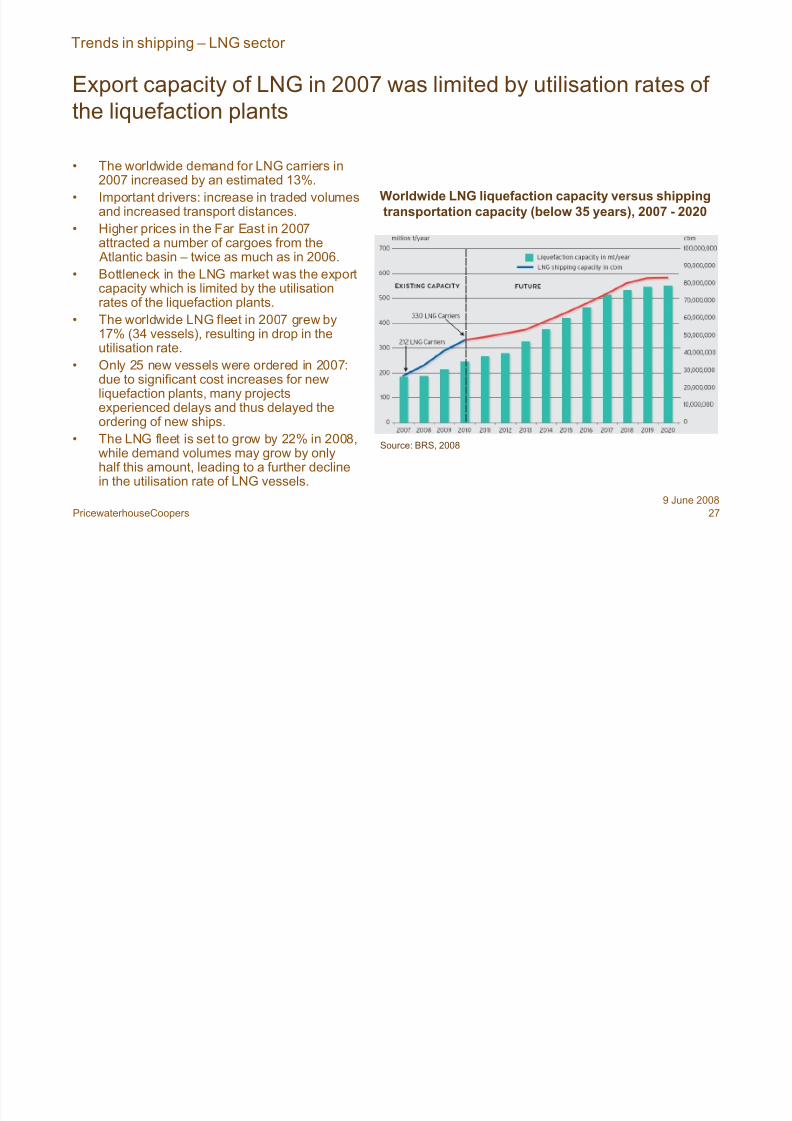
Export capacity of LNG in 2007 was limited by utilisation rates of
the liquefaction plants
• The worldwide demand for LNG carriers in2007 increased by an estimated 13%.
• Important drivers: increase in traded volumesand increased transport distances.
• Higher prices in the Far East in 2007attracted a number of cargoes from the Atlantic basin – twice as much as in 2006.
• Bottleneck in the LNG market was the exportcapacity which is limited by the utilisationrates of the liquefaction plants.
• The worldwide LNG fleet in 2007 grew by17% (34 vessels), resulting in drop in theutilisation rate.
• Only 25 new vessels were ordered in 2007:due to significant cost increases for newliquefaction plants, many projectsexperienced delays and thus delayed the
ordering of new ships.
• The LNG fleet is set to grow by 22% in 2008,while demand volumes may grow by onlyhalf this amount, leading to a further declinein the utilisation rate of LNG vessels.
Worldwide LNG liquefaction capacity versus shippingtransportation capacity (below 35 years), 2007 - 2020
Source: BRS, 2008
Trends in shipping – LNG sector

8/2/2019 Shipping & Ports Presentation June 2008 v3
http://slidepdf.com/reader/full/shipping-ports-presentation-june-2008-v3 28/41
28PricewaterhouseCoopers
9 June 2008
Utilisation rate of LNG carrier fleet declined in 2007
Supply, demand and utilisation rate – LNG carrier fleet 10,000+ cubic metre, 1998-2007
Source: R.S. Platou Economic Research, 2008
Trends in shipping – LNG sector
8/2/2019 Shipping & Ports Presentation June 2008 v3
http://slidepdf.com/reader/full/shipping-ports-presentation-june-2008-v3 29/41
29PricewaterhouseCoopers
9 June 2008
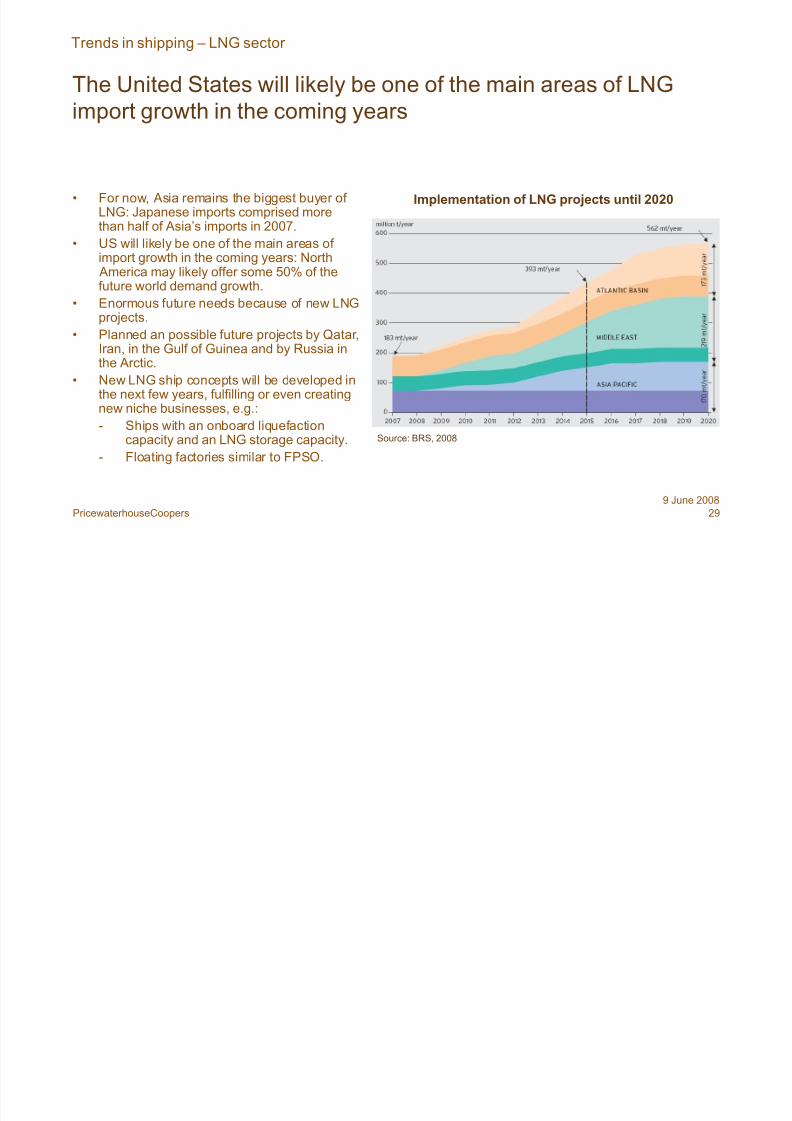
The United States will likely be one of the main areas of LNG
import growth in the coming years
• For now, Asia remains the biggest buyer of LNG: Japanese imports comprised morethan half of Asia’s imports in 2007.
• US will likely be one of the main areas of import growth in the coming years: North America may likely offer some 50% of thefuture world demand growth.
• Enormous future needs because of new LNGprojects.
• Planned an possible future projects by Qatar,Iran, in the Gulf of Guinea and by Russia inthe Arctic.
• New LNG ship concepts will be developed inthe next few years, fulfilling or even creatingnew niche businesses, e.g.:
- Ships with an onboard liquefactioncapacity and an LNG storage capacity.
- Floating factories similar to FPSO.
Implementation of LNG projects until 2020
Source: BRS, 2008
Trends in shipping – LNG sector

8/2/2019 Shipping & Ports Presentation June 2008 v3
http://slidepdf.com/reader/full/shipping-ports-presentation-june-2008-v3 30/41
Trends in ports

8/2/2019 Shipping & Ports Presentation June 2008 v3
http://slidepdf.com/reader/full/shipping-ports-presentation-june-2008-v3 31/41
31PricewaterhouseCoopers
9 June 2008
Continuing strong traffic growth at Chinese ports
0 100 200 300 400 500 600
Shanghai 1
Singapore
Rotterdam
Ningbo
Guangzhou
Tianjin
Qingdao
Hong Kong 1
Dalian
Nagoya 2
Antwerp
Hamburg
2004
2005
2006
2007
1: Including inland navigation
2: Freight tonnes
Source: Port authorities, 2008
Goods transshipments at the world’s largest ports(million metric tonnes), 2004 - 2007
Trends in ports

8/2/2019 Shipping & Ports Presentation June 2008 v3
http://slidepdf.com/reader/full/shipping-ports-presentation-june-2008-v3 32/41
32PricewaterhouseCoopers
9 June 2008
Shanghai to overtake Singapore as the largest container port in
the world in 2008?
0 5.000 10.000 15.000 20.000 25.000 30.000
Singapore
Shanghai 1
Hong Kong 1
Shenzhen
Busan
Rotterdam
Dubai Ports
Kaohsiung
Hamburg
LosAngeles
Antwerp
2004
2005
2006
2007
1: Including inland navigation
Source: Port authorities, 2008
Top 10 container ports and their throughput (thousand TEU), 2004-2006
Trends in ports
8/2/2019 Shipping & Ports Presentation June 2008 v3
http://slidepdf.com/reader/full/shipping-ports-presentation-june-2008-v3 33/41
33PricewaterhouseCoopers
9 June 2008
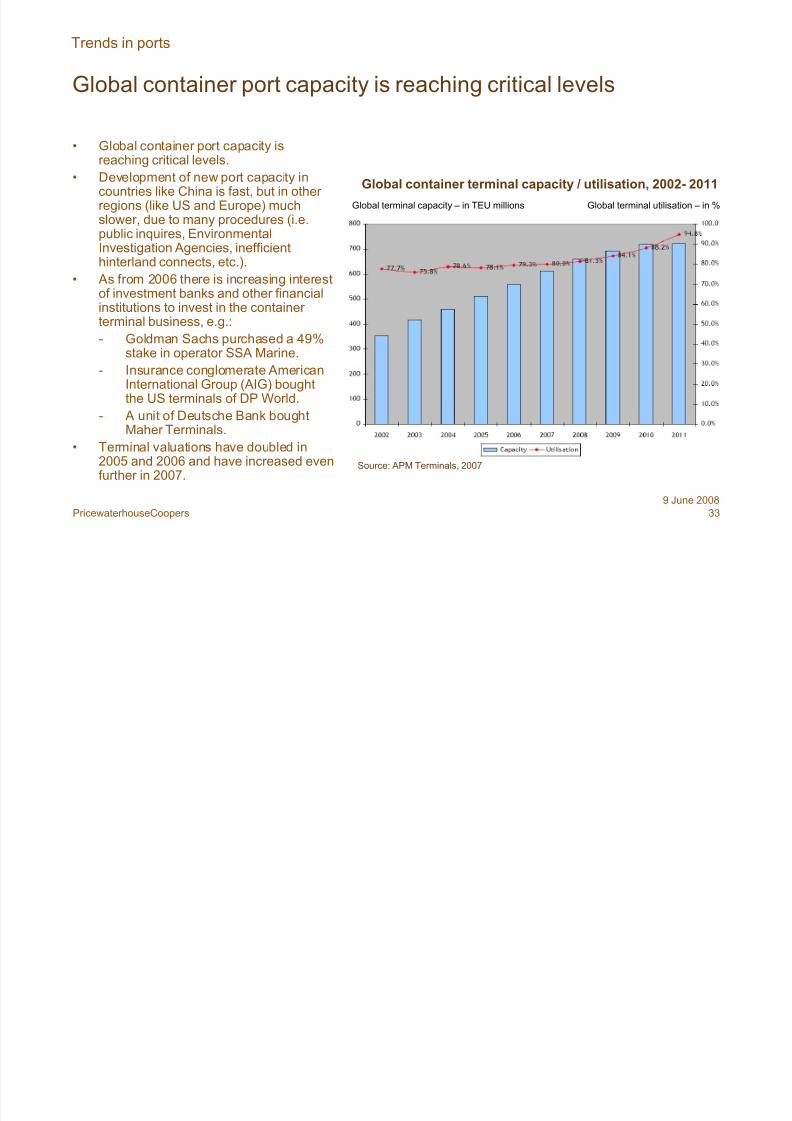
Global container port capacity is reaching critical levels
• Global container port capacity isreaching critical levels.
• Development of new port capacity incountries like China is fast, but in other regions (like US and Europe) muchslower, due to many procedures (i.e.public inquires, EnvironmentalInvestigation Agencies, inefficienthinterland connects, etc.).
• As from 2006 there is increasing interestof investment banks and other financialinstitutions to invest in the container terminal business, e.g.:
- Goldman Sachs purchased a 49%stake in operator SSA Marine.
- Insurance conglomerate AmericanInternational Group (AIG) boughtthe US terminals of DP World.
- A unit of Deutsche Bank boughtMaher Terminals.
• Terminal valuations have doubled in2005 and 2006 and have increased evenfurther in 2007.
Trends in ports
Global terminal utilisation – in %Global terminal capacity – in TEU millions
Source: APM Terminals, 2007
Global container terminal capacity / utilisation, 2002- 2011

8/2/2019 Shipping & Ports Presentation June 2008 v3
http://slidepdf.com/reader/full/shipping-ports-presentation-june-2008-v3 34/41
34PricewaterhouseCoopers
9 June 2008
Container port industry growth is expected to continue as a result
of globalisation and higher global wealth
Source: APM Terminals, 2007
Trends in ports
Global container port market growth, 1996 - 2011

8/2/2019 Shipping & Ports Presentation June 2008 v3
http://slidepdf.com/reader/full/shipping-ports-presentation-june-2008-v3 35/41
35PricewaterhouseCoopers
9 June 2008
Considerable delays in the planned opening of terminals and the
actual opening of the container handling facilities
20072000n.a.Hull Quay 2000/ 2005
20072006n.a.Felixstowe South - UK
20082004n.a.Bathside Bay - UK
20092006n.a.London Gateway - UK
Never 2000n.a.Dibden Bay - UK
Never 2006n.a.Cuxhaven - Germany
20102006n.a.Wilhelmshaven / JadeWeserPort - Germany
2008?20031998Deepening Westerscheldt* - the Netherlands / Belgium
2013 / 201420021991Rotterdam - Maasvlakte II - the Netherlands
200820042000Rotterdam - Euromax Terminal - the Netherlands
200520011995 Antwerp - Deurganck Dock - Belgium
200620031994Le Havre 'Port 2000' - France
Actual or earliest datefor start of terminal
operations
Proposed date for start of operations
(first phase)
Developmentof initial
plans
Delays in the planning process – some cases in Northwest Europe
Trends in ports
* Nautical access to the port of Antwerp
Source: T. Notteboom and J.-P. Rodrigue, 2006

8/2/2019 Shipping & Ports Presentation June 2008 v3
http://slidepdf.com/reader/full/shipping-ports-presentation-june-2008-v3 36/41
36PricewaterhouseCoopers
9 June 2008
Growing involvement of private investors in port projects leading
to increasing EV / EBITDA multiples
Enterprise Value / EBITDA of terminal transactions, November 1999 – June 2006
Source: HSBC and various publicly available information, 2007
Trends in ports

8/2/2019 Shipping & Ports Presentation June 2008 v3
http://slidepdf.com/reader/full/shipping-ports-presentation-june-2008-v3 37/41
37PricewaterhouseCoopers
9 June 2008
Policy decisions can have a substantial impact on the business
agreement and valuation of terminal transactions
• Are the any known environmentalliabilities?
• Responsibility for existing potential environmentalliabilities, if any
Environmental
• Will the concessionaire be held to theport's employment standards?
• Status of existing employees
• Conditions for new concession companyemployees
Labour
• What are operating and maintenanceconditions that are most important?
• Manual of specific operation conditions and rulesto which a concession partner must adhere
Operating and maintenance
standards
• Allowance for phasing could enhancefeasibility
• What construction factors areimportant?
• Capacity constraints, if any and other requirements
• Materials and methods
Construction requirements
• Is this good public policy?
• What are future capital plans that couldhave an impact if any?
• Potential commitment of the port to limitcompetitive development
Non-compete
• What enhancements are necessary?
• Future expansion if capacity is
constrained
• Will the port allow or mandate future expansion /enhancements to the asset?
Expansion / enhancements
• Public appetite for future increases
• What is the elasticity of demand?
• Rate increases and limits will be mandatedRates
• What is political sensitivity to term of concession?
• What is value of incremental termlength?
• Length of time that a concession partner will beallowed to lease and operate the asset
Term of concession
ConsiderationsDescriptionPolicy decision
Source: Goldman Sachs, 2007
Trends in ports

8/2/2019 Shipping & Ports Presentation June 2008 v3
http://slidepdf.com/reader/full/shipping-ports-presentation-june-2008-v3 38/41
38PricewaterhouseCoopers
9 June 2008
Holding Australia EuropeNorth
AmericaPacific
Asia
SouthAmerica /
Caribbean
SouthAsia /
MiddleEast Total
APM Terminals 7 13 7 3 5 35
Dubai Ports World 5 9 1 10 3 12 40
Hutchison Port Holdings 7 21 8 2 39
Port of Singapore Authority 10 18 1 29
Total 5 33 14 56 14 20 143
Trends in ports
Dedicated maritime container terminals controlled by major port holdings, 2007
Source: Hofstra University, 2007
Major port holdings are extending their network of dedicated
maritime container terminals

8/2/2019 Shipping & Ports Presentation June 2008 v3
http://slidepdf.com/reader/full/shipping-ports-presentation-june-2008-v3 39/41
39PricewaterhouseCoopers
9 June 2008
Most container terminal operators have expanded internationally
from a clearly identifiable home port
Trends in ports
Source: Drewry Shipping Consultants, 2007
Container volumes handled by global terminal operators - 2006

8/2/2019 Shipping & Ports Presentation June 2008 v3
http://slidepdf.com/reader/full/shipping-ports-presentation-june-2008-v3 40/41
40PricewaterhouseCoopers
9 June 2008
A range of companies from historically distinct industries all see
their future in the provision of value added logistics services
Trends in ports

8/2/2019 Shipping & Ports Presentation June 2008 v3
http://slidepdf.com/reader/full/shipping-ports-presentation-june-2008-v3 41/41
41PricewaterhouseCoopers
9 June 2008
Financial assets Large financial assets and the capacity to tap global financial
markets. Terminals as equity generating returns.
Managerial expertise Experience in the management of containerised operations. IT and
compliance with a variety of procedures.
Gateway access Establishing hinterland access. Creation of a “stronghold”. Providesa stable flow of containerised shipments. Development of related
inland logistics activities.
Leverage Negotiate with maritime shippers and inland freight transport
companies favourable conditions. Some are subsidiaries of maritime
shipping companies.
Traffic capture Capture and maintain traffic for their terminals.
Global perspective Comprehensive view of the state of the industry. Anticipate
developments and opportunities.
Trends in ports
The main rationale behind the emergence of large port holdings
covers five key areas