3. frequency distributions of heavy rainfall events - illinois state
TRANSCRIPT
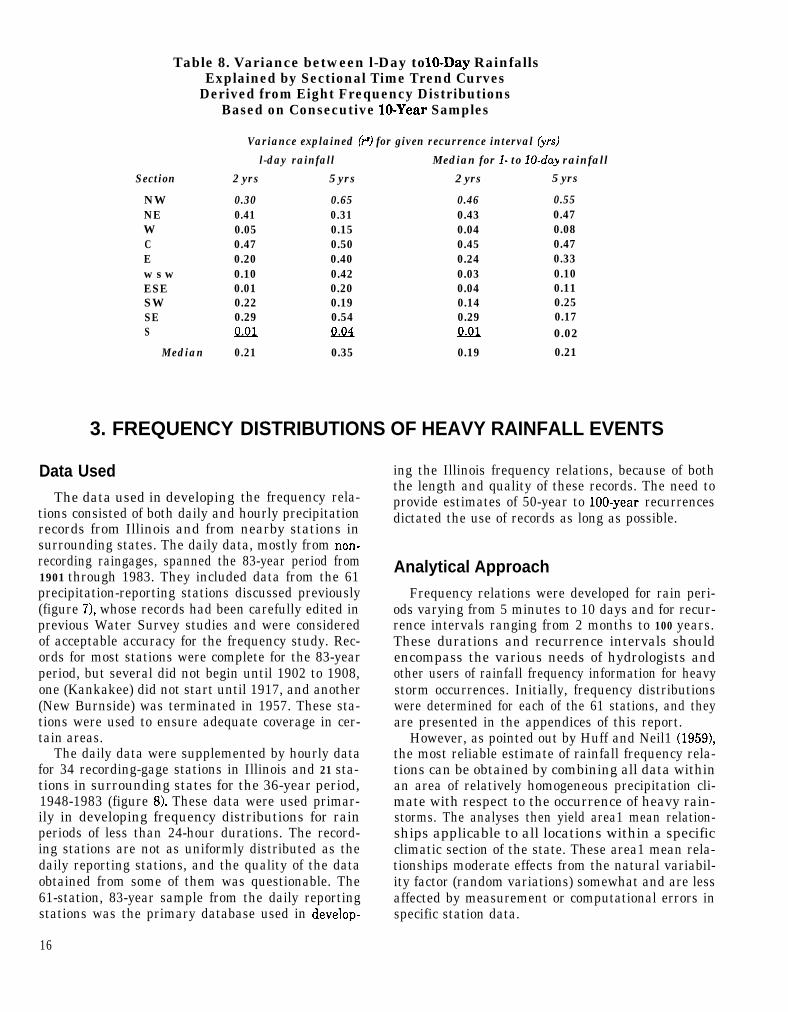
Table 8. Variance between l-Day to lo-Day RainfallsExplained by Sectional Time Trend Curves
Derived from Eight Frequency DistributionsBased on Consecutive lo-Year Samples
Section
NWNEWCEw s wESESWSES
Median
Variance explained (9) for given recurrence interval (yrs)l-day rainfall Median for I- to lo-day rainfall
2 yrs 5 yrs 2 yrs 5 yrs
0.30 0.65 0.46 0.550.41 0.31 0.43 0.470.05 0.15 0.04 0.080.47 0.50 0.45 0.470.20 0.40 0.24 0.330.10 0.42 0.03 0.100.01 0.20 0.04 0.110.22 0.19 0.14 0.250.29 0.54 0.29 0.17Q&l 0.020.21 0.35 0.19 0.21
3. FREQUENCY DISTRIBUTIONS OF HEAVY RAINFALL EVENTS
Data UsedThe data used in developing the frequency rela-
tions consisted of both daily and hourly precipitationrecords from Illinois and from nearby stations insurrounding states. The daily data, mostly from non-recording raingages, spanned the 83-year period from1901 through 1983. They included data from the 61precipitation-reporting stations discussed previously(figure 71, whose records had been carefully edited inprevious Water Survey studies and were consideredof acceptable accuracy for the frequency study. Rec-ords for most stations were complete for the 83-yearperiod, but several did not begin until 1902 to 1908,one (Kankakee) did not start until 1917, and another(New Burnside) was terminated in 1957. These sta-tions were used to ensure adequate coverage in cer-tain areas.
The daily data were supplemented by hourly datafor 34 recording-gage stations in Illinois and 21 sta-tions in surrounding states for the 36-year period,1948-1983 (figure 8). These data were used primar-ily in developing frequency distributions for rainperiods of less than 24-hour durations. The record-ing stations are not as uniformly distributed as thedaily reporting stations, and the quality of the dataobtained from some of them was questionable. The61-station, 83-year sample from the daily reportingstations was the primary database used in develop-
16
ing the Illinois frequency relations, because of boththe length and quality of these records. The need toprovide estimates of 50-year to loo-year recurrencesdictated the use of records as long as possible.
Analytical ApproachFrequency relations were developed for rain peri-
ods varying from 5 minutes to 10 days and for recur-rence intervals ranging from 2 months to 100 years.These durations and recurrence intervals shouldencompass the various needs of hydrologists andother users of rainfall frequency information for heavystorm occurrences. Initially, frequency distributionswere determined for each of the 61 stations, and theyare presented in the appendices of this report.
However, as pointed out by Huff and Neil1 (19591,the most reliable estimate of rainfall frequency rela-tions can be obtained by combining all data withinan area of relatively homogeneous precipitation cli-mate with respect to the occurrence of heavy rain-storms. The analyses then yield area1 mean relation-ships applicable to all locations within a specificclimatic section of the state. These area1 mean rela-tionships moderate effects from the natural variabil-ity factor (random variations) somewhat and are lessaffected by measurement or computational errors inspecific station data.

- Joliet
Ott&a ‘NOR’THEAST
St. Louis l
k-7
-Ca;bondale. bOUTh l Harmburg
St. Louis urbane f f e c t a r e a
Figure 7. Precipitation-reporting stations and climatic sectionsused in developing Illinois frequency relations
The state was divided into ten sections of approxi-mately homogeneous precipitation climate (figure7). This was done through assessment of the heavyrainfall distributions for the 61 stations during the1901-1983 sampling period, along with considera-tion of other pertinent meteorological and ogical information. Initially, an evaluation was madeof the suitability of the nine climatic sections of the
National Weather Service (NWS) (figure 3) for divid-ing the state into sections of approximately equiva-lent precipitation climate with respect to heavy rain-storms. Although the NWS sections are frequentlyused for climatic grouping of temperature and pre-cipitation parameters (such as monthly or seasonalrainfall), adjustments were necessary in this group-ing to adequately characterize the spatial and tem-
17

West
Sullivan - .
-Mount Carmel
Figure 8. Locations of recording-gage stations
poral distribution characteristics of heavy rainstormsin Illinois.
In modifying the NWS grouping, major emphasiswas placed on two types of information: the fre-quency distributions of heavy storm rainfall derivedfor each of the 61 stations for the 1901-1983 sam-pling period, and the pertinent meteorological andclimatological factors influencing the frequency, in-tensity, and spatial distribution of extreme storm
rainfall events in Illinois. Frequency distributionsfor rain periods of 24 hours to 10 days were used inspecifying the regions (sections) having similar dis-tribution characteristics.
Major emphasis was placed on the spatial distri-bution of rainfall amounts for recurrence intervals of2 to 10 years because these values are more accu-rately defined than those for longer intervals. Forexample, for the 1901-1983 data, there are 41, 16,
18

and 8 independent samples available for each sta-tion for the 2-year, 5year, and lo-year recurrenceintervals, respectively, whereas only three samplesdefine the 25-year recurrence interval. Major em-phasis was also placed on rain periods of 24 to 72hours in designating the climatic sections, becausethese durations are of primary interest to most usersof Illinois frequency relations.
Important meteorological and climatological fac-tors were involved in the decision making. Theseincluded the length of the convective rainfall season,which increases considerably within Illinois fromnorth to south. Extreme rainfall events, especiallythose having durations of 72 hours or less, are nearlyalways associated with thunderstorms, and theseoccur most frequently in the extreme southern andwestern parts of the state. Another pertinent factoris the spatial distribution of major synoptic weatherconditions, such as fronts and low-center passageswithin the state (Chiang, 1961). These weather eventsusually generate the storms that occasionally de-velop into severe rain events. Inadvertent weathermodification resulting from topographic and urbaninfluences can also affect the distribution character-istics of heavy rainstorms. All of these factors havebeen studied in previous Water Survey research(Changnon, 1957; Huff and Changnon, 1972; Chang-non et al., 1977; Chiang, 1961; Huff and Vogel, 1976;Huff and Vogel, 1978; Huff, Changnon, and Jones,1975).
In designating the climatic sections, major em-phasis was placed on minimizing the dispersion ofindividual (station) rainfall amounts at selected re-currence intervals about the area1 mean. Clusters ofstations were selected for testing, with the NWSclimatic sections used as initial guides. The initialcomputations were made for the stations within eachof the nine NWS sections. Next, adjustments weregradually introduced that decreased the cluster vari-ability and conformed better with known climatol-ogical factors such as thunderstorm frequency andlength of the convective rainfall season (mentionedabove). This involved both spatial movement andvariations in the number of stations in the originalNWS clusters.
This procedure was continued in a stepwise fash-ion until a group of sections was obtained that ap-proached minimum possible dispersion and, at thesame time, was compatible with the climatic back-ground knowledge and information discussed ear-lier.
As an example, consider the relatively small sec-tion labeled “West” in figure 7, which contains onlythree stations (Quincy, LaHarpe, and Monmouth).
Analyses indicated that these stations had very simi-lar frequency distributions, which exhibited consid-erably larger rainfall values at various recurrenceintervals than were found for stations located to thenorth, east, and south. To illustrate, the 2-year, 24-hour rainfall averaged 3.45 inches in the west com-pared with 3.11, 3.02, and 3.11 inches, respectively,in the northwest, central, and west southwest sec-tions shown in figure 7.
Strictly from statistical considerations, one mightconclude that the data for Quincy, LaHarpe, andMonmouth are not representative of the heavy rain-fall distribution in their region because of the rela-tively large disagreement of these data with the datafor numerous stations to the north, east, and souththat incorporate a substantial portion of the state.However, Water Survey studies (Changnon, 1957)have shown that the area in question coincides closelywith a region of relatively frequent thunderstormsin Illinois, and, as indicated previously, extreme rain-fall events in Illinois nearly always occur in thunder-storm activity. In view of the climatic support for thestatistical results, the Quincy-LaHarpe-Monmouthfindings were deemed legitimate, and the west sec-tion was established to reflect the relatively heavyrainstorm climate in extreme western Illinois.
The preceding example illustrates the generalprocedure followed in establishing the ten sections ofapproximately homogeneous precipitation climate inIllinois. However, some compromise and some sub-jective judgment were involved in the final estab-lishment of boundaries. This was necessary becauseresults from efforts to minimize the dispersion ofstation clusters (potential climatic sections) were notalways exactly the same for each of the recurrenceintervals (2 to 100 years) and for each of the rainfallperiods (24 hours to 10 days) used in the analyses.As indicated earlier, in these cases the shorter recur-rence intervals (2 to 10 years) and rain periods of 24to 72 hours were given the most weight in finaldefinition of the areas because of data reliability(sample size) and the most frequent needs of Illinoisusers.
The ten-section grouping reflects certain spatialtrends indicated in earlier national studies, such asthose by Yarnell (1935) and Hershfield (1961), andin the earlier Illinois study by Huff and Neil1 (1959).Thus, a general trend is indicated for a west-to-eastdecrease in rainfall for a given recurrence intervaland rain period. However, this trend is disrupted innortheastern Illinois by effects of the Chicago urbanarea and Lake Michigan, as shown by Huff andVogel (1976). A general north-to-south increase inrainfall is indicated by the sectional grouping, except
19

for a reversal in central and east central Illinois(central and east sections in figure 7). This reversalwas first identified by Huff and Neil1 (1959). It ap-pears to be related to the lack of any significanttopographic influences in the region, as well as to itslocation north and east of the regions of maximumthunderstorm activity in Illinois (Changnon, 1957)but south of the region of most active frontal activityduring the warm season (Chiang, 1961).
We recommend using area1 mean frequency rela-tionships. However, some users seek an isohyetalpresentation because it facilitates use of the fre-quency information in certain types of hydrologicproblems; for example, in calculating the frequencydistribution of storm rainfall in basins, especiallywhen a basin overlaps two or more climatic regions.We have tried to meet this need by including isohyetalmaps for the storm periods and recurrence intervalsmost commonly used by the hydrologic community.This includes maps for storm periods ranging from 1to 72 hours and for recurrence intervals of 2 to 100years. (See figures 10 through 17.)
Adjustment for Climatic Trend
The relatively strong climatic trend revealed inthe comparison of the two 40-year periods (1901-1940 and 1941-1980) and described in Section 1 wasincorporated through use of an adjustment factor inthe frequency relations derived from the 1901-1983data. This factor was obtained by calculating theratio of 1941-1980 rainfall to that for the entire1901-1983 period at each of the 61 stations for thevarious rain periods and recurrence intervals.
Mean ratios were then calculated for each of theten climatic sections, and these average values were
used to adjust both the station and section frequencydistributions derived from the 1901-1983 data. Theaverage ratios were used in preference to stationvalues to minimize the effects of random samplingfluctuations among the 61 individual stations. Ineffect, the adjustment ratios provide a weightingfactor that gives more weight to the latter part of thesampling period. This was deemed appropriate inview of the findings by Lamb and Changnon (1981)and others with respect to temporal persistence inprecipitation.
Table 9 shows the adjustment factors for eachclimatic section for storm periods of 24 hours to 10days. No statistically significant trend was found fora change in the adjustment ratio (1941-1980/1901-1983) with increasing recurrence intervals, so thevarious recurrence-interval values for each stormperiod were averaged to obtain the average ratios intable 9. It is apparent that the most pronouncedupward trend occurred in the northern part of thestate, with a reversal to a slight downward trend inthe southern part, as discussed in Section 1. Theseratios are considerably smaller than those obtainedin the comparison of the 1901-1940 and 1941-1980periods because the 1941-1980 period is included inthe denominator of the adjustment ratio. The 24-hour values were those used for the rain periods ofless than 24-hour duration.
Ranking of Rainfall DataTwo methods of data ranking are commonly used
in frequency analysis. In our study, the frequencyrelations have been developed from the partial-dura-tion series, as opposed to the annual-maxima series.The annual series consists of only the highest values
Table 9. Adjustment Factors for Climatic Trendby Section and Storm Period
Climatic section
Avemge ratio for given storm duration in each section
24 hrs 48 hrs 72 hrs 5 days 10 days Combiried
Northwest 1.06 1.05 1.06 1.04 1.04 1.05Northeast 1.07 1.04 1.05 1.03 1.02 1.04West 1.05 1.03 1.05 1.05 1.05 1.05Central 1.02 1.03 1.04 1.03 1.03 1.03East 1.02 1.04 1.05 1.04 1.04 1.04West Southwest 1.04 1.04 1.05 1.01 1.01 1.03East Southeast 0.99 0.99 0.99 1.01 1.01 1.00Southwest 0.98 0.98 0.98 0.99 0.99 0.98Southeast 0.99 0.98 0.98 1.00 1.00 0.99South 0.99 0.98 0.98 1.00 1.00 0.99
20
for each year, whereas the partial-duration seriesincorporates all of the highest values regardless ofthe year in which they occur. Thus, with the partial-duration series, more than one value used in thefrequency distribution can occur in a single year.The two series are equivalent for longer recurrenceintervals but usually diverge for return periods of 10years or less. For example, for 24-hour storms, thepartial duration can be converted to the annual se-ries by multiplying the a-year, &year, and lo-yearpartial-duration amounts by 0.88, 0.95, and 0.99,respectively (Huff and Neill, 1959).
Values in earlier major publications varied. InU.S. Weather Bureau Technical Paper 40 (Hershfield,1961), values were expressed in partial-durationterms, but those used by Huff and Neill (1959) werederived from the annual series. The partial-durationseries is used here because it appears to be the mostapplicable to hydrologic design problems.
Independence of ObservationsAs in any statistical analysis, the individual ob-
servations or data points should be independent ofeach other. With a partial-duration series, one mustbe careful that the observations used are not meteor-ologically dependent; that is, they must be from sepa-rate storm systems. In the present study, data forprecipitation durations of 24 hours or less were ob-tained from individual precipitation events, definedas precipitation periods in which there was no pre-cipitation for at least 6 hours before and 6 hoursafter the precipitation event (Huff, 1967); then, onlythe maximum value for the particular duration (6hours, 12 hours, etc.) within such a precipitationevent was used. This ensures that the precipitationvalues are independent of each other and are derivedfrom individual storms. For precipitation durationsof 2 to 10 days, no time separation criteria wereneeded.
Transformation FactorsBecause the 61-station sample provided only daily
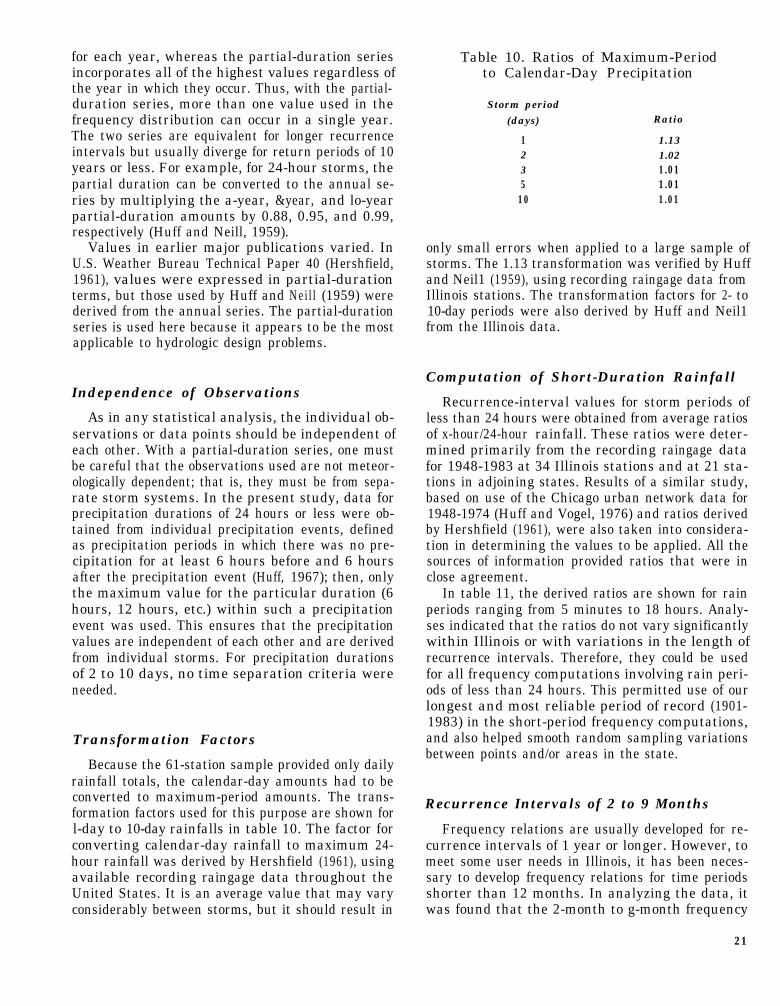
rainfall totals, the calendar-day amounts had to beconverted to maximum-period amounts. The trans-formation factors used for this purpose are shown forl-day to 10-day rainfalls in table 10. The factor forconverting calendar-day rainfall to maximum 24-hour rainfall was derived by Hershfield (1961), usingavailable recording raingage data throughout theUnited States. It is an average value that may varyconsiderably between storms, but it should result in
Table 10. Ratios of Maximum-Periodto Calendar-Day Precipitation
Storm period(days)
1235
10
Ratio
1.131.021.011.011.01
only small errors when applied to a large sample ofstorms. The 1.13 transformation was verified by Huffand Neil1 (1959), using recording raingage data fromIllinois stations. The transformation factors for 2- to10-day periods were also derived by Huff and Neil1from the Illinois data.
Computation of Short-Duration RainfallRecurrence-interval values for storm periods of
less than 24 hours were obtained from average ratiosof x-hour/24-hour rainfall. These ratios were deter-mined primarily from the recording raingage datafor 1948-1983 at 34 Illinois stations and at 21 sta-tions in adjoining states. Results of a similar study,based on use of the Chicago urban network data for1948-1974 (Huff and Vogel, 1976) and ratios derivedby Hershfield (1961), were also taken into considera-tion in determining the values to be applied. All thesources of information provided ratios that were inclose agreement.
In table 11, the derived ratios are shown for rainperiods ranging from 5 minutes to 18 hours. Analy-ses indicated that the ratios do not vary significantlywithin Illinois or with variations in the length ofrecurrence intervals. Therefore, they could be usedfor all frequency computations involving rain peri-ods of less than 24 hours. This permitted use of ourlongest and most reliable period of record (1901-1983) in the short-period frequency computations,and also helped smooth random sampling variationsbetween points and/or areas in the state.
Recurrence Intervals of 2 to 9 Months
Frequency relations are usually developed for re-currence intervals of 1 year or longer. However, tomeet some user needs in Illinois, it has been neces-sary to develop frequency relations for time periodsshorter than 12 months. In analyzing the data, itwas found that the 2-month to g-month frequency
21

Table 11. Average Ratios of X-Hour/24-Hour Rainfall for Illinois
Rain period Ratio,(hours) x-hr /24-hr
0.08 (5 min.) 0.120.17 (10 min.) 0.210.25 0.270.50 0.371 0.472 0.583 0.646 0.75
12 0.8718 0.94
values could be related to the l-year values. Further,we found that the x-month/12-month ratios are con-sistent throughout the state and for all recurrenceintervals. These ratios are shown in table 12 forstorm periods of 24 hours to 10 days. The 24-hourvalues are also applicable to storm periods of lessthan 24-hour duration.
Thus, in table 12, the 24-hour rainfall expected onthe average of once in 6 months is equal to 81%(0.81) of the 24-hour rainfall expected once in 12months at any station or in any climatic section ofthe state. This technique was used in extending thefrequency curves below the l-year recurrence inter-val in the present study. Again, using the averagevalues results in smoothing of the distributions andeliminates some of the irregularities due to randomsampling variations unrelated to the long-term pre-cipitation climate.
Areal Mean Frequency DistributionsThe ten climatic sections used in computing area1
mean frequency distributions are shown in figure 7.County outlines, sampling point locations and names,and boundaries of the ten sections are indicated inthis figure. The southern and western sections aresubject to the greatest frequency of thunderstormrainfall (Changnon, 1957) and, in general, have thehighest rainfall amounts for given rain periods andrecurrence intervals. The southern section also hasthe longest convective rainfall season and incorpo-rates the Shawnee Hills, which, as previously noted,tend to increase the natural rainfall (Huff, Changnon,and Jones, 1975). The central section incorporatesmost of the Illinois River low discussed in Section 1.
The southwestern section has been the recipientof an unusual number of severe rainstorms in thelast 40 to 45 years. This region is subject to topo-graphic enhancement of storms by the Ozark Moun-tains, which lie to the west and southwest; to arelatively long convective season; and to influencesof the St. Louis urban area effect under some stormconditions (Vogel and Huff, 1978). The eastern, eastsoutheastern, and southeastern sections have no dis-tinguishing topographic features or climatic anoma-lies. The same is true of the northwestern section.Variation in the length of the convective rainfallseason is the major difference between these sec-tions.
Of the ten sections, the northeastern section hasthe greatest diversity in the distribution of heavystorm rainfall. If more station data were available,division of this section into two or three subsectionswould be desirable. It incorporates effects of three
Stormperiod
<=24 hours
48 hours
72 hours
5 days
10 days
Table 12. Ratios of Illinois Rainfall Amountsfor Recurrence Intervals of Less than 1 Year
to Rainfall Amounts for Recurrence Intervals of 1 Year,for Various Rainstorm Periods
Mean ratio, x-month to 12-month rainfall amountfor given rainstorm period
2 3 4 6months months months months
0.55 0.64 0.70 0.81
0.53 0.62 0.69 0.80
0.52 0.61 0.69 0.80
0.51 0.61 0.69 0.80
0.49 0.59 0.69 0.80
9months
0.92
0.92
0.92
0.92
0.92
22

important conditions that produce in-area variationsin rainfall: a frontal maximum, Lake Michigan influ-ences, and urban effects. The southern and south-eastern parts of this section lie in a climatic highthat extends northeastward from southwestern Illi-nois and is related to frequent frontal activity. Thesouthwestern part of this northeastern section isbetween the Illinois River and the Waukegan-Mar-engo low (Lake and McHenry Counties). The largeChicago urban area is subject to both urban and lakeeffects on precipitation, and the Waukegan area northof the city and near the lake is subject to the sup-pressing influence that Lake Michigan has on con-vective season rainfall (Changnon, 198413).
Graphical ValuesFigure 9 shows families of frequency curves for
each of the ten climatic sections. Curves are shownfor recurrence intervals of 2 months to 100 years andfor rain periods of 5 minutes to 10 days. The sec-tional curves were derived by averaging rainfallamounts from the frequency curves for each individ-ual station in the section. These families of curvesillustrate the characteristics of the frequency distri-butions and the interrelationship between storm(rain) periods and recurrence intervals of variouslengths.
Tabular ValuesThe relationships shown in figure 9 are presented
in tabular form in table 13. The tabular values facili-tate use of the information and provide more accu-rate rainfall values than can be read from the loga-rithmic plots of figure 9. Estimates of the dispersionof point rainfall amounts that can be expected tooccur about the sectional curves are discussed andpresented in Section 5 of this report.
In table 13, the first column (storm code) refers tothe storm (rain) period. The codes are numberedconsecutively from 1 to 15, with code 1 representing10-day storm periods and code 15 representing 5-minute periods. The second column (zone code) re-fers to the ten climatic sections. Thus, zone 1 is thenorthwestern section, zone 2 is northeastern, etc., asindicated in the code explanations included with thetable.
For each storm period, rainfall amounts are shownfor each climatic section for recurrence intervals of 2months to 100 years. For example, assume a userwishes to know the lo-year frequency of 24-hourrainfall in the central section. First, move to storm
code 5 (24-hour rainfall). In the code 5 grouping,move to zone 4 (central section) and continue acrossthe page to the column labeled “lo-year.” At thispoint (storm code 5, zone 4) the rainfall amount is4.45 inches, which is the 24-hour rainfall to be ex-pected, on the average, once in 10 years at any givenpoint in the central section.
Areal versus Isohyetal PresentationsThe use of the areal frequency relations is favored
over the use of isohyetal presentations generatedfrom the frequency curves for individual stations inthe region of interest. The areal approach lessensthe effects of natural and human-induced variabilitybetween points in an area of approximately homoge-neous precipitation climate with respect to heavyrainstorms. The averaging process allots equal weightto all station data in a specific climatic area (sec-tion). When data for a relatively large number ofstations are available, such as the data for the 61stations used in the present study, it is readily ap-parent that considerable variation in the frequencydistributions of heavy rainfall may exist betweennearby points (table 14), even in relatively long sam-pling periods such as the 83-year period used in thepresent study. Such variation occurs even when thesampling stations are selected after all availableinformation pertaining to their operation is editedand reviewed.
Much of this areal variability is caused by randomsampling variation. For example, the station at Ur-bana has been operated since 1888 in the same loca-tion, first by the University of Illinois and morerecently (since 1948) by the Illinois State WaterSurvey. The raingage operation has been under theclose supervision of University and Survey scientiststhroughout its history. There is probably no rain-gage station in the state with a more authentic rec-ord. Yet, in general, the frequency relationships forthe Urbana station show smaller rain values for agiven recurrence interval than do those for severalsurrounding stations located in the same or verysimilar climatic regimes.
The major cause apparently is that Urbana hasnot experienced the most extreme rain events thatcan occur in east central Illinois. A few examplesresulting from extensive field surveys of heavy rains(Huff et al., 1958; Huff and Changnon, 1961) duringthe period since 1955 are a 10-inch rainfall in lessthan 24 hours about 25 miles north-northwest ofUrbana (May 1956); a 12-hour storm of 13 inchesabout 40 miles southeast of the city (June 1957); a 6-inch storm in 4 hours 3 miles north (June 1961); a 7-
23


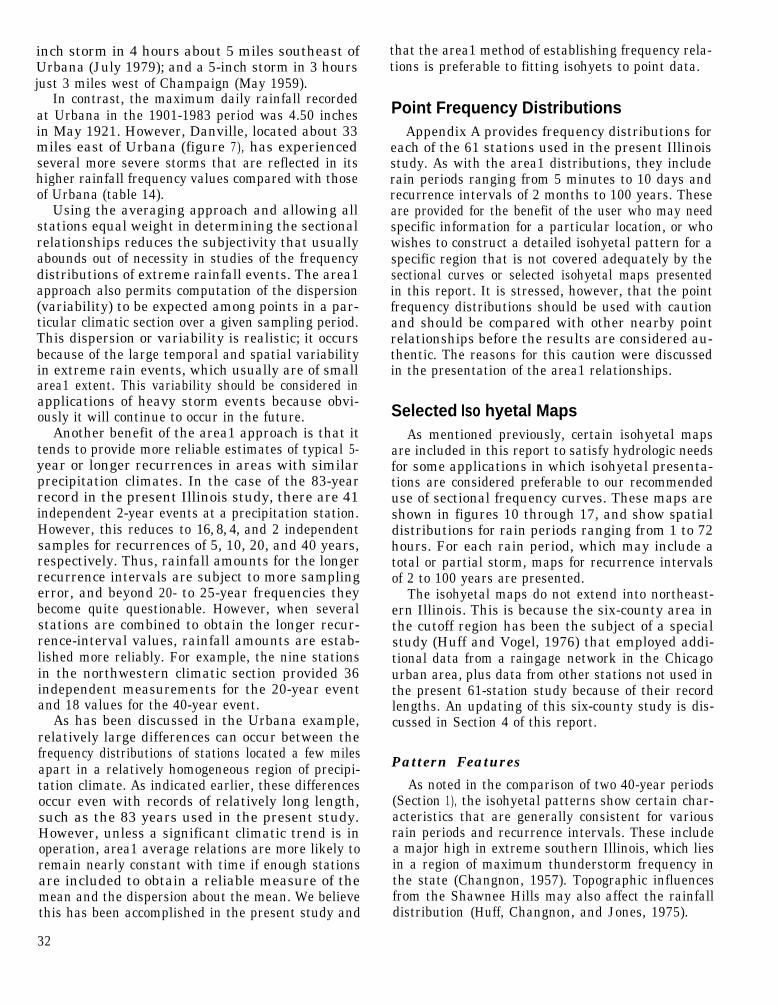
inch storm in 4 hours about 5 miles southeast ofUrbana (July 1979); and a 5-inch storm in 3 hoursjust 3 miles west of Champaign (May 1959).
In contrast, the maximum daily rainfall recordedat Urbana in the 1901-1983 period was 4.50 inchesin May 1921. However, Danville, located about 33miles east of Urbana (figure 7), has experiencedseveral more severe storms that are reflected in itshigher rainfall frequency values compared with thoseof Urbana (table 14).
Using the averaging approach and allowing allstations equal weight in determining the sectionalrelationships reduces the subjectivity that usuallyabounds out of necessity in studies of the frequencydistributions of extreme rainfall events. The area1approach also permits computation of the dispersion(variability) to be expected among points in a par-ticular climatic section over a given sampling period.This dispersion or variability is realistic; it occursbecause of the large temporal and spatial variabilityin extreme rain events, which usually are of smallarea1 extent. This variability should be considered inapplications of heavy storm events because obvi-ously it will continue to occur in the future.
Another benefit of the area1 approach is that ittends to provide more reliable estimates of typical 5-year or longer recurrences in areas with similarprecipitation climates. In the case of the 83-yearrecord in the present Illinois study, there are 41independent 2-year events at a precipitation station.However, this reduces to 16, 8, 4, and 2 independentsamples for recurrences of 5, 10, 20, and 40 years,respectively. Thus, rainfall amounts for the longerrecurrence intervals are subject to more samplingerror, and beyond 20- to 25-year frequencies theybecome quite questionable. However, when severalstations are combined to obtain the longer recur-rence-interval values, rainfall amounts are estab-lished more reliably. For example, the nine stationsin the northwestern climatic section provided 36independent measurements for the 20-year eventand 18 values for the 40-year event.
As has been discussed in the Urbana example,relatively large differences can occur between thefrequency distributions of stations located a few milesapart in a relatively homogeneous region of precipi-tation climate. As indicated earlier, these differencesoccur even with records of relatively long length,such as the 83 years used in the present study.However, unless a significant climatic trend is inoperation, area1 average relations are more likely toremain nearly constant with time if enough stationsare included to obtain a reliable measure of themean and the dispersion about the mean. We believethis has been accomplished in the present study and
that the area1 method of establishing frequency rela-tions is preferable to fitting isohyets to point data.
Point Frequency DistributionsAppendix A provides frequency distributions for
each of the 61 stations used in the present Illinoisstudy. As with the area1 distributions, they includerain periods ranging from 5 minutes to 10 days andrecurrence intervals of 2 months to 100 years. Theseare provided for the benefit of the user who may needspecific information for a particular location, or whowishes to construct a detailed isohyetal pattern for aspecific region that is not covered adequately by thesectional curves or selected isohyetal maps presentedin this report. It is stressed, however, that the pointfrequency distributions should be used with cautionand should be compared with other nearby pointrelationships before the results are considered au-thentic. The reasons for this caution were discussedin the presentation of the area1 relationships.
Selected Iso hyetal MapsAs mentioned previously, certain isohyetal maps
are included in this report to satisfy hydrologic needsfor some applications in which isohyetal presenta-tions are considered preferable to our recommendeduse of sectional frequency curves. These maps areshown in figures 10 through 17, and show spatialdistributions for rain periods ranging from 1 to 72hours. For each rain period, which may include atotal or partial storm, maps for recurrence intervalsof 2 to 100 years are presented.
The isohyetal maps do not extend into northeast-ern Illinois. This is because the six-county area inthe cutoff region has been the subject of a specialstudy (Huff and Vogel, 1976) that employed addi-tional data from a raingage network in the Chicagourban area, plus data from other stations not used inthe present 61-station study because of their recordlengths. An updating of this six-county study is dis-cussed in Section 4 of this report.
Pattern FeaturesAs noted in the comparison of two 40-year periods
(Section 1), the isohyetal patterns show certain char-acteristics that are generally consistent for variousrain periods and recurrence intervals. These includea major high in extreme southern Illinois, which liesin a region of maximum thunderstorm frequency inthe state (Changnon, 1957). Topographic influencesfrom the Shawnee Hills may also affect the rainfalldistribution (Huff, Changnon, and Jones, 1975).
32

A second major high in the heavy rainfall distri-butions occurs in the extreme western part of thestate, which also lies in a region of relatively fre-quent thunderstorm occurrences in which most ofthe severe rain events breed. A low in the rainfallpattern extends along or in the vicinity of the IllinoisRiver valley from northeastern to southwestern Illi-nois. A high extends northeastward from the vicinityof St. Louis to the Joliet-Kankakee region in north-eastern Illinois and is nearly parallel to the IllinoisRiver low. A low is also present in the extreme north-eastern part of the state in the Waukegan-Marengoarea. Another weak low is evident in east central Illi-nois and in some cases extends into southeasternIllinois.
The details of the statewide frequency distribu-tions listed above are apparent only because of theexistence and judicious use of the 83-year recordfrom the many cooperative weather stations oper-ated largely by the National Weather Service.
The Waukegan low may be related to the influ-ence of Lake Michigan in dissipating or reducing theintensity of warm-season storms moving into thelake. However, Marengo, which is also in the north-eastern low, is too far west of Lake Michigan to besignificantly affected by it. This low is apparentlyrelated to climatic variations, possibly intensified bylake effects in the Waukegan area.
Map AnalysisThe maps in figures 10 through 17 were con-
structed by plotting rainfall amounts from each ofthe station frequency curves for the storm periodand recurrence interval being analyzed. A total of 48maps are included to cover the various storm periodsand recurrence intervals. As discussed previously,sampling variability between nearby stations cancause substantial differences in frequency values. Asa result, a considerable amount of subjectivity wasinvolved in preparing the isohyetal patterns. Effortswere made to obtain a realistic, relatively smooth,isohyetal pattern from consideration of both plotteddata and meteorological-climatological factors. Indoing so, values at some stations were arbitrarilylowered and others increased to avoid sharp, unreal-istic rainfall gradients between nearby stations.
The resulting maps in figures 10 through 17 re-flect findings from the 1901-1983 data sample ad-justed for climatic trend. Variations from these dis-tribution patterns may occur in the future. However,in general, the comparison of the two 40-year peri-ods, 1901-1940 and 1941-1980 (Section 1) indicatesthat most features of the patterns have persistedthroughout the 83-year period.
Comparison between Values in Table 13and Those in Technical Paper 40
The mean sectional frequency distributions sum-marized in table 13 were compared with those inU.S. Weather Bureau Technical Paper 40 (Hershfield,1961), which has had widespread use throughout theUnited States. In general, the values in table 13 arevery similar to those in Technical Paper 40 for recur-rence intervals of 10 years and less. For longer recur-rence intervals, table 13 shows larger values thanTechnical Paper 40, and the differences become largerwith increasing recurrence interval.
Table 15 (see page 50) illustrates the differencesbetween the two sets of frequency values for 24-hourmaximum rainfall amounts at selected observationalstations in Illinois. The Water Survey values arethose for the climatic sections in which the stationsare located. The values for Technical Paper 40 wereinterpolated from isohyetal maps for 24-hour rain-fall.
The differences are most pronounced in the north-eastern section (figure 7), where the climatic trendstudy (Section 1 of this report) showed the maximumincrease in the frequency distributions of heavy rain-storms in the 1941-1980 period. Technical Paper 40,published in 1961, did not include some of the ex-tremely heavy rain events that occurred in recentyears, several of which affected the Chicago-Aurora-Joliet-Kankakee area. Note the Chicago values intable 15 that reflect these occurrences.
We believe that our method of fully using datafrom the cooperative observer network and employ-ing the area1 analysis technique (sectional meanfrequency distributions) provides a better estimateof the more extreme rainfall events (25-year to 100-year recurrences) than the technique used in Techni-cal Paper 40, which placed major emphasis on first-order station data and isohyetal analysis of thesedata.
Six-County Frequency RelationsAs mentioned previously, data from a 1976 study
of the frequency distribution of heavy rainfall in theChicago urban area and in the surrounding six-countyarea (Huff and Vogel, 1976) were updated. Basically,this was done by relating frequency relations de-rived from 1901-1983 data (present study) and from1949-1974 data used in the 1976 study. This wasdone for five long-term stations, including the offi-cial first-order stations of the National Weather Serv-ice. The specific methodology used and the updatedrelations are presented for the urban area and thesix-county area in Section 4.
33

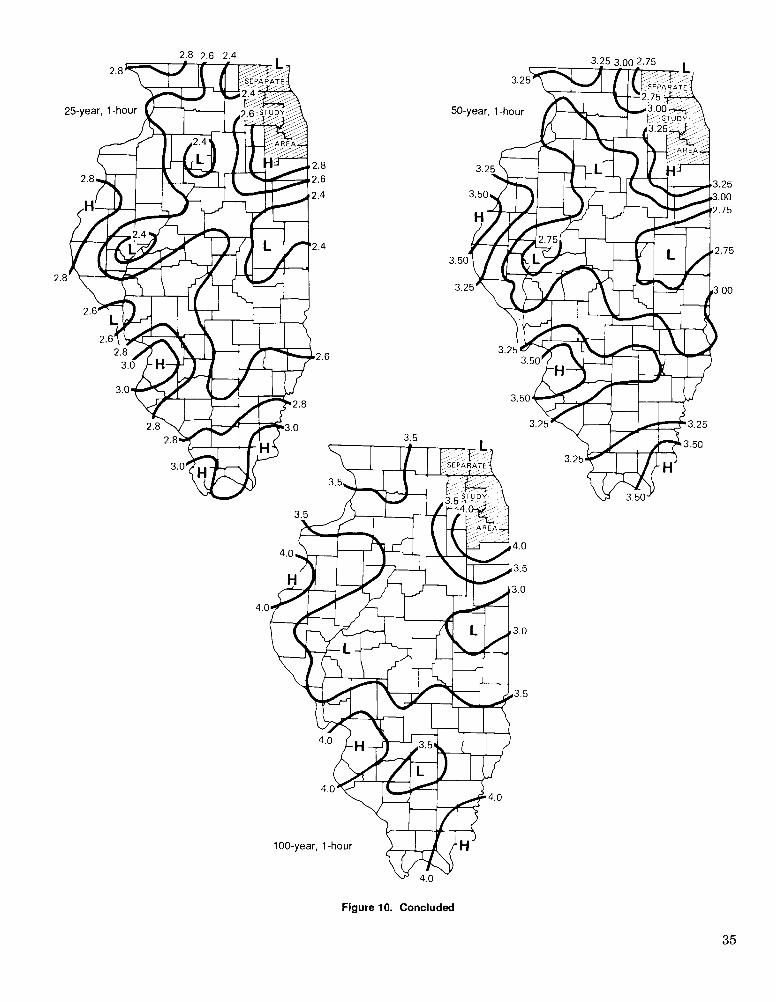


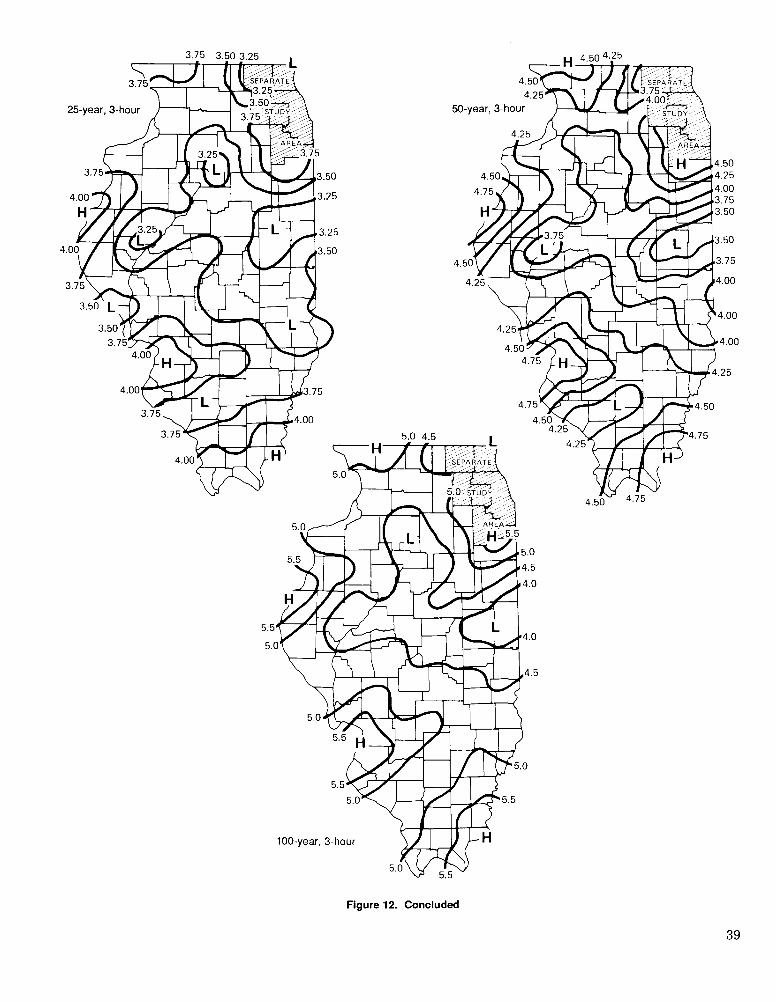


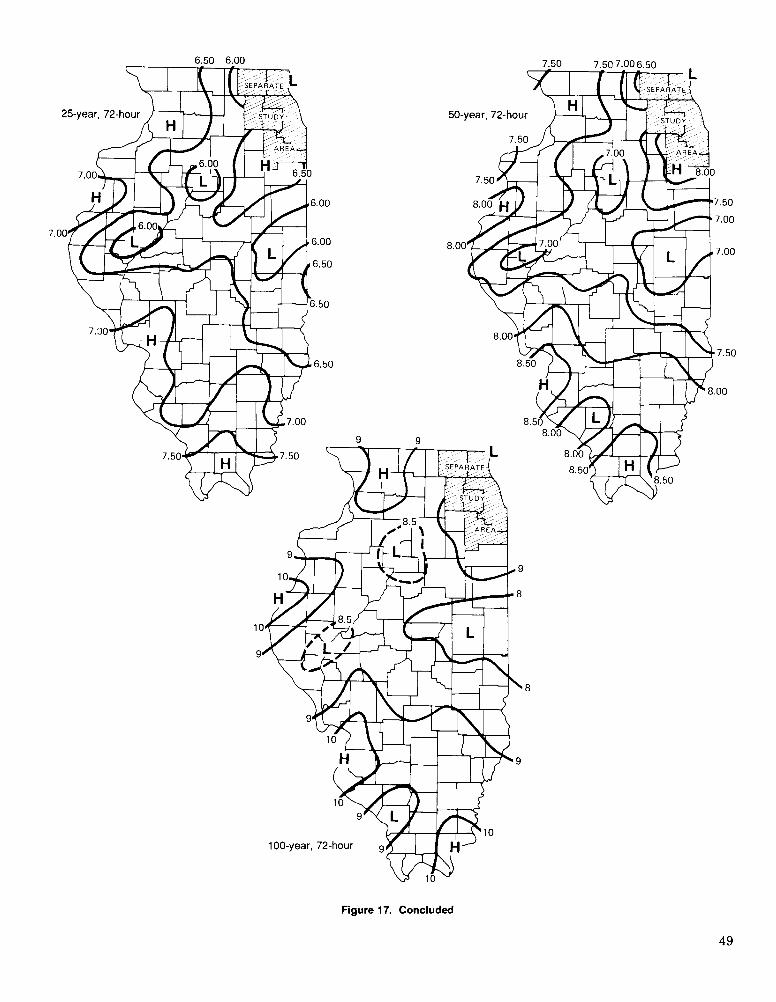

Table 15. Increases/Decreases in New 24-Hour Maximum Rainfall Values in Illinoisfrom Those in U.S. Weather Bureau Technical Paper 40 (Hershfield, 1961)
Differences (in inches and percentages) for given recurrence intervals
ChicagoMolinePeoriaSpringfieldQuincyUrbanaSt. LouisCairo
Mean
2 yrsin. %
0.1 30.0 0
-0.1 30.1 30.2 60.0 00.3 90.0 Q
3
5 yrsin. %
10 yrsin. %
0.3 8 0.5 110.0 0 0.1 0
-0.2 6 0.0 0-0.2 6 0.1 20.1 2 0.2 4
-0.2 7 -0.1 2-0.3 8 -0.1 20.1 2 0.1 2
5 3
25 yrs 50 yrs 100 yrsin. % in. % in. %
0.9 16 1.3 20 1.9 2 50.4 7 0.7 11 1.1 150.1 2 0.3 5 0.5 70.3 5 0.6 9 0.9 120.6 10 0.8 11 1.3 16
-0.1 2 0.2 3 0.4 60.4 7 0.8 11 1.3 160.4 6 0.6 JJ 1 . 3 fi
7 10 14
Median 3 6 2 6 11 15
4. URBAN EFFECTS ON FREQUENCY DISTRIBUTIONS
In view of the results of the substantial past Wa-ter Survey research on the effects of urban environ-ments on the incidence and magnitudes of heavyrainstorms, it was considered necessary to assessand incorporate (if feasible) urban effects on the fre-quency distributions of heavy rainfall in Illinois. Twomajor urban areas are of sufficient size to cause localeffects: the Chicago urban area, and a region lyingeast and northeast of the St. Louis metropolitanarea. Other urban areas within or adjacent to thestate are not considered large enough to affect theheavy rainfall distributions significantly.
Several earlier studies revealed evidence of localshifts of heavy rain events in the Chicago area.Detweiller and Changnon (1976) found an upwardtrend in the Chicago (and St. Louis) maximum an-nual daily rain values; Changnon (1980a) found thatincreased urban flooding in Chicago was related tolocal increases in heavy rain events; and Changnon(1980b) showed how storms were enhanced in urbanareas. Huff and Changnon (1973) demonstrated thatboth Chicago and St. Louis have experienced sizablelocal increases in summer thunderstorms and raindays.
Huff and Changnon (1987) revealed that urban-related increases in heavy rains occurred in the St.Louis area during 1971-1975, when intensive fieldstudies (METROMEX Project, Changnon et al., 1977)were carried out in that region. Thus, considerableevidence exists, in both cities and their environs, of
50
localized increases in heavy rain events on the orderof 10 to 25% in both incidence and magnitude.
The Chicago EffectHuff and Vogel (1976) made a detailed study of
the heavy rainfall distribution within the Chicagourban area and the surrounding six-county area,using an urban network of 16 recording raingages onan area of approximately 430 square miles duringthe 1949-1974 period (figure 18). These gages wereoperated by the Metropolitan Sanitary District ofGreater Chicago, the city of Chicago, and the Na-tional Weather Service. Frequency distributions ofpoint rainfall were derived for storm rainfall periodsof 5 minutes to 72 hours and for recurrence intervalsof 6 months to 50 years.
Results of this study indicated a central urbanhigh in the isohyetal patterns for a given stormduration and recurrence interval. This high appearedto consist of two centers, one over the north centralportion of the urban area and the other over theextreme southern part. The pattern is illustrated infigure 19 for 12-hour to 72-hour storm periods and arecurrence interval of 5 years.
However, even more pronounced highs in the heavyrainfall distributions were indicated 1) in the Auroraregion, about 23 miles west of the western boundaryof the urban area; and 2) at Joliet, about 13 miles