32-bit microcontroller mb91460 swb monitor debugger - fujitsu · there are some little...
TRANSCRIPT

Fujitsu Microelectronics Europe Application Note
MCU-AN-300028-E-V13
FR FAMILY 32-BIT MICROCONTROLLER
MB91460
SWB MONITOR DEBUGGER
APPLICATION NOTE

SWB MONITOR DEBUGGER Revision History
Revision History
Date Issue
2006-03-17 UMa First draft
2006-03-28 UMa Added Flash erase indication
2006-04-18 UMa Added settings for watchdog and LEDs
2006-06-05 UMa Removed Loader from MonDeb for ext. Flash and ext. RAM. FR Flash Programmer supports direct programming on ext. bus interface.
2006-07-14 OGl Additional information’s regarding programming of appl. code/data into external Flash memory and MonDeb for ext. Flash and ext. RAM
This document contains 23 pages.
MCU-AN-300028-E-V13 - 2 - © Fujitsu Microelectronics Europe GmbH

SWB MONITOR DEBUGGER Warranty and Disclaimer
Warranty and Disclaimer To the maximum extent permitted by applicable law, Fujitsu Microelectronics Europe GmbH restricts its warranties and its liability for all products delivered free of charge (e.g. software include or header files, application examples, target boards, evaluation boards, engineering samples of IC’s etc.), its performance and any consequential damages, on the use of the Product in accordance with (i) the terms of the License Agreement and the Sale and Purchase Agreement under which agreements the Product has been delivered, (ii) the technical descriptions and (iii) all accompanying written materials. In addition, to the maximum extent permitted by applicable law, Fujitsu Microelectronics Europe GmbH disclaims all warranties and liabilities for the performance of the Product and any consequential damages in cases of unauthorised decompiling and/or reverse engineering and/or disassembling. Note, all these products are intended and must only be used in an evaluation laboratory environment.
1. Fujitsu Microelectronics Europe GmbH warrants that the Product will perform substantially in accordance with the accompanying written materials for a period of 90 days form the date of receipt by the customer. Concerning the hardware components of the Product, Fujitsu Microelectronics Europe GmbH warrants that the Product will be free from defects in material and workmanship under use and service as specified in the accompanying written materials for a duration of 1 year from the date of receipt by the customer.
2. Should a Product turn out to be defect, Fujitsu Microelectronics Europe GmbH´s entire liability and the customer´s exclusive remedy shall be, at Fujitsu Microelectronics Europe GmbH´s sole discretion, either return of the purchase price and the license fee, or replacement of the Product or parts thereof, if the Product is returned to Fujitsu Microelectronics Europe GmbH in original packing and without further defects resulting from the customer´s use or the transport. However, this warranty is excluded if the defect has resulted from an accident not attributable to Fujitsu Microelectronics Europe GmbH, or abuse or misapplication attributable to the customer or any other third party not relating to Fujitsu Microelectronics Europe GmbH.
3. To the maximum extent permitted by applicable law Fujitsu Microelectronics Europe GmbH disclaims all other warranties, whether expressed or implied, in particular, but not limited to, warranties of merchantability and fitness for a particular purpose for which the Product is not designated.
4. To the maximum extent permitted by applicable law, Fujitsu Microelectronics Europe GmbH´s and its suppliers´ liability is restricted to intention and gross negligence.
NO LIABILITY FOR CONSEQUENTIAL DAMAGES
To the maximum extent permitted by applicable law, in no event shall Fujitsu Microelectronics Europe GmbH and its suppliers be liable for any damages whatsoever (including but without limitation, consequential and/or indirect damages for personal injury, assets of substantial value, loss of profits, interruption of business operation, loss of information, or any other monetary or pecuniary loss) arising from the use of the Product.
Should one of the above stipulations be or become invalid and/or unenforceable, the remaining stipulations shall stay in full effect
© Fujitsu Microelectronics Europe GmbH - 3 - MCU-AN-300028-E-V13

SWB MONITOR DEBUGGER Contents
Contents
REVISION HISTORY.............................................................................................................. 2
WARRANTY AND DISCLAIMER........................................................................................... 3
CONTENTS ............................................................................................................................ 4
1 INTRODUCTION................................................................................................................ 6
2 GETTING STARTED WITH THE SWB MONITOR DEBUGGER...................................... 8 2.1 SWB Monitor Debugger with external Flash and external RAM ............................... 8
2.1.1 Programming............................................................................................... 8 2.1.2 Starting the SWB Monitor Debugger........................................................... 9 2.1.3 Default Linkage Map ................................................................................. 10
2.2 SWB Monitor Debugger with external RAM............................................................ 11 2.2.1 Programming............................................................................................. 11 2.2.2 Starting the SWB Monitor Debugger......................................................... 11 2.2.3 Default Linkage Map ................................................................................. 13
3 THE SWB MONITOR DEBUGGER ................................................................................. 14 3.1 Basic Debugger Features ....................................................................................... 15 3.2 Advanced Softune Workbench SWB Monitor Debugger Features ......................... 16
4 CUSTOMIZE THE SWB MONITOR DEBUGGER........................................................... 18 4.1 Adaptation of the USART Communication Speed .................................................. 18 4.2 Adaptation of Clock Speeds.................................................................................... 18 4.3 Changing the Port for the Status Indication (LEDs) ................................................ 18 4.4 Disable Features..................................................................................................... 19
4.4.1 Disable the Status Indication..................................................................... 19 4.4.2 Disable the Stop Execution Button............................................................ 19 4.4.3 Disable the Reset of the Watchdog........................................................... 19
5 START-UP OF THE APPLICATION WITH THE SWB MONITOR DEBUGGER ............ 21
6 MDE AND APPL. DATA/CODE IN EXTERNAL FLASH................................................. 24 6.1 External Flash memory mapping (MDE Code & Appl. Code/Data)......................... 24 6.2 Programming........................................................................................................... 25
6.2.1 Step 1 - Programming MDE code ............................................................. 25 6.2.2 Step 2 - Programming application code .................................................... 26
MCU-AN-300028-E-V13 - 4 - © Fujitsu Microelectronics Europe GmbH

SWB MONITOR DEBUGGER Contents
6.2.3 Step 3 - Reprogramming application code................................................ 27 6.2.3.1 CASE A – Reprogramming ....................................................... 28 6.2.3.2 CASE B – Reprogramming ....................................................... 29 6.2.3.3 CASE C – Reprogramming....................................................... 29
7 APPENDIX ....................................................................................................................... 30 7.1 Figures .................................................................................................................... 30 7.2 Abbreviations .......................................................................................................... 30 7.3 Related Documents................................................................................................. 30
© Fujitsu Microelectronics Europe GmbH - 5 - MCU-AN-300028-E-V13

SWB MONITOR DEBUGGER Chapter 1 Introduction
1 Introduction Whenever you have created a valid load module successfully, you can switch from the development mode to the debugging mode of Softune Workbench.
Basically, there are 3 types of debugging systems supported:
1. The software simulator: The simulator is part of the Softune Workbench and does not require any target hardware. The simulator will cover the FR-core features, but no peripheral functions. Therefore, you can use the simulator to verify program flow, check for dynamic errors, look at the generated assembler code, etc.
2. The Softune Workbench (SWB) Monitor Debugger: This debugger type requires an evaluation board like the “SK-91F467-208PFV” connected to one of the COM-ports of your PC. Explanations in this manual refer to the SWB Monitor Debugger only.
3. The emulator debugger: The in-circuit-emulator (ICE) is a system, which allows a connection to any target system using a probe-cable. The appropriate system for the MB91460 series is the MB2198-01 system. More information about this system can be found on the Fujitsu website.
Which debugger is used for the actual project can be configured in the project tree as shown below or in the “Project – Setup Project – Debug” menu. The current selection is blue marked (icon):
There are two linkage options of SWB Monitor Debugger available.
1) The SWB Monitor Debugger is located in an external flash on chip select (CS) 0. The application code runs in an external RAM on CS 1. For this option it is not necessary to re-link the application for debugging.
2) The SWB Monitor Debugger is located in the internal flash. The application code runs in an external RAM on CS 1. For this option it is necessary to re-link the application for debugging.
Both options can be adapted to customer necessities.
MCU-AN-300028-E-V13 - 6 - © Fujitsu Microelectronics Europe GmbH

SWB MONITOR DEBUGGER Chapter 1 Introduction
There are some little restrictions, when using the SWB Monitor Debugger:
1) Due to the fact that the application code is located in the external RAM, the execution speed of the code is slower, because of the slower external bus access.
2) Depending on the used linkage option of the SWB Monitor Debugger, CS 1 or CS 0 and CS 1 are required for the external memory. The affected CS has to be switched off in the start-up of the application. (#set CS0 OFF, #set CS1 OFF)
3) Since some settings for the SWB Monitor Debugger during start-up are required, the start-up file cannot be debugged. After starting the SWB Monitor Debugger, the program execution stops at main(). Furthermore, the clock settings of the application start-up are omitted. For the desired clock settings the SWB Monitor Debugger has to be adapted. For further information, please see chapter 4 and chapter 5.
4) To indicate the current state of the SWB Monitor Debugger a certain port is used. This feature can also be disabled to give the port free for the application. For further information please refer to chapter 4.
5) To stop the execution of the program the external interrupt INT0 is used. This feature can also be disabled to give the port free for the application. The “abort” button of the Softune Workbench is not fully supported. For further information please refer to chapter 3 and 4.
© Fujitsu Microelectronics Europe GmbH - 7 - MCU-AN-300028-E-V13

SWB MONITOR DEBUGGER Chapter 2 Getting Started with the SWB Monitor Debugger
2 Getting Started with the SWB Monitor Debugger
2.1 SWB Monitor Debugger with external Flash and external RAM
2.1.1 Programming The following procedure describes the installation process for the SK-91F467D-208PFV and the MB91F467D. The procedure applies analogously for other boards and devices.
1) The CPU mode selection must be set to internal reset vector mode by setting the mode pins[0:2] to VSS-VSS-VSS (e.g. SK-91F467D-208PFV: DIP switch S5 to (Off, Off, Off, Off))
2) Program the monitor-programmer “91460_mondeb_uart4_extbus_flash_sram” into the external Flash, e.g. with the help of the FME Flash Programmer V3.12 or later. Please see also the application note mcu-an-300012-e-mb91460_flash_programming.pdf. Please use the automatic mode. The settings for CS0 should be ASR0: 0100, ACR0: 8822, AWR0: 3378. NOTE: In case of your application uses external Flash, please refer to chapter 6!
3) Please, power-off the evaluation board.
4) The CPU Mode selection must be set to external reset vector mode by setting the mode pins[0:2] to Vcc-VSS-VSS (e.g. SK-91F467D-208PFV: DIP switch S5 to (On, Off, Off, Off))
5) The correct start-up of the SWB Monitor Debugger is indicated by D2, D4 and D8.
Figure 2-1: Correct Start-Up of the SWB Monitor Debugger
6) The SWB Monitor Debugger is now ready to use.
MCU-AN-300028-E-V13 - 8 - © Fujitsu Microelectronics Europe GmbH

SWB MONITOR DEBUGGER Chapter 2 Getting Started with the SWB Monitor Debugger
2.1.2 Starting the SWB Monitor Debugger After software development the SWB Monitor Debugger can be used for debugging. For further information regarding “getting started with the Softune Workbench”, please refer to the application mode “mcu-an-391027-e-mb2198_getting_started.pdf”.
1) Select the active configuration STANDALONE. In this configuration the application is linked for the available memory on flash-device, e.g. MB91F467DA. Build the application.
Figure 2-2: Start Softune Workbench SWB Monitor Debugger with external flash and SRAM
2) To start the SWB Monitor Debugger, double-click the entry “Mondeb_57K6_com1.sup” for communication via COM1 (57K6 baud, 8N1) or “Mondeb_57K6_com2.sup” for communication via COM2 (57K6 baud, 8N1).
3) Since some settings for the SWB Monitor Debugger during start-up are required, the start-up file can not be debugged. The settings are done with the help of procedure files. After starting the SWB Monitor Debugger, the program execution stops at main(). For further information, please see chapter 5.
If you wish to change the COM-port, please right-click on the entry and select change. Please refer to chapter 4, too.
© Fujitsu Microelectronics Europe GmbH - 9 - MCU-AN-300028-E-V13
SWB MONITOR DEBUGGER Chapter 2 Getting Started with the SWB Monitor Debugger
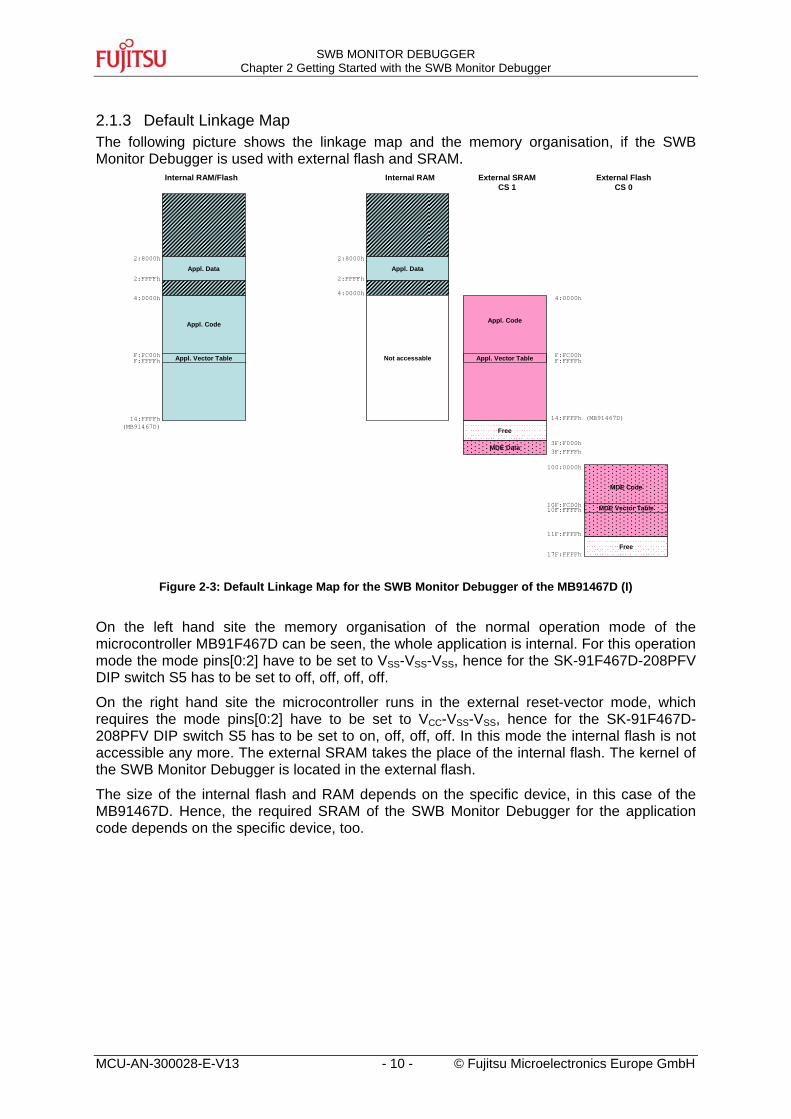
2.1.3 Default Linkage Map The following picture shows the linkage map and the memory organisation, if the SWB Monitor Debugger is used with external flash and SRAM.
Appl. Code
Appl. Data2:FFFFh2:FFFFh
2:8000h
4:0000h4:0000h
14:FFFFh(MB91467D)
Appl. Data2:8000h
Appl. Vector TableF:FC00hF:FFFFh
Appl. Code
MDE Code
MDE Data
4:0000h
3F:F000h3F:FFFFh
100:0000h
11F:FFFFh
MDE Vector Table10F:FFFFh
Appl. Vector Table F:FC00hF:FFFFh
10F:FC00h
Internal RAM External SRAMCS 1
Internal RAM/Flash External FlashCS 0
14:FFFFh (MB91467D)
Free
17F:FFFFh
Not accessable
Free
Figure 2-3: Default Linkage Map for the SWB Monitor Debugger of the MB91467D (I)
On the left hand site the memory organisation of the normal operation mode of the microcontroller MB91F467D can be seen, the whole application is internal. For this operation mode the mode pins[0:2] have to be set to VSS-VSS-VSS, hence for the SK-91F467D-208PFV DIP switch S5 has to be set to off, off, off, off.
On the right hand site the microcontroller runs in the external reset-vector mode, which requires the mode pins[0:2] have to be set to VCC-VSS-VSS, hence for the SK-91F467D-208PFV DIP switch S5 has to be set to on, off, off, off. In this mode the internal flash is not accessible any more. The external SRAM takes the place of the internal flash. The kernel of the SWB Monitor Debugger is located in the external flash.
The size of the internal flash and RAM depends on the specific device, in this case of the MB91467D. Hence, the required SRAM of the SWB Monitor Debugger for the application code depends on the specific device, too.
MCU-AN-300028-E-V13 - 10 - © Fujitsu Microelectronics Europe GmbH

SWB MONITOR DEBUGGER Chapter 2 Getting Started with the SWB Monitor Debugger
2.2 SWB Monitor Debugger with external RAM
2.2.1 Programming The following procedure describes the installation process for the SK-91F467D-208PFV and the MB91F467D.
1) The CPU Mode selection must be set to internal reset vector mode by setting the mode pins[0:2] to VSS-VSS-VSS (e.g. SK-91F467D-208PFV: DIP switch S5 to (Off, Off, Off, Off))
2) Program the Monitor-Programmer into the internal Flash, e.g. with the help of the FME Flash Programmer V3.11 or later. Please see also the application note mcu-an-300012-e-mb91460_flash_programming.pdf.
3) Reset the microcontroller by pressing the reset-button (e.g. SK-91F467D-208PFV: SW1) or power-off and -on the microcontroller.
4) The correct start-up of the SWB Monitor Debugger is indicated by D2 and D4
Figure 2-4: Correct Start-Up of the SWB Monitor Debugger
5) The SWB Monitor Debugger is now ready for use.
2.2.2 Starting the SWB Monitor Debugger After software development the SWB Monitor Debugger can be used for debugging. For further information regarding “getting started with the Softune Workbench”, please refer to the Application mode “mcu-an-391027-e-mb2198_getting_started.pdf”.
1) Select the active configuration MONDEB_INTERNAL. With this selection the project is linked to be used with the SWB Monitor Debugger. Corresponding linker settings are done for the memory map in order to avoid overwriting of the sections which are used by the SWB Monitor Debugger. The code is linked in this configuration for external SRAM; otherwise it is not possible to debug code with the Softune Workbench SWB Monitor Debugger. Since the linkage map is different from the linkage map of the configuration STANDALONE, a rebuild is required.
© Fujitsu Microelectronics Europe GmbH - 11 - MCU-AN-300028-E-V13

SWB MONITOR DEBUGGER Chapter 2 Getting Started with the SWB Monitor Debugger
Figure 2-5: Start Softune Workbench SWB Monitor Debugger with external SRAM
2) To start the SWB Monitor Debugger, double-click the entry “Mondeb_57K6_com1.sup” for communication via COM1 (57K6 baud, 8N1) or “Mondeb_57K6_com2.sup” for communication via COM2 (57K6 baud, 8N1).
3) Since some settings for the SWB Monitor Debugger during start-up are required, the start-up file cannot be debugged. The settings are done with the help of procedure files. After starting the SWB Monitor Debugger, the program execution stops at main(). For further information, please see chapter 5.
If you wish to change the COM-port, please right-click on the entry and select change. Please refer to chapter 4, too.
After the project is built and debugged successfully the application has to be re-build in the active configuration STANDALONE to get the application, linked for the flash device.
MCU-AN-300028-E-V13 - 12 - © Fujitsu Microelectronics Europe GmbH

SWB MONITOR DEBUGGER Chapter 2 Getting Started with the SWB Monitor Debugger
2.2.3 Default Linkage Map The following picture shows the linkage map and the memory organisation if the SWB Monitor Debugger is used with external SRAM only.
Internal Flash
Appl. Code
2:FFFFh2:9000h
4:0000h
84:0000h
94:FFFFh (MB91467D)
Vector Table Appl. xx:xxxxh
Appl. Data
2:8000h
MDE Vector Table
14:FFFFh(MB91467D)
MDE Kernal
F:FFFFhF:FC00h
F:0000h
MDE Data
Internal RAM/Flash External SRAMCS 1
Appl. Code
Appl. Data2:FFFFh
2:8000h
4:0000h
14:FFFFh(MB91467D)
Appl. Vector TableF:FC00hF:FFFFh
Internal RAM/Flash
80:0000h
Free
Free
Free
Free
11F:FFFFh
Figure 2-6: Default Linkage Map for the SWB Monitor Debugger of the MB91467D (II)
On the left hand site the memory organisation of the normal operation mode of the microcontroller MB91F467D can be seen, the whole application is internal. For this operation mode the mode pins[0:2] have to be set to VSS-VSS-VSS, hence for the SK-91F467D-208PFV DIP switch S5 has to be set to off, off, off, off.
On the right hand site the microcontroller runs in the normal operation mode of the microcontroller, too. The code of the application is linked to the external SRAM. The kernel of the SWB Monitor Debugger is located in the internal FLASH.
The size of the internal flash and RAM depends on the specific device, in this case of the MB91467D. Hence, the required SRAM of the SWB Monitor Debugger for the application code depends on the specific device, too. Since the SWB Monitor Debugger uses the internal RAM, too, the linkage of the RAM section has to be adapted for different devices.
© Fujitsu Microelectronics Europe GmbH - 13 - MCU-AN-300028-E-V13

SWB MONITOR DEBUGGER Chapter 3 The SWB Monitor Debugger
3 The SWB Monitor Debugger After starting the debugger, the source window will be opened which contains locate-arrows for each (possible) source-line, the original source-code,
Figure 3-1: SWB Debugging Window
Breakpoint-indicators and the assembler code (in “mixed view”). The current program position will be indicated by a yellow line. Use right-click within the source window to configure the view (add/remove control characters, view mixed source code, breakpoint …)
Note: You can choose “mixed view” from the context menu (right-click) to display source and assembly code at the same time. The command “go to current” will take you to the active code line!
MCU-AN-300028-E-V13 - 14 - © Fujitsu Microelectronics Europe GmbH

SWB MONITOR DEBUGGER Chapter 3 The SWB Monitor Debugger
3.1 Basic Debugger Features In the following the basic features of the SWB Monitor Debugger are described.
GO: Executes the program continuously from the memory location pointed to by the current program counter (PC) until a termination factor occurs.
STEP IN: Executes the program stepwise according to the listing in the source window (steps in C- or ASM). Note that interrupts are disabled during step execution!
STEP OVER: Executes the program stepwise except call-instructions (which will be executed until return). Interrupts are not disabled during a continuous CALL...RETURN execution.
STEP OUT: Executes the program continuously to the parent function (until RETURN). Interrupts are enabled. Note, that debug information is required for this function.
EXECUTE UNTIL CURSOR: Automatically sets a breakpoint at the actual cursor position and executes continuously until this breakpoint, which will be deleted
afterwards.
Each valid code line in a debugger window automatically has a locator (blue arrow) and a breakpoint-option (circle). Note that some C-lines may not be displayed with locators and breakpoints, because the compiler has created “optimized” assembler-code. Select “mixed view” in order to check the compiler output.
Instead of single-steps, you may also use the arrows to directly execute your program until a certain line of your source-code:
© Fujitsu Microelectronics Europe GmbH - 15 - MCU-AN-300028-E-V13

SWB MONITOR DEBUGGER Chapter 3 The SWB Monitor Debugger
ABORT: Forcibly terminates execution. This button is not fully supported by the SWB Monitor Debugger and may cause malfunction if used to abort “continuous operation” of the MCU.
This command button can only be used to abort single code line operations Example: for(k=DELAY_CONSTANT; k>0; k--); Use the button INT0 on the “SK-91F467-xxx” for ABORT function.
To ABORT continuous execution, you have to use the INT0 button on the starter-kit.
3.2 Advanced Softune Workbench SWB Monitor Debugger Features In the following advanced features of the SWB Monitor Debugger are described.
TOGGLE BREAKPOINT: Sets or deletes breakpoint at the current source line:
To set or delete a breakpoint, click the circles at the beginning of a source-line.
A indicates an active breakpoint. Hit “Run continuously” to execute code until reaching this line. A list of all breakpoints can be found under the “Debug – Breakpoint” menu. 255 Software-Breakpoints (using TRAP replacement) are possible.
Note: To set breakpoints at positions which are currently not visible (e.g. because the source window of that module is not open), you can also enter a symbolic label directly in the “Breakpoint” menu. Example: Enter “main” in the address-field and confirm. The new breakpoint will automatically be assigned to the address of the “main()”-function.
REGISTER WINDOW: Displays the CPU-register window. Updated registers appear
in red. Setup in context menu defines which Registers should be displayed.
WATCH WINDOW: Displays the current variables to „watch“. Double-click on any
variable in your code then specify watch in context menu to add to watch window. All listed variables in a watch window can be displayed in any number format. Use Edit to directly change the contents.
MEMORY WINDOW: Displays memory areas in various formats defined by Setup (context menu). Changing of address/data is possible when debugger is not executing.
The memory window can be very helpful to check the registers or the frame memory of the connected graphic controller!
MCU-AN-300028-E-V13 - 16 - © Fujitsu Microelectronics Europe GmbH

SWB MONITOR DEBUGGER Chapter 3 The SWB Monitor Debugger
DISASSEMBLER: Disassembles the content of the code memory beginning from actual PC position and displays the result in a separate window. Individual
assembler-lines can be changed using the „inline assemble“-function.
DEBUG - STACK: Displays the current stack contents in terms of function calls. Parameters, if any, are displayed in brackets.
DEBUG - VECTOR: Reads out and displays the actual interrupt-vector table. Use the “jump” function to display any code areas pointed to by an interrupt vector (e.g. interrupt service routines used in your program).
DEBUG - CALL: This function can be used to “call” any routine defined in your code when the debugger is on hold.
DEBUG – LOAD TARGET FILE: Starts a new download of the current load module (ABS file). Usually this function will be executed automatically after starting the debugger (defined in debug settings; see „Project-Setup-Debug“). However, this function can be useful to re-initialize the debugger for the current debug session. VIEW - SYMBOL: This function displays all (global) symbols of the current project. Information about the type (char, integer etc.) and the location (address in RAM or register) can be shown using „detail“.
VIEW - LOCAL: Similar to View-Symbol, but only local variables of the current function are shown. VIEW - COMMAND: From this window, the debugger can be controlled using a command line input. All GUI functions are available as individual commands.
In order to document or save debugging details such as memory contents, all outputs fed to the command console can be written to a file (“logging”).
A whole “program” of commands (incl. flow control) can be written to a PRC-file and executed. Procedure-files are simple text-files with the extension “.PRC” and can be created by the Softune Workbench editor or any other text editor. To execute a procedure-file, use the command window menu or the “file-open” menu during debugging.
Note: Procedure-files can be very helpful to configure the debug-environment automatically, perform automated tests (e.g. when a new C-module has to be tested) or to enhance basic emulator functions such as breakpoints. Using a procedure file, breakpoints can be defined dynamically depending on program conditions. See the “Command Reference Manual” (on-line help) for detailed information about the available command and parameter syntax. Some procedure files exist already included in the example project directory.
© Fujitsu Microelectronics Europe GmbH - 17 - MCU-AN-300028-E-V13

SWB MONITOR DEBUGGER Chapter 4 Customize the SWB Monitor Debugger
4 Customize the SWB Monitor Debugger The following sections shows, how the SWB Monitor Debugger can be adapted to the customers need in some cases.
4.1 Adaptation of the USART Communication Speed The following explains how to change the communication speed of the USART.
1) Open the workspace of the SWB Monitor Debugger, e.g. of the sample “91460_mondeb_uart4_extbus_flash_sram” for the SWB Monitor Debugger with external flash and SRAM.
2) Open the file “settings.h”.
3) Change the value of UART4ReloadValue to the desired value.
4) Rebuild the SWB Monitor Debugger.
5) Please follow the programming procedure described above.
6) Change the communication speed of the COM port, which is used for debugging, too, for example of “Mondeb_57K6_com1.sup” or set-up a new debug-setting.
4.2 Adaptation of Clock Speeds Since the clock settings of the application during start-up are omitted when debugging with the SWB Monitor Debugger, the desired clock settings should/can be made during start-up off the SWB Monitor Debugger. Therefore the settings for the SWB Monitor Debugger have to be changed.
1) Open the workspace of the SWB Monitor Debugger, e.g. of the sample “91460_mondeb_uart4_extbus_flash_sram” for the SWB Monitor Debugger with external flash and SRAM.
2) Open the file “settings.h”.
3) Set the desired clock settings of the application.
4) Perhaps it is necessary to adapt also the UART4ReloadValue, due to another resource clock.
5) Perhaps other bus wait states are required, too.
6) Rebuild the SWB Monitor Debugger.
7) Please follow the programming procedure described above.
4.3 Changing the Port for the Status Indication (LEDs) Depending on the evaluation board, different ports are used to indicate the status of the SWB Monitor Debugger. For example the SK-91467D-208PFV uses port 25 (0x0019), which is the default setting and the SK-91460-91467D-208PFV uses port 26 (0x001A). To change the port, please follow this procedure.
1) Open the workspace of the SWB Monitor Debugger, e.g. of the sample “91460_mondeb_uart4_extbus_flash_sram” for the SWB Monitor Debugger with external flash and SRAM.
2) Open the file “settings.h”.
3) Set the item “LED_PDR” to the address of the port data register of the desired port. Please keep in mind to use the hexadecimal number, e. g. for port 25 the 0x0019.
MCU-AN-300028-E-V13 - 18 - © Fujitsu Microelectronics Europe GmbH

SWB MONITOR DEBUGGER Chapter 4 Customize the SWB Monitor Debugger
4) Rebuild the SWB Monitor Debugger.
5) Please follow the programming procedure described above.
It is also possible to disable the status indication, please see section 4.4.1 for further information.
4.4 Disable Features It is possible to disable some features of the SWB Monitor Debugger to give those resources free for the application.
4.4.1 Disable the Status Indication The SWB Monitor Debugger uses of the MB91F467D the port 25 to indicate its state. This function can be disabled to give the port free for the application.
1) Open the workspace of the SWB Monitor Debugger, e.g. of the sample “91460_mondeb_uart4_extbus_flash_sram” for the SWB Monitor Debugger with external flash and SRAM.
2) Open the file “settings.h”.
3) Set the item “LEDS” to “OFF”.
4) Rebuild the SWB Monitor Debugger.
5) Please follow the programming procedure described above.
4.4.2 Disable the Stop Execution Button The SWB Monitor Debugger uses of the MB91F467D the resource INT0 to stop the execution of the application. This function can be disabled to give the INT0 free for the application. If this function is disabled, a running application can not be stop anymore; hence breakpoints have to be set.
1) Open the workspace of the SWB Monitor Debugger, e.g. of the sample 91460_mondeb_uart4_extbus_flash_sram for the SWB Monitor Debugger with external flash and SRAM.
2) Open the file “settings.h”.
3) Set the item “ABORT_IRQ0” to “OFF”.
4) Rebuild the SWB Monitor Debugger.
5) Please follow the programming procedure described above.
6) Open the procedure file “monitor_internal.prc” or “monitor.prc” and set the value “abortIRQ0” to “0”.
4.4.3 Disable the Reset of the Watchdog There are two watchdogs available in the MB91460 Series, a hardware watchdog, which starts directly after power-on and cannot be stop, and a watchdog, which must be started once. Both watchdogs are reset by the SWB Monitor Debugger. It is also possible to disable the feature to reset the watchdog, which must be started. By the way, normally there is no influence, when the watchdog is reset by the SWB Monitor Debugger; even it was not started by the application. To disable the reset of the watchdog, which must be started please follow this procedure. The reset of hardware watchdog can not be disabled.
1) Open the workspace of the SWB Monitor Debugger, e.g. of the sample 91460_mondeb_uart4_extbus_flash_sram for the SWB Monitor Debugger with external flash and SRAM.
© Fujitsu Microelectronics Europe GmbH - 19 - MCU-AN-300028-E-V13

SWB MONITOR DEBUGGER Chapter 4 Customize the SWB Monitor Debugger
2) Open the file “settings.h”.
3) Set the item “WatchdogReset” to “OFF”.
4) Rebuild the SWB Monitor Debugger.
5) Please follow the programming procedure described above.
Open the procedure file “monitor_internal.prc” or “monitor.prc” and set the value
MCU-AN-300028-E-V13 - 20 - © Fujitsu Microelectronics Europe GmbH

SWB MONITOR DEBUGGER Chapter 5 Start-up of the Application with the SWB Monitor Debugger
5 Start-up of the Application with the SWB Monitor Debugger After the download of the target-file, a procedure file is executed to provide the necessary settings for the SWB Monitor Debugger. Below the commands executed are listed.
1) There are two settings available to customize the procedure file. The variable abortIRQ0 indicates, if the INT0 is used to stop the program execution (1) or if it is not used (0). Furthermore, the table base register of the SWB Monitor Debugger has to be declared.
©
# THIS SAMPLE CODE IS PROVIDED AS IS AND IS SUBJECT TO ALTERATIONS. # FUJITSU MICROELECTRONICS ACCEPTS NO RESPONSIBILITY OR LIABILITY FOR ANY # ERRORS OR ELIGIBILITY FOR ANY PURPOSES. # (C) Fujitsu Microelectronics Europe GmbH
# Environment and memory manipulation after program upload
# Settings
SET VARIABLE abortIRQ0 = 1
SET VARIABLE intVectorMonitorDebugger = 10FFC00
2) The interrupts are disabled.
# Disable all Interrupts
SET REGISTER I = 0
2) The table base register is set to the vector table of the SWB Monitor Debugger. This is necessary to stop in the start-up file until the necessary vectors are copied to the vector table of the application.
# Set Table Base Register
SET REGISTER TBR = intVectorMonitorDebugger
3) The start-up file is executed until the mark “smd_tbr”. At this mark the table base register of the application is available in register 0. The register is saved in the variable “intVectorApplication”
# Run to smd_tbr and save TBR of Application
go ,Start91460\smd_tbr
SET VARIABLE intVectorApllication = %r0
Fujitsu Microelectronics Europe GmbH - 21 - MCU-AN-300028-E-V13

SWB MONITOR DEBUGGER Chapter 5 Start-up of the Application with the SWB Monitor Debugger
4) The relevant vector table entries of the monitor debugger are copied to the vector table of the application.
# Copy required vector table entries of monitor debugger in vector table of application
MOVE intVectorMonitorDebugger + 3C0..intVectorMonitorDebugger + 3FF, intVectorApllication + 3C0
5) If INT0 should be used to stop the program execution, the relevant settings, like to copy the vector table entry or setting the interrupt registers are done.
# Prepare Entries for INT0
IF %abortIRQ0 == 1
MOVE intVectorMonitorDebugger + 3C0..intVectorMonitorDebugger + 3C3, intVectorApllication + 3BC
SET MEMORY/BYTE 32 = 3
SET MEMORY/BYTE 30 = 0
SET MEMORY/BYTE 31 = 1
SET MEMORY/BYTE 440 = 10
SET REGISTER ILM = 1E
ENDIF
6) The register R4 is set to 0x8, which indicates a software reset, which results in that the clock settings are not changed.
# Setting indicates software reset, which leads to that the clock settings are not changed.
SET REGISTER R4 = 8
7) The table base register is set to the vector table of the application
# Set TBR to Vector table of application
SET REGISTER TBR = intVectorApllication
8) The start-up file is executed until the mark “smd_cs”. The CS for the external SRAM (and external Flash) is not reset.
# Run to smd_c and let the CS enabled
go ,Start91460\smd_cs
set register r2 = %r2|3
MCU-AN-300028-E-V13 - 22 - © Fujitsu Microelectronics Europe GmbH
SWB MONITOR DEBUGGER Chapter 5 Start-up of the Application with the SWB Monitor Debugger
9) Finally, the program runs to main() and stops.
# Run to main()
go ,main
Now, the application can be debugged.
© Fujitsu Microelectronics Europe GmbH - 23 - MCU-AN-300028-E-V13

SWB MONITOR DEBUGGER Chapter 6 MDE and Appl. Data/Code in external Flash
6 MDE and Appl. Data/Code in external Flash As already described in chapter 2.1 there are some pending steps during programming the monitor debugger kernel into the external Flash memory.
If your application code uses embedded and external Flash memory there are some important issues regarding programming the monitor debugger kernel and the application data into the same external Flash memory. These steps are illustrated in this chapter.
6.1 External Flash memory mapping (MDE Code & Appl. Code/Data) As you can see in figure 2-5, the monitor debugger kernel reserves some of the external Flash memory for its kernel code. This is always the memory area 0x0100.0000 to 0x010F.FFFF! It is not allowed to map any application code or data into this area, if you want to use the monitor debugger in external Flash!
If you want to use the same Flash memory within your application for code or const data storage, it is essential to map this appl. data or code into a memory area above 0x0110.0000! The monitor debugger initializes the Flash memory with a maximum size of 16MByte, thus there is a memory area available for your application code or data, starting at 0x0110.0000 and ending at 0x01FF.FFFF.
Figure 6-1: Mixed external Flash memory mapping
External Flash CS 0
100:0000h
MDE Code
10F:FC00h
MDE Vector Table 10F:FFFFh110:0000h
Appl. Code/Data
11F:FFFFh
MCU-AN-300028-E-V13 - 24 - © Fujitsu Microelectronics Europe GmbH
SWB MONITOR DEBUGGER Chapter 6 MDE and Appl. Data/Code in external Flash
6.2 Programming It is very important to note that if a chip erase is executed on the external Flash memory, all MDE Code and Appl. Code, stored in the external Flash memory area, is deleted.
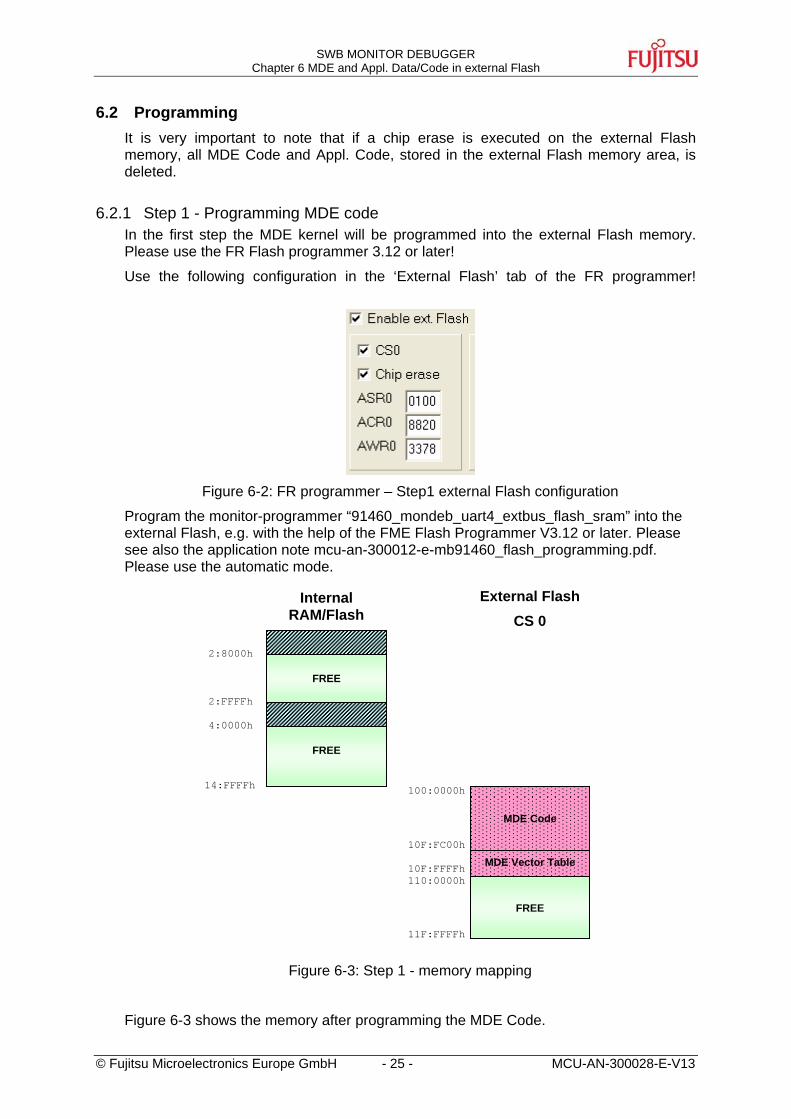
6.2.1 Step 1 - Programming MDE code In the first step the MDE kernel will be programmed into the external Flash memory. Please use the FR Flash programmer 3.12 or later!
Use the following configuration in the ‘External Flash’ tab of the FR programmer!
Figure 6-2: FR programmer – Step1 external Flash configuration
Program the monitor-programmer “91460_mondeb_uart4_extbus_flash_sram” into the external Flash, e.g. with the help of the FME Flash Programmer V3.12 or later. Please see also the application note mcu-an-300012-e-mb91460_flash_programming.pdf. Please use the automatic mode.
Figure 6-3: Step 1 - memory mapping
Figure 6-3 shows the memory after programming the MDE Code.
External Flash Internal RAM/Flash CS 0
2:8000h
FREE
2:FFFFh
4:0000h
FREE
14:FFFFh 100:0000h
MDE Code
10F:FC00h
MDE Vector Table 10F:FFFFh110:0000h
FREE
11F:FFFFh
© Fujitsu Microelectronics Europe GmbH - 25 - MCU-AN-300028-E-V13

SWB MONITOR DEBUGGER Chapter 6 MDE and Appl. Data/Code in external Flash
6.2.2 Step 2 - Programming application code The next step regards programming the application code into embedded and external Flash memory. Please use the FR Flash programmer 3.12 or later!
Use the following configuration in the ‘External Flash’ tab of the FR programmer!
NOTE: It is essential to deactivate the ‘Chip Erase’ for the external Flash memory!
Figure 6-4: FR programmer – Step2 external Flash configuration
Program your application into the external Flash, e.g. with the help of the FME Flash Programmer V3.12 or later. Please see also the application note mcu-an-300012-e-mb91460_flash_programming.pdf. Please use the automatic mode.
Figure 6-5: Step 2 - memory mapping
Figure 6-3 shows the external Flash memory after programming the MDE Code.
External Flash Internal RAM/Flash CS 0
2:8000h
Appl. Data
MDE Code
100:0000h
MDE Vector Table 10F:FFFFh
10F:FC00h
11F:FFFFh
Appl. Code/Const
110:0000h
2:FFFFh
Appl.Code
4:0000h
14:FFFFh
F:FC00h Appl. Vector TableF:FFFFh
FREE or Appl. Code/Const
MCU-AN-300028-E-V13 - 26 - © Fujitsu Microelectronics Europe GmbH

SWB MONITOR DEBUGGER Chapter 6 MDE and Appl. Data/Code in external Flash
6.2.3 Step 3 - Reprogramming application code
The next step regards reprogramming the application code into embedded and external Flash memory after changing the code or data. There are three cases applicable concerning application code modifications:
Figure 6-6: CASE A – code modification
Figure 6-7: CASE B – code modification
External Flash Internal RAM/Flash CS 0
2:8000h
Appl. Data 2:FFFFh MODIFIED4:0000h
Appl.Code
F:FC00h Appl. Vector TableF:FFFFh
FREE or Appl. Code/Const
14:FFFFh 100:0000h
MDE Code
10F:FC00h
MDE Vector Table 10F:FFFFh110:0000h
Appl. Code/Const
11F:FFFFh
External Flash Internal RAM/Flash CS 0
2:8000h
Appl. Data 2:FFFFh 4:0000h
Appl.Code
F:FC00h Appl. Vector TableF:FFFFh
FREE or Appl. Code/Const
14:FFFFh 100:0000h
MDE Code
10F:FC00h
MDE Vector Table 10F:FFFFh110:0000hMODIFIED
Appl. Code/Const
11F:FFFFh
© Fujitsu Microelectronics Europe GmbH - 27 - MCU-AN-300028-E-V13

SWB MONITOR DEBUGGER Chapter 6 MDE and Appl. Data/Code in external Flash
External Flash Internal RAM/Flash CS 0
2:8000h
Appl. Data 2:FFFFh
Figure 6-8: CASE C – code modification
6.2.3.1 CASE A – Reprogramming In this case, only the embedded flash memory has to be reprogrammed.
The next step regards programming the application code into embedded and external Flash memory. Please use the FR Flash programmer 3.12 or later!
Use the following configuration in the ‘External Flash’ tab of the FR programmer!
NOTE: It is essential to deactivate the ‘Enable ext. Flash’ otherwise an Loading error occurs!
Figure 6-9: FR programmer – CASE A external Flash configuration
Deactivating the external Flash support forces the FR programmer to ignore addresses that are mapped into external memory regions.
Program your application into the external Flash, e.g. with the help of the FME Flash Programmer V3.12 or later. Please see also the application note mcu-an-300012-e-mb91460_flash_programming.pdf. Please use the automatic mode.
MDE Code
100:0000h
MDE Vector Table 10F:FFFFh
10F:FC00h
11F:FFFFh
Appl. Code/Const
110:0000h
Appl.Code
4:0000h
14:FFFFh
F:FC00h F:FFFFh Appl. Vector Table
FREE or Appl. Code/Const
MODIFIED
MODIFIED
MCU-AN-300028-E-V13 - 28 - © Fujitsu Microelectronics Europe GmbH

SWB MONITOR DEBUGGER Chapter 6 MDE and Appl. Data/Code in external Flash
6.2.3.2 CASE B – Reprogramming In this case it is necessary to reprogram all memories! Reprogramming the external memory requires to execute a chip erase. This additionally deletes the whole MDE kernel and thus a complete reprogramming of all Flash memories is necessary.
It is essential to start at step 1 and then reprogram the application code in step 2!
6.2.3.3 CASE C – Reprogramming In this case it is necessary to reprogram all memories!
It is essential to start at step 1 and then reprogram the application code in step 2!
© Fujitsu Microelectronics Europe GmbH - 29 - MCU-AN-300028-E-V13

SWB MONITOR DEBUGGER Chapter 7 Appendix
7 Appendix
7.1 Figures Figure 2-1: Correct Start-Up of the SWB Monitor Debugger ................................................... 8 Figure 2-2: Start Softune Workbench SWB Monitor Debugger with external flash and
SRAM......................................................................................................................... 9 Figure 2-3: Default Linkage Map for the SWB Monitor Debugger of the MB91467D (I) ........ 10 Figure 2-4: Correct Start-Up of the SWB Monitor Debugger ................................................. 11 Figure 2-5: Start Softune Workbench SWB Monitor Debugger with external SRAM............. 12 Figure 2-6: Default Linkage Map for the SWB Monitor Debugger of the MB91467D (II) ....... 13 Figure 3-1: SWB Debugging Window .................................................................................... 14 Figure 6-1: Mixed external Flash memory mapping............................................................... 24 Figure 6-2: FR programmer – Step1 external Flash configuration......................................... 25 Figure 6-3: Step 1 - memory mapping ................................................................................... 25 Figure 6-4: FR programmer – Step2 external Flash configuration......................................... 26 Figure 6-5: Step 2 - memory mapping ................................................................................... 26 Figure 6-6: CASE A – code modification ............................................................................... 27 Figure 6-7: CASE B – code modification ............................................................................... 27 Figure 6-8: CASE C – code modification ............................................................................... 28 Figure 6-9: FR programmer – CASE A external Flash configuration..................................... 28
7.2 Abbreviations MDE SWB Monitor Debugger
SWB Softune Workbench
USART Universal Synchronous Asynchronous Receiver Transmitter
7.3 Related Documents - mcu-an-300005-e-mb91v460_getting_started
- mcu-an-391027-e-mb2198_getting_started
- mcu-an-300012-e-mb91460_flash_programming
MCU-AN-300028-E-V13 - 30 - © Fujitsu Microelectronics Europe GmbH