33rd international north sea flow measurement workshop 20 ... · 33rd international north sea flow...
TRANSCRIPT

33rd
International North Sea Flow Measurement Workshop
20-23 October 2015
Tie Backs and Partner Allocation
A Model Based System for meter verification and monitoring
Kjartan Bryne Berg, Lundin Norway AS, Håvard Ausen, Steinar Gregersen, Asbjørn
Bakken, Knut Vannes, Skule E. Smørgrav, FMC Technologies Inc, Norway
Abstract/Introduction
This paper is addressing the operation and management of flow instrumentation in complex
subsea and topside infrastructures. Special attention is given to situations where measurement
inaccuracies may influence the allocation process over time and cause significant imbalance in
the monetary flow, and eventually lead to legal disputes between partners over the allocated
volumes.
This paper will offer a description of how a model based system can be used to overcome the
challenges of describing measurement accuracy, need for reallocation, when/what to re-calibrate
as well as a total overview of the flow instrumentation status– utilizing information from every
instrument and device from subsea and downhole through multiphase meters, separators all the
way through the custody transfer metering system.
A Condition based Performance Monitoring system for a complete overview of the
instrumentation system including instrument status and accuracy indication is also described.
By utilizing flow modelling techniques, fast fault detection can be achieved to minimize the need
for re-allocation. In a potential fault situation, an online model will provide backup calculations
based on the existing instrumentation and include the custody transfer meters as the validator and
total system watchdog.
In cases where re-allocation is required, the model can be used to provide model based re-
calculation.
By tracking compositions from the wells to the fiscal metering point and comparing trends a well
test advisory is given.

33rd
International North Sea Flow Measurement Workshop
20-23 October 2015
1 Challenge
In many fields the flow instrumentation is used for both managing the production process and
allocation. If a biased instrument is allowed to influence the allocation process over time this can
cause significant imbalance in the monetary flow, and could eventually lead to legal disputes
between partners. Early detection allows the operator to take appropriate action and moves the
response from unplanned events to planned operations.
Quality control of the upstream flow instrumentation system is normally done by verification
using topside test facilities. Dedicated well meters may not be verified at all due to failure to
produce a representative rate to test facilities. Therefore meter verification might only be possible
during rare and costly test campaigns. Depending on the subsea architecture, such as in Figure 1,
the tests themselves could also be very uncertain. Testing wells can also defer production. In
contrast, pipeline flow meters can be verified at normal production rates. The difficulty of
verification can lead to some meters operating with biases for long periods of time.
The challenge becomes how to verify and maintain the flow metering equipment while at the
same time minimising production loss due to testing. A good metering system for the allocation
process will also be a good basis for production optimization.
Figure 1 Complex subsea field infrastructure can make meter verification very difficult and costly
2 Model based system
A real-time model based system analyzes information from all available sources such as the
process control system and production databases and present them in a unified way. Combining
multiphase and fluid modelling with statistical analysis and mathematical optimization creates the
foundation for condition based monitoring of the upstream process as well as the topside process
facilities that can provide early error detection and bridge the gap between metering, allocation
and well performance.
A model based system utilizes all available sensors such as temperature, pressure, pressure drop
over choke and Multiphase meter (MPFM) primary instrumentation and calculated rates
combined with the multiphase models in calculating the actual flow. By including all available
information in the model based analysis redundancies can be exploited to enable a more fault
tolerant system.

33rd
International North Sea Flow Measurement Workshop
20-23 October 2015
This paper describes an online model based system based on WATCH from FMC Technologies
comprised of three different parts: Upstream module, Overall mass balance module and Well
Test support module. WATCH is a common software platform for Metering, Production
Performance, Flow Assurance and Asset Integrity systems. WATCH is used in more than 30
online field applications modelling more than 700 wells and have been installed encompassing
both virtual flow metering systems (VFMS), Overall Flow Metering Systems (OFMS) and flow
assurance advisory systems (FAS) using state of the art steady state and transient multiphase flow
modes. Since 2011 the technology was expanded to include “Condition and Performance
Monitoring” (CPM) of subsea equipment. Figure 2 shows a screen shot from an online VFMS
application.
Figure 2 A screenshot from a model based monitoring system containing a single well, flowline and topside separation
process
The Upstream Module includes the wells and subsea production network. The overall mass
balance module uses the output from the Upstream Module, topside instrumentation and custody
transfer metering system to calculate accurate status indications for all meters. The Well Test
support module can flag wells as candidates for well tests. It can also help with the test itself by
providing real time estimates of stabilization time and source tracking during a test, and, through
the an integrated PVT package, act as a conversion tool between topside and subsea conditions,
mass and volumetric rates.
Through these modules, early error detection, status indication for all meters, well test advice and
real time support during well testing can be achieved. Figure 3 shows how the different modules
interact. Each module can work alone, or together with any other.

33rd
International North Sea Flow Measurement Workshop
20-23 October 2015
Figure 3 How the different modules can interact, each module can also work independently
2.1 Early fault finding
A model based system is able to compare sensors through mass, energy and momentum balances
and in this way uses all available instrumentation to validate meters. Analysis is then performed
using built-in statistical tools for error detection and mathematical optimization to extract
information from the system, which is presented as technical conditions.
Early indication of meter failure reduces the need for re-calculation and allows the operator to
include meters in scheduled maintenance tasks ahead of time and avoid unplanned maintenance
and thereby reducing cost. An illustration of this is given in Figure 4.
Figure 4 Detecting errors early allows minimizes the impact from errors
2.1.1 Technical Conditions
The technical condition of the meters is quantified by technical condition indexes (TCIs). The
TCIs are normalized values that are aggregated upwards in an established hierarchy to the desired
level, usually following the structure of the field layout or different use cases.
A technical condition is compounded of many parameters for example the availability of the tag,
if the value communicated from the database within set parameters; frozen, max rate of change,
min/max limits and comparing the meter with redundant or neighboring meters etc.
These are hard failures. The second contribution comes from the model based system, where the
deviation between a calculated value and measured value is compared relative to the sensor and

33rd
International North Sea Flow Measurement Workshop
20-23 October 2015
model uncertainty. The statistical analysis performs Gross Error detection on the system and
reports the Gross Error as an alarm and as a TCI indication as seen in Figure 5
Figure 5 An example of how a TCI tree can be built up with according to specific users need, for Metering the application
has detected a Gross Error in the 1st Stage Separator Liquid Meter.
The TCI's are organized in a tree structure so that each discipline receives relevant information
for their use cases. Examples of different users could be:
Allocation and metering
Petroleum Technology
Operations
Maintenance
Commercial reporting
This is illustrated in Figure 6.
Figure 6 The TCI's are aggregated information reflecting the status of all layers under it and customized for each
discipline
The TCI's are linked to a notification system which can be set up to send push notices as emails
or other services such as SMS. This allows the user to get a quick overview and can locate errors
quickly before they can create large negative impacts.

33rd
International North Sea Flow Measurement Workshop
20-23 October 2015
3 Overall Mass Balance
The overall mass balance is used to validate the well rates and topside meters against the fiscal
metering stations.
WATCH includes process models for separation and merging of streams and integrates a PVT
package which enables compositional tracking and accurate multistage flashing. This means that
the mass balance is also a full compositional balance.
The mass balance is built as a high level robust model to represent the field layout with wells,
templates, flow lines, gas lift and chemical injection lines.
An example of the model layout is given in Figure 7. Both virtual information and physical
meters can be included together with PVT information. The input and output for the Overall
Mass Balance is shown in Figure 8.
Figure 7 The mass balance follows the layout of the field which allows for an intuitive approach
3.1 Sensor uncertainty
Each measurement included in the mass balance has a specified uncertainty corresponding to the
model and sensor uncertainty.
The initial uncertainty is taken from the data sheets for each meter; the result from the overall
mass balance is used to adjust the assumed uncertainty and more accurately reflect the plant
conditions.
The uncertainty specified for each meter increase the awareness of the operator on how each
meter in the allocation system is currently performing.

33rd
International North Sea Flow Measurement Workshop
20-23 October 2015
Figure 8 The Overall Mass Balance validates the input measured values and uncertainties and performs error detection.
Edvard Grieg is an oil field on the Norwegian continental shelf operated by Lundin Norway AS
which will implement an Overall Mass Balance. The Overall Flow Metering System (OFMS)
will be implemented for the process topside, in an effort to qualify this technology and bridge the
gap from wells to fiscal metering station. The OFMS will also be used to perform monitoring and
early error detection for the topside metering system as well as the wells. In addition Edvard
Grieg will have traditional well instrumentation plus a dedicated MPFM for each well. All wells
can be routed individually directly to a test separator for testing.
4 Upstream validation
The upstream metering validation is normally compromised of multiphase models covering the
wells from inflow all the way to the receiving facilities topside or onshore. The model can also
include gas and water injection networks.
In WATCH the wells are modelled using inflow correlations, steady state flow models for the
wellbore and a detailed choke model. All the models are based on first principles for mass and
energy balance and can easily be adjusted to match field conditions.
The upstream metering validation can also be used to estimate rates or other direct or indirect
flow properties such as velocities, densities and phase distribution where no meters are available.
4.1 Brynhild
A WATCH FAS (Flow Advisory System) is installed on Brynhild, a field operated by Lundin
Norway AS. The FAS implements several of the principles mentioned in this paper. Brynhild has
two/three production wells producing into a common MPFM, the FAS is used to validate the
MPFM and monitor the individual well performance.
By having the online and offline capabilities of the FAS the operators on Brynhild can quickly
run simulations where they can test hypothesis and compare them with historical measured data
from the field, this provides a deeper understanding of how the wells and field performs, and
allow for more optimal operations.

33rd
International North Sea Flow Measurement Workshop
20-23 October 2015
4.1.1 Slugging
Well slugging was experienced on Brynhild. The FAS was used to identify that the slugging only
occurred outside certain velocity constraints; a virtual velocity measurement was added in the
FAS and could be directly applied for well control without any installation costs or
commissioning period.
4.1.2 Water Cut increase
The MPFM on Brynhild is used as the primary tool for allocation and the FAS works as a
verification and backup system. When the MPFM suddenly showed a 17% increase in WC the
FAS was used to investigate whether the increase was due to an actual change in the production
process fluid content or a problem with the WC measurement in the MPFM. As Figure 9 shows
the total flow rate were slowly decreasing while the WC was increasing. The step increase in WC
however is only present in the MPFM and not visible in the calculated rate from the FAS. The
FAS rate is based on the model response for all pressures and temperatures. The pressure and
temperature responses do not show any indication of a step increase of WC and this is reflected
directly in the calculated WC. This indicates that the measured MPFM WC increase is not due to
a change in the well performance. The independent verification of the MPFM gives the operator
room for action, and avoids unnecessary tests or well shut downs.
Figure 9 A water cut increase is measured in the MPFM, the FAS shows no increase indicating a mismatch between the
pressure and temperature instrumentation and the MPFM. Values are normalized.
4.2 Out of range meter
Many operators' struggle with out of range meters, this can in some cases mean that the operator
needs to defer production since the actual production is not known and safe operations are
difficult.
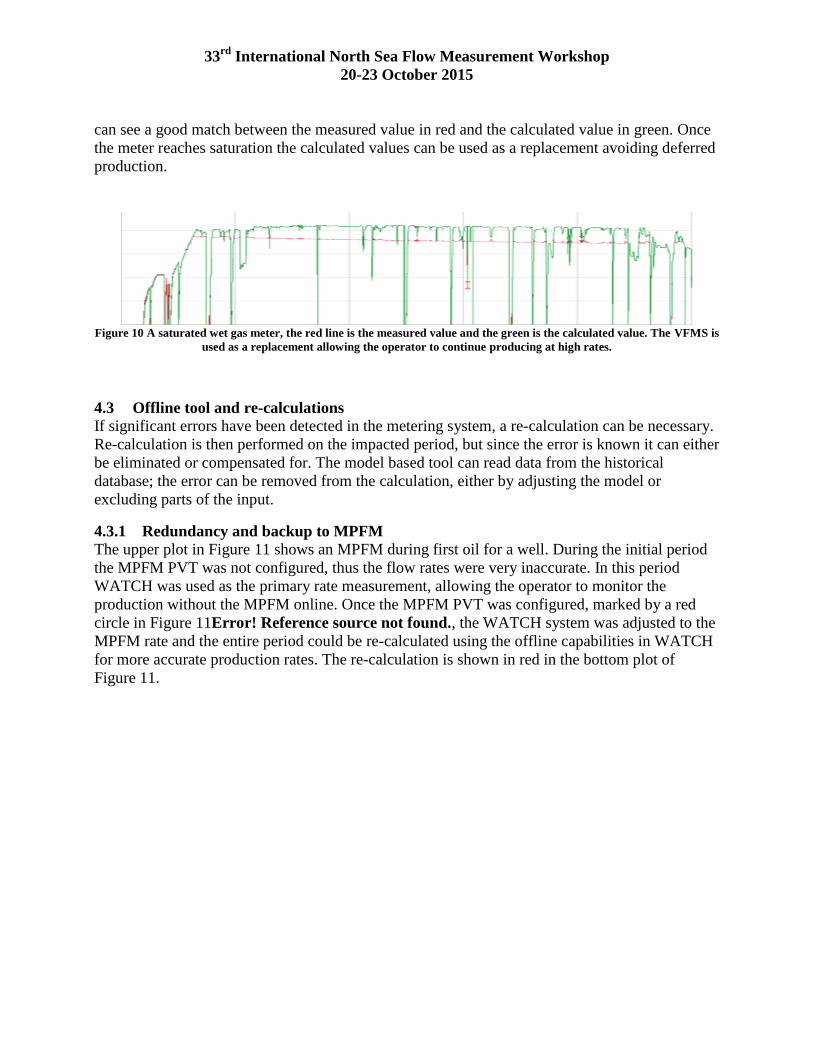
In Figure 10 one such case is shown for a wet gas meter. The differential pressure sensor of the
venturi of the meter is saturated meaning the full production rate cannot be measured. The VFMS
calculated rate that normally would be used for backup and surveillance, is then used as the
primary measurement. During the initial ramp-up in Figure 10 the meter is not saturated and we
33rd
International North Sea Flow Measurement Workshop
20-23 October 2015
can see a good match between the measured value in red and the calculated value in green. Once
the meter reaches saturation the calculated values can be used as a replacement avoiding deferred
production.
Figure 10 A saturated wet gas meter, the red line is the measured value and the green is the calculated value. The VFMS is
used as a replacement allowing the operator to continue producing at high rates.
4.3 Offline tool and re-calculations
If significant errors have been detected in the metering system, a re-calculation can be necessary.
Re-calculation is then performed on the impacted period, but since the error is known it can either
be eliminated or compensated for. The model based tool can read data from the historical
database; the error can be removed from the calculation, either by adjusting the model or
excluding parts of the input.
4.3.1 Redundancy and backup to MPFM
The upper plot in Figure 11 shows an MPFM during first oil for a well. During the initial period
the MPFM PVT was not configured, thus the flow rates were very inaccurate. In this period
WATCH was used as the primary rate measurement, allowing the operator to monitor the
production without the MPFM online. Once the MPFM PVT was configured, marked by a red
circle in Figure 11Error! Reference source not found., the WATCH system was adjusted to the
MPFM rate and the entire period could be re-calculated using the offline capabilities in WATCH
for more accurate production rates. The re-calculation is shown in red in the bottom plot of
Figure 11.

33rd
International North Sea Flow Measurement Workshop
20-23 October 2015
Figure 11 The top figure shows the WATCH as an online tool where WATCH was used as the primary measurement. The
red circle shows when the MPFM came online. The bottom figure shows flow rates prior to and after calibration.
5 Well test support
The goal of the Well test module is to perform well tests only when required thus reducing testing
time, number of well tests and costs due to deferred production.
5.1 Advice
By monitoring trends and changes in the well response, it is possible for the application to offer
well test advice.
Deviations between the modelled response and the measured response indicate that a change has
happened and the well is a candidate for test. The raw data is presented in Figure 12, while it is
clear that some of the data stands out, without analysis it is difficult to see which producers
contributes to the error.
Statistical analysis of the deviation between calculated and measured values provides this insight
and correlates each well's contribution to the deviation. An example of this is given in Figure 13
where the deviation between the sum of subsea production and custody transfer system is
correlated with the well production, especially B-13 and B-12 are candidates for the next well test
campaign.

33rd
International North Sea Flow Measurement Workshop
20-23 October 2015
Figure 12 Well monitoring comparing the well production with topside metering. Without analysis it is difficult to find the
contributors to each error.
Figure 13 Statistical analysis can be used to identify which wells are recommended for test
5.2 Source tracking
One challenge with running tests on a subsea field is the stabilization times which are often
conservatively estimated, leading to unnecessary test time.
By using transient models WATCH can calculate hold up and transportation time and use this to
automatically track each wells production into the test meter or separator to ensure that the
correct well fluid enters the testing facilities.
A graphical example is given in Figure 14. The y-axis shows the arriving fraction. The time axis
is divided into 4 different sections
1. Initialization of the well test
2. Pipeline flushing, the fluid currently in the pipe is being produced out.
3. Transition period, final stages of flushing
4. Data logging, this is the optimal time for testing.
A model based tool can in this way calculate a real time estimate of the actual state of the system
and stabilization time thereby optimizing test durations.
Tracking fluid residence time and stability enables the operator to minimize the period on test
without compromising data quality.

33rd
International North Sea Flow Measurement Workshop
20-23 October 2015
Figure 14 Example of source tracking during a well test, 1: Verify test conditions. 2: Flow line flushing. 3: Transition
period. 4: Data logging.
5.3 Rate conversion and PVT calculations
One of the challenges when performing well testing is the calibration process. The measured rates
are usually performed at very different conditions, such as the difference between pressure and
temperature for the test separator and well head. It could be that the subsea instrumentation
accurately measures mass rates, while the separator measurements are volumetric.
Fully compositional calculations convert between flow rate at volumetric or mass rates and
fractions between any given set of conditions.
They convert actual rates and fractions at the well and compare them to the measurements made
topside; it is also possible to compare the performance at several specified conditions at the same
time. This saves the operators time and reduces the uncertainty in the calibration process.
6 Flexible installation and maintenance
The WATCH system is a software installation and has a very flexible installation package with
its own web server and web GUI. A web browser and an open connection to the server is all that
is required to access the system, together with the appropriate credentials. This makes it very well
suited for organizations where the daily operations are split between onshore and offshore and
allows easy collaboration. The Watch software can also connect to a multitude of data sources
such as the production control system or to the customer database through one of several
supported protocols. As seen in Figure 15.

33rd
International North Sea Flow Measurement Workshop
20-23 October 2015
Figure 15 The model based system gathers data from all data sources available
7 Summary
The paper has described a real-time model based system that can analyze information from all
available sources and present them in a unified way in an online overview.
The overview is customized for each profession and allows the operator to get a quick status
overview of the field.
The automated error detection can notify users quickly in the event of sensor, meter or
communication failures in the system and depositions in the production system. This enables
systematic and efficient verification of meters and well production and allows operators to only
test when needed.
The model based system enables fault tolerant operations of the online system and maximizes the
value of the available information reducing costs for the operator and maintains metering quality
through field life.

References
[1] Paper presented at the North Sea Flow Measurement Workshop, a workshoparranged by NFOGM & TUV-NEL
Note that this reference was not part of the original paper, but has been addedsubsequently to make the paper searchable in Google Scholar.