35. appendix g - hydrology and flood studies rev sca … project/vol1/appendix g... · coyne et...
TRANSCRIPT

Red Sea – Dead Sea Water Conveyance Study Program Draft Final Feasibility Study Report (12 147 RP 04), April 2011
Appendix G – Hydrology and Flood Studies Report
COYNE ET BELLIER in association with Tractebel Engineering and Kema Appendix G
Appendix G
Hydrology and Flood Studies Report


Red Sea – Dead Sea Water Conveyance Study Program Draft Final Feasibility Study Report (12 147 RP 04), April 2011
Appendix G – Hydrology and Flood Studies Report
COYNE ET BELLIER in association with Tractebel Engineering and Kema Appendix G ‐ Page i
Appendix G – Hydrology and Flood Studies
Table of Contents
List of Boxes iii
Notations iv
References v
1. SUMMARY 1
1.1. Objectives and Content 1
1.2. Main Results 2 1.2.1. Floods of Wadi Yutum and of Aqaba / Eilat Region 2 1.2.2. Cross Drainage of Canal Sections 6 1.2.3. Floods at the Entrance of the Truce Canal 9 1.2.4. Miscellaneous 10 1.2.5. Recommendations 10
2. FLOODS OF WADI YUTUM AND OF AQABA / EILAT REGION 11
2.1. Objectives and Content 11
2.2. Floods of Wadi Yutum 11 2.2.1. Study of Maximum Daily Rainfall 11 2.2.2. Storm Profile and Area Reduction Factor 16 2.2.3. Computation of Flood Hydrographs for Wadi Yutum 19
2.3. Floods in the Aqaba / Eilat Region 23 2.3.1. Information about Aqaba / Eilat Region 23 2.3.2. Floods at the Mouth of Arava – Storm Centered on Wadi Yutum 27 2.3.3. Floods at the Mouth of Arava – Storm Centered on Arava 29
2.4. Discussion of Results 30
3. CROSS DRAINAGE OF CANAL SECTIONS 31
3.1. Objectives and Content 31
3.2. Maximum Daily Rainfall 33
3.3. Storm Profiles 52
3.4. Description of Catchments under Study 57
3.5. Computation of Flood Hydrographs 64

Red Sea – Dead Sea Water Conveyance Study Program Draft Final Feasibility Study Report (12 147 RP 04), April 2011
Appendix G – Hydrology and Flood Studies Report
COYNE ET BELLIER in association with Tractebel Engineering and Kema Appendix G ‐ Page ii
3.6. Analysis of Results 66
4. MISCELLANEOUS 69
4.1. Objectives and Content 69
4.2. Definition of the 24‐hour Reference Precipitation 69
4.3. Definition of the IDF values 70
4.4. Some Comments Related to the Pipeline Option 70
4.5. Impact of Climate Change on IDF 70
5. FLOODS AT THE ENTRANCE OF TRUCE CANAL 73
5.1. General 73
5.2. Wadi Hasa Floods 73 5.2.1. Statistical Analysis of Floods at Tannur 73 5.2.2. Flood Hydrographs of Wadi Hasa 75
5.3. Flood Hydrographs of Other Subcatchments 78 5.3.1. Description of Subcatchments 78 5.3.2. Rainstorms and CN values 81 5.3.3. Floods at Confluence with Wadi Arava 83
5.4. Floods at Entrance of Truce Canal 83 5.4.1. Flood Peak vs. Return Period 83 5.4.2. Flood Hydrographs 85
5.5 Discussion of Results 88
6. SUPPORTING DOCUMENTS 89
6.1. Supporting Documents for Wadi Yutum Floods 89
6.2. Supporting Documents for Aqaba / Eilat Region 108
6.3. Supporting Documents for Cross Drainage 143
6.4. Supporting Document for Truce Canal Floods 190

Red Sea – Dead Sea Water Conveyance Study Program Draft Final Feasibility Study Report (12 147 RP 04), April 2011
Appendix G – Hydrology and Flood Studies Report
COYNE ET BELLIER in association with Tractebel Engineering and Kema Appendix G ‐ Page iii
List of Boxes
Box 1 - Wadi Yutum Floods - Statistics about Maximum Daily Rainfall................................. 12 Box 2 Wadi Yutum Floods - Aplication of the Station-Year Approach to Aqaba Case ......... 14 Box 3 Wati Yutum Floods - IDF Curves for Aqaba ................................................................ 17 Box 4 Wadi Yutum Floods - Area Reduction Factor ............................................................ 18 Box 5 Wadi Yutum Floods - Computation of Flood Hydrographs ......................................... 20 Box 6 Wadi Yutum Floods- Comparison between Global and Thunderstorm Approaches ... 22 Box 7 Aqaba / Eilat Region - Floods of Small Watersheds................................................... 25 Box 8 Aqaba / Eilat Region - Global Flood Hydrograph - Storm Centered on Yutum ......... 28 Box 9 Aqaba / Eilat Region - Global Flood Hydrograph - Storm Centered on Arava ........... 29 Box 10 Cross Drainage - Main Catchments along the Canal Sections ................................ 32 Box 11 Cross Drainage - Red Sea Regional Sample – Raingauges.................................... 34 Box 12 Cross Drainage - Samples of Maximum Daily Rainfall - Red Sea Family ................ 35 Box 13 Cross Drainage - Pdmx Samples - 243 Station Years ............................................. 39 Box 14 Cross Drainage - Gumbel Distribution for Pdmx at Selected Raingauges .............. 46 Box 15 Cross Drainage - Parameters P0 and G vs Pyr and M(Pdmx) ................................ 51 Box 16 Cross Drainage - Determination of Storm Profile ..................................................... 53 Box 17 Cross Drainage - Hypsometry of Catchments under Study...................................... 58 Box 18 Cross Drainage - Time of concentration and Time to Peak...................................... 64 Box 19 Cross Drainage - USSCS Curve Numbers CN......................................................... 65 Box 20 Cross Drainage - Flood Peaks vs. Return Periods................................................... 66 Box 21 Cross Drainage - Flood Peaks vs. Catchment Area - Analysis of Results ............... 67 Box 22 Cross Drainage - Specific Flood Peak Qp/A vs. Area and Thalweg Slope .............. 68 Box 23 Truce Canal - Statistical Analysis of Flood Peaks at Tannur.................................... 74 Box 24 Truce Canal - Floods of Wadi Hasa ......................................................................... 76 Box 25 Truce Canal - Characteristics of Subcatchments ..................................................... 78 Box 26 Truce Canal - Information about Rainstorms............................................................ 82 Box 27 Truce Canal - Flood Peaks at the confluence with Arava......................................... 83 Box 28 Truce Canal - Flood Peak vs. Return Period............................................................ 84 Box 29 Truce Canal - Flood Hydrographs - Usual and Extreme Floods............................... 86 Box 30 Truce Canal - Illustration of Results ......................................................................... 88

Red Sea – Dead Sea Water Conveyance Study Program Draft Final Feasibility Study Report (12 147 RP 04), April 2011
Appendix G – Hydrology and Flood Studies Report
COYNE ET BELLIER in association with Tractebel Engineering and Kema Appendix G ‐ Page iv
Notations
A Catchment area (km2).
ARF Area Reduction factor.
ad Dew point adjustment factor.
aw Wind speed adjustment factor.
CN Catchment Runoff Number (in USSCS method).
C(Qp) Myers’s Flood Rating. (Qp = C A0.5).
Cv Coefficient of variation (Cv = S/M).
F Frequency.
I Catchment initial loss (in USSCS method; I = 5.08 (1000/CN ‐ 10); (mm).
K Hershfield's constant. (PMP = M + K S).
K(Qp) Francou‐Rodier’s Flood Rating. (Q/106) = (A/109)(1‐01.K).
M Average of sampled data.
Max Maximum of sampled data.
Me Median of sampled data.
Min Minimum of sampled data.
n Sample size.
Pdmx Maximum daily precipitation (mm).
PMP Probable Maximum Precipitation (mm).
Pw Precipitable water (mm).
Pyr Yearly precipitation (mm).
Q Discharge (m3/s).
Qd Daily discharge (m3/s).
Qdmx Maximum daily discharge (m3/s).
Qp Instantaneous peak discharge (m3/s).
QFit Fitted discharge (m3/s).
r Coefficient of correlation.
r2 Coefficient of determination.

Red Sea – Dead Sea Water Conveyance Study Program Draft Final Feasibility Study Report (12 147 RP 04), April 2011
Appendix G – Hydrology and Flood Studies Report
COYNE ET BELLIER in association with Tractebel Engineering and Kema Appendix G ‐ Page v
RF Daily rainfall (mm).
RH Relative humidity (%).
RO Runoff (mm).
RO Flood runoff, (in USSCS method, RO = (P‐I)²/(P+4I)), (mm).
S Standard deviation of sampled data
T Return Period (years).
V Volume (Mm3).
Vyr Yearly inflow (Mm3).
Z Elevation (m).
References
Author Date Title Howard Humphreys 1992 Dams on Wadi Wala and Wadi Mujib - Final Report. Unknown 1992 Tables and extracts from the Hydrology Study of Tannur Dam Gibbs 1994 Truce Line Channel - Hydrology Study Harza JRV Group 1998 Pre Feasibility Report - Volume III Ministry of Water and Irrigation 2001 Rainfall Intensity-Duration-Frequency in Jordan WAJ Undated IDFs at 32 Locations in Jordan (a table tiltled “IDF-Formula Coefficients ACE 2003 Wadi Hisban Dam - Final Design Report ACE 2004 Maintenance and Rehabilitation of Bridges and Culverts - Final Design Report
Exact 2006 Application of Methods for Analysis of Rainfall Intensity in Areas of Israeli, Jordanian, and Palestinian Interest.
Geological Survey of Israel 2006 Red Sea-Dead Sea Conduit - Geo Environmental Study Along the Arava Valley. MWH 2007 Aqaba Storm Water Master Plan Report - Review Engicon 2007 Al Safi Back Road - Preliminary Technical Report (Hydrology) Yodfat Engineers 2009 RSDS Water Conveyance Project - Part 1 - Meteorology and Hydrology - Data Collection


Red Sea – Dead Sea Water Conveyance Study Program Draft Final Feasibility Study Report (12 147 RP 04), April 2011
Appendix G – Hydrology and Flood Studies Report
COYNE ET BELLIER in association with TRACTEBEL ENGINEERING and KEMA Appemdix G ‐ Page 1
1. SUMMARY
1.1. Objectives and Content
1. The present Hydrology Report details the findings of the study team related to the following topics:
• Floods of Wadi Yutum and floods in the Aqaba / Eilat region.
• Cross Drainage of Canal Sections.
• Floods at the entrance of Truce Line Channel.
• Miscellaneous.
2. The reports consists of six chapters:
• Chapter 1, Summary. This chapter describes the objectives and the content of the report. It summarises the main results and presents some recommendations for the further steps.
• Chapter 2, Floods of Wadi Yutum and of ‐ Floods in the Aqaba / Eilat Region. This chapter details the computations achieved by the RSDS study team in order to get their own appraisal of flood risks due to Wadi Yutum and other wadis in the Aqaba / Eilat Region. The results of this study have been used in the Screening Report.
• Chapter 3, Cross Drainage of Canal Sections. This chapter concerns the assessment of flood peaks for the most important catchments that imply cross drainage for the canal sections. The study team adopted a unit‐hydrograph approach using a 24‐hour storm.
• Chapter 4, Miscellaneous. This chapter summarises the process for obtaining the relevant information for less important drainage problems. In this chapter, we address also the climatic change issue.
• Chapter 5, Floods at the entrance of Truce Canal. This chapter contains an assessment of flood magnitudes at the entrance of the Truce Canal.
• Chapter 6, Supporting Documents. This chapter gives additional information
enabling the reader to make full use of the present report.

Red Sea – Dead Sea Water Conveyance Study Program Draft Final Feasibility Study Report (12 147 RP 04), April 2011
Appendix G – Hydrology and Flood Studies Report
COYNE ET BELLIER in association with TRACTEBEL ENGINEERING and KEMA Appemdix G ‐ Page 2
1.2. Main Results
1.2.1. Floods of Wadi Yutum and of Aqaba / Eilat Region
3. Making use of rainfall data from Aqaba and the remaining part of the country, we have been able to compute the floods of Wadi Yutum in the case of a global storm. These results have been compared to the approach of MWH who considered a thunderstorm on a restricted part of wadi Yutum. The obtained results are:
T Global Thunderstorm
(yr) (m3/s) (m3/s) 2 118 5 338
10 330 528 20 460 25 880 50 640 1 100
100 780 1 370 500 1 140
1 000 1 310 5 000 1 710
10 000 1 890 PMF 6 780 PMF/10 000 3,59
4. It should be noticed that different databases and different assumptions yield contrasted
results. However, both the global approach and the thunderstorm approach provide very important flows for Wadi Yutum.

Red Sea – Dead Sea Water Conveyance Study Program Draft Final Feasibility Study Report (12 147 RP 04), April 2011
Appendix G – Hydrology and Flood Studies Report
COYNE ET BELLIER in association with TRACTEBEL ENGINEERING and KEMA Appemdix G ‐ Page 3
Wadi Yutum Catchment
5. Israeli studies quoted by Yodfat indicate a flood risk of about 800 m3/s at the Red Sea level
(outlet of Wadi Arava). This flood risk does not include wadi Yutum contribution and is due to a catchment area of 470 km² as shown below. We combined Wadi Yutum and Arava floods for a number of cases and we obtained the following results.
Nb Watershed D A (km²) Group (km) (km²)
5 Rekhem 19 135,2 A 5+12 W. Mahatadi 19,1 182,0 A 5+12+11 11 16,1 202,7 B Previuous + 4-3 Ora 16,3 214,7 B Previous +10 10 13,4 240,8 B Previous + 4-2 Evrona 12,8 280,2 B Previous + 9 W. Askari 11,4 287,2 B Previous + 8 8 11 304,8 B Previous + 7 W. Mil'an 9,7 332,8 C Previous + 4-1 Amram 8 356,8 C Previous + 6 6 7,7 386,8 C Previous + 3 + 2 3+2 5 424,5 C Previous + 1 1 2,6 470,1 C

Red Sea – Dead Sea Water Conveyance Study Program Draft Final Feasibility Study Report (12 147 RP 04), April 2011
Appendix G – Hydrology and Flood Studies Report
COYNE ET BELLIER in association with TRACTEBEL ENGINEERING and KEMA Appemdix G ‐ Page 4

Red Sea – Dead Sea Water Conveyance Study Program Draft Final Feasibility Study Report (12 147 RP 04), April 2011
Appendix G – Hydrology and Flood Studies Report
COYNE ET BELLIER in association with TRACTEBEL ENGINEERING and KEMA Appemdix G ‐ Page 5
Storm Centered on Yutum ‐ Results
Items Group A Group B Group C Yutum Global A (km²) 182,0 122,8 165,3 4 465 4 935 T (years) Qp(T) (m3/s) 100-yr US 70 68 82 780 100-yr DS - 20 km/h 63 63 63 777 778 100-yr DS - 10 km/h 53 52 74 775 777 1 000-yr US 148 156 180 1 309 1 000-yr DS - 20 km/h 135 150 177 1 304 1 305 1 000-yr DS - 10 km/h 115 115 166 1 302 1 304
10 000-yr US 247 263 297 1 893 10 000-yr DS – 20 km/h 218 247 292 1 885 1 886 10 000-yr DS – 10 km/h 189 193 275 1 882 1 886 PMF US 1 150 1 219 1 331 6 781 PMF DS - 20 km/h 1 005 1 112 1 330 6 759 6 768 PMF DS - 10 km/h 859 896 1 264 6 744 6 755
Storm Centered on Arava ‐ Results
Items Group A Group B Group C Yutum Global
A (km²) 182,0 122,8 165,3 4 465 4 935 T (years) Qp(T) (m3/s) 100-yr US 173 183 210 748 100-yr DS - 20 km/h 156 175 207 746 747 100-yr DS - 10 km/h 134 135 194 744 747 1 000-yr US 330 351 393 1 257 1 000-yr DS - 20 km/h 289 328 386 1 252 1 254 1 000-yr DS - 10 km/h 251 257 367 1 250 1 254
10 000-yr US 502 535 593 1 817 10 000-yr DS - 20 km/h 440 495 589 1 810 1 812 10 000-yr DS - 10 km/h 379 392 557 1 807 1 813 PMF US 1 914 2 022 2 193 6 510 PMF DS - 20 km/h 1 672 1 833 2 196 6 488 6 503 PMF DS - 10 km/h 1 424 1 488 2 092 6 474 6 492
Notes: US = Upstream – DS = Downstream (at Red Sea); the velocities of 20 and 10 km/h corresponds to the flood wave propagation quoted by Yodvat on the basis of a kinematic wave approach.

Red Sea – Dead Sea Water Conveyance Study Program Draft Final Feasibility Study Report (12 147 RP 04), April 2011
Appendix G – Hydrology and Flood Studies Report
COYNE ET BELLIER in association with TRACTEBEL ENGINEERING and KEMA Appemdix G ‐ Page 6
1.2.2. Cross Drainage of Canal Sections
6. We identified 17 catchments of various shapes and sizes that can put at risk the canal sections (see below). We applied usual methods to define storm profiles and storm amounts. Then the USSCS approach enables us to find the flood peaks at these various locations. The obtained results are:
Catchment A (km²) Q-2 Q-5 Q-10 Q-50 Q-100 Q-300 Q-500 Q-1000 Q-4000 Q-5000 Q-10000 PMF
Ghor Safi Area 4 85 27 69 102 178 209 264 289 321 390 401 433 1 2145 161 15 48 75 147 179 235 261 296 367 378 420 1 2486 35 8 24 37 71 84 109 121 137 168 173 190 562 7 186 16 47 76 149 182 239 266 304 381 393 439 1 345
Catchments between Shoubak and Wadi Musa 14 17 12 22 29 45 52 63 68 75 89 91 98 239 19 15 12 22 29 45 52 62 67 74 88 90 97 238 22 11 10 18 23 37 42 51 55 61 72 74 79 198 37 79 33 66 91 150 175 218 238 265 318 326 356 895 59 11 9 18 23 37 42 51 55 60 72 74 79 197 74 65 16 43 44 106 127 159 173 195 238 245 265 728 89 149 21 63 101 202 244 323 360 407 507 523 572 1 710
Catchments between Wadi Musa and Ras En Naqb
93 147 3 18 35 83 105 148 168 200 262 272 302 1 090115 59 5 25 40 85 108 141 156 181 223 230 252 797 122 74 4 20 38 85 111 151 169 193 247 256 281 943 123 263 4 22 48 121 159 227 259 298 397 413 465 1 737133 34 3 15 26 57 65 87 97 112 140 144 160 518
141 54 4 23 40 81 102 134 149 169 211 218 241 753
(m3/s) Notes : in this table, the 300‐year and 400‐year results correspond to the design return periods
adopted by the study team. The first deign period is adopted when it exists no storage or major risk .

Red Sea – Dead Sea Water Conveyance Study Program Draft Final Feasibility Study Report (12 147 RP 04), April 2011
Appendix G – Hydrology and Flood Studies Report
COYNE ET BELLIER in association with TRACTEBEL ENGINEERING and KEMA Appemdix G ‐ Page 7

Red Sea – Dead Sea Water Conveyance Study Program Draft Final Feasibility Study Report (12 147 RP 04), April 2011
Appendix G – Hydrology and Flood Studies Report
COYNE ET BELLIER in association with TRACTEBEL ENGINEERING and KEMA Appemdix G ‐ Page 8

Red Sea – Dead Sea Water Conveyance Study Program Draft Final Feasibility Study Report (12 147 RP 04), April 2011
Appendix G – Hydrology and Flood Studies Report
COYNE ET BELLIER in association with TRACTEBEL ENGINEERING and KEMA Appemdix G ‐ Page 9
1.2.3. Floods at the Entrance of the Truce Canal
7. The catchment area upstream of the Truce Canal is rather large (about 13 800 km²). We used both statistical approach and unitgraph approach combined with flood routing by Muskingum approach to derive the following results.
A. Flood Peak vs. Return Period
T u (Gumbel) Qp K(Qp)(years) (m3/s)
2 0,367 164 0,205 1,500 275 0,78
10 2,250 364 1,0950 3,902 604 1,66
100 4,600 723 1,87500 6,214 1 040 2,27
1 000 6,907 1 194 2,435 000 8,517 1 592 2,75
10 000 9,210 1 781 2,88PMF 4 417 3,90√Qp = 3,323 u (Gumbel) +11,603
B. Entrance of Truce Canal and Sub catchments – Flood Peaks
Truce Canal - Flood Peaks vs. Return Period
10
100
1 000
10 000
1 10 100 1 000 10 000
Return Period T (years)
Floo
d Pe
aks
Qp
(m3/
s)
Truce Canal C0 C4 (Hasa) C2 C5 C3 C1a C1b C1c

Red Sea – Dead Sea Water Conveyance Study Program Draft Final Feasibility Study Report (12 147 RP 04), April 2011
Appendix G – Hydrology and Flood Studies Report
COYNE ET BELLIER in association with TRACTEBEL ENGINEERING and KEMA Appemdix G ‐ Page 10
T Truce Canal C0 C4 (Hasa) C2 C5 C3 C1a C1b C1c
(years) (m3/s) (m3/s) (m3/s) (m3/s) (m3/s) (m3/s) (m3/s) (m3/s) (m3/s)2 164 24 59 39 15 57 29 62 225 275 63 153 97 45 121 70 146 55
10 364 88 237 150 74 232 107 215 8450 604 187 472 295 161 452 211 399 164
100 723 229 584 361 204 551 259 496 200500 1 040 359 893 543 322 822 379 716 300
1 000 1 194 416 1 045 630 379 949 441 833 3535 000 1 592 583 1 413 849 523 1 247 588 1 055 478
10 000 1 781 654 1 584 943 591 1 383 673 1 203 535 PMF 4 417 1 677 3 962 2 340 1 591 3 293 1 650 2 712 1 344 A (km²) 13 773 932 2 502 1 662 419 1 959 1 408 3 608 1 283
Note: For sub catchments Qp are peaks routed to Truce Canal. For location, see map in section 5.
1.2.4. Miscellaneous
8. For local drainage issues, the various findings of the storm and hydrograph approach can be used to derive IDF values at the needed location. The reader is referred to section 4 for more details. A special report covers climate change aspects. Based upon the findings of this report, we have derived an analysis of climate change impacts on flood risks which are presented also in section 4.
1.2.5. Recommendations
9. If the studies confirm the interest to have canal sections, we strongly advise to carry a survey of flood marks in the different wadis of interest including those affecting directly the RSDS project and those nearby.
10. Such a survey should be made also for locations of interest such as the Eastern Intake, tunnel adits (if needed), location of hydropower and desalination plants.
11. For next step of the study, we will need to review again the issues of maximum daily rainfall and storm profiles. Flood hydrograph computations at more advanced stage of the project should incorporate the results of the flood mark review. If needed, Israeli data, which have not been obtained yet, will have to be considered in due time.

Red Sea – Dead Sea Water Conveyance Study Program Draft Final Feasibility Study Report (12 147 RP 04), April 2011
Appendix G – Hydrology and Flood Studies Report
COYNE ET BELLIER in association with TRACTEBEL ENGINEERING and KEMA Appemdix G ‐ Page 11
2. FLOODS OF WADI YUTUM AND OF AQABA / EILAT REGION
2.1. Objectives and Content
12. For the screening report, the study team found necessary to investigate the floods of Wadi Yutum in order to obtain an appraisal from the part of the Red Sea / Dead Sea project team.
13. The study was based upon an analysis of maximum daily rainfall, a determination of storm profile and area reduction factor. This was followed by the determination of flood hydrographs for several return periods.
14. Yodfat provided data about Aqaba / Eilat Region, which we found useful for our assessment. They concerned the flood risk from wadis located downstream of Yotvata plain.
15. This section of the report is composed of three parts:
• A study of Wadi Yutum Floods.
• A study of floods in Aqaba / Eilat Region.
• A conclusion about the obtained results.
2.2. Floods of Wadi Yutum
2.2.1. Study of Maximum Daily Rainfall
16. The following table summarises the sample statistics for maximum daily rainfall at several stations in Jordan. Note that extreme daily rainfall at Aqaba is of the order of magnitude of yearly rainfall. The associated graph discloses that the mean of maximum daily rainfall is related to the mean yearly rainfall, which is in turn dependent upon longitude, latitude and elevation.
17. The daily Probable Maximum Precipitation (PMP) according to Hershfield’s approach is given in the last table of Box 1 below. It amounts to 193 mm/day in Aqaba.
18. For assessing the daily rainfall for several return periods, we applied a station‐year approach to the 577 station‐year regional sample. Excluding possible simultaneous events results in obtaining a final sample of 210 station‐years, which is sufficient for design purposes. The graphs of Box 2 outline the approach.

Red Sea – Dead Sea Water Conveyance Study Program Draft Final Feasibility Study Report (12 147 RP 04), April 2011
Appendix G – Hydrology and Flood Studies Report
COYNE ET BELLIER in association with TRACTEBEL ENGINEERING and KEMA Appemdix G ‐ Page 12
Box 1 ‐ Wadi Yutum Floods ‐ Statistics about Maximum Daily Rainfall
A. Sample Statistics about Maximum Daily Rainfall
Station Pyr n M S Cv Me Max Min Max/Me M/Pyr Aqaba 29,5 49 11,4 8,9 0,78 8,5 42,5 0,8 5,00 0,39 Ghor Safi 77 34 17,3 11,0 0,64 13,5 54,9 6,6 4,08 0,22 Zarqa 144 6 13,5 2,0 0,15 13,4 16,2 10,7 1,21 0,09 Mafraq 162 51 21,4 9,1 0,43 19,9 45,9 7,3 2,31 0,13 Wadi Mousa 179 31 33,4 13,6 0,41 32,0 66,4 15,0 2,08 0,19 Tafileh / Eiss 242 8 35,4 13,9 0,39 36,2 55,9 16,6 1,54 0,15 Deir Alla 282 56 35,1 14,1 0,40 33,3 85,0 11,5 2,56 0,12 Shoubak 314 43 50,4 18,1 0,36 49,5 100,0 19,3 2,02 0,16 Er Rabbah 337 47 52,7 21,6 0,41 49,0 108,0 20,0 2,20 0,16 Madaba 350 33 46,9 17,1 0,36 45,7 85,2 13,0 1,86 0,13 Baqura 394 39 44,5 24,4 0,55 40,0 160,0 21,1 4,00 0,11 Amman Airport 414 85 39,3 15,0 0,38 37,2 80,0 13,5 2,15 0,09 Irbed 472 53 48,5 16,0 0,33 47,2 105,0 24,8 2,22 0,10 Salt 556 42 63,2 20,5 0,32 60,0 110,0 23,3 1,83 0,11
Notes : Pyr in mm/year ; M, S, Me, Max, Min in mm/day
B. Relation between Maximum Daily Rainfall and Yearly Rainfall
Mean of Maximum Daily Rainfall vs. Yearly Rainfall
y = 0,095x + 9,91R 2 = 0,828
0
10
20
30
40
50
60
70
0 100 200 300 400 500 600
Yearly Rainfall Pyr (mm/year)
Mea
n of
Max
imum
Dai
ly R
ainf
all M
(Pdm
x) (m
m/d
ay)
MM(Pdmx) vs. Pyr

Red Sea – Dead Sea Water Conveyance Study Program Draft Final Feasibility Study Report (12 147 RP 04), April 2011
Appendix G – Hydrology and Flood Studies Report
COYNE ET BELLIER in association with TRACTEBEL ENGINEERING and KEMA Appemdix G ‐ Page 13
C. Daily PMP according to Hershfield’s Formula
Station Pyr M S K PMP (Hershfield) PMP/Max PMP/Pyr PMP/MAqaba 29,5 11,4 8,9 20,4 193 4,54 6,54 16,93 Ghor Safi 77 17,3 11,0 19,7 234 4,26 3,04 13,54 Zarqa 144 13,5 2,0 20,1 Mafraq 162 21,4 9,1 19,3 197 4,28 1,21 9,19 Wadi Mousa 179 33,4 13,6 18,3 282 4,24 1,57 8,43 Tafileh / Eiss 242 35,4 13,9 18,1 287 5,13 1,18 8,09 Deir Alla 282 35,1 14,1 18,1 291 3,42 1,03 8,27 Shoubak 314 50,4 18,1 17,2 361 3,61 1,15 7,15 Er Rabbah 337 52,7 21,6 17,0 421 3,90 1,25 7,98 Madaba 350 46,9 17,1 17,4 343 4,03 0,98 7,32 Baqura 394 44,5 24,4 17,5 471 2,95 1,20 10,60 Amman Airport 414 39,3 15,0 17,8 307 3,84 0,74 7,82 Irbed 472 48,5 16,0 17,3 324 3,09 0,69 6,69 Salt 556 63,2 20,5 16,5 401 3,65 0,72 6,35
19. The first graph of Box 2 shows that the monthly occurrence of yearly maximum rainfall is similar for Aqaba initial sample (n=49) and for the final sample (n=210).
20. The second graph illustrates that, except Zarqa, the final sample is composed of data originating from any of the considered rain gauges. The regional sample is therefore representative of occurrence of large storms over the whole area.
21. The third and fourth graphs shows the transposition of the station samples to Aqaba conditions.
22. The fifth graph show the final 210 year sample at Aqaba. One rainfall event of about 70 mm/day can be considered as an outlier. Comments from the Israeli side state that on 20 February 1975, more than 60 mm of rain came down in Eilat within approximately 6 hours. A similar occurrence happened on 18 January 2010. Thus, 70 mm in one day at Aqaba could not be an outlier. Our position is that our estimate of 70 mm in Aqaba is based upon a 210 station‐year composite sample transposed to Aqaba conditions. Among the 49 daily peaks observed at Aqaba, 46 yearly maximums are less than 22 mm/day whereas three peaks are within 33 and 43 mm/day. With respect to these data, the 70 mm event, transposed from Baqura is rather abnormal. Within the regional sample of 210 station‐years, this event is still above the trend, the second highest value being 50 mm/day. The final Aqaba sample size (210 station‐years) is four times the initial size which allows for a proper determination of extreme rainfalls. The Gumbel distribution is widely used in engineering studies and we feel confident in the results obtained with this distribution.
23. The fit of the final sample to a Gumbel distribution allows for finding the final results given in Box 2. The PMP is rescaled to 228 mm/day and the 10 000‐year rainfall amounts to 87 mm/day whereas the 1 000‐year rainfall is 68 mm/day.

Red Sea – Dead Sea Water Conveyance Study Program Draft Final Feasibility Study Report (12 147 RP 04), April 2011
Appendix G – Hydrology and Flood Studies Report
COYNE ET BELLIER in association with TRACTEBEL ENGINEERING and KEMA Appemdix G ‐ Page 14
Box 2 Wadi Yutum Floods ‐ Aplication of the Station‐Year Approach to Aqaba Case
Aqaba - Occurrence of Maximum Daily Rainfall
0
5
10
15
20
25
30
Sept Oct Nov Dec Jan Feb Mar Apr May June July Aug
Months
Perc
enta
ge o
f Occ
urre
nce
(%)
% (n=210)% (n=49)
Composition of the Regional Sample
0
2
4
6
8
10
12
14
16
18
20
22
Aqaba
Ghor S
afi
Zarqa
Mafraq
Wadi M
ousa
Tafileh
/ Eiss
Deir A
lla
Shoub
ak
Er Rab
bah
Madab
a
Baqura
Amman Airp
ortIrb
ed Salt
Stations
Perc
cent
age
(%) % Initial (n=577)
% Final (n=210)

Red Sea – Dead Sea Water Conveyance Study Program Draft Final Feasibility Study Report (12 147 RP 04), April 2011
Appendix G – Hydrology and Flood Studies Report
COYNE ET BELLIER in association with TRACTEBEL ENGINEERING and KEMA Appemdix G ‐ Page 15
Rainfall Data Transposed to Aqaba Conditions (1 of 2)
0
5
10
15
20
25
30
35
40
45
50
-2 -1 0 1 2 3 4 5
Gumbel Variate u (Gumbel)
Dai
ly R
ainf
all P
dmx
(mm
/day
)
AQABAAq-Ghor SafiAq-ZarqaAq-MafraqAq-Wadi MousaAq-TafilehAq-Er Rabbah
Daily Rainfall Data Transposed to Aqaba Conditions (2 of 2)
0
10
20
30
40
50
60
70
80
-2 -1 0 1 2 3 4 5
Daily Rainfall Pdmx (mm/day)
Gum
bel V
aria
te u
(Gum
bel)
AQABAAq-Deir AllaAq-ShoubaqAq-MadabaAq-BaquraAq-IrbedAq-SaltAq-Ammam

Red Sea – Dead Sea Water Conveyance Study Program Draft Final Feasibility Study Report (12 147 RP 04), April 2011
Appendix G – Hydrology and Flood Studies Report
COYNE ET BELLIER in association with TRACTEBEL ENGINEERING and KEMA Appemdix G ‐ Page 16
Aqaba - Daily Rainfall vs. Gumbel Variate - 210 Station-Years
0
10
20
30
40
50
60
70
80
-3 -2 -1 0 1 2 3 4 5 6
Gumbel Variate u(Gumbel)
Dai
ly R
ainf
all P
dmx
(mm
/day
)
PdmxGumbel
T F Gumbel Fit(years) (mm/day)
2 0,5000 13 5 0,8000 23
10 0,9000 29 20 0,9500 35 50 0,9800 43
100 0,9900 49 200 0,9950 54 500 0,9980 62
1 000 0,9990 68 2 000 0,9995 74 5 000 0,9998 81
10 000 0,9999 87 PMP Readjusted 228 PMP / P10 000 2,62 PMP / Pmax 3,28
2.2.2. Storm Profile and Area Reduction Factor
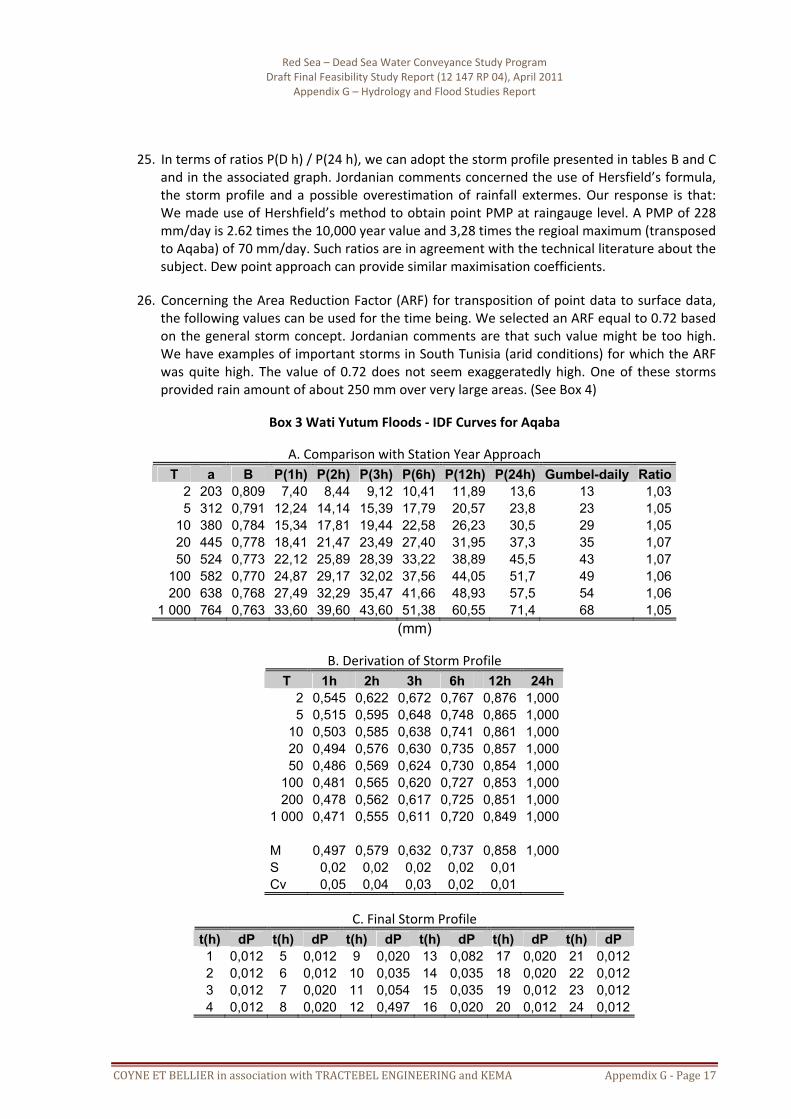
24. Concerning the storm profile, the Intensity – Duration – Frequency (IDF) coefficients of Aqaba (obtained from Jordanian sources) provide the results given in Box 3. The IDF approach for a storm duration of 24 hour is consistent with the station‐year approach to the maximum daily rainfall.
Red Sea – Dead Sea Water Conveyance Study Program Draft Final Feasibility Study Report (12 147 RP 04), April 2011
Appendix G – Hydrology and Flood Studies Report
COYNE ET BELLIER in association with TRACTEBEL ENGINEERING and KEMA Appemdix G ‐ Page 17
25. In terms of ratios P(D h) / P(24 h), we can adopt the storm profile presented in tables B and C and in the associated graph. Jordanian comments concerned the use of Hersfield’s formula, the storm profile and a possible overestimation of rainfall extermes. Our response is that: We made use of Hershfield’s method to obtain point PMP at raingauge level. A PMP of 228 mm/day is 2.62 times the 10,000 year value and 3,28 times the regioal maximum (transposed to Aqaba) of 70 mm/day. Such ratios are in agreement with the technical literature about the subject. Dew point approach can provide similar maximisation coefficients.
26. Concerning the Area Reduction Factor (ARF) for transposition of point data to surface data, the following values can be used for the time being. We selected an ARF equal to 0.72 based on the general storm concept. Jordanian comments are that such value might be too high. We have examples of important storms in South Tunisia (arid conditions) for which the ARF was quite high. The value of 0.72 does not seem exaggeratedly high. One of these storms provided rain amount of about 250 mm over very large areas. (See Box 4)
Box 3 Wati Yutum Floods ‐ IDF Curves for Aqaba
A. Comparison with Station Year Approach T a B P(1h) P(2h) P(3h) P(6h) P(12h) P(24h) Gumbel-daily Ratio
2 203 0,809 7,40 8,44 9,12 10,41 11,89 13,6 13 1,035 312 0,791 12,24 14,14 15,39 17,79 20,57 23,8 23 1,05
10 380 0,784 15,34 17,81 19,44 22,58 26,23 30,5 29 1,0520 445 0,778 18,41 21,47 23,49 27,40 31,95 37,3 35 1,0750 524 0,773 22,12 25,89 28,39 33,22 38,89 45,5 43 1,07
100 582 0,770 24,87 29,17 32,02 37,56 44,05 51,7 49 1,06200 638 0,768 27,49 32,29 35,47 41,66 48,93 57,5 54 1,06
1 000 764 0,763 33,60 39,60 43,60 51,38 60,55 71,4 68 1,05(mm)
B. Derivation of Storm Profile
T 1h 2h 3h 6h 12h 24h 2 0,545 0,622 0,672 0,767 0,876 1,0005 0,515 0,595 0,648 0,748 0,865 1,000
10 0,503 0,585 0,638 0,741 0,861 1,00020 0,494 0,576 0,630 0,735 0,857 1,00050 0,486 0,569 0,624 0,730 0,854 1,000
100 0,481 0,565 0,620 0,727 0,853 1,000200 0,478 0,562 0,617 0,725 0,851 1,000
1 000 0,471 0,555 0,611 0,720 0,849 1,000 M 0,497 0,579 0,632 0,737 0,858 1,000S 0,02 0,02 0,02 0,02 0,01 Cv 0,05 0,04 0,03 0,02 0,01
C. Final Storm Profile
t(h) dP t(h) dP t(h) dP t(h) dP t(h) dP t(h) dP 1 0,012 5 0,012 9 0,020 13 0,082 17 0,020 21 0,012 2 0,012 6 0,012 10 0,035 14 0,035 18 0,020 22 0,012 3 0,012 7 0,020 11 0,054 15 0,035 19 0,012 23 0,012 4 0,012 8 0,020 12 0,497 16 0,020 20 0,012 24 0,012

Red Sea – Dead Sea Water Conveyance Study Program Draft Final Feasibility Study Report (12 147 RP 04), April 2011
Appendix G – Hydrology and Flood Studies Report
COYNE ET BELLIER in association with TRACTEBEL ENGINEERING and KEMA Appemdix G ‐ Page 18
Aqaba - Storm profile
0
0,1
0,2
0,3
0,4
0,5
0,6
1 2 3 4 5 6 7 8 9 10 11 12 13 14 15 16 17 18 19 20 21 22 23 24
Time step (hours)
Rat
io d
p/Pt
ot
Box 4 Wadi Yutum Floods ‐ Area Reduction Factor
A (km²) General Storm Thunderstorm0 1,00 1,00
13 1,00 0,92 26 1,00 0,89 52 0,99 0,84 78 0,98 0,81
104 0,97 0,78 130 0,96 0,75 259 0,92 0,68 389 0,89 0,63 518 0,87 0,61 648 0,85 0,58 777 0,84 0,56 907 0,83 0,54
1 036 0,83 0,52 1 166 0,82 0,51 1 295 0,81 0,49 1 554 0,80 2 267 0,78
Source: Adapted from Design of Small Dam (1973, 1974)

Red Sea – Dead Sea Water Conveyance Study Program Draft Final Feasibility Study Report (12 147 RP 04), April 2011
Appendix G – Hydrology and Flood Studies Report
COYNE ET BELLIER in association with TRACTEBEL ENGINEERING and KEMA Appemdix G ‐ Page 19
2.2.3. Computation of Flood Hydrographs for Wadi Yutum
27. Concerning Coefficient of Runoff, we made use of the USSCS approach and we have considered the following CN‐values (for AMC‐II).
• Soil Group A (very permeable): CN = 65.
• Soil Group B (permeable): CN = 75.
• Soil Group C (impervious): CN = 80.
• Soil Group D (very impervious): CN = 85.
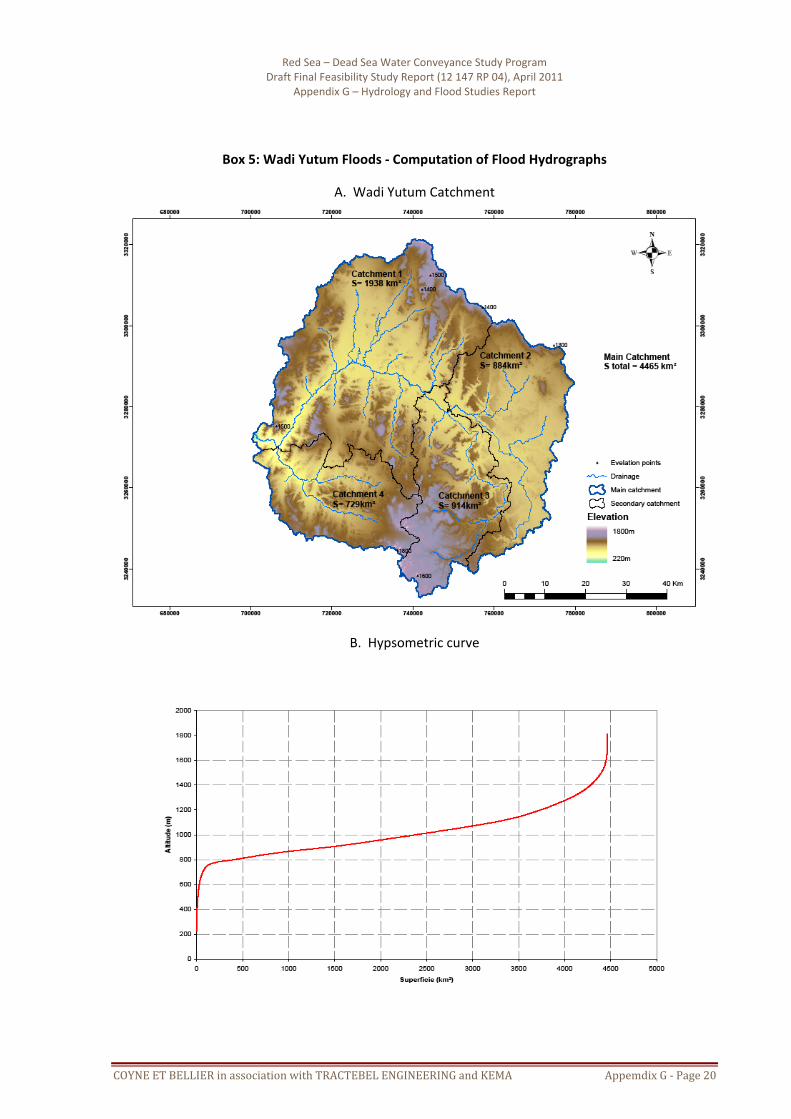
28. Making use of the preceding material enables to compute the flash floods. Provided to know: the drainage area, the length of the watercourse and the difference of elevation along the water course. Several hypotheses might be needed to investigate the flood risks. The following graphs illustrate the analysis of the wadi Yutum. The investigated catchment has an area of 4 465 km² (Wadi Yutum) and it has a range of elevation from 200 masl to 1 800 masl. A time of concentration tc of 18 hours was found relevant and a CN value of 79 was selected, taking into account the sandy low flats existing in some parts of the catchment. The catchment map, below, shows clearly that A/B and C/D soil groups cover equivalent areas which leads to a catchment value of 79,as said previously. See Box 5.
Red Sea – Dead Sea Water Conveyance Study Program Draft Final Feasibility Study Report (12 147 RP 04), April 2011
Appendix G – Hydrology and Flood Studies Report
COYNE ET BELLIER in association with TRACTEBEL ENGINEERING and KEMA Appemdix G ‐ Page 20
Box 5: Wadi Yutum Floods ‐ Computation of Flood Hydrographs
A. Wadi Yutum Catchment
B. Hypsometric curve

Red Sea – Dead Sea Water Conveyance Study Program Draft Final Feasibility Study Report (12 147 RP 04), April 2011
Appendix G – Hydrology and Flood Studies Report
COYNE ET BELLIER in association with TRACTEBEL ENGINEERING and KEMA Appemdix G ‐ Page 21
C. Obtained Results
T Qp K(Qp)(years) (m3/s)
10 330 2,0020 460 2,3250 640 2,65
100 780 2,86500 1 140 3,24
1 000 1 310 3,375 000 1 710 3,64
10 000 1 890 3,74 PMF 6 780 5,01PMF/10 000 3,59
Note: K(Qp) is the Francou‐Rodier’s Flood Index.
Flash Floods - Aqaba Area
0100200300400500600700800900
1 0001 1001 2001 3001 4001 5001 6001 7001 8001 9002 000
0 6 12 18 24 30 36 42 48 54 60 66 72 78 84 90 96 102 108 114 120
Time t (hours)
Dis
char
ge Q
(t) (m
3/s) Q-10 yr
Q-20-yrQ-50-yrQ-100 yrQ-500 yrQ-1 000 yrQ-5 000 yrQ-10 000 yr
Assumptions:1. A = 4 465 km².2. ARF= 0.72 (General storm)3. tc = 18 h.3. CN = 79.
29. On 12 February 2006, the city of Aqaba experienced a large flood from Wadi Yutum. No other wadis flooded during this event. Several people drowned within the Wadi Yutum flow way and the Aqaba waste water treatment plant (WWTP) was put out of operation for several months. It was estimated2 that the flood had a peak flow of about 550 m3/s.
30. MWH made an appraisal of Wadi Yutum floods based upon the following assumptions:
• Contributing area of 1 300 km².
• Storm duration of 6 hours.

Red Sea – Dead Sea Water Conveyance Study Program Draft Final Feasibility Study Report (12 147 RP 04), April 2011
Appendix G – Hydrology and Flood Studies Report
COYNE ET BELLIER in association with TRACTEBEL ENGINEERING and KEMA Appemdix G ‐ Page 22
31. A comparison between the general storm approach and the thunderstorm approach is given below. The thunderstorm approach (MWH) provides greater estimates for usual return periods. It concludes to a return period of 10 years for the disastrous flood of February 2006. The global approach (RSDS Project) provides smaller estimates for usual return periods:
• 330 m3/s for T=10 yr to be compared to 338 m3/s for T=5 yr (thunderstorm, MWH).
• 460 m3/s for T=20 yr to be compared to 528 m3/s for T = 10 yr.
32. With the global approach, the 2006 flood would have had a return period in the range of 20 to 50 years. It should be noticed that different databases and different assumptions yield contrasted results. However, both the global approach and the thunderstorm approach provide very important flows for Wadi Yutum.
Box 6 Wadi Yutum Floods- Comparison between Global and Thunderstorm Approaches
A. Comparison of Storm Precipitation
T Global Thunderstorm(yr) (mm) (mm)
2 15 5 26
10 24 34 20 28 25 45 50 35 52
100 39 59 500 50
1 000 55 5 000 66
10 000 71 PMP 186
B. Comparison of Peak Discharges
T Global Thunderstorm
(yr) (m3/s) (m3/s) 2 118 5 338
10 330 528 20 460 25 880 50 640 1 100
100 780 1 370 500 1 140
1 000 1 310 5 000 1 710
10 000 1 890 PMF 6 780 PMF/10 000 3,59

Red Sea – Dead Sea Water Conveyance Study Program Draft Final Feasibility Study Report (12 147 RP 04), April 2011
Appendix G – Hydrology and Flood Studies Report
COYNE ET BELLIER in association with TRACTEBEL ENGINEERING and KEMA Appemdix G ‐ Page 23
33. Following a comment by the Israelis, we made use of the Francou‐Rodier’s coefficients to compare our results about Yutum floods with Israeli flood data. This comparison, shown below, does not indicate any risk of underestimation of flood peaks.
River Date A (km²) Qp (m3/s) K(Qp) Transposed to Yutum Pharan 08/11/1970 3 300 1 150 3,44 1 410 Pharan 21/02/1975 3 300 600 2,81 750 El Arish 21/02/1975 18 000 1 650 2,57 590
Observations T (years) A (km²) Qp (m3/s) K(Qp) Yutum 10 4 465 330 2,00 Yutum 20 4 465 460 2,33 El Arish transposed 21/02/1975 4 465 590 2,58 Yutum 50 4 465 640 2,66 Pharan transposed 21/02/1975 4 465 750 2,82 Yutum 100 4 465 780 2,86 Yutum 500 4 465 1 140 3,23 Yutum 1 000 4 465 1 310 3,37 Pharan transposed 08/11/1970 4 465 1 410 3,45 Yutum 5 000 4 465 1 710 3,64 Yutum 10 000 4 465 1 890 3,74 Yutum PMF 4 465 6 780 5,01
2.3. Floods in the Aqaba / Eilat Region
34. We made use of data quoted by Yodfat to define the catchments to be considered in addition to Wadi Yutum. We combined these additional catchments (470 km²) into three groups.
35. Then we computed flood hydrographs for several return periods (100, 1 000, 10 000 years and PMF) and for two conditions (storm centred on Wadi Yutum) and storm centred on Wadi Arava). We routed and combined these floods with Wadi Yutum using Muskingum approach. Two cases were considered for the flood routing. It appeared that the combination of floods resulted in two separate peaks. The leading peak is the Yutum peak.
2.3.1. Information about Aqaba / Eilat Region
36. Box 7 details data quoted by Yodfat about the Aqaba / Eilat region. Part A shows that there is a number of 12 catchments form the 470‐km² area contributing to Red Sea, besides Wadi Yutum. Individual peaks from these watersheds range from 236 m3/s to 983 m3/s.

Red Sea – Dead Sea Water Conveyance Study Program Draft Final Feasibility Study Report (12 147 RP 04), April 2011
Appendix G – Hydrology and Flood Studies Report
COYNE ET BELLIER in association with TRACTEBEL ENGINEERING and KEMA Appemdix G ‐ Page 24
37. Part B quotes the results of flood routing reported by Yodfat. At the upstream end (19 km from the sea), the flood peak is about 890 m3/s. It increases to 1 600 m3/s at 13 km from the sea. The peak reduces to 779 m3/s at 2,6 km from the sea. These estimates do not take into consideration the possible Wadi Yutum contribution for which a flood potential of 1 300 m3/s is quoted.
38. Part C details the characteristics adopted for the three groups of catchments considered in our assessment. In this part, K, X, C1 and C2 are parameters in Muskingum approach. We see that two cases of flood routing have been considered. The first corresponds to a velocity of 20 km/hour, and the second case corresponds to 10 km/h. To be on the safe side, we considered that infiltration and evaporation were negligible.

Red Sea – Dead Sea Water Conveyance Study Program Draft Final Feasibility Study Report (12 147 RP 04), April 2011
Appendix G – Hydrology and Flood Studies Report
COYNE ET BELLIER in association with TRACTEBEL ENGINEERING and KEMA Appemdix G ‐ Page 25
Box 7 Aqaba / Eilat Region ‐ Floods of Small Watersheds

Red Sea – Dead Sea Water Conveyance Study Program Draft Final Feasibility Study Report (12 147 RP 04), April 2011
Appendix G – Hydrology and Flood Studies Report
COYNE ET BELLIER in association with TRACTEBEL ENGINEERING and KEMA Appemdix G ‐ Page 26
A. Watersheds in Aqaba / Eilat Region – Individual Flood Peaks
Nb Watershed A Qp Qp/A Bank (km²) (m3/s) (m3/s/km²)
12 W. Mahatadi 46,8 589 12,59 Left 11 20,7 398 19,23 Left 10 26,1 445 17,05 Left
9 W. Askari 7,0 236 33,71 Left 8 17,6 368 20,91 Left 7 W. Mil'an 28,0 460 16,43 Left 6 30,0 476 15,87 Left 5 Rekhem 135,2 983 7,27 Right
4-3 Ora 12,0 306 25,50 Right 4-2 Evrona 39,4 543 13,78 Right 4-1 Amram 24,0 427 17,79 Right
3 Shkoret 24,7 433 17,53 Right 2 Shkoret Hills 13,0 318 24,46 Right 1 Roded 45,6 582 12,76 Right
470,1 Area (km²) Area (%) Left 176,2 37,5 Right 293,9 62,5 Total 470,1 100
B. Watersheds in Aqaba / Eilat Region – Flood Routing
Nb Watershed D A (km²) Qp Qp/A dA dQp L Slope tc Group
(km) (km²) (m3/s) (km²) (m3/s) (km) (hours) 5 Rekhem 19 135,2 889 6,58 135,2 889 24 0,0354 2,76 A 5+12 W. Mahatadi 19,1 182,0 934 5,13 46,8 45 15,5 0,0742 1,48 A 5+12+11 11 16,1 202,7 1 111 5,48 20,7 177 11 0,0782 1,12 B Previuous + 4-3 Ora 16,3 214,7 1 339 6,24 12,0 228 4,5 0,0667 0,60 B Previous +10 10 13,4 240,8 1 604 6,66 26,1 265 12 0,0875 1,14 B Previous + 4-2 Evrona 12,8 280,2 1 573 5,61 39,4 -31 6 0,0583 0,78 B Previous + 9 W. Askari 11,4 287,2 1 331 4,63 7,0 -242 8,5 0,1294 0,75 B Previous + 8 8 11 304,8 1 337 4,39 17,6 6 9,5 0,1158 0,86 B Previous + 7 W. Mil'an 9,7 332,8 1 004 3,02 28,0 -333 16,5 0,0727 1,57 C Previous + 4-1 Amram 8 356,8 847 2,37 24,0 -157 6,5 0,0708 0,77 C Previous + 6 6 7,7 386,8 823 2,13 30,0 -24 14,5 0,0793 1,37 C Previous + 3 + 2 3+2 5 424,5 784 1,85 37,7 -39 11 0,0700 1,16 C Previous + 1 1 2,6 470,1 779 1,66 45,6 -5 17 0,0459 1,92 C

Red Sea – Dead Sea Water Conveyance Study Program Draft Final Feasibility Study Report (12 147 RP 04), April 2011
Appendix G – Hydrology and Flood Studies Report
COYNE ET BELLIER in association with TRACTEBEL ENGINEERING and KEMA Appemdix G ‐ Page 27
C. Watersheds in Aqaba / Eilat Area – Characteristics of the 3 Groups of Catchments
Group A tc tp D K X C1 C2 Remarks (km²) (h) (h) (km) A 182,0 2,76 2,16 19,1 0,96 0,2 0,79 0,24 V = 20 km/h B 122,8 1,14 1,19 11,0 0,55 0,2 1,06 0,41 V = 20 km/h C 165,3 1,92 1,65 2,6 0,13 0,2 1,66 0,78 V = 20 km/h Yutum 4 465 10,0 0,50 0,2 1,11 0,44 V = 20 km/h A 182,0 2,76 2,16 19,1 1,91 0,2 0,49 0,06 V = 10 km/h B 122,8 1,14 1,19 11,0 1,10 0,2 0,72 0,20 V = 10 km/h C 165,3 1,92 1,65 2,6 0,26 0,2 1,41 0,63 V = 10 km/h Yutum 4 465 10,0 1,00 0,2 0,77 0,23 V = 10 km/h
2.3.2. Floods at the Mouth of Arava – Storm Centered on Wadi Yutum
39. Box 8 details the results obtained for the case of a storm centred on wadi Yutum. We can see that the case V = 10 km/h provides the greatest flood attenuation, which remain very small for the Yutum catchment. The resulting flood hydrographs are two‐peaked hydrographs. The first peak comes from the Arava corridor whereas the second peak comes from Wadi Yutum. The 100‐year flood has a peak of about 800 m3/s that is due to Yutum flood. The Arava flood, in this case, is about 200 m3/s. The 1 000‐year flood attains 1 300 m3/s (Yutum flood) whereas the Arava flood is about 400 m3/s (half the results quoted by Yodfat). For the PMF, the global peak is about 6 760 m3/s and the secondary peak from Arava is about 2 920 m3/s.

Red Sea – Dead Sea Water Conveyance Study Program Draft Final Feasibility Study Report (12 147 RP 04), April 2011
Appendix G – Hydrology and Flood Studies Report
COYNE ET BELLIER in association with TRACTEBEL ENGINEERING and KEMA Appemdix G ‐ Page 28
Box 8 Aqaba / Eilat Region ‐ Global Flood Hydrograph ‐ Storm Centered on Yutum
Items Group A Group B Group C Yutum Global A (km²) 182,0 122,8 165,3 4 465 4 935 T (years) Qp(T) (m3/s) 100-yr US 70 68 82 780 100-yr DS - 20 km/h 63 63 63 777 778 100-yr DS - 10 km/h 53 52 74 775 777 1 000-yr US 148 156 180 1 309 1 000-yr DS - 20 km/h 135 150 177 1 304 1 305 1 000-yr DS - 10 km/h 115 115 166 1 302 1 304
10 000-yr US 247 263 297 1 893 10 000-yr DS - 20 km/h 218 247 292 1 885 1 886 10 000-yr DS - 10 km/h 189 193 275 1 882 1 886 PMF US 1 150 1 219 1 331 6 781 PMF DS - 20 km/h 1 005 1 112 1 330 6 759 6 768 PMF DS - 10 km/h 859 896 1 264 6 744 6 755
Aqaba / Eilat- Global Flood Hydrographs - Storm Centered on Yutum
0
200
400
600
800
1 000
1 200
1 400
1 600
1 800
2 000
0 6 12 18 24 30 36 42 48 54 60 66 72 78 84 90 96 102
Time t (hours)
Dis
char
ge Q
(t) (m
3/s)
0
1 000
2 000
3 000
4 000
5 000
6 000
7 000
8 000
9 000
10 000
Dis
char
ge (m
3/s)
- PM
F Sc
ale
Q-100 yrQ-1 000 yrQ-10 000 yrPMF
Case V = 10 km/h

Red Sea – Dead Sea Water Conveyance Study Program Draft Final Feasibility Study Report (12 147 RP 04), April 2011
Appendix G – Hydrology and Flood Studies Report
COYNE ET BELLIER in association with TRACTEBEL ENGINEERING and KEMA Appemdix G ‐ Page 29
2.3.3. Floods at the Mouth of Arava – Storm Centered on Arava
40. Box 9 details the results obtained for the case of a storm centred on Arava. We can see that the case V = 10 km/h provides the greatest flood attenuation, which remain very small for the Yutum catchment. The resulting flood hydrographs are two‐peaked hydrographs. The first peak comes from the Arava corridor whereas the second peak comes from Wadi Yutum. The 100‐year flood has a peak of about 750 m3/s that is due to Yutum flood. The Arava flood, in this case, is about 440 m3/s. The 1 000‐year flood attains 1 250 m3/s (Yutum flood) whereas the Arava flood is about 800 m3/s (almost equal to the results quoted by Yodfat). For the PMF, the global peak is about 6 500 m3/s and the secondary peak from Arava is about 4 540 m3/s.
Box 9 Aqaba / Eilat Region ‐ Global Flood Hydrograph ‐ Storm Centered on Arava
Items Group A Group B Group C Yutum Global A (km²) 182,0 122,8 165,3 4 465 4 935 T (years) Qp(T) (m3/s) 100-yr US 173 183 210 748 100-yr DS - 20 km/h 156 175 207 746 747 100-yr DS - 10 km/h 134 135 194 744 747 1 000-yr US 330 351 393 1 257 1 000-yr DS - 20 km/h 289 328 386 1 252 1 254 1 000-yr DS - 10 km/h 251 257 367 1 250 1 254
10 000-yr US 502 535 593 1 817 10 000-yr DS - 20 km/h 440 495 589 1 810 1 812 10 000-yr DS - 10 km/h 379 392 557 1 807 1 813 PMF US 1 914 2 022 2 193 6 510 PMF DS - 20 km/h 1 672 1 833 2 196 6 488 6 503 PMF DS - 10 km/h 1 424 1 488 2 092 6 474 6 492
Note: US = Upstream – DS = Downstream (at Red Sea)

Red Sea – Dead Sea Water Conveyance Study Program Draft Final Feasibility Study Report (12 147 RP 04), April 2011
Appendix G – Hydrology and Flood Studies Report
COYNE ET BELLIER in association with TRACTEBEL ENGINEERING and KEMA Appemdix G ‐ Page 30
Aqaba / Eilat - Global Flood Hydrographs - Storm Centered on Arava
0
200
400
600
800
1 000
1 200
1 400
1 600
1 800
2 000
0 6 12 18 24 30 36 42 48 54 60 66 72 78 84 90 96 102
Time t (hours)
Dis
char
ge Q
(t) (
m3/
s)
0
1 000
2 000
3 000
4 000
5 000
6 000
7 000
8 000
9 000
10 000
Dis
char
ge -
PMF
Scal
e - (
m3/
s)Q-100 yrQ-1 000 yrQ-10 000 yrPMF
Case V = 10 km/h
2.4. Discussion of Results
41. As said previously about the Wadi Yutum floods, different assumptions and different database are likely to produce different results. For the global flood hydrographs, we obtained two‐peaks floods which are broadly consistent with the results from other studies and which are consistent with the results obtained for the floods at the entrance of Truce Canal.

Red Sea – Dead Sea Water Conveyance Study Program Draft Final Feasibility Study Report (12 147 RP 04), April 2011
Appendix G – Hydrology and Flood Studies Report
COYNE ET BELLIER in association with TRACTEBEL ENGINEERING and KEMA Appemdix G ‐ Page 31
3. CROSS DRAINAGE OF CANAL SECTIONS
3.1. Objectives and Content
42. There are a number of canal sections for which cross drainage must be considered; In fact, three groups of catchments involving cross drainage features can be identified:
• A first group is located upstream of Ghor Safi area. Tafileh raingauge is located in this area.
• A second group is located in the area between Shoubaq and Wadi Musa.
• A third group is located between Wadi Musa and Ras El Naqb.
43. Using the DTM, we have identified a total number of 141 catchments of various shapes along the canal sections. The present section concerns the most important of these catchments. (See Box 10). Its objectives are to compute design storms and design floods of various return periods. Thus, the successive steps of the study are:
• Analysis of daily rainfall.
• Determination of storm profiles.
• Description of catchments under study.
• Computation of flood hydrographs.
• Analysis of results.
44. We added supporting documents in order to enable the reader to make up his own mind about the various topics addressed in this section.
45. As shown in the Harza report, the wadis contributing to the Wadi Araba / Arava originate in the steep barren hills and mountains. In the mountains, the wadi channels are well defined and deeply incised. Very often, flood flows in the mountain wadis have a short duration, high velocity and large amounts of suspended sediments.
46. In the alluvial fan areas, the main wadi channels separate in numerous smaller channels where small flows can infiltrate rapidly. In case of important floods, these smaller channels are deeply eroded and their banks are overtopped.

Red Sea – Dead Sea Water Conveyance Study Program Draft Final Feasibility Study Report (12 147 RP 04), April 2011
Appendix G – Hydrology and Flood Studies Report
COYNE ET BELLIER in association with TRACTEBEL ENGINEERING and KEMA Appemdix G ‐ Page 32
Box 10 Cross Drainage ‐ Main Catchments along the Canal Sections
A. In Ghor Safi Area
Nb A Zmin Zmax Zavg dZ Lmax I (km²) (m) (m) (m) (m) (km) (m/m)
4 85,45 -392 929 -147 1 321 15,89 0,0831 5 161,23 -364 1 517 753 1 881 38,61 0,0487 6 34,69 -358 549 -95 907 13,70 0,0662 7 185,75 -336 1 605 734 1 941 43,82 0,0443
B. Between Shoubak and Wadi Moussa
Nb A Zmin Zmax Zavg dZ Lmax I (km²) (m) (m) (m) (m) (km) (m/m)
14 16,77 189 1 555 857 1 366 12,27 0,1113 19 15,15 185 1 553 806 1 368 10,24 0,1336 22 10,98 198 1 139 683 941 9,54 0,0986 37 79,17 186 1 725 1 086 1 539 22,62 0,0680 59 11,15 196 1 082 626 886 8,50 0,1042 74 64,80 198 1 733 968 1 535 19,59 0,0784 89 148,58 342 1 732 1 107 1 390 24,99 0,0556
C. Between Wadi Musa an Ras An Naqb
Nb A Zmin Zmax Zavg dZ Lmax I (km²) (m) (m) (m) (m) (km) (m/m)
93 147 195 1 722 1 117 1 527 38,83 0,0393 115 59 197 1 309 576 1 112 17,25 0,0645 122 74 199 1 440 742 1 241 23,09 0,0537 123 263 207 1 661 969 1 454 39,41 0,0369 133 34 209 1 089 541 880 13,49 0,0652 141 54 219 1 166 663 947 14,51 0,0653

Red Sea – Dead Sea Water Conveyance Study Program Draft Final Feasibility Study Report (12 147 RP 04), April 2011
Appendix G – Hydrology and Flood Studies Report
COYNE ET BELLIER in association with TRACTEBEL ENGINEERING and KEMA Appemdix G ‐ Page 33
3.2. Maximum Daily Rainfall
47. Following a comment by the Jordanian side, we found logical to present a general description of rainfall occurrence in the study area at large. The study area is situated in a region in which climatic conditions exhibit a high degree of spatial variability, from humid Mediterranean to hyper‐arid desert environments. The study area is situated in the driest part of the region, in which rainfall is below 100 mm per year, and declines from north to south, with historical mean annual rainfall at Aqaba, in the far south of the study area being less than 30mm/yr. Locally, climate is heavily influenced by topography, and temperature and rainfall can exhibit large variations over short distances as a result of elevation. In the north of the study area the Dead Sea exerts a strong influence on local climatic conditions. Rainfall within the study area and the wider region is negligible during the summer months, when the large‐scale atmospheric circulation is dominated by subsidence associated with sub‐tropical anticylonic systems. The vast majority of rainfall occurs in winter, with some rainfall in spring and autumn. In Jordan, the proportions of rainfall falling in winter, spring and autumn respectively are 63%, 23% and 14% for the northern uplands, 63%, 24% and 12% for the central area and southern uplands, and 54%, 25% and 21% for the lowland, steppe and desert areas. Winter rainfall in the study area is predominantly associated with the passage of Mediterranean cyclones over the EM and into the Middle East, and with the intrusion of high pressure systems and polar air masses into the region. Heavy rainfall events are generally associated with the southward displacement of the polar front jet and its interaction with the high‐level (upper tropospheric) tropical jet streami. Rainfall is also associated with certain configurations of the Red Sea Trough (RST), a region of low‐pressure that extends north from the Red Sea towards the eastern Mediterranean at lower atmospheric levels. The RST is part of a wider region of low pressure extending over northern Africa and the western and southern regions of Asia, migrating northwards and eastwards through spring and summerii. The RST is most prevalent in spring and autumn, dominating the eastern Mediterranean region in October and disappearing in summer. The RST is generally associated with hot, dry conditions over the eastern Mediterranean and adjacent areas of the Middle East. However, it is associated with heavy showers and convective storms when it coincides with low pressure at higher levels extending southwards from the Mediterranean towards the Nileiii. This combination of conditions, known as an active Red Sea Trough, was associated with 21%, 25% and 37% of the rain days in northern, central and southern Israel for the period 1985‐1995ii. The majority of floods in the Negev Desert between 1965 and 1994 were associated either with an active RST, or with a well developed Mediterranean anticyclone accompanied by a pronounced low pressure trough at higher atmospheric levels over Syria (a Syrian low)iv. Rainfall associated with an active RST is particularly important for the study area, and explains the greater proportion of rainfall in the drier areas of Jordan (which include the study) falling in autumn, when the RST is most active.

Red Sea – Dead Sea Water Conveyance Study Program Draft Final Feasibility Study Report (12 147 RP 04), April 2011
Appendix G – Hydrology and Flood Studies Report
COYNE ET BELLIER in association with TRACTEBEL ENGINEERING and KEMA Appemdix G ‐ Page 34
48. We have performed the study of maximum daily rainfall using the station‐year approach. We considered the following stations in our analysis:
Box 11 Cross Drainage ‐ Red Sea Regional Sample – Raingauges
Station Z Pyr M S Max Min (m) (mm/year) (mm/day) (mm/day) (mm/day) (mm/day) Aqaba 2 29,5 11,4 8,9 42,5 0,8 Quweira 88,75 16,9 10,9 54,0 3,0 Ras En Naqb 1 564 148 29,3 16,3 64,0 2,6 Wadi Mousa 1 115 179 33,4 13,6 66,4 15,0 Shoubak 1 365 314 50,4 18,1 100,0 19,3 Tafileh / Eiss 1 260 203 35,4 13,9 55,9 16,6 Ghor Safi -350 77 17,3 11,0 54,9 6,6
49. The data were obtained from the Jordan Meteorological Department, the Jordan Valley
Authority and / or retrieved from MWH report about Wadi Yutum floods.
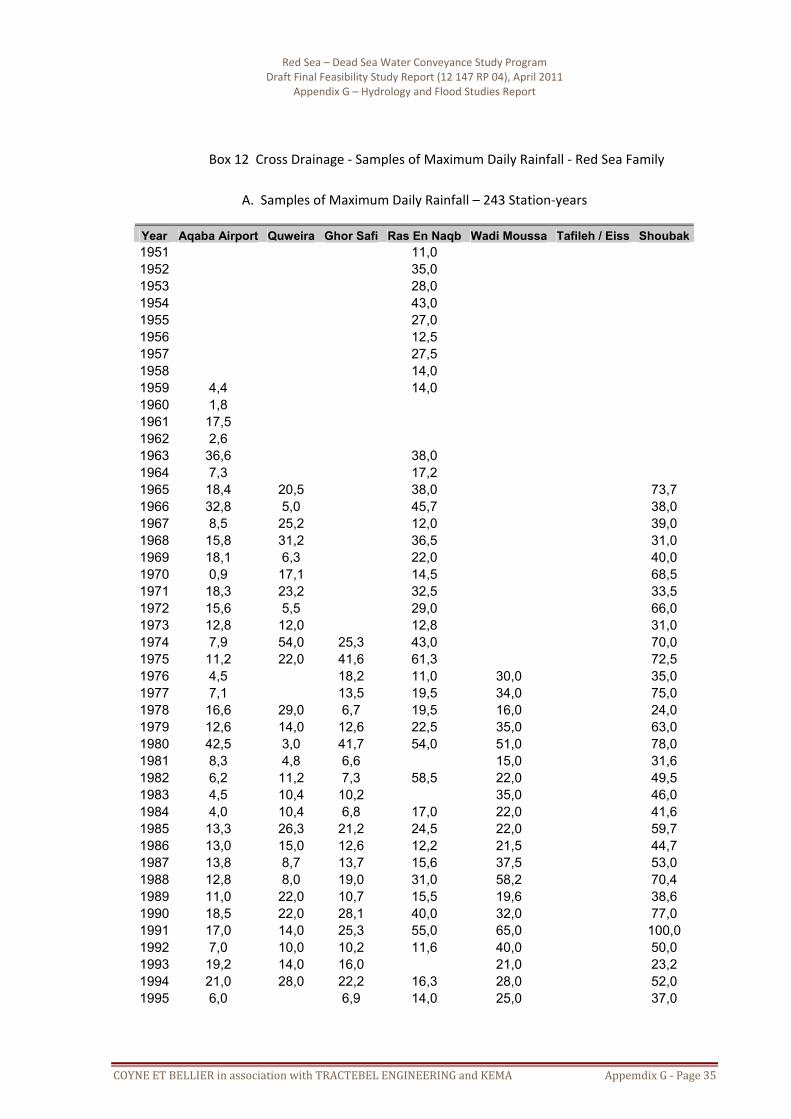
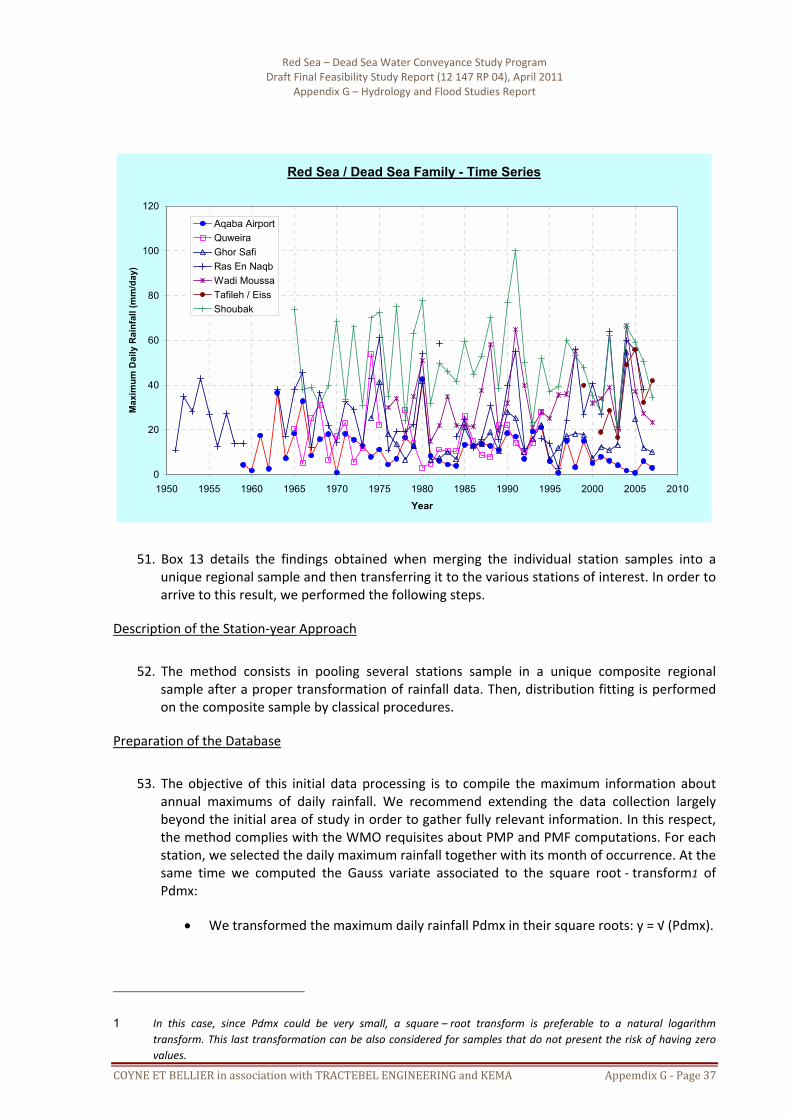
50. Box 12 consists in a presentation of the regional maximum daily rainfall database used in the course of the cross drainage study. It includes one table and two graphs.
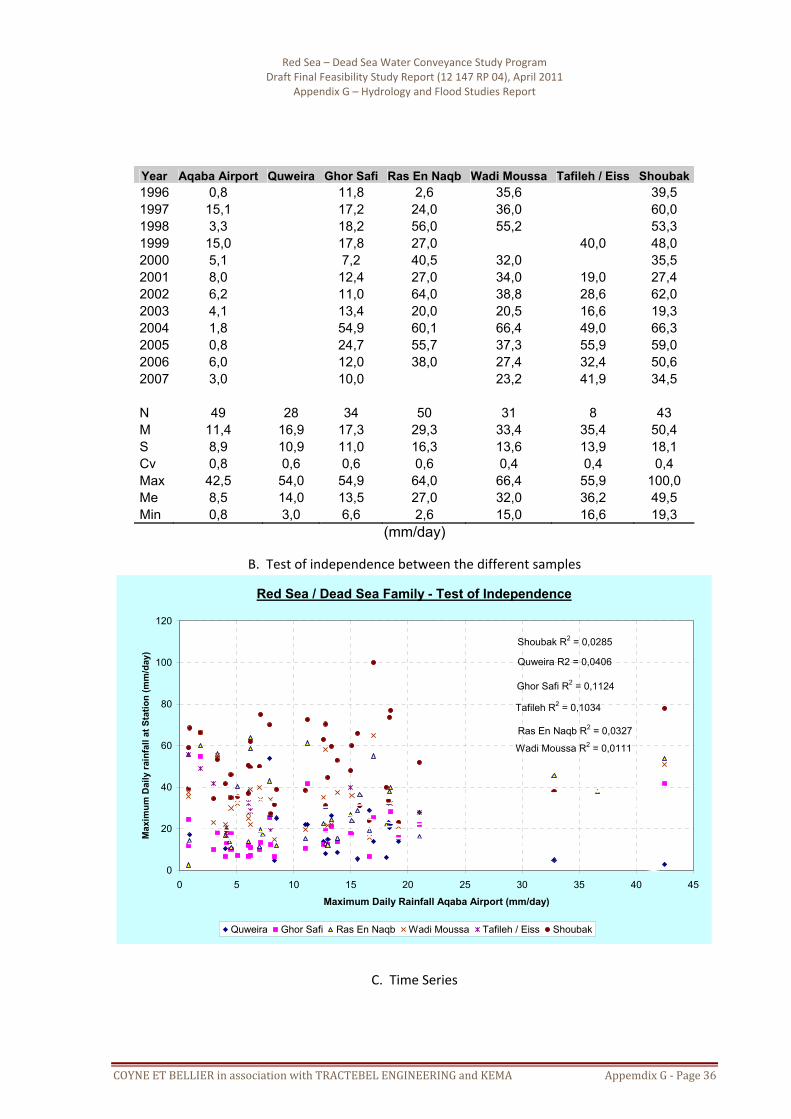
• The table gives the yearly maximums of daily rainfall at the seven stations under study. We have arranged the raingauges by increasing order of maximum daily rainfall. Thus, Aqaba, Quweira and Ghor Safi experiment rather small amounts of daily rainfall whereas Ras En Nqab, Wadi Moussa and Tafileh Eiss are wetter. Shoubak produces the greatest amount of daily rainfall. The three first stations are located in the bottom of the valley whereas the three other stations are in the djebels like Shoubak also.
• The first graph shows that there are no correlations between the various stations concerning the observed rainfall peaks for a given year. Therefore, we can pool transform‐variables of the daily rainfall into a unique regional sample of size 243.
• The second graph presents the regional database under the form of time series.
Red Sea – Dead Sea Water Conveyance Study Program Draft Final Feasibility Study Report (12 147 RP 04), April 2011
Appendix G – Hydrology and Flood Studies Report
COYNE ET BELLIER in association with TRACTEBEL ENGINEERING and KEMA Appemdix G ‐ Page 35
Box 12 Cross Drainage ‐ Samples of Maximum Daily Rainfall ‐ Red Sea Family
A. Samples of Maximum Daily Rainfall – 243 Station‐years
Year Aqaba Airport Quweira Ghor Safi Ras En Naqb Wadi Moussa Tafileh / Eiss Shoubak1951 11,0 1952 35,0 1953 28,0 1954 43,0 1955 27,0 1956 12,5 1957 27,5 1958 14,0 1959 4,4 14,0 1960 1,8 1961 17,5 1962 2,6 1963 36,6 38,0 1964 7,3 17,2 1965 18,4 20,5 38,0 73,7 1966 32,8 5,0 45,7 38,0 1967 8,5 25,2 12,0 39,0 1968 15,8 31,2 36,5 31,0 1969 18,1 6,3 22,0 40,0 1970 0,9 17,1 14,5 68,5 1971 18,3 23,2 32,5 33,5 1972 15,6 5,5 29,0 66,0 1973 12,8 12,0 12,8 31,0 1974 7,9 54,0 25,3 43,0 70,0 1975 11,2 22,0 41,6 61,3 72,5 1976 4,5 18,2 11,0 30,0 35,0 1977 7,1 13,5 19,5 34,0 75,0 1978 16,6 29,0 6,7 19,5 16,0 24,0 1979 12,6 14,0 12,6 22,5 35,0 63,0 1980 42,5 3,0 41,7 54,0 51,0 78,0 1981 8,3 4,8 6,6 15,0 31,6 1982 6,2 11,2 7,3 58,5 22,0 49,5 1983 4,5 10,4 10,2 35,0 46,0 1984 4,0 10,4 6,8 17,0 22,0 41,6 1985 13,3 26,3 21,2 24,5 22,0 59,7 1986 13,0 15,0 12,6 12,2 21,5 44,7 1987 13,8 8,7 13,7 15,6 37,5 53,0 1988 12,8 8,0 19,0 31,0 58,2 70,4 1989 11,0 22,0 10,7 15,5 19,6 38,6 1990 18,5 22,0 28,1 40,0 32,0 77,0 1991 17,0 14,0 25,3 55,0 65,0 100,0 1992 7,0 10,0 10,2 11,6 40,0 50,0 1993 19,2 14,0 16,0 21,0 23,2 1994 21,0 28,0 22,2 16,3 28,0 52,0 1995 6,0 6,9 14,0 25,0 37,0
Red Sea – Dead Sea Water Conveyance Study Program Draft Final Feasibility Study Report (12 147 RP 04), April 2011
Appendix G – Hydrology and Flood Studies Report
COYNE ET BELLIER in association with TRACTEBEL ENGINEERING and KEMA Appemdix G ‐ Page 36
Year Aqaba Airport Quweira Ghor Safi Ras En Naqb Wadi Moussa Tafileh / Eiss Shoubak1996 0,8 11,8 2,6 35,6 39,5 1997 15,1 17,2 24,0 36,0 60,0 1998 3,3 18,2 56,0 55,2 53,3 1999 15,0 17,8 27,0 40,0 48,0 2000 5,1 7,2 40,5 32,0 35,5 2001 8,0 12,4 27,0 34,0 19,0 27,4 2002 6,2 11,0 64,0 38,8 28,6 62,0 2003 4,1 13,4 20,0 20,5 16,6 19,3 2004 1,8 54,9 60,1 66,4 49,0 66,3 2005 0,8 24,7 55,7 37,3 55,9 59,0 2006 6,0 12,0 38,0 27,4 32,4 50,6 2007 3,0 10,0 23,2 41,9 34,5 N 49 28 34 50 31 8 43 M 11,4 16,9 17,3 29,3 33,4 35,4 50,4 S 8,9 10,9 11,0 16,3 13,6 13,9 18,1 Cv 0,8 0,6 0,6 0,6 0,4 0,4 0,4 Max 42,5 54,0 54,9 64,0 66,4 55,9 100,0 Me 8,5 14,0 13,5 27,0 32,0 36,2 49,5 Min 0,8 3,0 6,6 2,6 15,0 16,6 19,3
(mm/day)
B. Test of independence between the different samples
Red Sea / Dead Sea Family - Test of Independence
Quweira R2 = 0,0406
Ghor Safi R2 = 0,1124
Ras En Naqb R2 = 0,0327
Wadi Moussa R2 = 0,0111
Tafileh R2 = 0,1034
Shoubak R2 = 0,0285
0
20
40
60
80
100
120
0 5 10 15 20 25 30 35 40 45
Maximum Daily Rainfall Aqaba Airport (mm/day)
Max
imum
Dai
ly ra
infa
ll at
Sta
tion
(mm
/day
)
Quweira Ghor Safi Ras En Naqb Wadi Moussa Tafileh / Eiss Shoubak
C. Time Series
Red Sea – Dead Sea Water Conveyance Study Program Draft Final Feasibility Study Report (12 147 RP 04), April 2011
Appendix G – Hydrology and Flood Studies Report
COYNE ET BELLIER in association with TRACTEBEL ENGINEERING and KEMA Appemdix G ‐ Page 37
Red Sea / Dead Sea Family - Time Series
0
20
40
60
80
100
120
1950 1955 1960 1965 1970 1975 1980 1985 1990 1995 2000 2005 2010
Year
Max
imum
Dai
ly R
ainf
all (
mm
/day
)
Aqaba AirportQuweiraGhor SafiRas En NaqbWadi MoussaTafileh / EissShoubak
51. Box 13 details the findings obtained when merging the individual station samples into a unique regional sample and then transferring it to the various stations of interest. In order to arrive to this result, we performed the following steps.
Description of the Station‐year Approach
52. The method consists in pooling several stations sample in a unique composite regional sample after a proper transformation of rainfall data. Then, distribution fitting is performed on the composite sample by classical procedures.
Preparation of the Database
53. The objective of this initial data processing is to compile the maximum information about annual maximums of daily rainfall. We recommend extending the data collection largely beyond the initial area of study in order to gather fully relevant information. In this respect, the method complies with the WMO requisites about PMP and PMF computations. For each station, we selected the daily maximum rainfall together with its month of occurrence. At the same time we computed the Gauss variate associated to the square root ‐ transform1 of Pdmx:
• We transformed the maximum daily rainfall Pdmx in their square roots: y = √ (Pdmx).
1 In this case, since Pdmx could be very small, a square – root transform is preferable to a natural logarithm
transform. This last transformation can be also considered for samples that do not present the risk of having zero values.
Red Sea – Dead Sea Water Conveyance Study Program Draft Final Feasibility Study Report (12 147 RP 04), April 2011
Appendix G – Hydrology and Flood Studies Report
COYNE ET BELLIER in association with TRACTEBEL ENGINEERING and KEMA Appemdix G ‐ Page 38
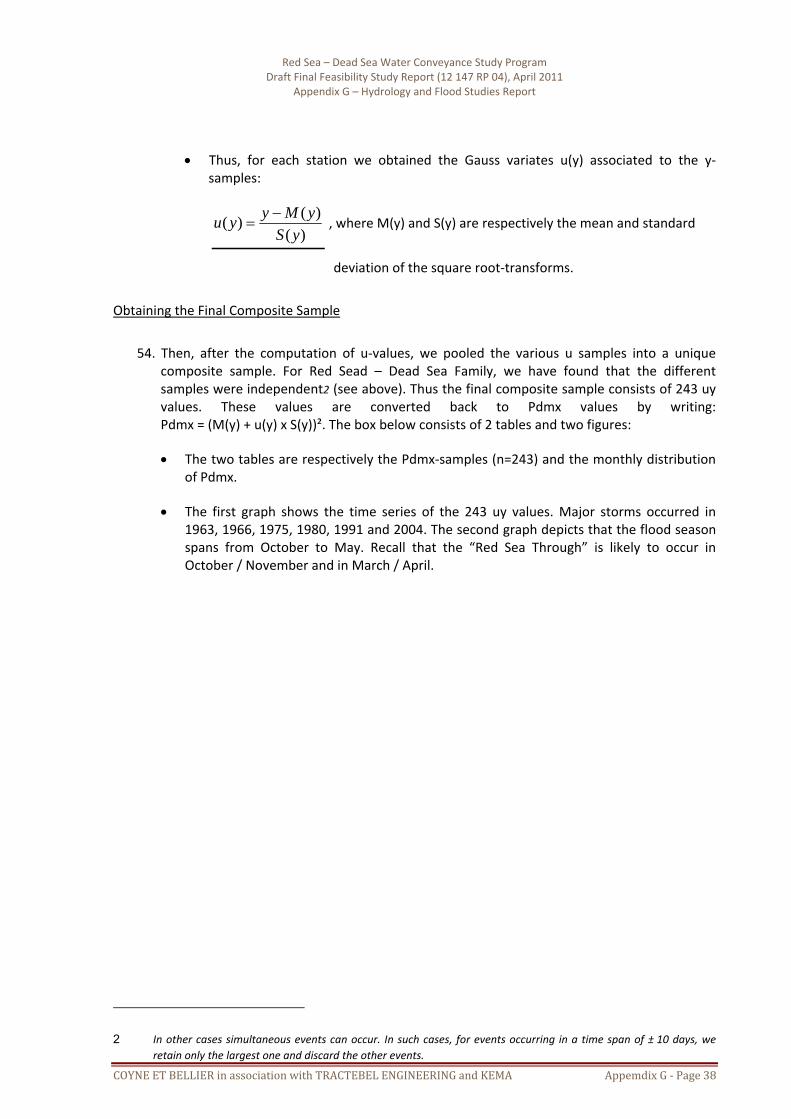
• Thus, for each station we obtained the Gauss variates u(y) associated to the y‐samples:
)()()(
ySyMyyu −
= , where M(y) and S(y) are respectively the mean and standard
deviation of the square root‐transforms.
Obtaining the Final Composite Sample
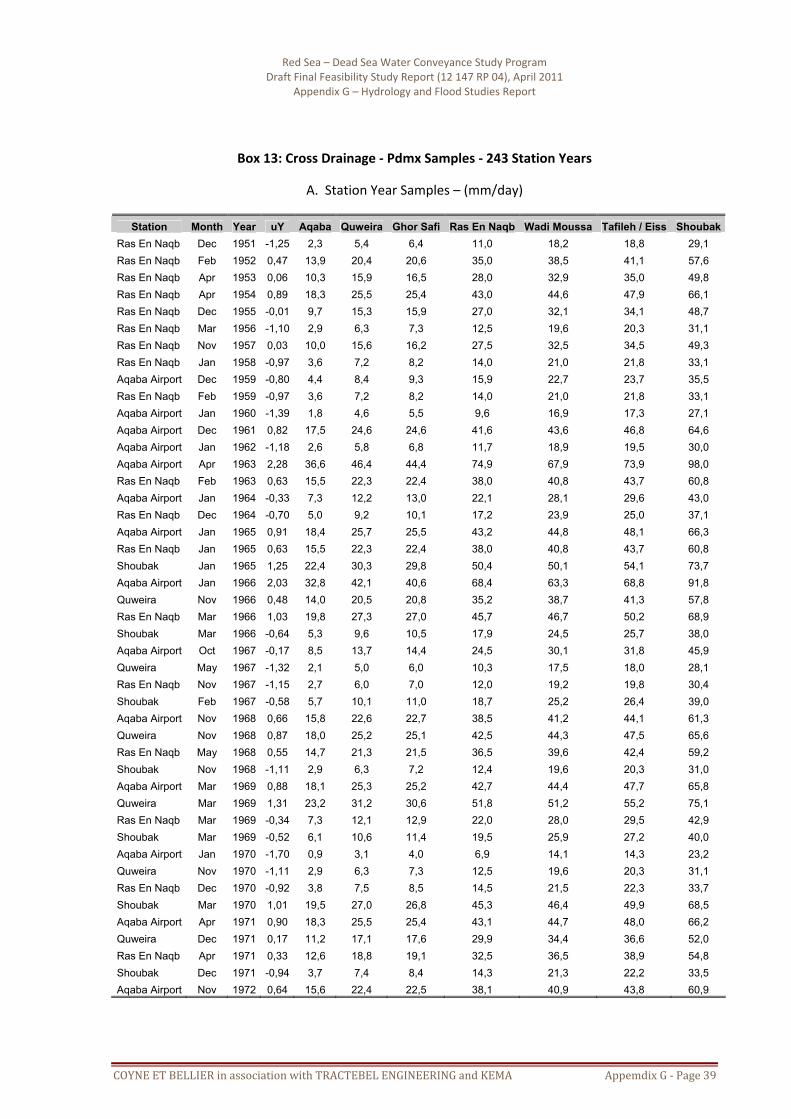
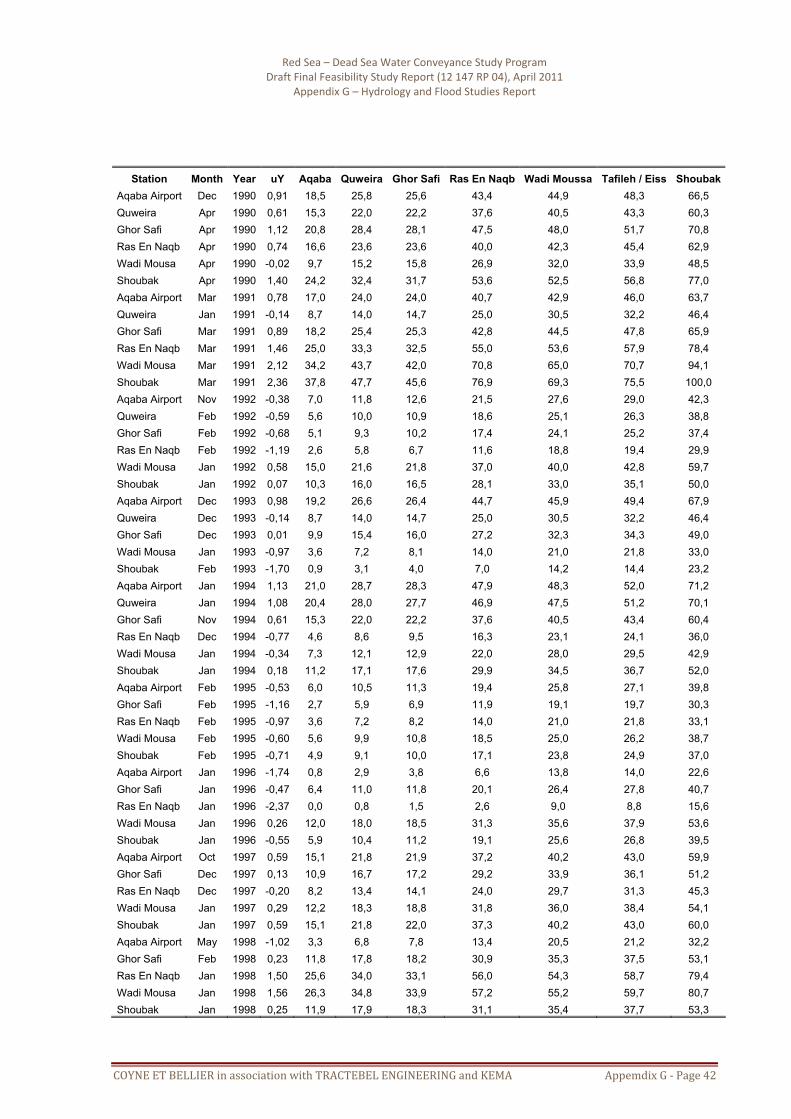
54. Then, after the computation of u‐values, we pooled the various u samples into a unique composite sample. For Red Sead – Dead Sea Family, we have found that the different samples were independent2 (see above). Thus the final composite sample consists of 243 uy values. These values are converted back to Pdmx values by writing: Pdmx = (M(y) + u(y) x S(y))². The box below consists of 2 tables and two figures:
• The two tables are respectively the Pdmx‐samples (n=243) and the monthly distribution of Pdmx.
• The first graph shows the time series of the 243 uy values. Major storms occurred in 1963, 1966, 1975, 1980, 1991 and 2004. The second graph depicts that the flood season spans from October to May. Recall that the “Red Sea Through” is likely to occur in October / November and in March / April.
2 In other cases simultaneous events can occur. In such cases, for events occurring in a time span of ± 10 days, we
retain only the largest one and discard the other events.
Red Sea – Dead Sea Water Conveyance Study Program Draft Final Feasibility Study Report (12 147 RP 04), April 2011
Appendix G – Hydrology and Flood Studies Report
COYNE ET BELLIER in association with TRACTEBEL ENGINEERING and KEMA Appemdix G ‐ Page 39
Box 13: Cross Drainage ‐ Pdmx Samples ‐ 243 Station Years
A. Station Year Samples – (mm/day)
Station Month Year uY Aqaba Quweira Ghor Safi Ras En Naqb Wadi Moussa Tafileh / Eiss ShoubakRas En Naqb Dec 1951 -1,25 2,3 5,4 6,4 11,0 18,2 18,8 29,1 Ras En Naqb Feb 1952 0,47 13,9 20,4 20,6 35,0 38,5 41,1 57,6 Ras En Naqb Apr 1953 0,06 10,3 15,9 16,5 28,0 32,9 35,0 49,8 Ras En Naqb Apr 1954 0,89 18,3 25,5 25,4 43,0 44,6 47,9 66,1 Ras En Naqb Dec 1955 -0,01 9,7 15,3 15,9 27,0 32,1 34,1 48,7 Ras En Naqb Mar 1956 -1,10 2,9 6,3 7,3 12,5 19,6 20,3 31,1 Ras En Naqb Nov 1957 0,03 10,0 15,6 16,2 27,5 32,5 34,5 49,3 Ras En Naqb Jan 1958 -0,97 3,6 7,2 8,2 14,0 21,0 21,8 33,1 Aqaba Airport Dec 1959 -0,80 4,4 8,4 9,3 15,9 22,7 23,7 35,5 Ras En Naqb Feb 1959 -0,97 3,6 7,2 8,2 14,0 21,0 21,8 33,1 Aqaba Airport Jan 1960 -1,39 1,8 4,6 5,5 9,6 16,9 17,3 27,1 Aqaba Airport Dec 1961 0,82 17,5 24,6 24,6 41,6 43,6 46,8 64,6 Aqaba Airport Jan 1962 -1,18 2,6 5,8 6,8 11,7 18,9 19,5 30,0 Aqaba Airport Apr 1963 2,28 36,6 46,4 44,4 74,9 67,9 73,9 98,0 Ras En Naqb Feb 1963 0,63 15,5 22,3 22,4 38,0 40,8 43,7 60,8 Aqaba Airport Jan 1964 -0,33 7,3 12,2 13,0 22,1 28,1 29,6 43,0 Ras En Naqb Dec 1964 -0,70 5,0 9,2 10,1 17,2 23,9 25,0 37,1 Aqaba Airport Jan 1965 0,91 18,4 25,7 25,5 43,2 44,8 48,1 66,3 Ras En Naqb Jan 1965 0,63 15,5 22,3 22,4 38,0 40,8 43,7 60,8 Shoubak Jan 1965 1,25 22,4 30,3 29,8 50,4 50,1 54,1 73,7 Aqaba Airport Jan 1966 2,03 32,8 42,1 40,6 68,4 63,3 68,8 91,8 Quweira Nov 1966 0,48 14,0 20,5 20,8 35,2 38,7 41,3 57,8 Ras En Naqb Mar 1966 1,03 19,8 27,3 27,0 45,7 46,7 50,2 68,9 Shoubak Mar 1966 -0,64 5,3 9,6 10,5 17,9 24,5 25,7 38,0 Aqaba Airport Oct 1967 -0,17 8,5 13,7 14,4 24,5 30,1 31,8 45,9 Quweira May 1967 -1,32 2,1 5,0 6,0 10,3 17,5 18,0 28,1 Ras En Naqb Nov 1967 -1,15 2,7 6,0 7,0 12,0 19,2 19,8 30,4 Shoubak Feb 1967 -0,58 5,7 10,1 11,0 18,7 25,2 26,4 39,0 Aqaba Airport Nov 1968 0,66 15,8 22,6 22,7 38,5 41,2 44,1 61,3 Quweira Nov 1968 0,87 18,0 25,2 25,1 42,5 44,3 47,5 65,6 Ras En Naqb May 1968 0,55 14,7 21,3 21,5 36,5 39,6 42,4 59,2 Shoubak Nov 1968 -1,11 2,9 6,3 7,2 12,4 19,6 20,3 31,0 Aqaba Airport Mar 1969 0,88 18,1 25,3 25,2 42,7 44,4 47,7 65,8 Quweira Mar 1969 1,31 23,2 31,2 30,6 51,8 51,2 55,2 75,1 Ras En Naqb Mar 1969 -0,34 7,3 12,1 12,9 22,0 28,0 29,5 42,9 Shoubak Mar 1969 -0,52 6,1 10,6 11,4 19,5 25,9 27,2 40,0 Aqaba Airport Jan 1970 -1,70 0,9 3,1 4,0 6,9 14,1 14,3 23,2 Quweira Nov 1970 -1,11 2,9 6,3 7,3 12,5 19,6 20,3 31,1 Ras En Naqb Dec 1970 -0,92 3,8 7,5 8,5 14,5 21,5 22,3 33,7 Shoubak Mar 1970 1,01 19,5 27,0 26,8 45,3 46,4 49,9 68,5 Aqaba Airport Apr 1971 0,90 18,3 25,5 25,4 43,1 44,7 48,0 66,2 Quweira Dec 1971 0,17 11,2 17,1 17,6 29,9 34,4 36,6 52,0 Ras En Naqb Apr 1971 0,33 12,6 18,8 19,1 32,5 36,5 38,9 54,8 Shoubak Dec 1971 -0,94 3,7 7,4 8,4 14,3 21,3 22,2 33,5 Aqaba Airport Nov 1972 0,64 15,6 22,4 22,5 38,1 40,9 43,8 60,9

Red Sea – Dead Sea Water Conveyance Study Program Draft Final Feasibility Study Report (12 147 RP 04), April 2011
Appendix G – Hydrology and Flood Studies Report
COYNE ET BELLIER in association with TRACTEBEL ENGINEERING and KEMA Appemdix G ‐ Page 40
Station Month Year uY Aqaba Quweira Ghor Safi Ras En Naqb Wadi Moussa Tafileh / Eiss Shoubak
Quweira Nov 1972 0,71 16,3 23,2 23,3 39,4 41,9 44,9 62,3 Ras En Naqb Mar 1972 0,12 10,8 16,5 17,1 29,0 33,7 35,8 51,0 Shoubak Mar 1972 0,89 18,2 25,5 25,3 42,9 44,6 47,9 66,0 Aqaba Airport Nov 1973 0,35 12,8 19,0 19,4 32,9 36,8 39,3 55,3 Quweira Dec 1973 -1,24 2,4 5,5 6,5 11,1 18,4 18,9 29,2 Ras En Naqb Nov 1973 -1,08 3,1 6,5 7,4 12,8 19,9 20,6 31,5 Shoubak Jan 1973 -1,11 2,9 6,3 7,2 12,4 19,6 20,3 31,0 Aqaba Airport Dec 1974 -0,25 7,9 13,0 13,7 23,3 29,1 30,7 44,5 Quweira Feb 1974 -0,35 7,2 12,0 12,8 21,8 27,8 29,3 42,7 Ghor Safi Dec 1974 0,89 18,2 25,4 25,3 42,8 44,5 47,8 65,9 Ras En Naqb Jan 1974 0,89 18,3 25,5 25,4 43,0 44,6 47,9 66,1 Shoubak Feb 1974 1,08 20,4 27,9 27,6 46,8 47,5 51,1 70,0 Aqaba Airport Dec 1975 0,17 11,2 17,1 17,6 29,8 34,4 36,6 51,9 Quweira Feb 1975 2,70 43,5 54,0 51,3 86,4 76,0 83,0 109,0 Ghor Safi Feb 1975 2,09 33,8 43,3 41,6 70,2 64,5 70,2 93,4 Ras En Naqb Feb 1975 1,73 28,6 37,4 36,3 61,3 58,2 63,0 84,7 Shoubak Feb 1975 1,19 21,7 29,5 29,1 49,2 49,3 53,1 72,5 Aqaba Airport Mar 1976 -0,79 4,5 8,5 9,4 16,1 22,9 23,9 35,8 Quweira Mar 1976 0,61 15,3 22,0 22,2 37,6 40,5 43,3 60,3 Ghor Safi Mar 1976 0,23 11,8 17,8 18,2 30,9 35,3 37,5 53,1 Ras En Naqb Mar 1976 -1,25 2,3 5,4 6,4 11,0 18,2 18,8 29,1 Wadi Mousa Mar 1976 -0,18 8,4 13,6 14,3 24,4 30,0 31,7 45,7 Shoubak Mar 1976 -0,84 4,2 8,1 9,0 15,5 22,4 23,3 35,0 Aqaba Airport Dec 1977 -0,36 7,1 11,9 12,7 21,7 27,7 29,2 42,6 Ghor Safi Apr 1977 -0,27 7,7 12,8 13,5 23,0 28,8 30,4 44,1 Ras En Naqb Apr 1977 -0,52 6,1 10,6 11,4 19,5 25,9 27,2 39,9 Wadi Mousa Dec 1977 0,14 10,9 16,7 17,3 29,3 34,0 36,1 51,3 Shoubak Nov 1977 1,31 23,1 31,1 30,5 51,6 51,1 55,1 75,0 Aqaba Airport Dec 1978 0,74 16,6 23,5 23,6 40,0 42,3 45,4 62,9 Quweira Mar 1978 1,16 21,3 29,0 28,6 48,4 48,7 52,4 71,7 Ghor Safi Jan 1978 -1,19 2,6 5,7 6,7 11,5 18,7 19,3 29,8 Ras En Naqb Mar 1978 -0,52 6,1 10,6 11,4 19,5 25,9 27,2 39,9 Wadi Mousa Dec 1978 -1,49 1,5 4,1 5,0 8,7 16,0 16,4 25,8 Shoubak Dec 1978 -1,63 1,1 3,4 4,3 7,5 14,7 15,0 24,0 Aqaba Airport Feb 1979 0,33 12,6 18,8 19,2 32,5 36,5 38,9 54,9 Quweira Feb 1979 -0,14 8,7 14,0 14,7 25,0 30,5 32,2 46,4 Ghor Safi Mar 1979 -0,38 7,0 11,8 12,6 21,5 27,6 29,0 42,3 Ras En Naqb Dec 1979 -0,31 7,5 12,4 13,2 22,5 28,4 30,0 43,5 Wadi Mousa Jan 1979 0,21 11,6 17,5 18,0 30,6 35,0 37,2 52,7 Shoubak Jan 1979 0,74 16,7 23,6 23,6 40,1 42,4 45,5 63,0 Aqaba Airport Dec 1980 2,64 42,5 52,9 50,3 84,8 74,8 81,7 107,5 Quweira Feb 1980 -1,72 0,9 3,0 3,9 6,8 14,0 14,2 22,9 Ghor Safi Dec 1980 2,10 33,9 43,4 41,7 70,3 64,6 70,3 93,6 Ras En Naqb Dec 1980 1,42 24,4 32,7 32,0 54,0 52,8 57,1 77,4 Wadi Mousa Dec 1980 1,30 23,0 31,0 30,5 51,5 51,0 55,0 74,9 Shoubak Dec 1980 1,44 24,8 33,0 32,3 54,6 53,3 57,6 78,0 Aqaba Airport Oct 1981 -0,19 8,3 13,5 14,2 24,1 29,8 31,5 45,4 Quweira Mar 1981 -1,36 1,9 4,8 5,8 9,9 17,2 17,7 27,6 Ghor Safi Mar 1981 -1,21 2,5 5,6 6,6 11,4 18,6 19,2 29,6

Red Sea – Dead Sea Water Conveyance Study Program Draft Final Feasibility Study Report (12 147 RP 04), April 2011
Appendix G – Hydrology and Flood Studies Report
COYNE ET BELLIER in association with TRACTEBEL ENGINEERING and KEMA Appemdix G ‐ Page 41
Station Month Year uY Aqaba Quweira Ghor Safi Ras En Naqb Wadi Moussa Tafileh / Eiss Shoubak
Wadi Mousa Mar 1981 -1,60 1,2 3,5 4,5 7,7 15,0 15,3 24,4 Shoubak Mar 1981 -1,07 3,1 6,5 7,5 12,9 20,0 20,7 31,6 Aqaba Airport Feb 1982 -0,50 6,2 10,8 11,6 19,8 26,1 27,5 40,3 Quweira Nov 1982 -0,45 6,5 11,2 12,0 20,5 26,7 28,1 41,2 Ghor Safi Jan 1982 -1,10 3,0 6,3 7,3 12,6 19,7 20,4 31,2 Ras En Naqb Feb 1982 1,61 27,0 35,6 34,6 58,5 56,1 60,8 81,9 Wadi Mousa Nov 1982 -0,87 4,0 7,9 8,8 15,1 22,0 22,9 34,4 Shoubak Dec 1982 0,04 10,1 15,7 16,3 27,7 32,7 34,7 49,5 Aqaba Airport Feb 1983 -0,79 4,5 8,5 9,4 16,1 22,9 23,9 35,8 Quweira Feb 1983 -0,54 5,9 10,4 11,2 19,2 25,6 26,9 39,6 Ghor Safi Dec 1983 -0,68 5,1 9,3 10,2 17,4 24,1 25,2 37,4 Wadi Mousa Jan 1983 0,21 11,6 17,5 18,0 30,6 35,0 37,2 52,7 Shoubak Jan 1983 -0,16 8,5 13,8 14,5 24,6 30,2 31,9 46,0 Aqaba Airport Mar 1984 -0,88 4,0 7,8 8,7 15,0 21,9 22,8 34,3 Quweira Feb 1984 -0,54 5,9 10,4 11,2 19,2 25,6 26,9 39,6 Ghor Safi Mar 1984 -1,18 2,6 5,8 6,8 11,7 18,9 19,5 30,0 Ras En Naqb Dec 1984 -0,71 4,9 9,0 9,9 17,0 23,7 24,8 36,9 Wadi Mousa Dec 1984 -0,87 4,0 7,9 8,8 15,1 22,0 22,9 34,4 Shoubak Dec 1984 -0,42 6,7 11,4 12,2 20,9 27,1 28,5 41,6 Aqaba Airport Dec 1985 0,40 13,3 19,6 19,9 33,8 37,6 40,1 56,3 Quweira Dec 1985 0,95 18,9 26,3 26,1 44,2 45,5 49,0 67,4 Ghor Safi Mar 1985 0,52 14,4 21,0 21,2 36,0 39,2 41,9 58,6 Ras En Naqb Dec 1985 -0,17 8,5 13,7 14,4 24,5 30,1 31,8 45,8 Wadi Mousa Feb 1985 -0,87 4,0 7,9 8,8 15,1 22,0 22,9 34,4 Shoubak Dec 1985 0,58 15,0 21,6 21,8 37,0 40,0 42,8 59,7 Aqaba Airport May 1986 0,37 13,0 19,3 19,6 33,3 37,1 39,6 55,7 Quweira May 1986 -0,03 9,5 15,0 15,6 26,6 31,8 33,7 48,2 Ghor Safi Apr 1986 -0,38 7,0 11,8 12,6 21,5 27,6 29,0 42,3 Ras En Naqb Nov 1986 -1,13 2,8 6,1 7,1 12,2 19,4 20,0 30,7 Wadi Mousa Apr 1986 -0,92 3,8 7,5 8,5 14,5 21,5 22,4 33,7 Shoubak Apr 1986 -0,24 8,0 13,1 13,8 23,5 29,3 30,9 44,7 Aqaba Airport Oct 1987 0,46 13,8 20,2 20,5 34,8 38,3 40,9 57,3 Quweira Feb 1987 -0,76 4,6 8,7 9,6 16,4 23,2 24,3 36,2 Ghor Safi Feb 1987 -0,25 7,9 13,0 13,7 23,3 29,1 30,7 44,5 Ras En Naqb Feb 1987 -0,83 4,3 8,2 9,1 15,6 22,5 23,4 35,1 Wadi Mousa Mar 1987 0,40 13,3 19,6 19,9 33,8 37,5 40,0 56,2 Shoubak Mar 1987 0,23 11,7 17,7 18,1 30,8 35,2 37,5 53,0 Aqaba Airport Jan 1988 0,35 12,8 19,0 19,4 32,9 36,8 39,3 55,3 Quweira Feb 1988 -0,85 4,1 8,0 8,9 15,3 22,2 23,1 34,7 Ghor Safi Dec 1988 0,31 12,5 18,6 19,0 32,3 36,3 38,7 54,6 Ras En Naqb Mar 1988 0,24 11,8 17,8 18,2 31,0 35,3 37,6 53,2 Wadi Mousa Mer 1988 1,74 28,7 37,5 36,3 61,4 58,2 63,1 84,8 Shoubak Mar 1988 1,10 20,6 28,2 27,9 47,1 47,7 51,4 70,4 Aqaba Airport Nov 1989 0,15 11,0 16,8 17,3 29,5 34,1 36,2 51,5 Quweira Jan 1989 0,61 15,3 22,0 22,2 37,6 40,5 43,3 60,3 Ghor Safi Jan 1989 -0,61 5,5 9,8 10,7 18,3 24,8 26,0 38,5 Ras En Naqb Feb 1989 -0,84 4,2 8,1 9,0 15,5 22,4 23,3 35,0 Wadi Mousa Jeu 1989 -1,11 2,9 6,3 7,2 12,4 19,6 20,3 31,0 Shoubak Jan 1989 -0,61 5,5 9,9 10,8 18,4 24,9 26,1 38,6
Red Sea – Dead Sea Water Conveyance Study Program Draft Final Feasibility Study Report (12 147 RP 04), April 2011
Appendix G – Hydrology and Flood Studies Report
COYNE ET BELLIER in association with TRACTEBEL ENGINEERING and KEMA Appemdix G ‐ Page 42
Station Month Year uY Aqaba Quweira Ghor Safi Ras En Naqb Wadi Moussa Tafileh / Eiss Shoubak
Aqaba Airport Dec 1990 0,91 18,5 25,8 25,6 43,4 44,9 48,3 66,5 Quweira Apr 1990 0,61 15,3 22,0 22,2 37,6 40,5 43,3 60,3 Ghor Safi Apr 1990 1,12 20,8 28,4 28,1 47,5 48,0 51,7 70,8 Ras En Naqb Apr 1990 0,74 16,6 23,6 23,6 40,0 42,3 45,4 62,9 Wadi Mousa Apr 1990 -0,02 9,7 15,2 15,8 26,9 32,0 33,9 48,5 Shoubak Apr 1990 1,40 24,2 32,4 31,7 53,6 52,5 56,8 77,0 Aqaba Airport Mar 1991 0,78 17,0 24,0 24,0 40,7 42,9 46,0 63,7 Quweira Jan 1991 -0,14 8,7 14,0 14,7 25,0 30,5 32,2 46,4 Ghor Safi Mar 1991 0,89 18,2 25,4 25,3 42,8 44,5 47,8 65,9 Ras En Naqb Mar 1991 1,46 25,0 33,3 32,5 55,0 53,6 57,9 78,4 Wadi Mousa Mar 1991 2,12 34,2 43,7 42,0 70,8 65,0 70,7 94,1 Shoubak Mar 1991 2,36 37,8 47,7 45,6 76,9 69,3 75,5 100,0 Aqaba Airport Nov 1992 -0,38 7,0 11,8 12,6 21,5 27,6 29,0 42,3 Quweira Feb 1992 -0,59 5,6 10,0 10,9 18,6 25,1 26,3 38,8 Ghor Safi Feb 1992 -0,68 5,1 9,3 10,2 17,4 24,1 25,2 37,4 Ras En Naqb Feb 1992 -1,19 2,6 5,8 6,7 11,6 18,8 19,4 29,9 Wadi Mousa Jan 1992 0,58 15,0 21,6 21,8 37,0 40,0 42,8 59,7 Shoubak Jan 1992 0,07 10,3 16,0 16,5 28,1 33,0 35,1 50,0 Aqaba Airport Dec 1993 0,98 19,2 26,6 26,4 44,7 45,9 49,4 67,9 Quweira Dec 1993 -0,14 8,7 14,0 14,7 25,0 30,5 32,2 46,4 Ghor Safi Dec 1993 0,01 9,9 15,4 16,0 27,2 32,3 34,3 49,0 Wadi Mousa Jan 1993 -0,97 3,6 7,2 8,1 14,0 21,0 21,8 33,0 Shoubak Feb 1993 -1,70 0,9 3,1 4,0 7,0 14,2 14,4 23,2 Aqaba Airport Jan 1994 1,13 21,0 28,7 28,3 47,9 48,3 52,0 71,2 Quweira Jan 1994 1,08 20,4 28,0 27,7 46,9 47,5 51,2 70,1 Ghor Safi Nov 1994 0,61 15,3 22,0 22,2 37,6 40,5 43,4 60,4 Ras En Naqb Dec 1994 -0,77 4,6 8,6 9,5 16,3 23,1 24,1 36,0 Wadi Mousa Jan 1994 -0,34 7,3 12,1 12,9 22,0 28,0 29,5 42,9 Shoubak Jan 1994 0,18 11,2 17,1 17,6 29,9 34,5 36,7 52,0 Aqaba Airport Feb 1995 -0,53 6,0 10,5 11,3 19,4 25,8 27,1 39,8 Ghor Safi Feb 1995 -1,16 2,7 5,9 6,9 11,9 19,1 19,7 30,3 Ras En Naqb Feb 1995 -0,97 3,6 7,2 8,2 14,0 21,0 21,8 33,1 Wadi Mousa Feb 1995 -0,60 5,6 9,9 10,8 18,5 25,0 26,2 38,7 Shoubak Feb 1995 -0,71 4,9 9,1 10,0 17,1 23,8 24,9 37,0 Aqaba Airport Jan 1996 -1,74 0,8 2,9 3,8 6,6 13,8 14,0 22,6 Ghor Safi Jan 1996 -0,47 6,4 11,0 11,8 20,1 26,4 27,8 40,7 Ras En Naqb Jan 1996 -2,37 0,0 0,8 1,5 2,6 9,0 8,8 15,6 Wadi Mousa Jan 1996 0,26 12,0 18,0 18,5 31,3 35,6 37,9 53,6 Shoubak Jan 1996 -0,55 5,9 10,4 11,2 19,1 25,6 26,8 39,5 Aqaba Airport Oct 1997 0,59 15,1 21,8 21,9 37,2 40,2 43,0 59,9 Ghor Safi Dec 1997 0,13 10,9 16,7 17,2 29,2 33,9 36,1 51,2 Ras En Naqb Dec 1997 -0,20 8,2 13,4 14,1 24,0 29,7 31,3 45,3 Wadi Mousa Jan 1997 0,29 12,2 18,3 18,8 31,8 36,0 38,4 54,1 Shoubak Jan 1997 0,59 15,1 21,8 22,0 37,3 40,2 43,0 60,0 Aqaba Airport May 1998 -1,02 3,3 6,8 7,8 13,4 20,5 21,2 32,2 Ghor Safi Feb 1998 0,23 11,8 17,8 18,2 30,9 35,3 37,5 53,1 Ras En Naqb Jan 1998 1,50 25,6 34,0 33,1 56,0 54,3 58,7 79,4 Wadi Mousa Jan 1998 1,56 26,3 34,8 33,9 57,2 55,2 59,7 80,7 Shoubak Jan 1998 0,25 11,9 17,9 18,3 31,1 35,4 37,7 53,3

Red Sea – Dead Sea Water Conveyance Study Program Draft Final Feasibility Study Report (12 147 RP 04), April 2011
Appendix G – Hydrology and Flood Studies Report
COYNE ET BELLIER in association with TRACTEBEL ENGINEERING and KEMA Appemdix G ‐ Page 43
Station Month Year uY Aqaba Quweira Ghor Safi Ras En Naqb Wadi Moussa Tafileh / Eiss Shoubak
Aqaba Airport Feb 1999 0,58 15,0 21,6 21,8 37,0 40,0 42,8 59,7 Ghor Safi Feb 1999 0,19 11,4 17,3 17,8 30,2 34,7 36,9 52,4 Ras En Naqb Jan 1999 -0,01 9,7 15,3 15,9 27,0 32,1 34,1 48,7 Tafileh / Eiss Feb 1999 0,40 13,2 19,5 19,9 33,7 37,5 40,0 56,2 Shoubak Feb 1999 -0,05 9,4 14,9 15,5 26,4 31,6 33,5 48,0 Aqaba Airport Dec 2000 -0,68 5,1 9,3 10,2 17,5 24,1 25,2 37,4 Ghor Safi Jan 2000 -1,11 2,9 6,2 7,2 12,4 19,5 20,2 30,9 Ras En Naqb Jan 2000 0,77 16,9 23,9 23,9 40,5 42,7 45,8 63,5 Wadi Mousa Oct 2000 -0,02 9,7 15,2 15,8 26,9 32,0 33,9 48,5 Shoubak Jan 2000 -0,80 4,4 8,4 9,3 15,9 22,7 23,7 35,5 Aqaba Airport Apr 2001 -0,23 8,0 13,1 13,8 23,5 29,3 30,9 44,7 Ghor Safi Dec 2001 -0,40 6,8 11,6 12,4 21,2 27,3 28,7 41,9 Ras En Naqb Apr 2001 -0,01 9,7 15,3 15,9 27,0 32,1 34,1 48,7 Wadi Mousa May 2001 0,14 10,9 16,7 17,3 29,3 34,0 36,1 51,3 Tafileh / Eiss Apr 2001 -1,23 2,4 5,5 6,5 11,2 18,4 19,0 29,3 Shoubak Apr 2001 -1,37 1,9 4,7 5,7 9,8 17,1 17,5 27,4 Aqaba Airport Oct 2002 -0,50 6,2 10,8 11,6 19,8 26,1 27,5 40,3 Ghor Safi Oct 2002 -0,57 5,7 10,1 11,0 18,8 25,3 26,5 39,1 Ras En Naqb Dec 2002 1,85 30,2 39,2 37,9 64,0 60,1 65,2 87,4 Wadi Mousa Feb 2002 0,49 14,1 20,6 20,9 35,4 38,8 41,5 58,0 Tafileh / Eiss Dec 2002 -0,41 6,8 11,5 12,3 21,0 27,2 28,6 41,8 Shoubak Dec 2002 0,69 16,1 23,0 23,1 39,1 41,7 44,6 62,0 Aqaba Airport Dec 2003 -0,86 4,1 8,0 8,9 15,2 22,1 23,1 34,6 Ghor Safi Dec 2003 -0,28 7,7 12,7 13,4 22,8 28,7 30,3 43,9 Ras En Naqb Dec 2003 -0,48 6,3 10,9 11,7 20,0 26,3 27,6 40,5 Wadi Mousa Dec 2003 -1,02 3,3 6,9 7,8 13,4 20,5 21,3 32,3 Tafileh / Eiss Mar 2003 -1,46 1,6 4,2 5,2 8,9 16,2 16,6 26,2 Shoubak Dec 2003 -2,03 0,3 1,8 2,6 4,6 11,5 11,5 19,3 Aqaba Airport Feb 2004 -1,39 1,8 4,6 5,5 9,6 16,9 17,3 27,1 Ghor Safi Oct 2004 2,91 47,1 58,0 54,9 92,4 80,2 87,7 114,8 Ras En Naqb Jan 2004 1,68 27,9 36,6 35,6 60,1 57,3 62,1 83,5 Wadi Mousa Jan 2004 2,20 35,4 45,0 43,2 72,8 66,4 72,3 96,0 Tafileh / Eiss Jan 2004 0,96 19,0 26,3 26,1 44,3 45,6 49,0 67,4 Shoubak Jan 2004 0,90 18,4 25,6 25,5 43,2 44,8 48,1 66,3 Aqaba Airport Feb 2005 -1,74 0,8 2,9 3,8 6,6 13,8 14,0 22,6 Ghor Safi Jan 2005 0,83 17,6 24,8 24,7 41,8 43,7 46,9 64,9 Ras En Naqb Jan 2005 1,49 25,4 33,8 33,0 55,7 54,1 58,5 79,1 Wadi Mousa Jan 2005 0,38 13,1 19,4 19,7 33,5 37,3 39,8 55,9 Tafileh / Eiss Jan 2005 1,35 23,6 31,7 31,1 52,6 51,8 55,9 75,9 Shoubak Jan 2005 0,54 14,6 21,2 21,4 36,3 39,5 42,2 59,0 Aqaba Airport Jan 2006 -0,53 6,0 10,5 11,3 19,4 25,8 27,1 39,8 Ghor Safi Feb 2006 -0,45 6,5 11,2 12,0 20,5 26,7 28,1 41,1 Ras En Naqb Feb 2006 0,63 15,5 22,3 22,4 38,0 40,8 43,7 60,8 Wadi Mousa Feb 2006 -0,39 6,9 11,7 12,5 21,3 27,4 28,8 42,1 Tafileh / Eiss Feb 2006 -0,13 8,8 14,1 14,8 25,2 30,6 32,4 46,6 Shoubak Dec 2006 0,10 10,6 16,3 16,9 28,7 33,5 35,6 50,6 Aqaba Airport Jan 2007 -1,09 3,0 6,4 7,4 12,6 19,8 20,5 31,3 Ghor Safi Feb 2007 -0,71 4,9 9,1 10,0 17,1 23,8 24,9 37,0 Wadi Mousa Feb 2007 -0,76 4,6 8,7 9,6 16,4 23,2 24,2 36,1

Red Sea – Dead Sea Water Conveyance Study Program Draft Final Feasibility Study Report (12 147 RP 04), April 2011
Appendix G – Hydrology and Flood Studies Report
COYNE ET BELLIER in association with TRACTEBEL ENGINEERING and KEMA Appemdix G ‐ Page 44
Station Month Year uY Aqaba Quweira Ghor Safi Ras En Naqb Wadi Moussa Tafileh / Eiss Shoubak
Tafileh / Eiss Jan 2007 0,52 14,4 20,9 21,2 35,9 39,2 41,9 58,6 Shoubak Feb 2007 -0,87 4,1 7,9 8,8 15,1 22,0 23,0 34,5
N 243 243 243 243 243 243 243 243 M 0,00 11,4 16,9 17,3 29,3 33,4 35,6 50,4 S 0,99 8,8 10,6 9,9 16,7 13,2 14,6 18,4
Cv 0,77 0,63 0,58 0,57 0,39 0,41 0,36 Me -0,05 9,4 14,9 15,5 26,4 31,6 33,5 48,0 Max 2,91 47,1 58,0 54,9 92,4 80,2 87,7 114,8 Min -2,37 0,0 0,8 1,5 2,6 9,0 8,8 15,6
K 20,4 19,7 19,7 18,6 18,3 18,1 17,2
PMP 190,8 226,9 212,9 339,8 274,8 300,8 366,4 PMP/Max 4,05 3,91 3,88 3,68 3,43 3,43 3,19
B. Monthly Distribution of the Maximum Daily Rainfall
Month Nb %
September 0 0,0October 8 3,3November 18 7,4December 51 21,0January 56 23,0February 48 19,8March 36 14,8April 19 7,8May 7 2,9June 0 0,0 Total 243 100

Red Sea – Dead Sea Water Conveyance Study Program Draft Final Feasibility Study Report (12 147 RP 04), April 2011
Appendix G – Hydrology and Flood Studies Report
COYNE ET BELLIER in association with TRACTEBEL ENGINEERING and KEMA Appemdix G ‐ Page 45
C. Illustrations: uy Sample and Monthly Distribution
Red Sea / Dead Sea Family - Time Series of Standard Variate uy (243 Station-Years)
-3
-2
-1
0
1
2
3
4
1950 1955 1960 1965 1970 1975 1980 1985 1990 1995 2000 2005 2010
Years
Stan
dard
Var
iate
uY
Yearly Maximum Daily Rainfall - Monthly Distribution (243 Station-Years)
0
2
4
6
8
10
12
14
16
18
20
22
24
26
September October November December January February March April May June
Month
Perc
enta
ge o
f Occ
urre
nce
(%)

Red Sea – Dead Sea Water Conveyance Study Program Draft Final Feasibility Study Report (12 147 RP 04), April 2011
Appendix G – Hydrology and Flood Studies Report
COYNE ET BELLIER in association with TRACTEBEL ENGINEERING and KEMA Appemdix G ‐ Page 46
Maximum Daily Rainfall (Pdmx) vs. Return Period (T)
55. Box 11 details the fits of a Gumbel distribution to the 7 samples (n=243). To obtain these fits, we applied least square approach for the Pdmx values corresponding to a positive Gumbel variate. As shown by the illustrations, the fits are significantly good and correspond to r² values greater than 0.99.
56. The Probable Maximum Precipitation computed by the Hershfield’s approach amounts to between 2.1 to 2.6 times the 10 000‐year daily rainfall. This is a usual result. PMPs are in the range of 191 mm/day (at Aqaba) to 366 mm/day (at Shoubaq).
57. The second table of the box details the growing factors that show the contrast between plain and mountain and the contrast between Northern and Southern stations.
58. The graphs show clearly the interest of the regional approach, which allows for taking into account all the relevant information about important storms.
Box 14 Cross Drainage ‐ Gumbel Distribution for Pdmx at Selected Raingauges
A. Maximum Daily Rainfall vs. Return Period
T (years) Aqaba-Airport Quweira Ghor Safi Ras En Naqb Wadi Moussa Tafileh Eiss Shoubak2 9 15 15 26 32 33 48 5 18 25 25 42 43 47 64
10 24 32 31 52 51 55 75 20 29 38 37 62 59 64 86 50 36 46 44 75 68 75 99
100 42 53 50 85 76 83 109 200 47 59 56 94 83 91 119 500 54 67 64 107 93 101 132
1 000 59 73 69 117 100 110 142 2 000 65 79 75 126 107 118 152 5 000 72 88 83 139 117 128 166
10 000 77 94 88 148 124 136 176 PMP (mm/day) 191 227 227 340 275 301 366 PMP/P10000 2,48 2,42 2,57 2,29 2,22 2,21 2,08 PMP/P100 4,59 4,32 4,52 4,01 3,63 3,64 3,36 Pyr (mm/year) 29,5 77 148 179 242 314 Z (masl) 2 -350 1 564 1 115 1 260 1 365
(mm)

Red Sea – Dead Sea Water Conveyance Study Program Draft Final Feasibility Study Report (12 147 RP 04), April 2011
Appendix G – Hydrology and Flood Studies Report
COYNE ET BELLIER in association with TRACTEBEL ENGINEERING and KEMA Appemdix G ‐ Page 47
B. Growing Factors: Pdmx(T) / M (Pdmx)
T Aqaba-Airport Quweira Ghor Safi Ras En Naqb Wadi Moussa Tafileh Eiss Shoubak2 0,81 0,87 0,89 0,89 0,94 0,94 0,95 5 1,57 1,47 1,43 1,43 1,30 1,31 1,28
10 2,07 1,87 1,79 1,78 1,53 1,56 1,49 20 2,56 2,25 2,13 2,12 1,76 1,79 1,70 50 3,18 2,74 2,58 2,56 2,05 2,10 1,96
100 3,65 3,11 2,91 2,89 2,27 2,32 2,16 200 4,12 3,48 3,24 3,22 2,48 2,55 2,36 500 4,74 3,97 3,68 3,65 2,77 2,85 2,63
1 000 5,21 4,33 4,01 3,98 2,99 3,08 2,82 2 000 5,67 4,70 4,34 4,30 3,20 3,31 3,02 5 000 6,29 5,19 4,78 4,74 3,49 3,61 3,29
10 000 6,76 5,55 5,11 5,06 3,71 3,83 3,48 PMP 16,77 13,43 13,15 11,60 8,23 8,46 7,26
C. Illustrations
Aqaba Airport - Maximum Daily Rainfall vs. Gumbel Variate
0
10
20
30
40
50
60
-3 -2 -1 0 1 2 3 4 5 6
Gumbel Variate u (Gumbel)
Max
imum
Dai
ly R
ainf
all P
dmx
(mm
/day
) Aqaba Airport-243Aqaba Airport-49Y=6,37+7,66u

Red Sea – Dead Sea Water Conveyance Study Program Draft Final Feasibility Study Report (12 147 RP 04), April 2011
Appendix G – Hydrology and Flood Studies Report
COYNE ET BELLIER in association with TRACTEBEL ENGINEERING and KEMA Appemdix G ‐ Page 48
Quweira - Maximum Daily Rainfall vs. Gumbel Variate
0
10
20
30
40
50
60
70
-3 -2 -1 0 1 2 3 4 5 6
Gumbel Variate u(Gumbel)
Max
imum
Dai
ly R
ainf
all P
dmx
(mm
/day
) Quweira-243Quweira-28y=11,40+8,95 u
Ghor Safi - Maximum Daily Rainfall vs. Gumbel Variate
0
10
20
30
40
50
60
70
-3 -2 -1 0 1 2 3 4 5 6
Gumbel Variate u(Gumbel)
Max
imum
Dai
ly R
ainf
all P
dmx
(mm
/day
) Ghor Safi-243Ghor Safi - 34y=12,34+8,24u

Red Sea – Dead Sea Water Conveyance Study Program Draft Final Feasibility Study Report (12 147 RP 04), April 2011
Appendix G – Hydrology and Flood Studies Report
COYNE ET BELLIER in association with TRACTEBEL ENGINEERING and KEMA Appemdix G ‐ Page 49
Ras En Nqab - Maximum Daily Rainfall vs. Gumbel Variate
0
20
40
60
80
100
120
-3 -2 -1 0 1 2 3 4 5 6
Gumbel Variate u(Gumbel)
Max
imum
Dai
ly R
ainf
all P
dmx
(mm
/day
) Ras En Naqb - 243Ras En Naqb - 50y=21,07+13,83u
Wadi Mousa - Maximum Daily Rainfall vs. Gumbel Variate
0
10
20
30
40
50
60
70
80
90
-3 -2 -1 0 1 2 3 4 5 6
Gumbel Variate u(Gumbel)
Max
imum
Dai
ly R
ainf
all P
dmx
(mm
/day
)
Wadi Moussa - 243Wadi Moussa - 31y=27,75+10,44u

Red Sea – Dead Sea Water Conveyance Study Program Draft Final Feasibility Study Report (12 147 RP 04), April 2011
Appendix G – Hydrology and Flood Studies Report
COYNE ET BELLIER in association with TRACTEBEL ENGINEERING and KEMA Appemdix G ‐ Page 50
Tafileh / Eiss - Maximum Daily Rainfall vs. Gumbel Variate
0
10
20
30
40
50
60
70
80
90
100
-3 -2 -1 0 1 2 3 4 5 6
Gumbel Variate u(Gumbel)
Max
imum
Dai
ly R
ainf
all P
dmx
(mm
/day
)
Tafileh / Eiss - 243Tafileh / Eiss - 8y=29,18+11,63u
Shoubak - Maximum Daily Rainfall vs. Gumbel Variate
0
20
40
60
80
100
120
140
-3 -2 -1 0 1 2 3 4 5 6
Gumbel Variate u(Gumbel)
Max
imum
Dai
ly R
ainf
all P
dmx
(mm
/day
) Shoubak - 243Shoubak - 43y=42,7+14,43u

Red Sea – Dead Sea Water Conveyance Study Program Draft Final Feasibility Study Report (12 147 RP 04), April 2011
Appendix G – Hydrology and Flood Studies Report
COYNE ET BELLIER in association with TRACTEBEL ENGINEERING and KEMA Appemdix G ‐ Page 51
Estimating Pdmx (T) for ungauged locations
59. The considered stations are dispersed over a large area and we will need to estimate Pdmx (T) for a number of catchments in the three zones already mentioned (Ghor Safi area, Shoubak / Wadi Musa and Wadi Musa / Ras En Naqb. To solve this problem, we found a significant correlation between M (Pdmx) and the yearly rainfall Pyr. In addition, the intercept P0 and the slope G of the Gumbel distribution3 are related to M (Pdmx). The relations given in Box 12 allow for computing Pdmx (T) in any location for which the yearly rainfall can be assessed.
Box 15 Cross Drainage ‐ Parameters P0 and G vs Pyr and M(Pdmx)
Station Pyr M P0 G G-Excl.
(mm/year) (mm/day) (mm/day) (mm/day) (mm/day) Aqaba 29,5 11,4 5,37 7,66 Ghor Safi 77 17,3 12,34 8,24 Quweira 88,75 16,9 11,40 8,95 Ras En Naqb 148 29,3 21,07 13,83 Wadi Mousa 179 33,4 27,75 10,44 Tafileh / Eiss 203 35,4 29,18 11,63 Shoubak 314 50,4 42,70 14,43
Red Sea / Dead Sea Family - Mean M(Pdmx) vs. Mean Yearly Rainfall
y = 0,142x + 6,66R 2 = 0,990
0
10
20
30
40
50
60
0 25 50 75 100 125 150 175 200 225 250 275 300 325 350
Mean Yearly Rainfall Pyr (mm/day)
Mea
n of
Max
imum
Dai
ly R
ainf
all M
(Pdm
x)
MM vs. Pyr
3 Writing Pdmx (u) = P0 + G x u, with u=‐ln(‐ln(F)).

Red Sea – Dead Sea Water Conveyance Study Program Draft Final Feasibility Study Report (12 147 RP 04), April 2011
Appendix G – Hydrology and Flood Studies Report
COYNE ET BELLIER in association with TRACTEBEL ENGINEERING and KEMA Appemdix G ‐ Page 52
Red Sea / Dead Sea Family - Gumbel Parameters P0 and G vsx. M(Pdmx)
y = 0,947x - 4,85R 2 = 0,994
y = 0,167x + 5,63R 2 = 0,966
0
5
10
15
20
25
30
35
40
45
50
0 10 20 30 40 50 60
Mean of Maximum Daily Rainfall M(Pdmx) (mm/day)
Gum
bel P
aram
eter
s P0
and
G (m
m/d
ay)
P0GG-Excl.P0 vs MG vs. M
3.3. Storm Profiles
60. Concerning storm profiles, we selected the following approach:
• In a first step, we consulted the available documentation about Intensity‐Duration‐Frequency curves (IDF curves). In fact, we found that 5 sources provided information:
o The professional paper n°4 by the Ministry of Water and Irrigation (2001).
o A table provided by WAJ about IDFs at 32 locations in Jordan (undated).
o The Exact publication (2007).
o MWH (2007).
o Engicon (2007).
• From this documentation, we extracted the “α” coefficients of the classical formula: P (D) = k x Dα, where P is the storm precipitation and D is the storm duration. It was found that values of α vary from location to location and that these values can be very different for a same location according to the source of documentation.
• We made an in‐depth analysis of the α‐coefficients that shows that small values of the coefficient were likely to be related to low elevation – low rainfall and short storm duration. On the contrary, important values of α were linked to high elevation – high rainfall and long storm duration. Of course several types of storms (hence several α‐values) can occur in any location of Jordan.

Red Sea – Dead Sea Water Conveyance Study Program Draft Final Feasibility Study Report (12 147 RP 04), April 2011
Appendix G – Hydrology and Flood Studies Report
COYNE ET BELLIER in association with TRACTEBEL ENGINEERING and KEMA Appemdix G ‐ Page 53
• To define proper values for the catchment under studies and in order to provide information at specified locations of the project, we concluded the analysis by defining a mean α‐value for specified ranges of the yearly rainfall. Such a conclusion is logical since yearly rainfall can be rather easily assessed in any point of the country. Box 16 details the findings of our approach.
Box 16 Cross Drainage ‐ Determination of Storm Profile
A. Information about Coefficient α
Group/Station α Statistics Group/Station α Statistics Group 1 Group 4 El Reisha 0,136 N 2 Dhaba 0,393 n 8 Durra 0,145 Mean 0,140 Dhaba 0,428 Mean 0,445 Madaba 0,444 S 0,024 Group 2 Madaba 0,452 Cv 0,055 Rabba 0,212 N 10 Dhiban 0,455 M 0,454 Aqaba Airport 0,220 Mean 0,243 Rashadiya 0,456 Max 0,472 Dana 0,221 S 0,022 Dhiban 0,461 Min 0,393 Wadi Yutum 0,230 Cv 0,090 Judayda 0,472 Uneiza 0,244 M 0,245 Qatraneh 0,245 Max 0,276 Group 5 Ma'an 0,255 Min 0,212 Busaira 0,484 n 10 Qatraneh 0,263 Dhiban 0,496 Mean 0,534 Uneiza-Form 0,265 Mazar 0,501 S 0,029 Rabba 0,276 Mazar 0,536 Cv 0,055 Tafileh-Form 0,543 Me 0,546 Group 3 Judayda 0,549 Max 0,567 Ma'an-Form 0,302 N 7 Tafileh 0,550 Min 0,484 Madaba-Form 0,309 Mean 0,351 Tafileh 0,553 Wadi Musa 0,326 S 0,037 Dhiban-Form 0,559 Ras En Naqb 0,372 Cv 0,106 Tafileh 0,567 Q.A.I 0,378 M 0,372 Wadi Musa-Form 0,383 Max 0,387 Rajif 0,387 Min 0,302
B. Coefficient α vs. Mean Yearly Rainfall
Pyr α P ≤ 100 0,257101≤Pyr≤150 0,348151≤Pyr≤200 0,420Pyr≥201 0,485

Red Sea – Dead Sea Water Conveyance Study Program Draft Final Feasibility Study Report (12 147 RP 04), April 2011
Appendix G – Hydrology and Flood Studies Report
COYNE ET BELLIER in association with TRACTEBEL ENGINEERING and KEMA Appemdix G ‐ Page 54
C. Graphs
Storm Profile - Case 1 : Pyr less than or equal to 100 mm/year
0
0,05
0,1
0,15
0,2
0,25
0,3
0,35
0,4
0,45
0,5
1 2 3 4 5 6 7 8 9 10 11 12 13 14 15 16 17 18 19 20 21 22 23 24
Time Step (hours)
Rat
io P
(tim
e st
ep)/P
(24)
Storm Profile - Case 2 : Pyr from 101 to 150 mm/year
0
0,05
0,1
0,15
0,2
0,25
0,3
0,35
1 2 3 4 5 6 7 8 9 10 11 12 13 14 15 16 17 18 19 20 21 22 23 24
Time Step (hours)
P(tim
e st
ep)/P
(24)

Red Sea – Dead Sea Water Conveyance Study Program Draft Final Feasibility Study Report (12 147 RP 04), April 2011
Appendix G – Hydrology and Flood Studies Report
COYNE ET BELLIER in association with TRACTEBEL ENGINEERING and KEMA Appemdix G ‐ Page 55
Storm Profile - Case 3 : 151 < Pyr < 200 mm/year
0
0,05
0,1
0,15
0,2
0,25
0,3
1 2 3 4 5 6 7 8 9 10 11 12 13 14 15 16 17 18 19 20 21 22 23 24
Time Step (hours)
P(tim
e st
ep)/P
(24)
Storm Profile - Case 4 : 201 < Pyr < 250 mm/year
0
0,05
0,1
0,15
0,2
0,25
1 2 3 4 5 6 7 8 9 10 11 12 13 14 15 16 17 18 19 20 21 22 23 24
Time Step (hours)
P(tim
e st
ep)/P
(24)
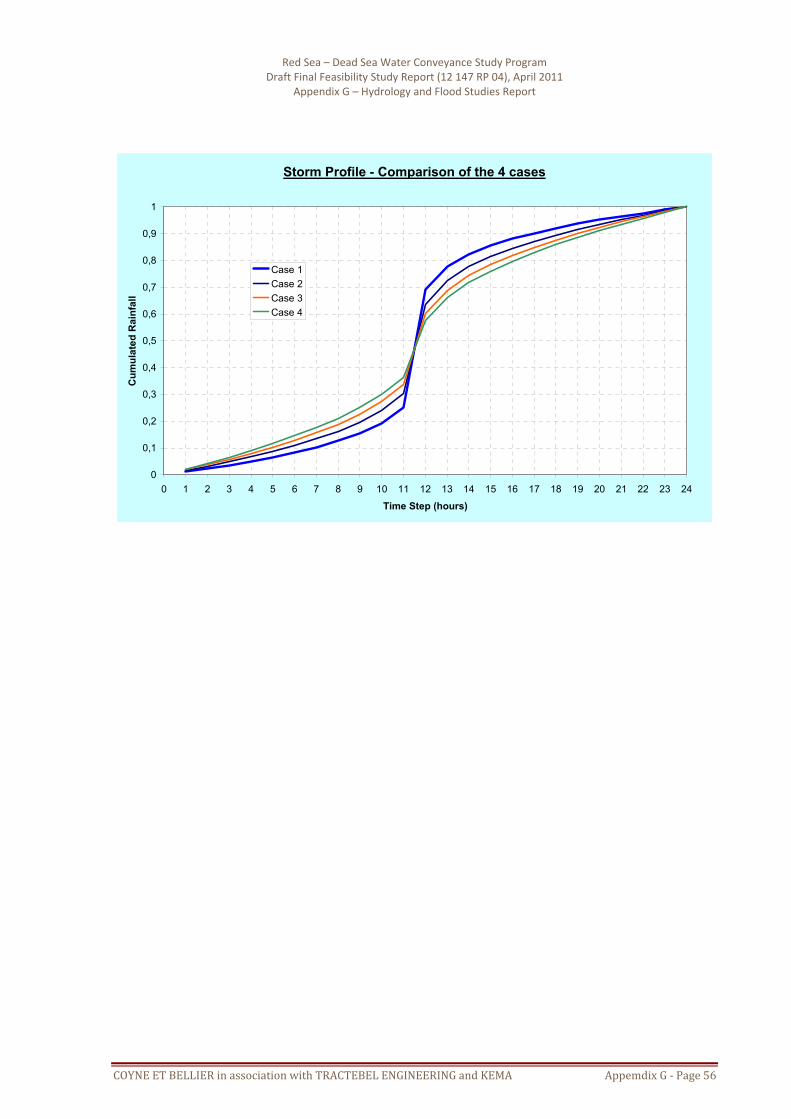
Red Sea – Dead Sea Water Conveyance Study Program Draft Final Feasibility Study Report (12 147 RP 04), April 2011
Appendix G – Hydrology and Flood Studies Report
COYNE ET BELLIER in association with TRACTEBEL ENGINEERING and KEMA Appemdix G ‐ Page 56
Storm Profile - Comparison of the 4 cases
0
0,1
0,2
0,3
0,4
0,5
0,6
0,7
0,8
0,9
1
0 1 2 3 4 5 6 7 8 9 10 11 12 13 14 15 16 17 18 19 20 21 22 23 24
Time Step (hours)
Cum
ulat
ed R
ainf
all
Case 1Case 2Case 3Case 4

Red Sea – Dead Sea Water Conveyance Study Program Draft Final Feasibility Study Report (12 147 RP 04), April 2011
Appendix G – Hydrology and Flood Studies Report
COYNE ET BELLIER in association with TRACTEBEL ENGINEERING and KEMA Appemdix G ‐ Page 57
3.4. Description of Catchments under Study
Physiography
61. It appears that the catchments under study belong broadly to one of the two following groups of catchments:
• The “lower” group of catchment for which the crests are lower than the main crest defining the water divide between the Arava Valley and the Eastern desert catchments.
• The “higher” group of catchment for which the crests define the regional water divide.
62. The higher group is characterized by large differences of elevation between the headwaters and the wadi mouth. Their thalweg lengths are rather long. The lower group has smaller differences of elevation and smaller thalweg lengths.
63. Box 17 illustrates these comments. The graphs show clearly the two groups.

Red Sea – Dead Sea Water Conveyance Study Program Draft Final Feasibility Study Report (12 147 RP 04), April 2011
Appendix G – Hydrology and Flood Studies Report
COYNE ET BELLIER in association with TRACTEBEL ENGINEERING and KEMA Appemdix G ‐ Page 58
Box 17 Cross Drainage ‐ Hypsometry of Catchments under Study
A Hypsometry – Ghor Safi Area S% Z - C4 Z - C5 Z - C6 Z - C7 S% Z - C4 Z - C5 Z - C6 Z - C7 0% 924 1 517 508 1 605 55% -315 812 -165 672 5% 518 1 311 288 1 461 60% -336 738 -196 566
10% 364 1 260 207 1 393 65% -351 621 -226 460 15% 215 1 216 146 1 317 70% -356 503 -260 377 20% 71 1 179 85 1 264 75% -366 415 -287 301 25% -42 1 142 45 1 218 80% -371 327 -307 210 30% -120 1 098 11 1 150 85% -377 194 -321 81 35% -166 1 039 -20 1 067 90% -382 48 -331 -10 40% -212 988 -57 976 95% -387 -158 -338 -109 45% -253 929 -91 870 100% -392 -364 -358 -336 50% -289 870 -131 763
Ghor Safi Area - Catchments 4 to 7
-400
-200
0
200
400
600
800
1 000
1 200
1 400
1 600
1 800
0% 5% 10% 15% 20% 25% 30% 35% 40% 45% 50% 55% 60% 65% 70% 75% 80% 85% 90% 95% 100%
Catchment Area (%)
Gro
und
Elev
atio
n Z
(mas
l)
Z - C4 Z - C5 Z - C6 Z - C7
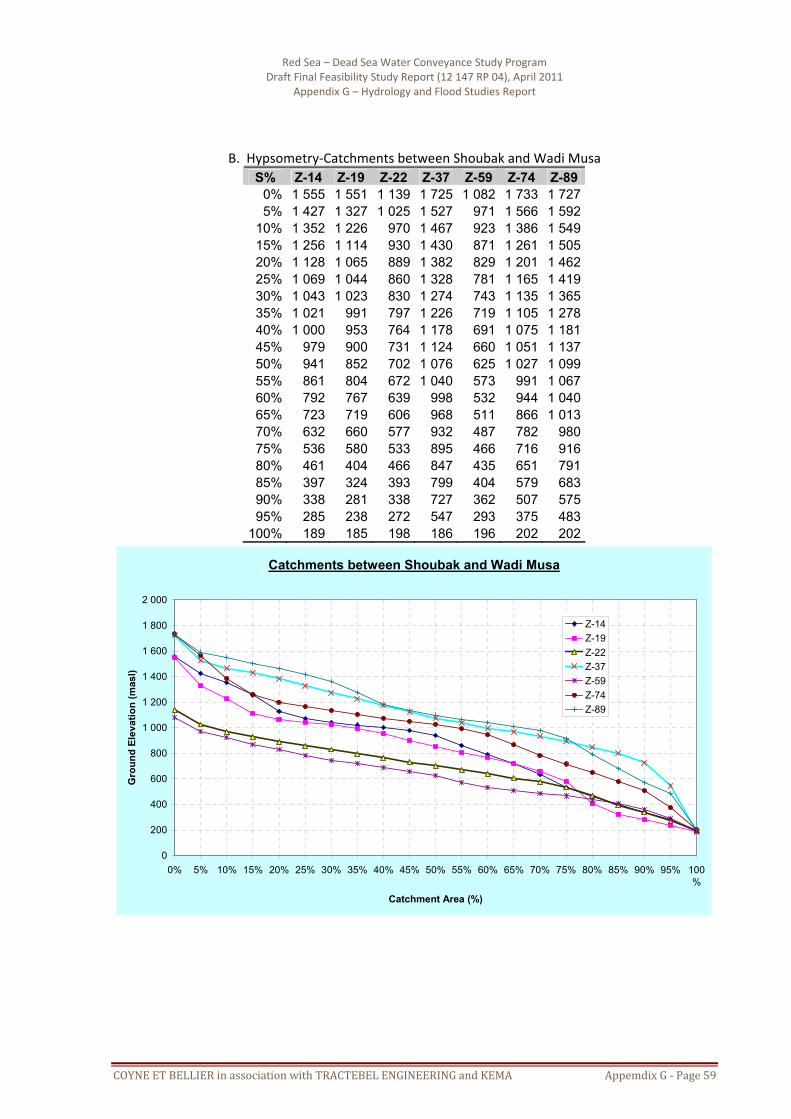
Red Sea – Dead Sea Water Conveyance Study Program Draft Final Feasibility Study Report (12 147 RP 04), April 2011
Appendix G – Hydrology and Flood Studies Report
COYNE ET BELLIER in association with TRACTEBEL ENGINEERING and KEMA Appemdix G ‐ Page 59
B. Hypsometry‐Catchments between Shoubak and Wadi Musa S% Z-14 Z-19 Z-22 Z-37 Z-59 Z-74 Z-89
0% 1 555 1 551 1 139 1 725 1 082 1 733 1 727 5% 1 427 1 327 1 025 1 527 971 1 566 1 592
10% 1 352 1 226 970 1 467 923 1 386 1 549 15% 1 256 1 114 930 1 430 871 1 261 1 505 20% 1 128 1 065 889 1 382 829 1 201 1 462 25% 1 069 1 044 860 1 328 781 1 165 1 419 30% 1 043 1 023 830 1 274 743 1 135 1 365 35% 1 021 991 797 1 226 719 1 105 1 278 40% 1 000 953 764 1 178 691 1 075 1 181 45% 979 900 731 1 124 660 1 051 1 137 50% 941 852 702 1 076 625 1 027 1 099 55% 861 804 672 1 040 573 991 1 067 60% 792 767 639 998 532 944 1 040 65% 723 719 606 968 511 866 1 013 70% 632 660 577 932 487 782 980 75% 536 580 533 895 466 716 916 80% 461 404 466 847 435 651 791 85% 397 324 393 799 404 579 683 90% 338 281 338 727 362 507 575 95% 285 238 272 547 293 375 483
100% 189 185 198 186 196 202 202
Catchments between Shoubak and Wadi Musa
0
200
400
600
800
1 000
1 200
1 400
1 600
1 800
2 000
0% 5% 10% 15% 20% 25% 30% 35% 40% 45% 50% 55% 60% 65% 70% 75% 80% 85% 90% 95% 100%
Catchment Area (%)
Gro
und
Elev
atio
n (m
asl)
Z-14Z-19Z-22Z-37Z-59Z-74Z-89

Red Sea – Dead Sea Water Conveyance Study Program Draft Final Feasibility Study Report (12 147 RP 04), April 2011
Appendix G – Hydrology and Flood Studies Report
COYNE ET BELLIER in association with TRACTEBEL ENGINEERING and KEMA Appemdix G ‐ Page 60
C. Catchments between Wadi Musa and Ras En Naqb S% Z-93 Z-115 Z-122 Z-123 Z-133 Z-141
0% 1 722 1 320 1 435 1 661 1 066 1 162 5% 1 615 1 126 1 329 1 423 808 1 014
10% 1 585 1 020 1 261 1 309 741 948 15% 1 555 897 1 178 1 224 715 896 20% 1 489 787 1 110 1 178 684 848 25% 1 418 695 1 047 1 144 651 804 30% 1 352 633 980 1 116 621 770 35% 1 299 589 892 1 093 587 741 40% 1 257 562 810 1 076 554 715 45% 1 215 540 747 1 048 530 685 50% 1 173 523 684 1 025 510 652 55% 1 132 505 611 997 494 619 60% 1 084 479 553 962 477 593 65% 1 024 452 514 917 462 563 70% 965 422 480 860 447 537 75% 851 382 446 792 433 511 80% 744 351 412 713 420 482 85% 636 312 374 610 407 445 90% 547 272 330 502 366 404 95% 475 232 252 423 303 352
100% 195 197 199 207 209 219
Catchments Between Wadi Musa and Ras En Naqb
0
200
400
600
800
1 000
1 200
1 400
1 600
1 800
2 000
0% 5% 10% 15% 20% 25% 30% 35% 40% 45% 50% 55% 60% 65% 70% 75% 80% 85% 90% 95% 100%
Catchment Area (%)
Gro
und
Elev
atio
n Z
(mas
l)
Z-93Z-115Z-122Z-123Z-133Z-141

Red Sea – Dead Sea Water Conveyance Study Program Draft Final Feasibility Study Report (12 147 RP 04), April 2011
Appendix G – Hydrology and Flood Studies Report
COYNE ET BELLIER in association with TRACTEBEL ENGINEERING and KEMA Appemdix G ‐ Page 61
Geology and Soils
64. The soils are not very developed. We notice a large amount of rocky debris on the slopes and on the bottom of thalwegs. The upper part is often constituted of limestone formations whereas the lower part, in the bottom of wadi Araba, can be basement rocks or fines debris and soft fine rocks. Slopes in the upper part tend to be milder.
65. The following illustrations show the field context of the study
Arava Valley – Typical culvert on the Aqaba – Safi Highway – Note the sparse vegetation and the debris.
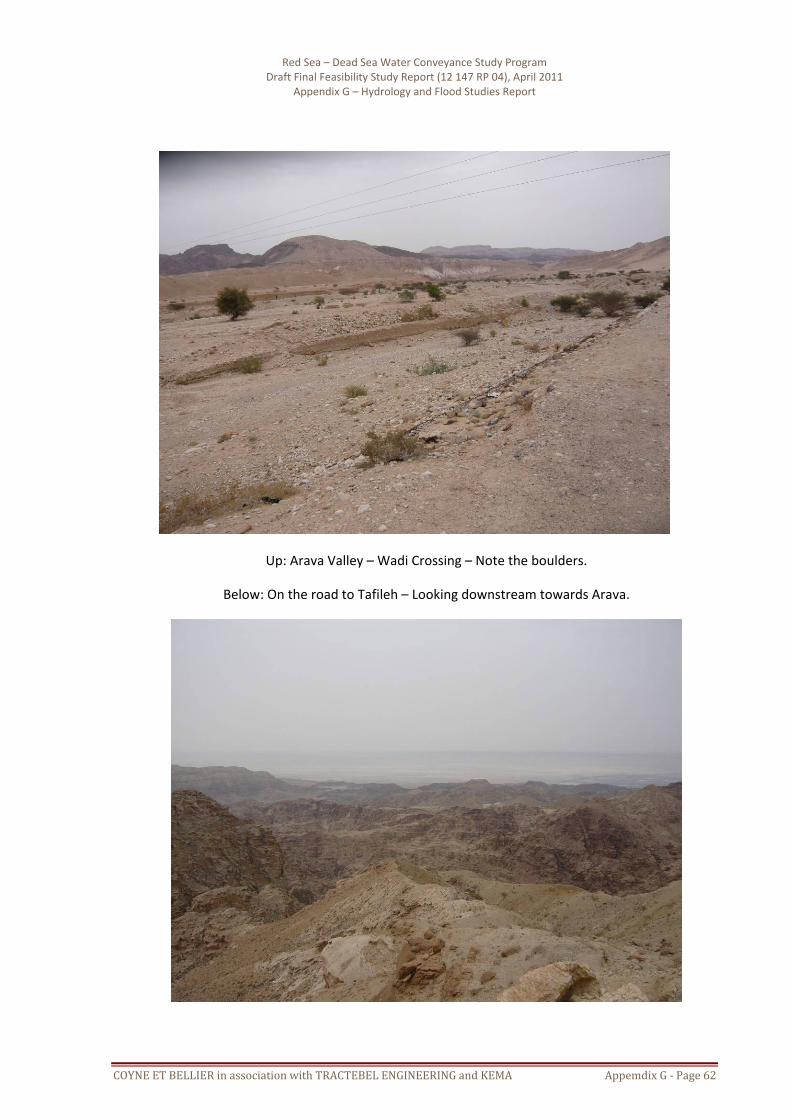
Red Sea – Dead Sea Water Conveyance Study Program Draft Final Feasibility Study Report (12 147 RP 04), April 2011
Appendix G – Hydrology and Flood Studies Report
COYNE ET BELLIER in association with TRACTEBEL ENGINEERING and KEMA Appemdix G ‐ Page 62
Up: Arava Valley – Wadi Crossing – Note the boulders.
Below: On the road to Tafileh – Looking downstream towards Arava.

Red Sea – Dead Sea Water Conveyance Study Program Draft Final Feasibility Study Report (12 147 RP 04), April 2011
Appendix G – Hydrology and Flood Studies Report
COYNE ET BELLIER in association with TRACTEBEL ENGINEERING and KEMA Appemdix G ‐ Page 63
Up: Near the water divide – Limestone and cultures
Below: between Petra and Wadi Arava

Red Sea – Dead Sea Water Conveyance Study Program Draft Final Feasibility Study Report (12 147 RP 04), April 2011
Appendix G – Hydrology and Flood Studies Report
COYNE ET BELLIER in association with TRACTEBEL ENGINEERING and KEMA Appemdix G ‐ Page 64
3.5. Computation of Flood Hydrographs
Rainstorm
66. For each catchment, we computed the yearly rainfall using the hypsometric curve and a linear gradient of rainfall vs. ground elevation. Doing so, we adopted low rainfall in the bottom of Arava Valley and relatively higher rainfall on the upper part of the djebels. Then we applied the relation giving the parameters M (Pdmx), P0 and g as functions of either Pyr or M (Pdmx). Then we applied the Weiss correction and made use of the proper storm shape.
Time of concentration and unit hydrograph
67. For each catchment, we computed the time of concentration by Kirpich’s formula and found a time to peak for rainfall duration of one hour. The USSCS unit graph served as the basis for defining the unit hydrographs.
Box 18 Cross Drainage ‐ Time of concentration and Time to Peak
A. Ghor Safi Area
Nb A ‘km²) tc (Kirpich) (h) tp (h) Rounded tp (h) 4 85,45 1,45 1,37 1,40 5 161,23 3,52 2,61 2,60 6 34,69 1,41 1,35 1,30 7 185,75 4,03 2,92 2,90
B. Catchments between Shoubak and Wadi Musa
Nb A (km²) tc (Kirpich) (h) tp (h) Rounded tp (h) 14 16,77 1,06 1,14 1,10 19 15,15 0,86 1,02 1,00 22 10,98 0,91 1,05 1,00 37 79,17 2,05 1,73 1,70 59 11,15 0,82 0,99 1,00 74 64,80 1,74 1,54 1,50 89 148,58 2,39 1,94 1,90
C. Catchments between Wadi Musa and Ras En Naqb
Nb A (km²) tc (Kirpich) (h) Tp (h) Rounded tp (h) 93 147 3,84 2,80 2,80
115 59 1,70 1,52 1,50 122 74 2,28 1,87 1,90 123 263 3,98 2,89 2,90 133 34 1,40 1,34 1,30 141 54 1,48 1,39 1,40

Red Sea – Dead Sea Water Conveyance Study Program Draft Final Feasibility Study Report (12 147 RP 04), April 2011
Appendix G – Hydrology and Flood Studies Report
COYNE ET BELLIER in association with TRACTEBEL ENGINEERING and KEMA Appemdix G ‐ Page 65
USSCS Curve Number CN
68. We defined CN in two different manners. For finding CN‐a, we assumed CN=95 at the bottom of the valley and CN=70 at the top of the catchment. Assuming a linear variation with elevation, the hypsometric curve provided the CN‐a value. For CN‐b we assume CN=75 for a thalweg slope of 1% and CN=95 for a slope of 10%. We bounded CN‐b by CN=95. The adopted CN is the average of these two estimates.
Box 19 Cross Drainage ‐ USSCS Curve Numbers CN
A. Ghor Safi Area
Nb A (km²) CN-a CN-b CN-Adopted4 85,45 92,8 91,3 92,0 5 161,23 82,9 83,6 83,3 6 34,69 92,2 87,5 89,8 7 185,75 83,2 82,6 82,9
B. Catchments between Shoubak and Wadi Musa
Nb A (km²) CN-a CN-b CN adopted14 16,77 82,7 95,0 88,8 19 15,15 83,6 95,0 89,3 22 10,98 85,9 94,7 90,3 37 79,17 78,4 87,9 83,1 59 11,15 86,9 95,0 91,0 74 64,80 82,4 90,2 86,3 89 148,58 80,2 85,1 82,7
C. Catchments between Wadi Musa and Ras En Naqb
Nb A (km²) CN-a CN-b CN adopted93 147 79,9 81,5 80,7
115 59 88,8 87,1 87,9 122 74 85,7 84,7 85,2 123 263 81,9 81,0 81,4 133 34 89,1 87,3 88,2 141 54 87,1 87,3 87,2

Red Sea – Dead Sea Water Conveyance Study Program Draft Final Feasibility Study Report (12 147 RP 04), April 2011
Appendix G – Hydrology and Flood Studies Report
COYNE ET BELLIER in association with TRACTEBEL ENGINEERING and KEMA Appemdix G ‐ Page 66
Results
69. Box 20 details the obtained results. The supporting documents contain a number of tables that complete the information. It can be seen that the floods can be important.
Box 20 Cross Drainage ‐ Flood Peaks vs. Return Periods
Catchment A (km²) Q-2 Q-5 Q-10 Q-50 Q-100 Q-300 Q-500 Q-1000 Q-4000 Q-5000 Q-10000 PMF
Ghor Safi Area 4 85 27 69 102 178 209 264 289 321 390 401 433 1 2145 161 15 48 75 147 179 235 261 296 367 378 420 1 2486 35 8 24 37 71 84 109 121 137 168 173 190 562 7 186 16 47 76 149 182 239 266 304 381 393 439 1 345
Catchments between Shoubak and Wadi Musa 14 17 12 22 29 45 52 63 68 75 89 91 98 239 19 15 12 22 29 45 52 62 67 74 88 90 97 238 22 11 10 18 23 37 42 51 55 61 72 74 79 198 37 79 33 66 91 150 175 218 238 265 318 326 356 895 59 11 9 18 23 37 42 51 55 60 72 74 79 197 74 65 16 43 44 106 127 159 173 195 238 245 265 728 89 149 21 63 101 202 244 323 360 407 507 523 572 1 710
Catchments between Wadi Musa and Ras En Naqb
93 147 3 18 35 83 105 148 168 200 262 272 302 1 090115 59 5 25 40 85 108 141 156 181 223 230 252 797 122 74 4 20 38 85 111 151 169 193 247 256 281 943 123 263 4 22 48 121 159 227 259 298 397 413 465 1 737133 34 3 15 26 57 65 87 97 112 140 144 160 518
141 54 4 23 40 81 102 134 149 169 211 218 241 753
(m3/s)
3.6. Analysis of Results
70. In order to assess the reliability of the obtained results, we compared the 100‐yr and the PMF peaks to similar data obtained either in Jordan or in other countries. Box 21presents such a comparison. The flood data come from several countries of Maghreb and correspond to both humid and arid catchments. The floods obtained for RSDS lie in the lower part of the scatter diagram, but this is normal since the Red Sea / Dead Sea Area is particularly arid.
71. In addition to this comparison with other catchments, we tested the consistency of the results by studying the relations between the specific peak discharge Qp/A, the catchment area A and the main thalweg slope i. Box 22 shows that the results are consistent.

Red Sea – Dead Sea Water Conveyance Study Program Draft Final Feasibility Study Report (12 147 RP 04), April 2011
Appendix G – Hydrology and Flood Studies Report
COYNE ET BELLIER in association with TRACTEBEL ENGINEERING and KEMA Appemdix G ‐ Page 67
Box 21 Cross Drainage ‐ Flood Peaks vs. Catchment Area ‐ Analysis of Results
T = 100 year - Flood Peak vs. Catchment Area
1
10
100
1 000
10 000
100 000
1 10 100 1 000 10 000 100 000
Catchment Area A (km²)
Peak
Dis
char
ge Q
p (m
3/s)
Algeria Libya Morocco Tunisia K=2.77K=5.33 RSDS Hisban Harza WalaMujib Wadi Yutum MWH Wadi Yutum RSDS
T = 10 000 year and PMF - Flood Peak vs. Catchment Area
1
10
100
1 000
10 000
100 000
1 10 100 1 000 10 000 100 000
Catchment Area A (km²)
Floo
d Pe
ak Q
p (m
3/s)
Algeria Libya Morocco Tunisia K=4.18K=5.96 Harza-100 RSDS Wala MujibPMF-RSDS Wala-PMF Mujib-PMF Wadi Yutum -10 000 Wadi Yutum PMF

Red Sea – Dead Sea Water Conveyance Study Program Draft Final Feasibility Study Report (12 147 RP 04), April 2011
Appendix G – Hydrology and Flood Studies Report
COYNE ET BELLIER in association with TRACTEBEL ENGINEERING and KEMA Appemdix G ‐ Page 68
Box 22 Cross Drainage ‐ Specific Flood Peak Qp/A vs. Area and Thalweg Slope
Specific Peak Discharge Qp/A vs. Catchment Area A
y = 14,9 x -0,53
R 2 = 0,84
y = 21,6 x -0,42
R 2 = 0,84
0
1
2
3
4
5
6
7
8
9
0 50 100 150 200 250 300
Catchment Area A (km²)
Spec
ific
Peak
Dis
char
ge Q
p/A
(m3/
s/km
²)
Q100/AQ10 000/APower Fit - APower Fit - B
Specific Flood Peak (Qp/A) vs. Main Thalweg Slope (i)
y = 89,3 x 1,46
R 2 = 0,84
y = 78,8 x 1,11
R 2 = 0,78
0
1
2
3
4
5
6
7
8
9
0 0,02 0,04 0,06 0,08 0,1 0,12 0,14 0,16
Main Thalweg Slope i (m/m)
Spec
ific
Floo
d Pe
ak Q
p/A
(m3/
s/km
²)
Q100/AQ10 000/APower Fit - APower Fit - B

Red Sea – Dead Sea Water Conveyance Study Program Draft Final Feasibility Study Report (12 147 RP 04), April 2011
Appendix G – Hydrology and Flood Studies Report
COYNE ET BELLIER in association with TRACTEBEL ENGINEERING and KEMA Appemdix G ‐ Page 69
4. MISCELLANEOUS
4.1. Objectives and Content
72. So far, we have studied the main catchments that can yield flood risks with respect to the canal alignments. It remain to address the following topic:
• What are the available parameters to be used for applying the rational method for small problem of local or cross drainage?
73. The present section aims at answering to this question by providing information about the following points:
• Definition of the 24‐hour reference precipitations.
• Definition of the IDF values.
• Impact of climate change on IDF patterns
4.2. Definition of the 24‐hour Reference Precipitation
74. For the cross drainage of small catchments or for local drainage at some point of interest, the rational method is likely to be used. This method implies to know IDF values at the location of interest.
75. In a first step, one has to define the 24‐hour reference precipitation. For this we suggest the following approach:
• Assess the yearly rainfall, Pyr, at the location of interest.
• Make use of the relations detailed previously to compute successively:
M = 0.142 Pyr + 6.66.
P0 = 0.947 M – 4.85.
G = 0.167 M + 5.63.
• Compute the daily rainfall and the 24‐hour rainfall for the required frequency F by:
Pdmx (F) = P0 + G x u(F).
P24 (F) = 1.13 x Pdmx (F).
76. If reliable raingauges exist in the vicinity, use can be made of the results of these raingauges for assessing the required P24.

Red Sea – Dead Sea Water Conveyance Study Program Draft Final Feasibility Study Report (12 147 RP 04), April 2011
Appendix G – Hydrology and Flood Studies Report
COYNE ET BELLIER in association with TRACTEBEL ENGINEERING and KEMA Appemdix G ‐ Page 70
4.3. Definition of the IDF values
77. We suggest the use of the following α coefficents:
Pyr α Pyr ≤ 100 0,257101≤Pyr≤150 0,348151≤Pyr≤200 0,420Pyr≥201 0,485
78. In case of doubts or very arid area, take α = 0,140 which corresponds to very intense storm.
4.4. Some Comments Related to the Pipeline Option
79. At this stage of the study, it would not be very useful to compute floods for every drainage lines that would be crossed by the pipeline since it will be buried. The material presented in this report allows for finding the hydrological parameters needed to solve flood and drainage problems for the following specific points:
o The area of the pumping station.
o The areas of the hydropower plant and of the desalination plant.
80. In addition to these specific points, there is a “wet area”, known also as the Yotvata Plain, located some 35 km north of the shoreline. In this area, we considered a buried pipes option to avoid both environmental and structural issues.
4.5. Impact of Climate Change on IDF
81. The various impacts of climate change are discussed in a separate report to which the interested reader is referred. Findings of this report associated to the 2007 report about climate change (chapter 11 of the physical base) provided the basis for the present assessment. Like any other appraisal about climate change, uncertainty can be great.
82. Basically, all considered models forecast an increase of temperature for the study area. This increase results in two contrasted changes:
• Since the temperature increases, the evaporation increases and the water resources decrease, including runoff.
• Since the temperature increases, the water content of the atmosphere (Precipitable Water, PW) increases. Thus, storm amounts might increase with respect to present conditions.

Red Sea – Dead Sea Water Conveyance Study Program Draft Final Feasibility Study Report (12 147 RP 04), April 2011
Appendix G – Hydrology and Flood Studies Report
COYNE ET BELLIER in association with TRACTEBEL ENGINEERING and KEMA Appemdix G ‐ Page 71
83. In this section, we computed the variation of rainstorm amounts for the period 2080/2099 with respect to 1980/1999 conditions (present). Table 11.1 of the Regional Climate Projections, page 854, quotes the following information.
Temperatures Changes (in °C/10) – 2080/2099 vs. 1980/1999
Season Region Min 25% 50% 75% MaxDJF SAH 24 29 32 35 50 MAM SAH 23 33 36 38 52 JJA SAH 26 36 41 44 58 SON SAH 28 34 37 43 54 DJF SEM 17 25 26 33 46 MAM SEM 20 30 32 35 45 JJA SEM 27 37 41 50 65 SON SEM 23 28 33 40 52 Notes: 21 global models considered for scenario A1B.
Red Sea area is located in SAH region. Dead Sea, Israel and Jordan are part of SEM Region.
84. According to meteorological patterns, the following assumption about change in surface temperature can be made.
Season Observations Results DJF Mediteranean governs Change = 2/3 SEM and 1/3 SAH MAM Med and RS govern Change = 1/2 SEM and 1/2 SAH JJA Red Sea governs but no rain No rains SON Red Sea governs Change = 1/3 SEM and 2/3 SAH
85. Using the preceding assumption, we computed the temperature change for each season and
for the set of 21 global models. Doing so, we found d a range of increase varying between 1,93 °C and 5,33 °C.
Temperature Change (°C) in the Study Area
Season Min 25% 50% 75% MaxSON 2,63 3,20 3,57 4,20 5,33DJF 1,93 2,63 2,80 3,37 4,73MAM 2,15 3,15 3,40 3,65 4,85
86. We associated this range of changes with sea surface temperature which is known as being
representative of dew point. Doing so, we found the possible range of dew points for the future conditions of 2080/2099.
Dew Point (°C) in the Study Area
Season Present Min 25% 50% 75% MaxSON 25 27,6 28,2 28,6 29,2 30,3DJF 15 16,9 17,6 17,8 18,4 19,7MAM 20 22,2 23,2 23,4 23,7 24,9

Red Sea – Dead Sea Water Conveyance Study Program Draft Final Feasibility Study Report (12 147 RP 04), April 2011
Appendix G – Hydrology and Flood Studies Report
COYNE ET BELLIER in association with TRACTEBEL ENGINEERING and KEMA Appemdix G ‐ Page 72
87. Making use of WMO publications on PMP, we have been able to compute the water content of the atmosphere, (precipitable water, PW) and the likely storm amount increase. These results are presented below (2 tables and 1 graph).
Precipitable Water PW (mm) in the Study Area
Season Present Min 25% 50% 75% Max SON 80,8 103,7 108,6 111,8 117,3 127,1 DJF 34,1 41,3 43,8 44,5 46,6 51,6 MAM 52,6 64,7 70,4 71,8 73,2 80,0
Storm Amount (%) in the Study Area
Season Present Min 25% 50% 75% Max SON 100,0 128,3 134,4 138,3 145,1 157,3 DJF 100,0 121,0 128,6 130,4 136,5 151,4 MAM 100,0 123,1 133,8 136,5 139,1 152,0
Period 2080/2099 - Scenario A1B - 21 Global Models - Possible range of future Storm Amounts
0102030405060708090
100110120130140150160170
Present Min 25% 50% 75% Max
Deduced from Table 11.1 of Regional Climate Projections
Stor
m A
mou
nt in
Per
cent
age
of P
rese
nt C
limat
e (%
) SON DJF MAM
88. From the preceding, it appears that the storm amounts could be about 130% of the present amounts (1980/1999). The possible range is between 120% and 150%. We suggest being very cautious about any use of these estimates.
Red Sea – Dead Sea Water Conveyance Study Program Draft Final Feasibility Study Report (12 147 RP 04), April 2011
Appendix G – Hydrology and Flood Studies Report
COYNE ET BELLIER in association with TRACTEBEL ENGINEERING and KEMA Appemdix G ‐ Page 73
5. FLOODS AT THE ENTRANCE OF TRUCE CANAL
5.1. General
89. In 1992, the Consultant in charge of the design performed the hydrologic study of Wadi Hasa at Tannur dam. Our study team gathered pieces of information about floods at Tannur Dam from this study. In 1994, Gibbs studied for the Arab Potash Company (APC) the floods at the entrance of the Truce Canal. We analysed this flood report. Note that the Gibbs study (1994) followed a 1979 flood study by the Institute of Hydrology (IOH, Wallingford).
90. At present, Tannur Dam has been completed. There have been no downstream releases or flood flows over the spillway since the dam was built because it has never filled completely since commissioning.
91. In order to obtain our own assessment of flood risks at the entrance of Truce Canal, we processed the available data in the following manner.
• In a first step, we studied the floods of Wadi Hasa at its mouth with the main stream (Wadi Arava). For this purpose, we used the discharge sample at Tannur dam together with the rainfall data quoted in the 1992 documents. We applied both statistical and unit‐graph approaches.
• In a second step, we defined the characteristics of the different sub‐catchments of Wadi Arava. We used delineations consistent with the IOH and Gibbs approaches. This allowed computing floods hydrographs of the various sub catchments at their confluence with Wadi Arava mainstream. We routed these flood hydrographs towards the entrance of Truce Canal using the Muskingum method.
• In a third step, we combined the obtained results to obtain the flood frequency curve at the entrance of Truce Canal. Lastly, we defined a number of hydrograph shapes to illustrate better our findings.
5.2. Wadi Hasa Floods
5.2.1. Statistical Analysis of Floods at Tannur
92. Box 23 details the available data. It appears that a root‐Gumbel distribution fits well the data. We adopted flood estimates that are the average of the previous estimates (Hershfield’s fit) and of the root‐Gumbel estimates.
93. We transposed the adopted peaks at Tannur (2 160 km²) to the outlet of sub catchment 4 (2 502 km²) making use of the Francou‐Rodier’s flood index (K(Qp)).

Red Sea – Dead Sea Water Conveyance Study Program Draft Final Feasibility Study Report (12 147 RP 04), April 2011
Appendix G – Hydrology and Flood Studies Report
COYNE ET BELLIER in association with TRACTEBEL ENGINEERING and KEMA Appemdix G ‐ Page 74
Box 23: Truce Canal ‐ Statistical Analysis of Flood Peaks at Tannur
A. Sample of Flood Peaks at Tannur (A = 2 160 km²)
Water Year Rank F u(Gumbel) Qp Excluded √Gumbel (m3/s) (m3/s)
77 1 0,031 -1,243 2,4 1,1 83 2 0,094 -0,862 3,1 7,1 69 3 0,156 -0,619 8,3 14 88 4 0,219 -0,419 15 21 82 5 0,281 -0,238 41 28 84 6 0,344 -0,066 43 37 72 7 0,406 0,104 50 46 68 8 0,469 0,277 56 57 71 9 0,531 0,458 78 69 73 10 0,594 0,651 80 83 81 11 0,656 0,865 93 100 85 12 0,719 1,108 124 122 74 13 0,781 1,399 166 151 70 14 0,844 1,773 171 193 80 15 0,906 2,318 290 263 79 16 0,969 3,450 420 442 75 0 76 NA 78 NA 86 NA 87 NA
Sample Size (n) 16 16 Sample Mean (M) 103 102 Sample Standard Deviation (S) 114 116 Sample Coefficient of Variation (Cv=S/M) 1,11 1,14 Sample Median (Me) 67 63

Red Sea – Dead Sea Water Conveyance Study Program Draft Final Feasibility Study Report (12 147 RP 04), April 2011
Appendix G – Hydrology and Flood Studies Report
COYNE ET BELLIER in association with TRACTEBEL ENGINEERING and KEMA Appemdix G ‐ Page 75
Wasi Hasa at Tannur Dam (A = 2 160 km²) - Flood Peak vs. Gumbel Variate
0
50
100
150
200
250
300
350
400
450
500
-2 -1 0 1 2 3 4
Gumbel Variate u(Gumbel)
Peak
Dis
char
ge Q
p (m
3/s)
Qp√Gumbel
B. Flood Peaks vs. Return Period at Tannur Dam and at Confluence with Arava
T √Gumbel Hershfield’s Fit Ratio Adopted K(Qp) Catch. Nb 4 (years) (m3/s) (m3/s) (m3/s) (m3/s)
2 62 60 1,04 61 0,97 70 5 162 155 1,05 159 1,86 179
10 254 235 1,08 244 2,26 273 50 527 450 1,17 490 2,91 544 100 673 550 1,22 610 3,11 675 500 1 076 800 1,35 936 3,51 1 030
1 000 1 279 910 1,41 1 092 3,66 1 200 5 000 1 816 1 134 1,60 1 472 3,93 1 610 10 000 2 077 1 230 1,69 1 650 4,036 1 800
PMF 3 080 4 132 4,890 4 454
5.2.2. Flood Hydrographs of Wadi Hasa
94. The study team computed the flood hydrographs using the USSCS method in a manner similar to the approach used for the cross drainage study. We have given relevant details in the Supporting Documents. For Wadi Hasa, we selected CN values in order to obtain flood peaks consistent with the statistical approach.
95. To route the flood hydrographs to the entrance of Truce Channel, we made use of the Muskingum approach. Box 24 displays some illustrations and results about floods of wadi Hasa.

Red Sea – Dead Sea Water Conveyance Study Program Draft Final Feasibility Study Report (12 147 RP 04), April 2011
Appendix G – Hydrology and Flood Studies Report
COYNE ET BELLIER in association with TRACTEBEL ENGINEERING and KEMA Appemdix G ‐ Page 76
Box 24 Truce Canal ‐ Floods of Wadi Hasa
A. Illustrations
Wadi Hasa Nb 4 (2 502 km²) - Usual Floods
0
50
100
150
200
250
300
350
400
450
500
550
0 6 12 18 24 30 36 42 48 54 60 66 72 78
Time t (hours)
Dis
char
ge Q
(m3/
s)
Q-2Q-5Q-10Q-50Q-2 DSQ-5 DSQ-10 DSQ-50 DS
Wadi Hasa Nb 4 (2 502 km²) - Extreme Floods
0
200
400
600
800
1 000
1 200
1 400
1 600
1 800
0 6 12 18 24 30 36 42 48 54 60 66 72 78
Time t (hours)
Dis
char
ge Q
(m3/
s)
Q-100Q-500Q-1000Q-5000Q-10000Q-100 DSQ-500 DSQ-1000 DSQ-5000 DSQ-10000 DS

Red Sea – Dead Sea Water Conveyance Study Program Draft Final Feasibility Study Report (12 147 RP 04), April 2011
Appendix G – Hydrology and Flood Studies Report
COYNE ET BELLIER in association with TRACTEBEL ENGINEERING and KEMA Appemdix G ‐ Page 77
Wadi Hasa Nb 4 (2 502 km²) - Probable Maximum Flood (PMF)
0
500
1 000
1 500
2 000
2 500
3 000
3 500
4 000
4 500
0 10 20 30 40 50 60 70 80
Time t (hours)
Dis
char
ge Q
(m3/
s)
B. Flood Peak vs. Returm Period
T U(Gumbel) Qp-DS √Gumbel(years) (m3/s) (m3/s)
2 0,367 59 715 1,500 153 156
10 2,250 237 23250 3,902 472 449
100 4,600 584 562500 6,214 893 873
1 000 6,907 1 045 1 0285 000 8,517 1 413 1 435
10 000 9,210 1 584 1 631 PMF 3 962
√Qp = 3,616 u(Gumbel) + 7,080

Red Sea – Dead Sea Water Conveyance Study Program Draft Final Feasibility Study Report (12 147 RP 04), April 2011
Appendix G – Hydrology and Flood Studies Report
COYNE ET BELLIER in association with TRACTEBEL ENGINEERING and KEMA Appemdix G ‐ Page 78
Wadi Hasa Nb 4 - Flood Peak vs. Gumbel Variate
0
200
400
600
800
1 000
1 200
1 400
1 600
1 800
0 1 2 3 4 5 6 7 8 9 10
Gumbel Variate u(Gumbel)
Floo
d Pe
ak (Q
p) (m
3/s)
Qp-DS√Gumbel
5.3. Flood Hydrographs of Other Subcatchments
5.3.1. Description of Subcatchments
96. Box 25 details the characteristics of the 8 subcatchments considered herein. The Arava catchment at the entrance of Truce Canal is large (about 13 800 km²). The difference of elevation between the summits and the bottom of the valley can be also important.
97. We computed the time of concentration according to Kirpich’s formula and defined the 10 –mm unit graph of each sub catchment. The box presents also the hypsometry of the sub catchments.
Box 25 Truce Canal ‐ Characteristics of Subcatchments
A. Information about Subcatchments
Nb Catchment Obs. Area Zmin Zmax Zmean Lmax L-DS i tc tp-adopted v (km²) (m) (m) (m) (km) (km) (m/m) (hours) (hours) (km/h)0 Main stream Arava axis 932 -411 1 116 -62 107 0 0,0143 12,4 8 8,644 Wadi Hasa Right Bank (Jo) 2 502 -405 1 592 923 126 6 0,0158 13,5 9 9,342 Left Bank (Is) 1 662 -393 913 315 118 13 0,0111 14,7 9 8,025 Right Bank (Jo) 419 -390 1 605 580 45 16 0,0440 4,1 3 10,943 Right Bank (Jo) 1 959 -389 1 733 501 45 20 0,0470 4,0 3 11,221a Left Bank (Is) 1 408 -272 1 012 358 74 39 0,0174 8,6 6 8,561b Left Bank (Is) 3 608 74 1 059 602 160 94 0,0061 23,4 15 6,861c Left Bank (Is) 1 283 76 881 417 95 94 0,0084 13,9 9 6,88 Total 13 773

Red Sea – Dead Sea Water Conveyance Study Program Draft Final Feasibility Study Report (12 147 RP 04), April 2011
Appendix G – Hydrology and Flood Studies Report
COYNE ET BELLIER in association with TRACTEBEL ENGINEERING and KEMA Appemdix G ‐ Page 79
B. Location of Sub Catchments
Truce Canal - Subcatchment Area vs. Distance from Truce Canal
0
500
1 000
1 500
2 000
2 500
3 000
3 500
4 000
0 10 20 30 40 50 60 70 80 90 100
Distance from Truce Canal (km)
Cat
chm
ent A
rea
(km
²)
Main stream4 - Wadi Hasa2531a1b1cLink
C. Unitgraphs
Truce Canal - Unitgraphs (10 mm) for Sub-catchments
0
200
400
600
800
1 000
1 200
1 400
1 600
0 6 12 18 24 30 36 42 48 54 60 66 72 78 84 90
Time (hours)
Dis
char
ge (m
3/s)
QHU-5QHU-3QHU-1aQHU-MSQHU-4QHU-2QHU-1cQHU-1b
For 1b: 2-hour unitgraph.
For the others 1-hour unitgraph.

Red Sea – Dead Sea Water Conveyance Study Program Draft Final Feasibility Study Report (12 147 RP 04), April 2011
Appendix G – Hydrology and Flood Studies Report
COYNE ET BELLIER in association with TRACTEBEL ENGINEERING and KEMA Appemdix G ‐ Page 80

Red Sea – Dead Sea Water Conveyance Study Program Draft Final Feasibility Study Report (12 147 RP 04), April 2011
Appendix G – Hydrology and Flood Studies Report
COYNE ET BELLIER in association with TRACTEBEL ENGINEERING and KEMA Appemdix G ‐ Page 81
D. Hypsometry
-600
-400
-200
0
200
400
600
800
1 000
1 200
1 400
1 600
1 800
2 000
0 5 10 15 20 25 30 35 40 45 50 55 60 65 70 75 80 85 90 95 100
Sub catchment Area (%)
Gro
und
Ele
vatio
n Z
(mas
l)
5 - 418 km²1a- 1 403 km²3 - 1 951 km²2 - 1 661 km² 4 - 2499 km²
5.3.2. Rainstorms and CN values
98. Box 26 details information about rainstorms. Part A quotes information about the Israeli side for which Yodfat provided data on yearly and monthly precipitation. It can be noticed that yearly rainfall is comparable to the rainfall on the Jordan side. Thus, we have applied the formulas found for Jordan in order to derive daily values.
99. Part B presents data about Area Reduction Factor, yearly rainfall, and α parameter (used in defining storm profiles) whereas part C details the 24‐hr rainfall. CN values were obtained by trial and error approach in order to obtain results consistent with those obtained for Wadi Hasa.

Red Sea – Dead Sea Water Conveyance Study Program Draft Final Feasibility Study Report (12 147 RP 04), April 2011
Appendix G – Hydrology and Flood Studies Report
COYNE ET BELLIER in association with TRACTEBEL ENGINEERING and KEMA Appemdix G ‐ Page 82
Box 26 Truce Canal ‐ Information about Rainstorms
A. Rainfall – Israeli Side
Station Pyr M P0 G (mm/year) (mm/day) (mm/day) (mm/day)
Yotvata 25,3 10,26 4,86 7,34 Paran 25,6 10,30 4,90 7,35 Eilat 27,1 10,51 5,10 7,38 Hatzeva 33,4 11,40 5,95 7,53 Sodom 41,4 12,53 7,02 7,72
B. Area Reduction Factor – Yearly Rainfall
Catchment L-DS A ARF ARFx1,13 Pyr α (km) (km²) (mm/year)
Main Stream - 932 km² 0 932 0,828 0,936 65 0,257 Catchment 4 - 2 502 km² 6 2 502 0,773 0,874 159 0,420 Catchment 2 - 1 662 km² 13 1 662 0,797 0,901 82 0,257 Catchment 5 - 419 km² 16 419 0,886 1,001 118 0,348 Catchment 3 - 1 959 km² 20 1 959 0,789 0,891 105 0,348 Catchment 1a - 1 408 km² 39 1 408 0,806 0,911 86 0,257 Catchment 1b - 3 608 km² 94 3 608 0,743 0,840 116 0,348 Catchment 1 c - 1 283 km² 94 1 283 0,811 0,916 98 0,257
C. Areal Rainfall – 24‐hour Rainfall (mm)
T Cat. 0 Cat. 1 a Cat. 1b Cat. 1c Cat. 2 Cat. 3 Cat. 4 Cat. 5 (years) Arava Israel Israel Israel Israel Jordan Hasa Jordan
2 12,3 14,9 17,2 16,4 14,1 16,9 15,0 20,9 5 21,1 23,9 26,2 25,8 23,0 26,3 23,9 31,7
10 26,9 29,9 32,2 32,1 28,9 32,5 29,8 38,9 50 39,7 43,2 45,4 45,8 41,8 46,1 42,7 54,7
100 45,1 48,8 50,9 51,6 47,3 51,8 48,1 61,3 500 57,6 61,7 63,8 64,9 59,9 65,1 60,7 76,7
1 000 63,0 67,2 69,3 70,7 65,4 70,8 66,2 83,4 5 000 75,5 80,1 82,1 84,1 78,0 84,1 78,7 98,8
10 000 80,9 85,7 87,7 89,8 83,4 89,8 84,2 105,4 PMP 199 205 195 212 201 210 197 244
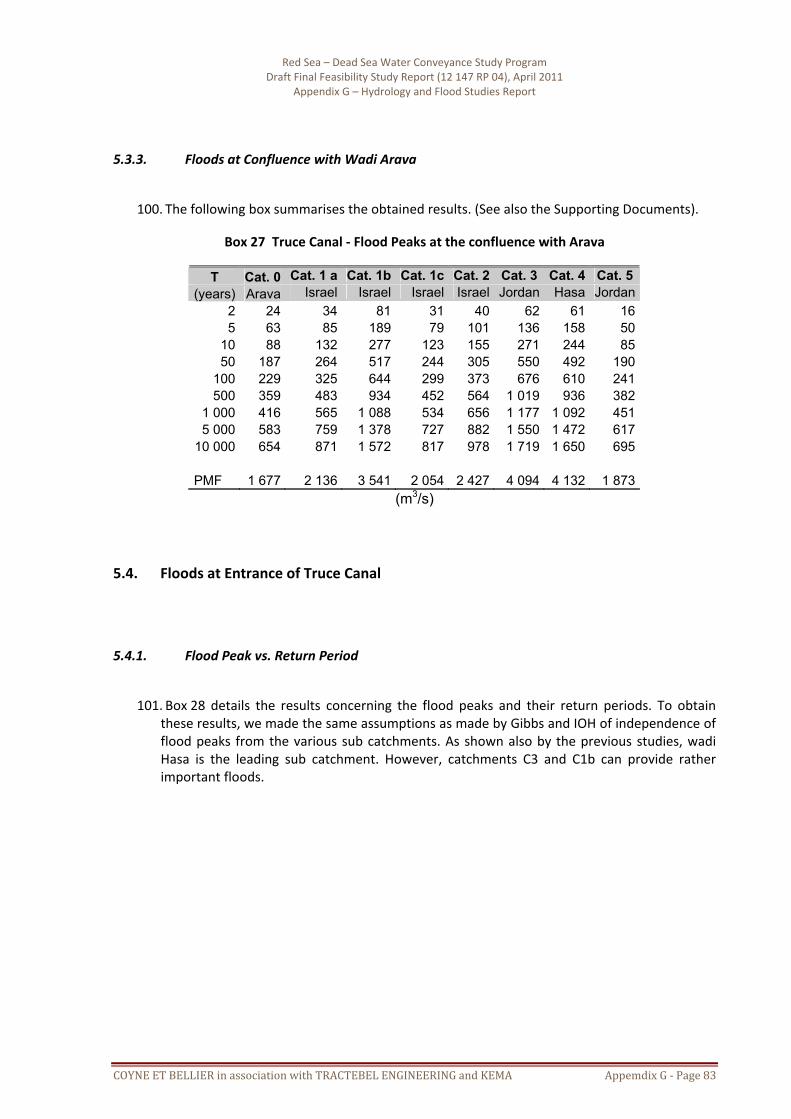
Red Sea – Dead Sea Water Conveyance Study Program Draft Final Feasibility Study Report (12 147 RP 04), April 2011
Appendix G – Hydrology and Flood Studies Report
COYNE ET BELLIER in association with TRACTEBEL ENGINEERING and KEMA Appemdix G ‐ Page 83
5.3.3. Floods at Confluence with Wadi Arava
100. The following box summarises the obtained results. (See also the Supporting Documents).
Box 27 Truce Canal ‐ Flood Peaks at the confluence with Arava
T Cat. 0 Cat. 1 a Cat. 1b Cat. 1c Cat. 2 Cat. 3 Cat. 4 Cat. 5 (years) Arava Israel Israel Israel Israel Jordan Hasa Jordan
2 24 34 81 31 40 62 61 16 5 63 85 189 79 101 136 158 50
10 88 132 277 123 155 271 244 85 50 187 264 517 244 305 550 492 190
100 229 325 644 299 373 676 610 241 500 359 483 934 452 564 1 019 936 382
1 000 416 565 1 088 534 656 1 177 1 092 451 5 000 583 759 1 378 727 882 1 550 1 472 617
10 000 654 871 1 572 817 978 1 719 1 650 695 PMF 1 677 2 136 3 541 2 054 2 427 4 094 4 132 1 873
(m3/s)
5.4. Floods at Entrance of Truce Canal
5.4.1. Flood Peak vs. Return Period
101. Box 28 details the results concerning the flood peaks and their return periods. To obtain these results, we made the same assumptions as made by Gibbs and IOH of independence of flood peaks from the various sub catchments. As shown also by the previous studies, wadi Hasa is the leading sub catchment. However, catchments C3 and C1b can provide rather important floods.

Red Sea – Dead Sea Water Conveyance Study Program Draft Final Feasibility Study Report (12 147 RP 04), April 2011
Appendix G – Hydrology and Flood Studies Report
COYNE ET BELLIER in association with TRACTEBEL ENGINEERING and KEMA Appemdix G ‐ Page 84
Box 28 Truce Canal ‐ Flood Peak vs. Return Period
A. Flood Peak vs. Return Period
T u (Gumbel) Qp K(Qp)(years) (m3/s)
2 0,367 164 0,205 1,500 275 0,78
10 2,250 364 1,0950 3,902 604 1,66
100 4,600 723 1,87500 6,214 1 040 2,27
1 000 6,907 1 194 2,435 000 8,517 1 592 2,75
10 000 9,210 1 781 2,88 PMF 4 417 3,90
√Qp = 3,323 u (Gumbel) +11,603
B. Entrance of Truce Canal and Sub catchments – Flood Peaks
Truce Canal - Flood Peaks vs. Return Period
10
100
1 000
10 000
1 10 100 1 000 10 000
Return Period T (years)
Floo
d Pe
aks
Qp
(m3/
s)
Truce Canal C0 C4 (Hasa) C2 C5 C3 C1a C1b C1c

Red Sea – Dead Sea Water Conveyance Study Program Draft Final Feasibility Study Report (12 147 RP 04), April 2011
Appendix G – Hydrology and Flood Studies Report
COYNE ET BELLIER in association with TRACTEBEL ENGINEERING and KEMA Appemdix G ‐ Page 85
T Truce Canal C0 C4 (Hasa) C2 C5 C3 C1a C1b C1c
(years) (m3/s) (m3/s) (m3/s) (m3/s) (m3/s) (m3/s) (m3/s) (m3/s) (m3/s)2 164 24 59 39 15 57 29 62 225 275 63 153 97 45 121 70 146 55
10 364 88 237 150 74 232 107 215 8450 604 187 472 295 161 452 211 399 164
100 723 229 584 361 204 551 259 496 200500 1 040 359 893 543 322 822 379 716 300
1 000 1 194 416 1 045 630 379 949 441 833 3535 000 1 592 583 1 413 849 523 1 247 588 1 055 478
10 000 1 781 654 1 584 943 591 1 383 673 1 203 535 PMF 4 417 1 677 3 962 2 340 1 591 3 293 1 650 2 712 1 344 A (km²) 13 773 932 2 502 1 662 419 1 959 1 408 3 608 1 283
Note: For sub catchments Qp are peaks routed to Truce Canal.
5.4.2. Flood Hydrographs
102. Box 29 presents illustrations of usual and extreme floods. As shown by the graphs, it appears clearly that various clustering of sub catchments yield either usual or extreme floods. The computations are given for the natural state. However, Tannur dam does not reduce flood peaks for extreme floods. For instance, the dam spills the PMF without reduction of peak magnitude.

Red Sea – Dead Sea Water Conveyance Study Program Draft Final Feasibility Study Report (12 147 RP 04), April 2011
Appendix G – Hydrology and Flood Studies Report
COYNE ET BELLIER in association with TRACTEBEL ENGINEERING and KEMA Appemdix G ‐ Page 86
Box 29 Truce Canal ‐ Flood Hydrographs ‐ Usual and Extreme Floods
A. Examples of Usual Floods – T = 2 years
Truce Canal - Flood Hydrograph - T = 2 years - Without contribution of C1a to C1c.
0
20
40
60
80
100
120
140
160
180
200
0 6 12 18 24 30 36 42 48 54 60 66 72 78
Time t (hours)
Dis
char
ge Q
(t) (m
3/s)
C0C4C5C3C2SumT=2 year
Truce Canal - Flood Hydrograph - T = 2 years - Contribution of C0, C2, C1a to C1c
0
20
40
60
80
100
120
140
160
180
0 6 12 18 24 30 36 42 48 54 60 66 72 78
Time t (hours)
Dis
char
ge Q
(t) (m
3/s)
C0C2C1aC1bC1cSumT=2 years

Red Sea – Dead Sea Water Conveyance Study Program Draft Final Feasibility Study Report (12 147 RP 04), April 2011
Appendix G – Hydrology and Flood Studies Report
COYNE ET BELLIER in association with TRACTEBEL ENGINEERING and KEMA Appemdix G ‐ Page 87
B. Examples of Extreme Floods – T = 10 000 years
Truce Canal - Extreme Flood - T = 10 000 years - Contribution of C4 and C5
0
200
400
600
800
1 000
1 200
1 400
1 600
1 800
2 000
0 6 12 18 24 30 36 42 48 54 60 66 72
Time t (hours)
Dis
char
ge Q
(t) (m
3/s)
C4C5SumT=10 000 year
Truce Canal - Extreme Floods - T = 10 000 years - Contribution of C0, C2, C1a to C1c
0
200
400
600
800
1 000
1 200
1 400
1 600
1 800
2 000
0 6 12 18 24 30 36 42 48 54 60 66 72
Time t (hours)
Dis
char
ge Q
(t) (m
3/s)
C0-50C2-500C1a-500C1b-5000C1c-1000SumT=10 000 years
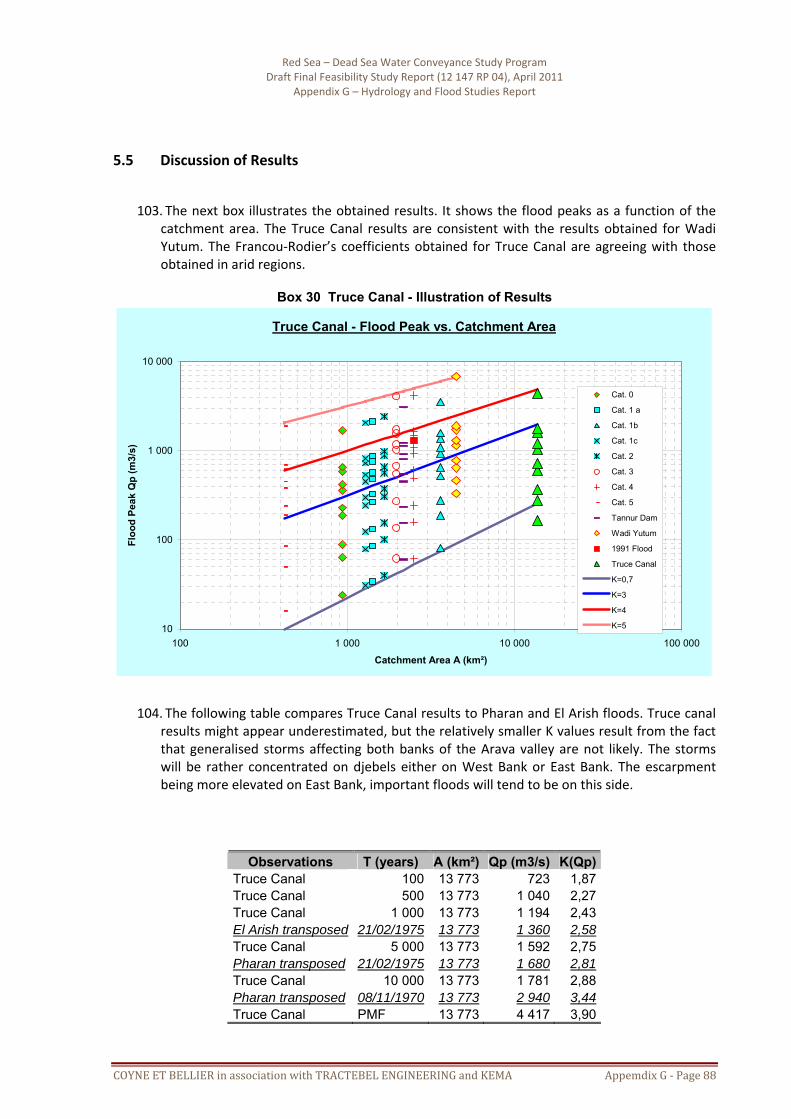
Red Sea – Dead Sea Water Conveyance Study Program Draft Final Feasibility Study Report (12 147 RP 04), April 2011
Appendix G – Hydrology and Flood Studies Report
COYNE ET BELLIER in association with TRACTEBEL ENGINEERING and KEMA Appemdix G ‐ Page 88
5.5 Discussion of Results
103. The next box illustrates the obtained results. It shows the flood peaks as a function of the catchment area. The Truce Canal results are consistent with the results obtained for Wadi Yutum. The Francou‐Rodier’s coefficients obtained for Truce Canal are agreeing with those obtained in arid regions.
Box 30 Truce Canal - Illustration of Results
Truce Canal - Flood Peak vs. Catchment Area
10
100
1 000
10 000
100 1 000 10 000 100 000
Catchment Area A (km²)
Floo
d Pe
ak Q
p (m
3/s)
Cat. 0
Cat. 1 a
Cat. 1b
Cat. 1c
Cat. 2
Cat. 3
Cat. 4
Cat. 5
Tannur Dam
Wadi Yutum
1991 Flood
Truce Canal
K=0,7
K=3
K=4
K=5
104. The following table compares Truce Canal results to Pharan and El Arish floods. Truce canal results might appear underestimated, but the relatively smaller K values result from the fact that generalised storms affecting both banks of the Arava valley are not likely. The storms will be rather concentrated on djebels either on West Bank or East Bank. The escarpment being more elevated on East Bank, important floods will tend to be on this side.
Observations T (years) A (km²) Qp (m3/s) K(Qp) Truce Canal 100 13 773 723 1,87 Truce Canal 500 13 773 1 040 2,27 Truce Canal 1 000 13 773 1 194 2,43 El Arish transposed 21/02/1975 13 773 1 360 2,58 Truce Canal 5 000 13 773 1 592 2,75 Pharan transposed 21/02/1975 13 773 1 680 2,81 Truce Canal 10 000 13 773 1 781 2,88 Pharan transposed 08/11/1970 13 773 2 940 3,44 Truce Canal PMF 13 773 4 417 3,90

Red Sea – Dead Sea Water Conveyance Study Program Draft Final Feasibility Study Report (12 147 RP 04), April 2011
Appendix G – Hydrology and Flood Studies Report
COYNE ET BELLIER in association with TRACTEBEL ENGINEERING and KEMA Appemdix G ‐ Page 89
6. SUPPORTING DOCUMENTS
6.1. Supporting Documents for Wadi Yutum Floods
105. Supporting documents are given below. They consist in data about daily rainfall and about flood hydrographs.
106. Maximum daily rainfall.
Station Year Month Rank Fr u(Gumbel) Max √Max uY Aqaba 1996 Jan 1 0,020 -1,364 0,8 0,89 -1,74 Aqaba 2005 Feb 2 0,040 -1,169 0,8 0,89 -1,74 Aqaba 1970 Jan 3 0,060 -1,034 0,9 0,95 -1,70 Aqaba 1960 Jan 4 0,080 -0,927 1,8 1,34 -1,39 Aqaba 2004 Feb 5 0,100 -0,834 1,8 1,34 -1,39 Aqaba 1962 Jan 6 0,120 -0,752 2,6 1,61 -1,18 Aqaba 2007 Jan 7 0,140 -0,676 3,0 1,73 -1,09 Aqaba 1998 May 8 0,160 -0,606 3,3 1,82 -1,02 Aqaba 1984 Mar 9 0,180 -0,539 4,0 2,00 -0,88 Aqaba 2003 Dec 10 0,200 -0,476 4,1 2,02 -0,86 Aqaba 1959 Dec 11 0,220 -0,415 4,4 2,10 -0,80 Aqaba 1976 Mar 12 0,240 -0,356 4,5 2,12 -0,79 Aqaba 1983 Feb 13 0,260 -0,298 4,5 2,12 -0,79 Aqaba 2000 Dec 14 0,280 -0,241 5,1 2,26 -0,68 Aqaba 1995 Feb 15 0,300 -0,186 6,0 2,45 -0,53 Aqaba 2006 Jan 16 0,320 -0,131 6,0 2,45 -0,53 Aqaba 1982 Feb 17 0,340 -0,076 6,2 2,49 -0,50 Aqaba 2002 Oct 18 0,360 -0,021 6,2 2,49 -0,50 Aqaba 1992 Nov 19 0,380 0,033 7,0 2,65 -0,38 Aqaba 1977 Dec 20 0,400 0,087 7,1 2,66 -0,36 Aqaba 1964 Jan 21 0,420 0,142 7,3 2,70 -0,33 Aqaba 1974 Dec 22 0,440 0,197 7,9 2,81 -0,25 Aqaba 2001 Apr 23 0,460 0,253 8,0 2,83 -0,23 Aqaba 1981 Oct 24 0,480 0,309 8,3 2,88 -0,19 Aqaba 1967 Oct 25 0,500 0,367 8,5 2,92 -0,17 Aqaba 1989 Nov 26 0,520 0,425 11,0 3,32 0,15 Aqaba 1975 Dec 27 0,540 0,484 11,2 3,35 0,17 Aqaba 1979 Feb 28 0,560 0,545 12,6 3,55 0,33 Aqaba 1973 Nov 29 0,580 0,607 12,8 3,58 0,35 Aqaba 1988 Jan 30 0,600 0,672 12,8 3,58 0,35 Aqaba 1986 May 31 0,620 0,738 13,0 3,61 0,37 Aqaba 1985 Dec 32 0,640 0,807 13,3 3,65 0,40 Aqaba 1987 Oct 33 0,660 0,878 13,8 3,71 0,46 Aqaba 1999 Feb 34 0,680 0,953 15,0 3,87 0,58 Aqaba 1997 Oct 35 0,700 1,031 15,1 3,89 0,59 Aqaba 1972 Nov 36 0,720 1,113 15,6 3,95 0,64 Aqaba 1968 Nov 37 0,740 1,200 15,8 3,97 0,66

Red Sea – Dead Sea Water Conveyance Study Program Draft Final Feasibility Study Report (12 147 RP 04), April 2011
Appendix G – Hydrology and Flood Studies Report
COYNE ET BELLIER in association with TRACTEBEL ENGINEERING and KEMA Appemdix G ‐ Page 90
Station Year Month Rank Fr u(Gumbel) Max √Max uY Aqaba 1978 Dec 38 0,760 1,293 16,6 4,07 0,74 Aqaba 1991 Mar 39 0,780 1,392 17,0 4,12 0,78 Aqaba 1961 Dec 40 0,800 1,500 17,5 4,18 0,82 Aqaba 1969 Mar 41 0,820 1,617 18,1 4,25 0,88 Aqaba 1971 Apr 42 0,840 1,747 18,3 4,28 0,90 Aqaba 1965 Jan 43 0,860 1,892 18,4 4,29 0,91 Aqaba 1990 Dec 44 0,880 2,057 18,5 4,30 0,91 Aqaba 1993 Dec 45 0,900 2,250 19,2 4,38 0,98 Aqaba 1994 Jan 46 0,920 2,484 21,0 4,58 1,13 Aqaba 1966 Jan 47 0,940 2,783 32,8 5,73 2,03 Aqaba 1963 Apr 48 0,960 3,199 36,6 6,05 2,28 Aqaba 1980 Dec 49 0,980 3,902 42,5 6,52 2,64 n 49 49 49 M 11,4 3,13 0,00 S 8,9 1,28 1,00 Cv 0,78 0,41 Me 8,5 2,92 -0,17 Max 42,5 6,52 2,64 Min 0,8 0,89 -1,74

Red Sea – Dead Sea Water Conveyance Study Program Draft Final Feasibility Study Report (12 147 RP 04), April 2011
Appendix G – Hydrology and Flood Studies Report
COYNE ET BELLIER in association with TRACTEBEL ENGINEERING and KEMA Appemdix G ‐ Page 91
Station Year Month Rank Fr u(Gumbel) Max √Max uY Aq-Ghor SafiGhor Safi 1981 Mar 1 0,029 -1,268 6,6 2,57 -1,21 2,5Ghor Safi 1978 Jan 2 0,057 -1,052 6,7 2,59 -1,19 2,6Ghor Safi 1984 Mar 3 0,086 -0,899 6,8 2,61 -1,18 2,6Ghor Safi 1995 Feb 4 0,114 -0,774 6,9 2,63 -1,16 2,7Ghor Safi 2000 Jan 5 0,143 -0,666 7,2 2,68 -1,11 2,9Ghor Safi 1982 Jan 6 0,171 -0,567 7,3 2,70 -1,10 3,0Ghor Safi 2007 Feb 7 0,200 -0,476 10,0 3,16 -0,71 4,9Ghor Safi 1983 Dec 8 0,229 -0,389 10,2 3,19 -0,68 5,1Ghor Safi 1992 Feb 9 0,257 -0,306 10,2 3,19 -0,68 5,1Ghor Safi 1989 Jan 10 0,286 -0,225 10,7 3,27 -0,61 5,5Ghor Safi 2002 Oct 11 0,314 -0,146 11,0 3,32 -0,57 5,7Ghor Safi 1996 Jan 12 0,343 -0,068 11,8 3,44 -0,47 6,4Ghor Safi 2006 Feb 13 0,371 0,010 12,0 3,46 -0,45 6,5Ghor Safi 2001 Dec 14 0,400 0,087 12,4 3,52 -0,40 6,8Ghor Safi 1979 Mar 15 0,429 0,166 12,6 3,55 -0,38 7,0Ghor Safi 1986 Apr 16 0,457 0,245 12,6 3,55 -0,38 7,0Ghor Safi 2003 Dec 17 0,486 0,326 13,4 3,66 -0,28 7,7Ghor Safi 1977 Apr 18 0,514 0,408 13,5 3,67 -0,27 7,7Ghor Safi 1987 Feb 19 0,543 0,493 13,7 3,70 -0,25 7,9Ghor Safi 1993 Dec 20 0,571 0,581 16,0 4,00 0,01 9,9Ghor Safi 1997 Dec 21 0,600 0,672 17,2 4,15 0,13 10,9Ghor Safi 1999 Feb 22 0,629 0,767 17,8 4,22 0,19 11,4Ghor Safi 1976 Mar 23 0,657 0,868 18,2 4,27 0,23 11,8Ghor Safi 1998 Feb 24 0,686 0,975 18,2 4,27 0,23 11,8Ghor Safi 1988 Dec 25 0,714 1,089 19,0 4,36 0,31 12,5Ghor Safi 1985 Mar 26 0,743 1,213 21,2 4,60 0,52 14,4Ghor Safi 1994 Nov 27 0,771 1,349 22,2 4,71 0,61 15,3Ghor Safi 2005 Jan 28 0,800 1,500 24,7 4,97 0,83 17,6Ghor Safi 1974 Dec 29 0,829 1,671 25,3 5,03 0,89 18,2Ghor Safi 1991 Mar 30 0,857 1,870 25,3 5,03 0,89 18,2Ghor Safi 1990 Apr 31 0,886 2,109 28,1 5,30 1,12 20,8Ghor Safi 1975 Feb 32 0,914 2,412 41,6 6,45 2,09 33,8Ghor Safi 1980 Dec 33 0,943 2,833 41,7 6,46 2,10 33,9Ghor Safi 2004 Oct 34 0,971 3,541 54,9 7,41 2,91 47,1 n 34 34 34 34M 17,3 3,99 0,00 11,4S 11,0 1,17 1,00 10,0Cv 0,64 0,29 0,88Me 13,5 3,67 -0,28 7,7Max 54,9 7,41 2,91 47,1Min 6,6 2,57 -1,21 2,5

Red Sea – Dead Sea Water Conveyance Study Program Draft Final Feasibility Study Report (12 147 RP 04), April 2011
Appendix G – Hydrology and Flood Studies Report
COYNE ET BELLIER in association with TRACTEBEL ENGINEERING and KEMA Appemdix G ‐ Page 92
Station Year Month Rank Fr u(Gumbel) Max √Max uY Aq-Zarqa Zarqa 2004 Feb 1 0,143 -0,666 10,7 3,27 -1,45 1,6Zarqa 2007 Nov 2 0,286 -0,225 12,4 3,52 -0,51 6,1Zarqa 2006 Dec 3 0,429 0,166 12,5 3,54 -0,46 6,4Zarqa 2005 Jan 4 0,571 0,581 14,3 3,78 0,46 13,8Zarqa 2003 Feb 5 0,714 1,089 14,6 3,82 0,60 15,2Zarqa 2002 Dec 6 0,857 1,870 16,2 4,02 1,36 23,8 n 6 6 6 6M 13,5 3,66 0,00 11,2S 2,0 0,27 1,00 8,0Cv 0,15 0,07 0,72Me 13,4 3,66 0,00 10,1Max 16,2 4,02 1,36 23,8Min 10,7 3,27 -1,45 1,6 Station Year Month Rank Fr u(Gumbel) Max √Max uY Aq-MafraqMafraq 2007 Nov 1 0,019 -1,374 7,3 2,70 -1,90 0,5Mafraq 1977 Dec 2 0,038 -1,181 8,4 2,90 -1,70 0,9Mafraq 2006 Feb 3 0,058 -1,048 9,3 3,05 -1,54 1,3Mafraq 1962 Feb 4 0,077 -0,942 11,0 3,32 -1,26 2,3Mafraq 1987 Oct 5 0,096 -0,851 11,0 3,32 -1,26 2,3Mafraq 1993 Jan 6 0,115 -0,770 12,0 3,46 -1,11 2,9Mafraq 1960 Nov 7 0,135 -0,696 12,4 3,52 -1,05 3,2Mafraq 1973 Jan 8 0,154 -0,627 12,9 3,59 -0,97 3,5Mafraq 1978 Dec 9 0,173 -0,562 13,0 3,61 -0,96 3,6Mafraq 2004 Feb 10 0,192 -0,500 13,1 3,62 -0,94 3,7Mafraq 1968 Jan 11 0,212 -0,440 13,3 3,65 -0,92 3,8Mafraq 1981 Mar 12 0,231 -0,383 13,5 3,67 -0,89 4,0Mafraq 1989 Dec 13 0,250 -0,327 13,8 3,71 -0,84 4,2Mafraq 2005 Dec 14 0,269 -0,272 13,8 3,71 -0,84 4,2Mafraq 1971 Dec 15 0,288 -0,218 14,2 3,77 -0,79 4,5Mafraq 1996 Mar 16 0,308 -0,164 14,4 3,79 -0,76 4,6Mafraq 1984 Jan 17 0,327 -0,112 16,7 4,09 -0,46 6,5Mafraq 1995 Feb 18 0,346 -0,059 17,0 4,12 -0,42 6,7Mafraq 1969 Mar 19 0,365 -0,007 17,1 4,14 -0,41 6,8Mafraq 2003 Dec 20 0,385 0,046 17,5 4,18 -0,36 7,1Mafraq 1999 Feb 21 0,404 0,098 18,0 4,24 -0,29 7,6Mafraq 1998 Jan 22 0,423 0,151 18,1 4,25 -0,28 7,7Mafraq 1961 Dec 23 0,442 0,204 19,2 4,38 -0,15 8,6Mafraq 1956 Mar 24 0,462 0,257 19,6 4,43 -0,10 9,0Mafraq 1992 Feb 25 0,481 0,311 19,7 4,44 -0,09 9,1Mafraq 1970 Mar 26 0,500 0,367 19,9 4,46 -0,07 9,3Mafraq 2000 Dec 27 0,519 0,422 19,9 4,46 -0,07 9,3Mafraq 1974 Jan 28 0,538 0,480 20,0 4,47 -0,06 9,3Mafraq 1972 Nov 29 0,558 0,538 21,6 4,65 0,13 10,8Mafraq 1990 Jan 30 0,577 0,598 22,5 4,74 0,23 11,7Mafraq 1997 Dec 31 0,596 0,659 23,0 4,80 0,28 12,2

Red Sea – Dead Sea Water Conveyance Study Program Draft Final Feasibility Study Report (12 147 RP 04), April 2011
Appendix G – Hydrology and Flood Studies Report
COYNE ET BELLIER in association with TRACTEBEL ENGINEERING and KEMA Appemdix G ‐ Page 93
Station Year Month Rank Fr u(Gumbel) Max √Max uY Aq-MafraqMafraq 1967 Jan 32 0,615 0,723 23,4 4,84 0,32 12,6Mafraq 1954 Feb 33 0,635 0,788 23,5 4,85 0,34 12,7Mafraq 1965 Jan 34 0,654 0,856 23,7 4,87 0,36 12,9Mafraq 1983 Mar 35 0,673 0,927 24,2 4,92 0,41 13,4Mafraq 1991 Mar 36 0,692 1,000 24,2 4,92 0,41 13,4Mafraq 1955 Nov 37 0,712 1,078 24,6 4,96 0,45 13,8Mafraq 2002 Jan 38 0,731 1,159 25,0 5,00 0,49 14,2Mafraq 1985 Mar 39 0,750 1,246 26,0 5,10 0,60 15,2Mafraq 1982 Apr 40 0,769 1,338 26,5 5,15 0,65 15,7Mafraq 2001 Jan 41 0,788 1,437 27,0 5,20 0,70 16,2Mafraq 1994 Nov 42 0,808 1,544 28,6 5,35 0,86 17,9Mafraq 1986 Nov 43 0,827 1,661 29,0 5,39 0,90 18,3Mafraq 1963 Feb 44 0,846 1,789 31,0 5,57 1,09 20,4Mafraq 1975 Feb 45 0,865 1,934 33,8 5,81 1,34 23,5Mafraq 1979 Nov 46 0,885 2,099 33,8 5,81 1,34 23,5Mafraq 1976 Mar 47 0,904 2,292 35,2 5,93 1,47 25,1Mafraq 1966 Dec 48 0,923 2,525 38,1 6,17 1,72 28,4Mafraq 1988 Feb 49 0,942 2,823 40,2 6,34 1,89 30,8Mafraq 1964 Dec 50 0,962 3,239 43,7 6,61 2,17 35,0Mafraq 1980 Dec 51 0,981 3,942 45,9 6,77 2,34 37,6 n 51 51 51 51M 21,4 4,53 0,00 11,4S 9,1 0,96 1,00 8,9Cv 0,43 0,21 0,78Me 19,9 4,46 -0,07 9,3Max 45,9 6,77 2,34 37,6Min 7,3 2,70 -1,90 0,5
Station Year Month Rank Fr u(Gumbel) Max √Max uY Aq-Wadi MousaWadi Mousa 1981 Mar 1 0,031 -1,243 15,0 3,87 -1,60 1,2Wadi Mousa 1978 Dec 2 0,063 -1,020 16,0 4,00 -1,49 1,5Wadi Mousa 1989 Jeu 3 0,094 -0,862 19,6 4,43 -1,11 2,9Wadi Mousa 2003 Dec 4 0,125 -0,732 20,5 4,53 -1,02 3,3Wadi Mousa 1993 Jan 5 0,156 -0,619 21,0 4,58 -0,97 3,6Wadi Mousa 1986 Apr 6 0,188 -0,515 21,5 4,64 -0,92 3,8Wadi Mousa 1982 Nov 7 0,219 -0,419 22,0 4,69 -0,87 4,0Wadi Mousa 1984 Dec 8 0,250 -0,327 22,0 4,69 -0,87 4,0Wadi Mousa 1985 Feb 9 0,281 -0,238 22,0 4,69 -0,87 4,0Wadi Mousa 2007 Feb 10 0,313 -0,151 23,2 4,82 -0,76 4,6Wadi Mousa 1995 Feb 11 0,344 -0,066 25,0 5,00 -0,60 5,6Wadi Mousa 2006 Feb 12 0,375 0,019 27,4 5,23 -0,39 6,9Wadi Mousa 1994 Jan 13 0,406 0,104 28,0 5,29 -0,34 7,3Wadi Mousa 1976 Mar 14 0,438 0,190 30,0 5,48 -0,18 8,4Wadi Mousa 1990 Apr 15 0,469 0,277 32,0 5,66 -0,02 9,7Wadi Mousa 2000 Oct 16 0,500 0,367 32,0 5,66 -0,02 9,7Wadi Mousa 1977 Dec 17 0,531 0,458 34,0 5,83 0,14 10,9Wadi Mousa 2001 May 18 0,563 0,553 34,0 5,83 0,14 10,9Wadi Mousa 1979 Jan 19 0,594 0,651 35,0 5,92 0,21 11,6

Red Sea – Dead Sea Water Conveyance Study Program Draft Final Feasibility Study Report (12 147 RP 04), April 2011
Appendix G – Hydrology and Flood Studies Report
COYNE ET BELLIER in association with TRACTEBEL ENGINEERING and KEMA Appemdix G ‐ Page 94
Station Year Month Rank Fr u(Gumbel) Max √Max uY Aq-Wadi Mousa
Wadi Mousa 1983 Jan 20 0,625 0,755 35,0 5,92 0,21 11,6Wadi Mousa 1996 Jan 21 0,656 0,865 35,6 5,97 0,26 12,0Wadi Mousa 1997 Jan 22 0,688 0,982 36,0 6,00 0,29 12,2Wadi Mousa 2005 Jan 23 0,719 1,108 37,3 6,11 0,38 13,1Wadi Mousa 1987 Mar 24 0,750 1,246 37,5 6,12 0,40 13,3Wadi Mousa 2002 Feb 25 0,781 1,399 38,8 6,23 0,49 14,1Wadi Mousa 1992 Jan 26 0,813 1,572 40,0 6,32 0,58 15,0Wadi Mousa 1980 Dec 27 0,844 1,773 51,0 7,14 1,30 23,0Wadi Mousa 1998 Jan 28 0,875 2,013 55,2 7,43 1,56 26,3Wadi Mousa 1988 Mer 29 0,906 2,318 58,2 7,63 1,74 28,7Wadi Mousa 1991 Mar 30 0,938 2,740 65,0 8,06 2,12 34,2Wadi Mousa 2004 Jan 31 0,969 3,450 66,4 8,15 2,20 35,4 N 31 31 31 31M 33,4 5,67 0,00 11,4S 13,6 1,13 1,00 9,2Cv 0,41 0,20 0,81Me 32,0 5,66 -0,02 9,7Max 66,4 8,15 2,20 35,4Min 15,0 3,87 -1,60 1,2
Station Year Month Rank Fr u(Gumbel) Max √Max uY Aq-TafilehTafileh / Eiss 2003 Mar 1 0,111 -0,787 16,6 4,07 -1,46 1,6Tafileh / Eiss 2001 Apr 2 0,222 -0,408 19,0 4,36 -1,23 2,4Tafileh / Eiss 2002 Dec 3 0,333 -0,094 28,6 5,35 -0,41 6,8Tafileh / Eiss 2006 Feb 4 0,444 0,210 32,4 5,69 -0,13 8,8Tafileh / Eiss 1999 Feb 5 0,556 0,531 40,0 6,32 0,40 13,2Tafileh / Eiss 2007 Jan 6 0,667 0,903 41,9 6,47 0,52 14,4Tafileh / Eiss 2004 Jan 7 0,778 1,381 49,0 7,00 0,96 19,0Tafileh / Eiss 2005 Jan 8 0,889 2,139 55,9 7,48 1,35 23,6 n 8 8 8 8M 35,4 5,84 0,00 11,2S 13,9 1,21 1,00 7,8Cv 0,39 0,21 0,69Me 36,2 6,01 0,14 11,0Max 55,9 7,48 1,35 23,6Min 16,6 4,07 -1,46 1,6

Red Sea – Dead Sea Water Conveyance Study Program Draft Final Feasibility Study Report (12 147 RP 04), April 2011
Appendix G – Hydrology and Flood Studies Report
COYNE ET BELLIER in association with TRACTEBEL ENGINEERING and KEMA Appemdix G ‐ Page 95
Station Year Month Rank Fr u(Gumbel) Max √Max uY Aq-Deir AllaDeir Alla 1952 Oct 1 0,018 -1,397 11,5 3,39 -2,06 0,2Deir Alla 1993 Jan 2 0,035 -1,209 12,7 3,56 -1,91 0,5Deir Alla 1987 Dec 3 0,053 -1,080 16,0 4,00 -1,54 1,3Deir Alla 1962 Jan 4 0,070 -0,977 16,3 4,04 -1,51 1,4Deir Alla 1998 Jan 5 0,088 -0,889 17,1 4,14 -1,42 1,7Deir Alla 1999 Jan 6 0,105 -0,812 18,3 4,28 -1,30 2,1Deir Alla 1995 Feb 7 0,123 -0,741 19,0 4,36 -1,23 2,4Deir Alla 2007 Jan 8 0,140 -0,675 19,3 4,39 -1,20 2,5Deir Alla 1981 Jan 9 0,158 -0,613 21,2 4,60 -1,02 3,3Deir Alla 1967 Mar 10 0,175 -0,554 21,5 4,64 -1,00 3,4Deir Alla 1977 Apr 11 0,193 -0,498 21,5 4,64 -1,00 3,4Deir Alla 1983 Feb 12 0,211 -0,443 21,9 4,68 -0,96 3,6Deir Alla 1984 Mar 13 0,228 -0,391 22,5 4,74 -0,91 3,9Deir Alla 1978 Jan 14 0,246 -0,339 25,0 5,00 -0,69 5,0Deir Alla 1968 Jan 15 0,263 -0,289 25,5 5,05 -0,65 5,3Deir Alla 1960 Jan 16 0,281 -0,239 26,1 5,11 -0,60 5,6Deir Alla 1956 Jan 17 0,298 -0,190 26,7 5,17 -0,55 5,9Deir Alla 1990 Jan 18 0,316 -0,142 27,0 5,20 -0,52 6,1Deir Alla 1965 Jan 19 0,333 -0,094 28,1 5,30 -0,43 6,6Deir Alla 1969 Mar 20 0,351 -0,046 29,0 5,39 -0,36 7,1Deir Alla 2005 Jan 21 0,368 0,001 30,0 5,48 -0,28 7,7Deir Alla 1996 Dec 22 0,386 0,049 30,2 5,50 -0,27 7,8Deir Alla 1989 Dec 23 0,404 0,097 30,6 5,53 -0,24 8,0Deir Alla 2003 Mar 24 0,421 0,145 31,1 5,58 -0,20 8,3Deir Alla 1961 Jan 25 0,439 0,193 31,8 5,64 -0,15 8,7Deir Alla 1982 Jan 26 0,456 0,242 32,0 5,66 -0,13 8,8Deir Alla 1953 Nov 27 0,474 0,291 32,3 5,68 -0,11 8,9Deir Alla 1988 Dec 28 0,491 0,341 33,0 5,74 -0,06 9,3Deir Alla 1973 Nov 29 0,509 0,392 33,5 5,79 -0,02 9,6Deir Alla 2004 Nov 30 0,526 0,443 34,0 5,83 0,02 9,9Deir Alla 1970 Mar 31 0,544 0,496 34,1 5,84 0,03 10,0Deir Alla 1985 Jan 32 0,561 0,549 34,5 5,87 0,05 10,2Deir Alla 1957 Feb 33 0,579 0,604 36,0 6,00 0,16 11,1Deir Alla 1971 Apr 34 0,596 0,660 36,6 6,05 0,20 11,5Deir Alla 1976 Nov 35 0,614 0,718 38,6 6,21 0,34 12,7Deir Alla 1954 Apr 36 0,632 0,778 39,1 6,25 0,38 13,0Deir Alla 1959 Jan 37 0,649 0,839 39,2 6,26 0,38 13,1Deir Alla 1963 Feb 38 0,667 0,903 40,3 6,35 0,46 13,8Deir Alla 1997 Jan 39 0,684 0,969 41,0 6,40 0,50 14,2Deir Alla 1972 Mar 40 0,702 1,038 42,0 6,48 0,57 14,9Deir Alla 1975 Feb 41 0,719 1,110 44,0 6,63 0,70 16,2Deir Alla 2001 Dec 42 0,737 1,186 44,5 6,67 0,73 16,5Deir Alla 1991 Dec 43 0,754 1,266 45,0 6,71 0,76 16,9Deir Alla 1974 Jan 44 0,772 1,351 47,0 6,86 0,89 18,2Deir Alla 2000 Jan 45 0,789 1,442 47,8 6,91 0,94 18,8Deir Alla 1958 Jan 46 0,807 1,540 48,0 6,93 0,95 18,9Deir Alla 1994 Nov 47 0,825 1,646 48,7 6,98 0,99 19,4Deir Alla 1966 Dec 48 0,842 1,761 50,2 7,09 1,08 20,4Deir Alla 1964 Dec 49 0,860 1,889 50,5 7,11 1,10 20,6Deir Alla 2002 Dec 50 0,877 2,032 50,8 7,13 1,12 20,8

Red Sea – Dead Sea Water Conveyance Study Program Draft Final Feasibility Study Report (12 147 RP 04), April 2011
Appendix G – Hydrology and Flood Studies Report
COYNE ET BELLIER in association with TRACTEBEL ENGINEERING and KEMA Appemdix G ‐ Page 96
Station Year Month Rank Fr u(Gumbel) Max √Max uY Aq-Deir AllaDeir Alla 1979 Nov 51 0,895 2,196 52,5 7,25 1,22 22,0Deir Alla 2006 Apr 52 0,912 2,388 52,6 7,25 1,23 22,1Deir Alla 1992 Jan 53 0,930 2,621 53,2 7,29 1,26 22,5Deir Alla 1980 Mar 54 0,947 2,918 57,9 7,61 1,53 25,9Deir Alla 1986 Nov 55 0,965 3,332 62,8 7,92 1,80 29,5Deir Alla 1955 Nov 56 0,982 4,034 85,0 9,22 2,90 46,8 n 56 56 56 56M 35,1 5,81 0,00 11,4S 14,1 1,18 1,00 8,7Cv 0,40 0,20 0,76Me 33,3 5,77 -0,04 9,5Max 85,0 9,22 2,90 46,8Min 11,5 3,39 -2,06 0,2
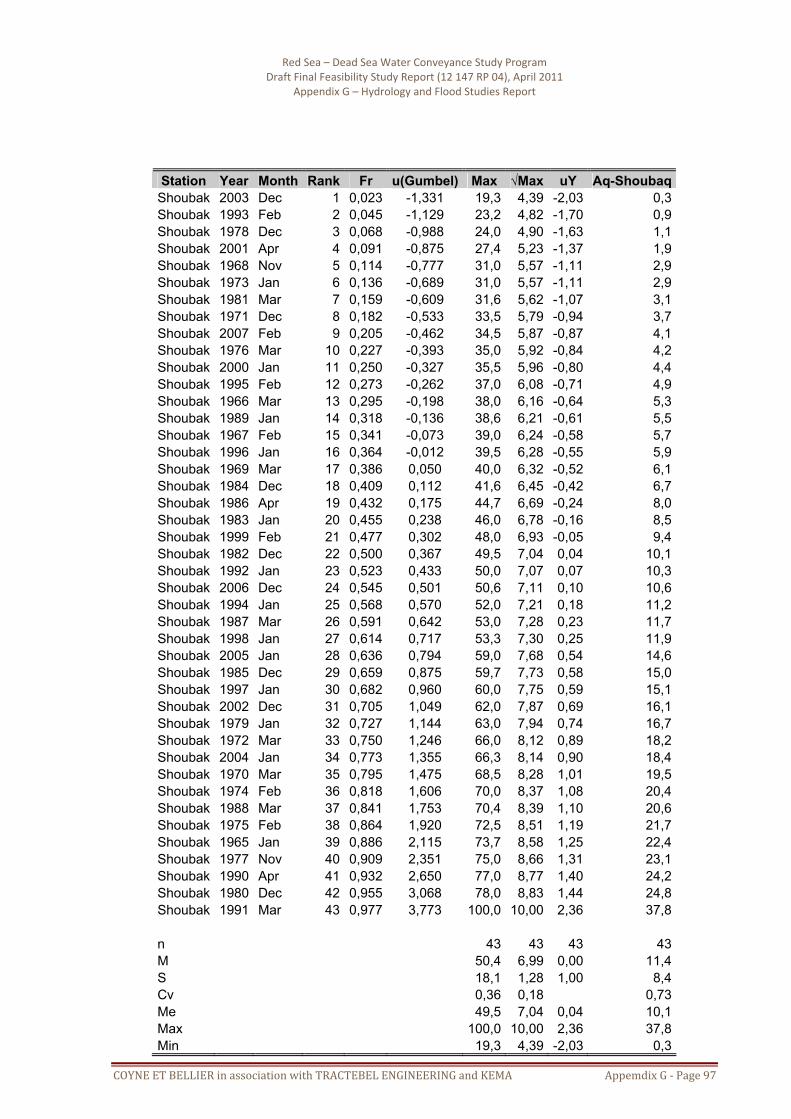
Red Sea – Dead Sea Water Conveyance Study Program Draft Final Feasibility Study Report (12 147 RP 04), April 2011
Appendix G – Hydrology and Flood Studies Report
COYNE ET BELLIER in association with TRACTEBEL ENGINEERING and KEMA Appemdix G ‐ Page 97
Station Year Month Rank Fr u(Gumbel) Max √Max uY Aq-ShoubaqShoubak 2003 Dec 1 0,023 -1,331 19,3 4,39 -2,03 0,3Shoubak 1993 Feb 2 0,045 -1,129 23,2 4,82 -1,70 0,9Shoubak 1978 Dec 3 0,068 -0,988 24,0 4,90 -1,63 1,1Shoubak 2001 Apr 4 0,091 -0,875 27,4 5,23 -1,37 1,9Shoubak 1968 Nov 5 0,114 -0,777 31,0 5,57 -1,11 2,9Shoubak 1973 Jan 6 0,136 -0,689 31,0 5,57 -1,11 2,9Shoubak 1981 Mar 7 0,159 -0,609 31,6 5,62 -1,07 3,1Shoubak 1971 Dec 8 0,182 -0,533 33,5 5,79 -0,94 3,7Shoubak 2007 Feb 9 0,205 -0,462 34,5 5,87 -0,87 4,1Shoubak 1976 Mar 10 0,227 -0,393 35,0 5,92 -0,84 4,2Shoubak 2000 Jan 11 0,250 -0,327 35,5 5,96 -0,80 4,4Shoubak 1995 Feb 12 0,273 -0,262 37,0 6,08 -0,71 4,9Shoubak 1966 Mar 13 0,295 -0,198 38,0 6,16 -0,64 5,3Shoubak 1989 Jan 14 0,318 -0,136 38,6 6,21 -0,61 5,5Shoubak 1967 Feb 15 0,341 -0,073 39,0 6,24 -0,58 5,7Shoubak 1996 Jan 16 0,364 -0,012 39,5 6,28 -0,55 5,9Shoubak 1969 Mar 17 0,386 0,050 40,0 6,32 -0,52 6,1Shoubak 1984 Dec 18 0,409 0,112 41,6 6,45 -0,42 6,7Shoubak 1986 Apr 19 0,432 0,175 44,7 6,69 -0,24 8,0Shoubak 1983 Jan 20 0,455 0,238 46,0 6,78 -0,16 8,5Shoubak 1999 Feb 21 0,477 0,302 48,0 6,93 -0,05 9,4Shoubak 1982 Dec 22 0,500 0,367 49,5 7,04 0,04 10,1Shoubak 1992 Jan 23 0,523 0,433 50,0 7,07 0,07 10,3Shoubak 2006 Dec 24 0,545 0,501 50,6 7,11 0,10 10,6Shoubak 1994 Jan 25 0,568 0,570 52,0 7,21 0,18 11,2Shoubak 1987 Mar 26 0,591 0,642 53,0 7,28 0,23 11,7Shoubak 1998 Jan 27 0,614 0,717 53,3 7,30 0,25 11,9Shoubak 2005 Jan 28 0,636 0,794 59,0 7,68 0,54 14,6Shoubak 1985 Dec 29 0,659 0,875 59,7 7,73 0,58 15,0Shoubak 1997 Jan 30 0,682 0,960 60,0 7,75 0,59 15,1Shoubak 2002 Dec 31 0,705 1,049 62,0 7,87 0,69 16,1Shoubak 1979 Jan 32 0,727 1,144 63,0 7,94 0,74 16,7Shoubak 1972 Mar 33 0,750 1,246 66,0 8,12 0,89 18,2Shoubak 2004 Jan 34 0,773 1,355 66,3 8,14 0,90 18,4Shoubak 1970 Mar 35 0,795 1,475 68,5 8,28 1,01 19,5Shoubak 1974 Feb 36 0,818 1,606 70,0 8,37 1,08 20,4Shoubak 1988 Mar 37 0,841 1,753 70,4 8,39 1,10 20,6Shoubak 1975 Feb 38 0,864 1,920 72,5 8,51 1,19 21,7Shoubak 1965 Jan 39 0,886 2,115 73,7 8,58 1,25 22,4Shoubak 1977 Nov 40 0,909 2,351 75,0 8,66 1,31 23,1Shoubak 1990 Apr 41 0,932 2,650 77,0 8,77 1,40 24,2Shoubak 1980 Dec 42 0,955 3,068 78,0 8,83 1,44 24,8Shoubak 1991 Mar 43 0,977 3,773 100,0 10,00 2,36 37,8 n 43 43 43 43M 50,4 6,99 0,00 11,4S 18,1 1,28 1,00 8,4Cv 0,36 0,18 0,73Me 49,5 7,04 0,04 10,1Max 100,0 10,00 2,36 37,8Min 19,3 4,39 -2,03 0,3

Red Sea – Dead Sea Water Conveyance Study Program Draft Final Feasibility Study Report (12 147 RP 04), April 2011
Appendix G – Hydrology and Flood Studies Report
COYNE ET BELLIER in association with TRACTEBEL ENGINEERING and KEMA Appemdix G ‐ Page 98
Station Year Month Rank Fr u(Gumbel) Max √Max uY Aq-Er RabbahEr Rabbah 1961 Feb 1 0,021 -1,354 20,0 4,47 -1,81 0,7Er Rabbah 1962 Feb 2 0,042 -1,156 21,0 4,58 -1,73 0,8Er Rabbah 1963 Feb 3 0,063 -1,020 23,8 4,88 -1,53 1,4Er Rabbah 1964 Feb 4 0,083 -0,910 24,0 4,90 -1,51 1,4Er Rabbah 1965 Jan 5 0,104 -0,816 28,9 5,38 -1,19 2,6Er Rabbah 1966 Dec 6 0,125 -0,732 29,3 5,41 -1,16 2,7Er Rabbah 1967 Mar 7 0,146 -0,655 31,0 5,57 -1,06 3,1Er Rabbah 1968 Jan 8 0,167 -0,583 32,0 5,66 -1,00 3,4Er Rabbah 1969 Mar 9 0,188 -0,515 34,3 5,86 -0,86 4,1Er Rabbah 1970 Mar 10 0,208 -0,450 34,8 5,90 -0,83 4,3Er Rabbah 1971 Dec 11 0,229 -0,388 35,0 5,92 -0,82 4,3Er Rabbah 1972 Mar 12 0,250 -0,327 36,2 6,02 -0,75 4,7Er Rabbah 1973 Jan 13 0,271 -0,267 37,1 6,09 -0,70 5,0Er Rabbah 1974 Jan 14 0,292 -0,209 39,0 6,24 -0,59 5,6Er Rabbah 1975 Feb 15 0,313 -0,151 39,6 6,29 -0,56 5,8Er Rabbah 1976 Feb 16 0,333 -0,094 40,5 6,36 -0,51 6,1Er Rabbah 1977 Apr 17 0,354 -0,037 41,5 6,44 -0,46 6,5Er Rabbah 1978 Dec 18 0,375 0,019 42,0 6,48 -0,43 6,6Er Rabbah 1979 Nov 19 0,396 0,076 43,0 6,56 -0,38 7,0Er Rabbah 1980 Dec 20 0,417 0,133 44,8 6,69 -0,29 7,6Er Rabbah 1981 Mar 21 0,438 0,190 46,0 6,78 -0,23 8,1Er Rabbah 1982 Dec 22 0,458 0,248 46,5 6,82 -0,20 8,2Er Rabbah 1983 Jan 23 0,479 0,307 48,0 6,93 -0,13 8,8Er Rabbah 1984 Jan 24 0,500 0,367 49,0 7,00 -0,08 9,2Er Rabbah 1985 Feb 25 0,521 0,427 50,0 7,07 -0,03 9,6Er Rabbah 1986 Nov 26 0,542 0,489 53,0 7,28 0,11 10,7Er Rabbah 1987 Mar 27 0,563 0,553 54,0 7,35 0,16 11,1Er Rabbah 1988 Jan 28 0,583 0,618 54,0 7,35 0,16 11,1Er Rabbah 1989 Feb 29 0,604 0,685 55,0 7,42 0,21 11,5Er Rabbah 1990 Apr 30 0,625 0,755 55,0 7,42 0,21 11,5Er Rabbah 1991 Mar 31 0,646 0,827 55,5 7,45 0,23 11,7Er Rabbah 1992 Nov 32 0,667 0,903 57,0 7,55 0,30 12,3Er Rabbah 1993 Nov 33 0,688 0,982 57,8 7,60 0,33 12,6Er Rabbah 1994 Dec 34 0,708 1,065 60,0 7,75 0,43 13,6Er Rabbah 1995 Feb 35 0,729 1,152 61,1 7,82 0,48 14,0Er Rabbah 1996 Jan 36 0,750 1,246 65,0 8,06 0,65 15,7Er Rabbah 1997 Jan 37 0,771 1,346 67,0 8,19 0,73 16,5Er Rabbah 1998 Jan 38 0,792 1,454 68,0 8,25 0,77 17,0Er Rabbah 1999 Feb 39 0,813 1,572 76,0 8,72 1,10 20,5Er Rabbah 2000 Jan 40 0,833 1,702 78,3 8,85 1,18 21,6Er Rabbah 2001 May 41 0,854 1,848 82,0 9,06 1,33 23,3Er Rabbah 2002 Dec 42 0,875 2,013 84,6 9,20 1,42 24,5Er Rabbah 2003 Mar 43 0,896 2,207 88,1 9,39 1,55 26,2Er Rabbah 2004 Nov 44 0,917 2,442 90,0 9,49 1,62 27,1Er Rabbah 2005 Feb 45 0,938 2,740 91,0 9,54 1,66 27,6Er Rabbah 2006 Apr 46 0,958 3,157 100,0 10,00 1,97 32,0Er Rabbah 2007 Jan 47 0,979 3,861 108,0 10,39 2,24 36,0 n 47 47 47 47M 52,7 7,11 0,00 11,4

Red Sea – Dead Sea Water Conveyance Study Program Draft Final Feasibility Study Report (12 147 RP 04), April 2011
Appendix G – Hydrology and Flood Studies Report
COYNE ET BELLIER in association with TRACTEBEL ENGINEERING and KEMA Appemdix G ‐ Page 99
Station Year Month Rank Fr u(Gumbel) Max √Max uY Aq-Er RabbahS 21,6 1,46 1,00 8,7Cv 0,41 0,21 0,77Me 49,0 7,00 -0,08 9,2Max 108,0 10,39 2,24 36,0Min 20,0 4,47 -1,81 0,7
Station Year Month Rank Fr u(Gumbel) Max √Max uY Aq-MadabaMadaba 1995 Feb 1 0,029 -1,260 13,0 3,61 -2,44 0,0Madaba 1976 Nov 2 0,059 -1,041 21,7 4,66 -1,62 1,1Madaba 1993 Jan 3 0,088 -0,887 22,9 4,79 -1,52 1,4Madaba 1977 Apr 4 0,118 -0,761 28,0 5,29 -1,13 2,8Madaba 1989 Feb 5 0,147 -0,651 28,8 5,37 -1,07 3,1Madaba 1987 Dec 6 0,176 -0,551 30,6 5,53 -0,94 3,7Madaba 1990 Jan 7 0,206 -0,458 32,0 5,66 -0,84 4,2Madaba 1978 Dec 8 0,235 -0,369 33,6 5,80 -0,73 4,8Madaba 1984 Mar 9 0,265 -0,285 34,4 5,87 -0,68 5,1Madaba 2005 Dec 10 0,294 -0,202 36,1 6,01 -0,56 5,8Madaba 1996 Mar 11 0,324 -0,121 40,0 6,32 -0,32 7,4Madaba 1997 Feb 12 0,353 -0,041 40,0 6,32 -0,32 7,4Madaba 1981 Jan 13 0,382 0,039 40,2 6,34 -0,30 7,5Madaba 1994 Nov 14 0,412 0,120 41,3 6,43 -0,24 8,0Madaba 1982 Jan 15 0,441 0,201 44,5 6,67 -0,05 9,4Madaba 2003 Feb 16 0,471 0,283 45,0 6,71 -0,02 9,7Madaba 1973 Jan 17 0,500 0,367 45,7 6,76 0,02 10,0Madaba 1986 Nov 18 0,529 0,453 46,5 6,82 0,07 10,4Madaba 2007 Jan 19 0,559 0,541 47,7 6,91 0,14 10,9Madaba 1988 Feb 20 0,588 0,634 48,6 6,97 0,19 11,4Madaba 1998 Jan 21 0,618 0,730 50,0 7,07 0,27 12,1Madaba 2006 Apr 22 0,647 0,832 50,5 7,11 0,30 12,3Madaba 2000 Jan 23 0,676 0,939 51,5 7,18 0,35 12,8Madaba 1983 Feb 24 0,706 1,055 55,0 7,42 0,54 14,6Madaba 2001 Dec 25 0,735 1,179 55,2 7,43 0,55 14,7Madaba 1985 Feb 26 0,765 1,316 58,3 7,64 0,71 16,3Madaba 2002 Dec 27 0,794 1,467 63,5 7,97 0,97 19,1Madaba 1991 Dec 28 0,824 1,639 65,3 8,08 1,06 20,1Madaba 1992 Feb 29 0,853 1,838 66,3 8,14 1,11 20,7Madaba 1999 Feb 30 0,882 2,078 73,0 8,54 1,42 24,5Madaba 2004 Nov 31 0,912 2,382 73,6 8,58 1,45 24,9Madaba 1980 Dec 32 0,941 2,803 78,4 8,85 1,66 27,7Madaba 1979 Nov 33 0,971 3,511 85,2 9,23 1,96 31,8 n 33 33 33 33M 46,9 6,73 0,00 11,4S 17,1 1,28 1,00 8,1Cv 0,36 0,19 0,71Me 45,7 6,76 0,02 10,0Max 85,2 9,23 1,96 31,8Min 13,0 3,61 -2,44 0,0

Red Sea – Dead Sea Water Conveyance Study Program Draft Final Feasibility Study Report (12 147 RP 04), April 2011
Appendix G – Hydrology and Flood Studies Report
COYNE ET BELLIER in association with TRACTEBEL ENGINEERING and KEMA Appemdix G ‐ Page 100
Station Year Month Rank Fr u(Gumbel) Max √Max uY Aq-BaquraBaqura 1999 Jan 1 0,025 -1,305 21,1 4,59 -1,26 2,3Baqura 1993 Jan 2 0,050 -1,097 22,2 4,71 -1,18 2,6Baqura 1989 Dec 3 0,075 -0,952 22,6 4,75 -1,16 2,7Baqura 1972 Apr 4 0,100 -0,834 23,6 4,86 -1,09 3,0Baqura 1975 Feb 5 0,125 -0,732 26,0 5,10 -0,93 3,8Baqura 1998 Jan 6 0,150 -0,640 27,5 5,24 -0,83 4,3Baqura 1987 Dec 7 0,175 -0,556 27,8 5,27 -0,81 4,4Baqura 1996 Jan 8 0,200 -0,476 28,7 5,36 -0,76 4,7Baqura 1977 Dec 9 0,225 -0,400 28,8 5,37 -0,75 4,7Baqura 1978 Mar 10 0,250 -0,327 30,1 5,49 -0,67 5,1Baqura 1982 Nov 11 0,275 -0,255 30,9 5,56 -0,62 5,4Baqura 1983 Jan 12 0,300 -0,186 31,3 5,59 -0,60 5,6Baqura 1988 Dec 13 0,325 -0,117 32,0 5,66 -0,56 5,8Baqura 1969 Oct 14 0,350 -0,049 33,0 5,74 -0,50 6,2Baqura 1976 Nov 15 0,375 0,019 35,0 5,92 -0,39 6,9Baqura 1984 Feb 16 0,400 0,087 35,0 5,92 -0,39 6,9Baqura 2003 Mar 17 0,425 0,156 37,6 6,13 -0,24 7,9Baqura 1974 Dec 18 0,450 0,225 38,0 6,16 -0,22 8,1Baqura 2007 Nov 19 0,475 0,295 38,0 6,16 -0,22 8,1Baqura 1994 Jan 20 0,500 0,367 40,0 6,32 -0,12 8,9Baqura 1971 Dec 21 0,525 0,440 40,2 6,34 -0,11 9,0Baqura 1981 Jan 22 0,550 0,514 40,6 6,37 -0,08 9,1Baqura 1986 Nov 23 0,575 0,592 42,0 6,48 -0,01 9,7Baqura 2005 Dec 24 0,600 0,672 42,1 6,49 -0,01 9,7Baqura 2000 Jan 25 0,625 0,755 42,7 6,53 0,02 10,0Baqura 1968 Dec 26 0,650 0,842 44,8 6,69 0,13 10,8Baqura 2001 Dec 27 0,675 0,934 47,4 6,88 0,26 11,9Baqura 1985 Apr 28 0,700 1,031 47,6 6,90 0,26 12,0Baqura 1980 Mar 29 0,725 1,134 49,4 7,03 0,35 12,8Baqura 2006 Oct 30 0,750 1,246 53,3 7,30 0,53 14,5Baqura 2002 Dec 31 0,775 1,367 55,4 7,44 0,62 15,4Baqura 1997 Feb 32 0,800 1,500 56,2 7,50 0,66 15,8Baqura 1991 Dec 33 0,825 1,648 56,5 7,52 0,67 15,9Baqura 1995 Feb 34 0,850 1,817 57,2 7,56 0,70 16,3Baqura 1979 Nov 35 0,875 2,013 60,8 7,80 0,86 17,9Baqura 1973 Jan 36 0,900 2,250 61,9 7,87 0,91 18,4Baqura 2004 Oct 37 0,925 2,552 69,8 8,35 1,23 22,1Baqura 1992 Feb 38 0,950 2,970 97,0 9,85 2,22 35,7Baqura 1990 Jan 39 0,975 3,676 160,0 12,65 4,07 69,7 n 39 39 39 39M 44,5 6,50 0,00 11,4S 24,4 1,51 1,00 11,6Cv 0,55 0,23 1,02Me 40,0 6,32 -0,12 8,9Max 160,0 12,65 4,07 69,7Min 21,1 4,59 -1,26 2,3
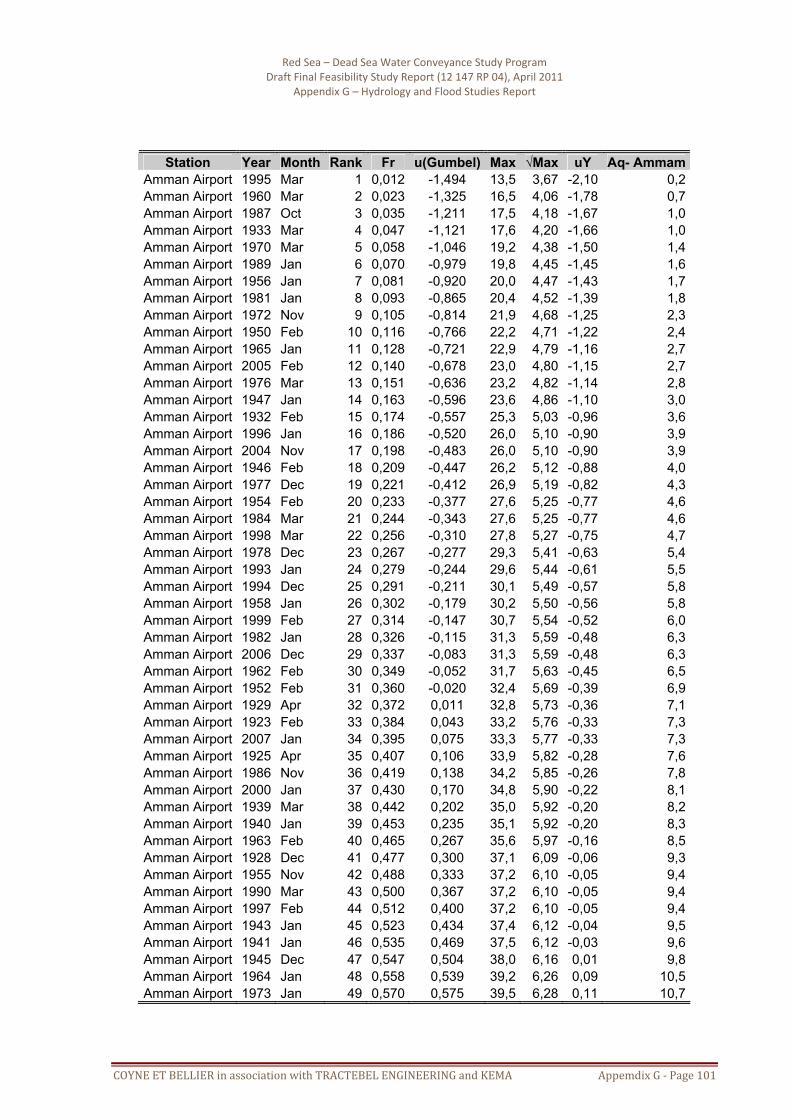
Red Sea – Dead Sea Water Conveyance Study Program Draft Final Feasibility Study Report (12 147 RP 04), April 2011
Appendix G – Hydrology and Flood Studies Report
COYNE ET BELLIER in association with TRACTEBEL ENGINEERING and KEMA Appemdix G ‐ Page 101
Station Year Month Rank Fr u(Gumbel) Max √Max uY Aq- AmmamAmman Airport 1995 Mar 1 0,012 -1,494 13,5 3,67 -2,10 0,2Amman Airport 1960 Mar 2 0,023 -1,325 16,5 4,06 -1,78 0,7Amman Airport 1987 Oct 3 0,035 -1,211 17,5 4,18 -1,67 1,0Amman Airport 1933 Mar 4 0,047 -1,121 17,6 4,20 -1,66 1,0Amman Airport 1970 Mar 5 0,058 -1,046 19,2 4,38 -1,50 1,4Amman Airport 1989 Jan 6 0,070 -0,979 19,8 4,45 -1,45 1,6Amman Airport 1956 Jan 7 0,081 -0,920 20,0 4,47 -1,43 1,7Amman Airport 1981 Jan 8 0,093 -0,865 20,4 4,52 -1,39 1,8Amman Airport 1972 Nov 9 0,105 -0,814 21,9 4,68 -1,25 2,3Amman Airport 1950 Feb 10 0,116 -0,766 22,2 4,71 -1,22 2,4Amman Airport 1965 Jan 11 0,128 -0,721 22,9 4,79 -1,16 2,7Amman Airport 2005 Feb 12 0,140 -0,678 23,0 4,80 -1,15 2,7Amman Airport 1976 Mar 13 0,151 -0,636 23,2 4,82 -1,14 2,8Amman Airport 1947 Jan 14 0,163 -0,596 23,6 4,86 -1,10 3,0Amman Airport 1932 Feb 15 0,174 -0,557 25,3 5,03 -0,96 3,6Amman Airport 1996 Jan 16 0,186 -0,520 26,0 5,10 -0,90 3,9Amman Airport 2004 Nov 17 0,198 -0,483 26,0 5,10 -0,90 3,9Amman Airport 1946 Feb 18 0,209 -0,447 26,2 5,12 -0,88 4,0Amman Airport 1977 Dec 19 0,221 -0,412 26,9 5,19 -0,82 4,3Amman Airport 1954 Feb 20 0,233 -0,377 27,6 5,25 -0,77 4,6Amman Airport 1984 Mar 21 0,244 -0,343 27,6 5,25 -0,77 4,6Amman Airport 1998 Mar 22 0,256 -0,310 27,8 5,27 -0,75 4,7Amman Airport 1978 Dec 23 0,267 -0,277 29,3 5,41 -0,63 5,4Amman Airport 1993 Jan 24 0,279 -0,244 29,6 5,44 -0,61 5,5Amman Airport 1994 Dec 25 0,291 -0,211 30,1 5,49 -0,57 5,8Amman Airport 1958 Jan 26 0,302 -0,179 30,2 5,50 -0,56 5,8Amman Airport 1999 Feb 27 0,314 -0,147 30,7 5,54 -0,52 6,0Amman Airport 1982 Jan 28 0,326 -0,115 31,3 5,59 -0,48 6,3Amman Airport 2006 Dec 29 0,337 -0,083 31,3 5,59 -0,48 6,3Amman Airport 1962 Feb 30 0,349 -0,052 31,7 5,63 -0,45 6,5Amman Airport 1952 Feb 31 0,360 -0,020 32,4 5,69 -0,39 6,9Amman Airport 1929 Apr 32 0,372 0,011 32,8 5,73 -0,36 7,1Amman Airport 1923 Feb 33 0,384 0,043 33,2 5,76 -0,33 7,3Amman Airport 2007 Jan 34 0,395 0,075 33,3 5,77 -0,33 7,3Amman Airport 1925 Apr 35 0,407 0,106 33,9 5,82 -0,28 7,6Amman Airport 1986 Nov 36 0,419 0,138 34,2 5,85 -0,26 7,8Amman Airport 2000 Jan 37 0,430 0,170 34,8 5,90 -0,22 8,1Amman Airport 1939 Mar 38 0,442 0,202 35,0 5,92 -0,20 8,2Amman Airport 1940 Jan 39 0,453 0,235 35,1 5,92 -0,20 8,3Amman Airport 1963 Feb 40 0,465 0,267 35,6 5,97 -0,16 8,5Amman Airport 1928 Dec 41 0,477 0,300 37,1 6,09 -0,06 9,3Amman Airport 1955 Nov 42 0,488 0,333 37,2 6,10 -0,05 9,4Amman Airport 1990 Mar 43 0,500 0,367 37,2 6,10 -0,05 9,4Amman Airport 1997 Feb 44 0,512 0,400 37,2 6,10 -0,05 9,4Amman Airport 1943 Jan 45 0,523 0,434 37,4 6,12 -0,04 9,5Amman Airport 1941 Jan 46 0,535 0,469 37,5 6,12 -0,03 9,6Amman Airport 1945 Dec 47 0,547 0,504 38,0 6,16 0,01 9,8Amman Airport 1964 Jan 48 0,558 0,539 39,2 6,26 0,09 10,5Amman Airport 1973 Jan 49 0,570 0,575 39,5 6,28 0,11 10,7

Red Sea – Dead Sea Water Conveyance Study Program Draft Final Feasibility Study Report (12 147 RP 04), April 2011
Appendix G – Hydrology and Flood Studies Report
COYNE ET BELLIER in association with TRACTEBEL ENGINEERING and KEMA Appemdix G ‐ Page 102
Station Year Month Rank Fr u(Gumbel) Max √Max uY Aq- Ammam
Amman Airport 1959 Jan 50 0,581 0,612 39,7 6,30 0,12 10,8Amman Airport 1968 Jan 51 0,593 0,649 40,9 6,40 0,20 11,5Amman Airport 1942 Feb 52 0,605 0,687 41,1 6,41 0,22 11,6Amman Airport 1937 Apr 53 0,616 0,726 41,5 6,44 0,24 11,8Amman Airport 1974 Jan 54 0,628 0,765 42,0 6,48 0,27 12,1Amman Airport 1975 Feb 55 0,640 0,805 42,5 6,52 0,31 12,4Amman Airport 1957 Jan 56 0,651 0,846 44,3 6,66 0,42 13,5Amman Airport 1944 Jan 57 0,663 0,888 44,4 6,66 0,43 13,5Amman Airport 1951 Feb 58 0,674 0,932 44,9 6,70 0,46 13,8Amman Airport 1934 Dec 59 0,686 0,976 45,0 6,71 0,47 13,9Amman Airport 2002 Dec 60 0,698 1,022 45,4 6,74 0,49 14,1Amman Airport 1949 Dec 61 0,709 1,069 45,6 6,75 0,50 14,3Amman Airport 1985 Feb 62 0,721 1,117 46,4 6,81 0,55 14,7Amman Airport 2001 Dec 63 0,733 1,167 47,6 6,90 0,63 15,5Amman Airport 1991 Dec 64 0,744 1,219 48,2 6,94 0,67 15,9Amman Airport 1992 Jan 65 0,756 1,273 50,3 7,09 0,79 17,2Amman Airport 1931 Jan 66 0,767 1,329 50,8 7,13 0,82 17,5Amman Airport 1969 Mar 67 0,779 1,388 51,0 7,14 0,83 17,6Amman Airport 1926 Dec 68 0,791 1,449 52,0 7,21 0,89 18,3Amman Airport 2003 Feb 69 0,802 1,513 52,1 7,22 0,90 18,3Amman Airport 1971 Apr 70 0,814 1,581 52,4 7,24 0,92 18,5Amman Airport 1988 Feb 71 0,826 1,652 52,6 7,25 0,93 18,7Amman Airport 1936 Dec 72 0,837 1,728 53,3 7,30 0,97 19,1Amman Airport 1983 Mar 73 0,849 1,809 53,4 7,31 0,97 19,2Amman Airport 1979 Nov 74 0,860 1,895 55,0 7,42 1,07 20,2Amman Airport 1935 Feb 75 0,872 1,989 55,7 7,46 1,11 20,7Amman Airport 1953 Mar 76 0,884 2,091 55,9 7,48 1,12 20,8Amman Airport 1961 Dec 77 0,895 2,202 58,8 7,67 1,28 22,8Amman Airport 1930 Jan 78 0,907 2,326 60,0 7,75 1,35 23,6Amman Airport 1967 Mar 79 0,919 2,466 60,9 7,80 1,40 24,2Amman Airport 1966 Mar 80 0,930 2,627 66,2 8,14 1,68 27,9Amman Airport 1927 Feb 81 0,942 2,815 71,4 8,45 1,94 31,6Amman Airport 1980 Dec 82 0,953 3,044 73,6 8,58 2,05 33,2Amman Airport 1948 Jan 83 0,965 3,338 75,6 8,69 2,15 34,6Amman Airport 1938 Nov 84 0,977 3,749 79,4 8,91 2,33 37,5Amman Airport 1924 Feb 85 0,988 4,449 80,0 8,94 2,36 37,9 n 85 85 85 85M 39,3 6,16 0,00 11,4S 15,0 1,18 1,00 8,7Cv 0,38 0,19 0,76Me 37,2 6,10 -0,05 9,4Max 80,0 8,94 2,36 37,9Min 13,5 3,67 -2,10 0,2

Red Sea – Dead Sea Water Conveyance Study Program Draft Final Feasibility Study Report (12 147 RP 04), April 2011
Appendix G – Hydrology and Flood Studies Report
COYNE ET BELLIER in association with TRACTEBEL ENGINEERING and KEMA Appemdix G ‐ Page 103
Station Year Month Rank Fr u(Gumbel) Max √Max uY Aq-IrbedIrbed 1981 Jan 1 0,019 -1,384 24,8 4,98 -1,68 0,9Irbed 1972 Feb 2 0,037 -1,193 25,6 5,06 -1,61 1,1Irbed 1993 May 3 0,056 -1,061 27,9 5,28 -1,42 1,7Irbed 1989 Feb 4 0,074 -0,957 29,2 5,40 -1,31 2,1Irbed 1987 Jan 5 0,093 -0,867 29,3 5,41 -1,30 2,1Irbed 1965 Dec 6 0,111 -0,787 29,6 5,44 -1,27 2,2Irbed 1999 Feb 7 0,130 -0,714 31,0 5,57 -1,16 2,7Irbed 1976 Mar 8 0,148 -0,647 31,3 5,59 -1,14 2,8Irbed 2001 Dec 9 0,167 -0,583 32,9 5,74 -1,01 3,4Irbed 1959 Jan 10 0,185 -0,523 33,5 5,79 -0,97 3,6Irbed 1975 Feb 11 0,204 -0,464 34,1 5,84 -0,92 3,8Irbed 1985 Feb 12 0,222 -0,408 34,8 5,90 -0,87 4,1Irbed 1960 Dec 13 0,241 -0,353 35,0 5,92 -0,85 4,2Irbed 1995 Feb 14 0,259 -0,300 35,2 5,93 -0,84 4,2Irbed 1994 Mar 15 0,278 -0,248 35,6 5,97 -0,81 4,4Irbed 1996 Jan 16 0,296 -0,196 36,3 6,02 -0,75 4,7Irbed 1956 Jan 17 0,315 -0,145 36,5 6,04 -0,74 4,8Irbed 2007 Nov 18 0,333 -0,094 37,4 6,12 -0,67 5,1Irbed 1962 Feb 19 0,352 -0,044 37,6 6,13 -0,66 5,2Irbed 1982 Feb 20 0,370 0,007 38,1 6,17 -0,62 5,4Irbed 2006 Feb 21 0,389 0,057 38,5 6,20 -0,59 5,6Irbed 1957 Dec 22 0,407 0,108 40,0 6,32 -0,49 6,3Irbed 1998 Mar 23 0,426 0,158 40,5 6,36 -0,45 6,5Irbed 1978 Mar 24 0,444 0,210 43,3 6,58 -0,26 7,8Irbed 1969 Jan 25 0,463 0,261 43,8 6,62 -0,23 8,1Irbed 2004 Nov 26 0,481 0,313 44,5 6,67 -0,18 8,4Irbed 1988 Feb 27 0,500 0,367 47,2 6,87 0,00 9,8Irbed 1973 Jan 28 0,519 0,420 48,2 6,94 0,06 10,3Irbed 2002 Dec 29 0,537 0,475 51,0 7,14 0,24 11,8Irbed 1977 Jan 30 0,556 0,531 51,4 7,17 0,26 12,0Irbed 1991 Dec 31 0,574 0,589 54,6 7,39 0,46 13,8Irbed 1971 Apr 32 0,593 0,648 54,8 7,40 0,47 13,9Irbed 1958 Jan 33 0,611 0,708 55,6 7,46 0,52 14,4Irbed 2003 Mar 34 0,630 0,771 55,7 7,46 0,53 14,5Irbed 1979 Nov 35 0,648 0,836 56,0 7,48 0,54 14,6Irbed 2000 Jan 36 0,667 0,903 56,3 7,50 0,56 14,8Irbed 1986 Nov 37 0,685 0,973 57,0 7,55 0,60 15,2Irbed 1964 Feb 38 0,704 1,046 58,3 7,64 0,68 16,0Irbed 1970 Mar 39 0,722 1,123 58,8 7,67 0,71 16,3Irbed 1967 Jan 40 0,741 1,204 60,2 7,76 0,79 17,2Irbed 2005 Feb 41 0,759 1,289 60,6 7,78 0,81 17,4Irbed 1984 Dec 42 0,778 1,381 61,0 7,81 0,84 17,6Irbed 1966 Dec 43 0,796 1,479 63,7 7,98 0,99 19,3Irbed 1968 Jan 44 0,815 1,586 64,2 8,01 1,02 19,6Irbed 1990 Jan 45 0,833 1,702 65,5 8,09 1,09 20,5Irbed 1980 Dec 46 0,852 1,830 65,8 8,11 1,10 20,7Irbed 1955 Dec 47 0,870 1,974 67,0 8,19 1,17 21,4Irbed 1983 Jan 48 0,889 2,139 67,0 8,19 1,17 21,4Irbed 1992 Dec 49 0,907 2,331 68,4 8,27 1,25 22,3Irbed 1997 Feb 50 0,926 2,564 68,8 8,29 1,27 22,6
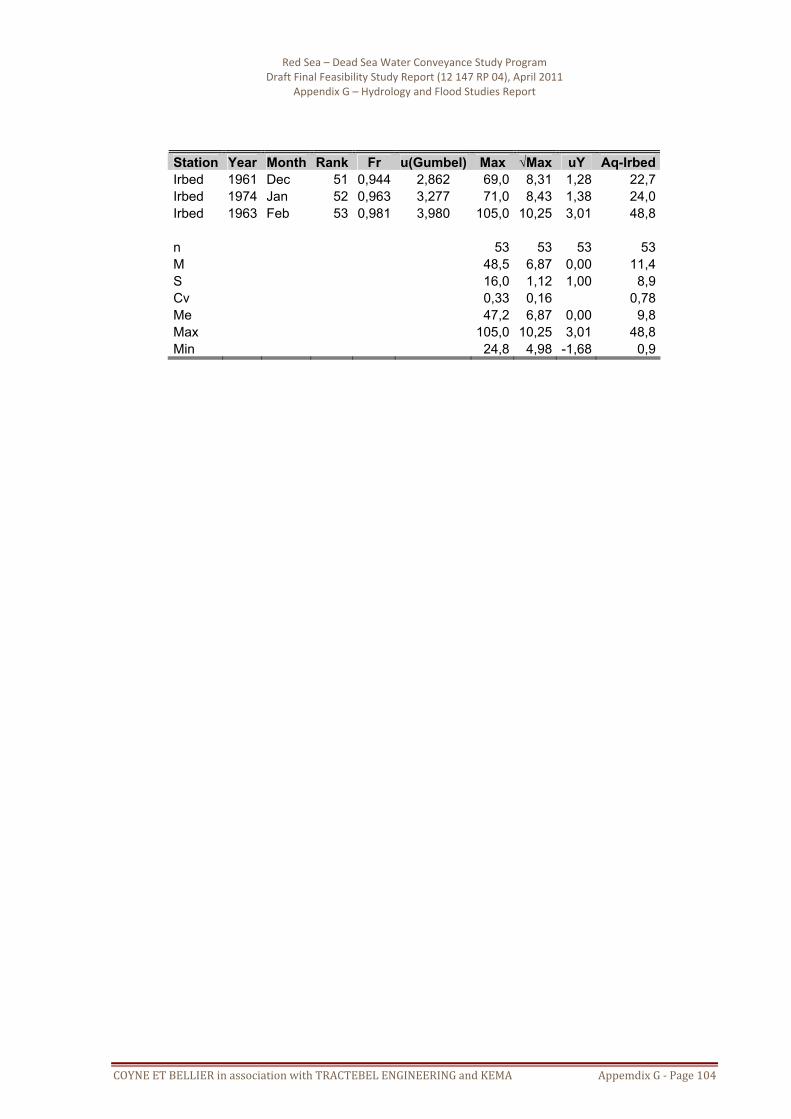
Red Sea – Dead Sea Water Conveyance Study Program Draft Final Feasibility Study Report (12 147 RP 04), April 2011
Appendix G – Hydrology and Flood Studies Report
COYNE ET BELLIER in association with TRACTEBEL ENGINEERING and KEMA Appemdix G ‐ Page 104
Station Year Month Rank Fr u(Gumbel) Max √Max uY Aq-IrbedIrbed 1961 Dec 51 0,944 2,862 69,0 8,31 1,28 22,7Irbed 1974 Jan 52 0,963 3,277 71,0 8,43 1,38 24,0Irbed 1963 Feb 53 0,981 3,980 105,0 10,25 3,01 48,8 n 53 53 53 53M 48,5 6,87 0,00 11,4S 16,0 1,12 1,00 8,9Cv 0,33 0,16 0,78Me 47,2 6,87 0,00 9,8Max 105,0 10,25 3,01 48,8Min 24,8 4,98 -1,68 0,9

Red Sea – Dead Sea Water Conveyance Study Program Draft Final Feasibility Study Report (12 147 RP 04), April 2011
Appendix G – Hydrology and Flood Studies Report
COYNE ET BELLIER in association with TRACTEBEL ENGINEERING and KEMA Appemdix G ‐ Page 105
Station Year Month Rank Fr u(Gumbel) Max √Max uY Aq-Salt Salt 1995 Feb 1 0,023 -1,325 23,3 4,83 -2,33 0,0 Salt 1998 Jan 2 0,047 -1,121 33,5 5,79 -1,59 1,2 Salt 1999 Feb 3 0,070 -0,979 38,5 6,20 -1,27 2,3 Salt 1960 Nov 4 0,093 -0,865 39,0 6,24 -1,24 2,4 Salt 1962 Jan 5 0,116 -0,766 40,0 6,32 -1,18 2,6 Salt 1993 Jan 6 0,140 -0,678 40,0 6,32 -1,18 2,6 Salt 1981 Feb 7 0,163 -0,596 42,0 6,48 -1,05 3,2 Salt 1984 Jan 8 0,186 -0,520 44,0 6,63 -0,94 3,7 Salt 1968 Nov 9 0,209 -0,447 47,0 6,86 -0,76 4,6 Salt 2000 Jan 10 0,233 -0,377 47,0 6,86 -0,76 4,6 Salt 1967 Mar 11 0,256 -0,310 48,0 6,93 -0,71 4,9 Salt 1964 Jan 12 0,279 -0,244 49,0 7,00 -0,65 5,3 Salt 1976 Nov 13 0,302 -0,179 49,0 7,00 -0,65 5,3 Salt 1977 Dec 14 0,326 -0,115 50,0 7,07 -0,60 5,6 Salt 1973 Jan 15 0,349 -0,052 53,0 7,28 -0,44 6,6 Salt 1974 Feb 16 0,372 0,011 53,0 7,28 -0,44 6,6 Salt 1972 Mar 17 0,395 0,075 55,0 7,42 -0,33 7,3 Salt 1996 Mar 18 0,419 0,138 55,6 7,46 -0,30 7,5 Salt 1969 Mar 19 0,442 0,202 57,0 7,55 -0,23 8,0 Salt 1970 Jan 20 0,465 0,267 57,0 7,55 -0,23 8,0 Salt 1975 Mar 21 0,488 0,333 60,0 7,75 -0,08 9,2 Salt 2004 Nov 22 0,512 0,400 60,0 7,75 -0,08 9,2 Salt 1992 Feb 23 0,535 0,469 60,2 7,76 -0,07 9,3 Salt 1994 Nov 24 0,558 0,539 61,5 7,84 0,00 9,8 Salt 1965 Jan 25 0,581 0,612 63,0 7,94 0,07 10,4 Salt 2005 Dec 26 0,605 0,687 66,5 8,15 0,24 11,8 Salt 1985 Feb 27 0,628 0,765 67,7 8,23 0,30 12,3 Salt 2007 Jan 28 0,651 0,846 68,2 8,26 0,32 12,5 Salt 1978 Dec 29 0,674 0,932 72,0 8,49 0,50 14,2 Salt 1961 Dec 30 0,698 1,022 76,0 8,72 0,67 16,0 Salt 2001 Dec 31 0,721 1,117 80,0 8,94 0,85 17,8 Salt 2006 Dec 32 0,744 1,219 80,2 8,96 0,86 17,9 Salt 2003 Feb 33 0,767 1,329 80,4 8,97 0,87 18,0 Salt 1982 Jan 34 0,791 1,449 81,0 9,00 0,89 18,3 Salt 1971 Apr 35 0,814 1,581 82,0 9,06 0,94 18,7 Salt 1983 Mar 36 0,837 1,728 87,0 9,33 1,15 21,1 Salt 1997 Feb 37 0,860 1,895 87,7 9,36 1,17 21,5 Salt 2002 Jan 38 0,884 2,091 90,0 9,49 1,27 22,6 Salt 1980 Dec 39 0,907 2,326 95,0 9,75 1,47 25,1 Salt 1966 Dec 40 0,930 2,627 100,0 10,00 1,67 27,7 Salt 1979 Nov 41 0,953 3,044 104,0 10,20 1,82 29,8 Salt 1963 Feb 42 0,977 3,749 110,0 10,49 2,04 33,0 n 42 42 42 42 M 63,2 7,84 0,00 11,4 S 20,5 1,29 1,00 8,4 Cv 0,32 0,16 0,74 Me 60,0 7,75 -0,08 9,2 Max 110,0 10,49 2,04 33,0 Min 23,3 4,83 -2,33 0,0

Red Sea – Dead Sea Water Conveyance Study Program Draft Final Feasibility Study Report (12 147 RP 04), April 2011
Appendix G – Hydrology and Flood Studies Report
COYNE ET BELLIER in association with TRACTEBEL ENGINEERING and KEMA Appemdix G ‐ Page 106
107. Flood hydrographs
t (h) Q-10 yr Q-20-yr Q-50-yr Q-100 yr Q-500 yr Q-1 000 yr Q-5 000 yr Q-10 000 yr PMF0 0 0 0 0 0 0 0 0 02 0 0 0 0 0 0 0 0 04 0 0 0 0 0 0 0 0 06 0 0 0 0 0 0 0 0 08 0 0 0 0 0 0 0 0 4
10 0 0 0 0 0 0 0 0 3412 3 4 6 7 11 13 17 19 15114 21 30 42 52 77 89 118 131 60416 48 66 93 115 170 196 258 287 1 22018 88 121 170 210 311 357 471 522 2 11320 136 188 264 326 482 554 730 809 3 17222 192 265 371 458 676 777 1 022 1 132 4 32124 245 338 473 583 859 986 1 296 1 434 5 37126 288 398 556 685 1 008 1 156 1 517 1 679 6 18028 320 441 615 757 1 112 1 274 1 670 1 846 6 69630 330 460 640 780 1 140 1 310 1 710 1 890 6 78032 327 449 624 766 1 121 1 283 1 675 1 851 6 56234 309 424 589 722 1 054 1 205 1 571 1 735 6 10136 285 391 541 663 966 1 104 1 437 1 586 5 54038 256 350 485 593 863 985 1 282 1 414 4 91340 228 311 431 526 765 873 1 135 1 251 4 32942 196 268 370 452 656 749 972 1 071 3 70144 169 231 319 390 566 646 839 924 3 18946 146 200 276 337 488 557 724 797 2 75248 125 170 235 287 416 475 616 679 2 34450 108 148 204 249 362 413 536 591 2 03652 92 126 173 212 307 350 455 501 1 72454 76 104 143 175 254 289 375 414 1 42456 65 89 123 150 217 248 322 354 1 22058 56 76 105 128 186 212 275 303 1 04460 47 64 89 108 157 179 232 255 87962 41 56 77 94 136 156 202 223 76564 33 46 63 77 112 127 165 182 62666 28 39 53 65 94 107 139 153 53168 25 34 47 57 83 94 123 135 46870 22 30 41 51 74 84 109 120 41572 18 25 35 42 61 70 91 100 34774 16 22 30 36 53 60 79 87 29976 14 18 26 31 45 52 67 74 25578 12 16 22 27 39 44 57 63 21680 10 13 18 22 32 37 47 52 18082 8 11 15 19 27 31 41 45 15484 7 10 13 16 23 27 34 38 13086 6 8 11 14 20 22 29 32 11088 5 7 9 11 16 18 24 26 9090 4 5 7 9 13 15 19 21 7392 3 4 6 7 10 12 15 17 5694 2 3 4 5 8 9 11 13 41

Red Sea – Dead Sea Water Conveyance Study Program Draft Final Feasibility Study Report (12 147 RP 04), April 2011
Appendix G – Hydrology and Flood Studies Report
COYNE ET BELLIER in association with TRACTEBEL ENGINEERING and KEMA Appemdix G ‐ Page 107
t (h) Q-10 yr Q-20-yr Q-50-yr Q-100 yr Q-500 yr Q-1 000 yr Q-5 000 yr Q-10 000 yr PMF96 2 2 3 4 5 6 8 8 2798 1 1 2 2 3 4 5 5 17
100 1 1 1 1 2 2 3 3 9102 0 0 1 1 1 1 2 2 5104 0 0 0 0 1 1 1 1 3106 0 0 0 0 0 0 0 1 2108 0 0 0 0 0 0 0 0 1110 0 0 0 0 0 0 0 0 0112 0 0 0 0 0 0 0 0 0
Qp 330 460 640 780 1 140 1 310 1 710 1 890 6 780K(Qp) 2,00 2,33 2,66 2,86 3,23 3,37 3,64 3,74 5,01
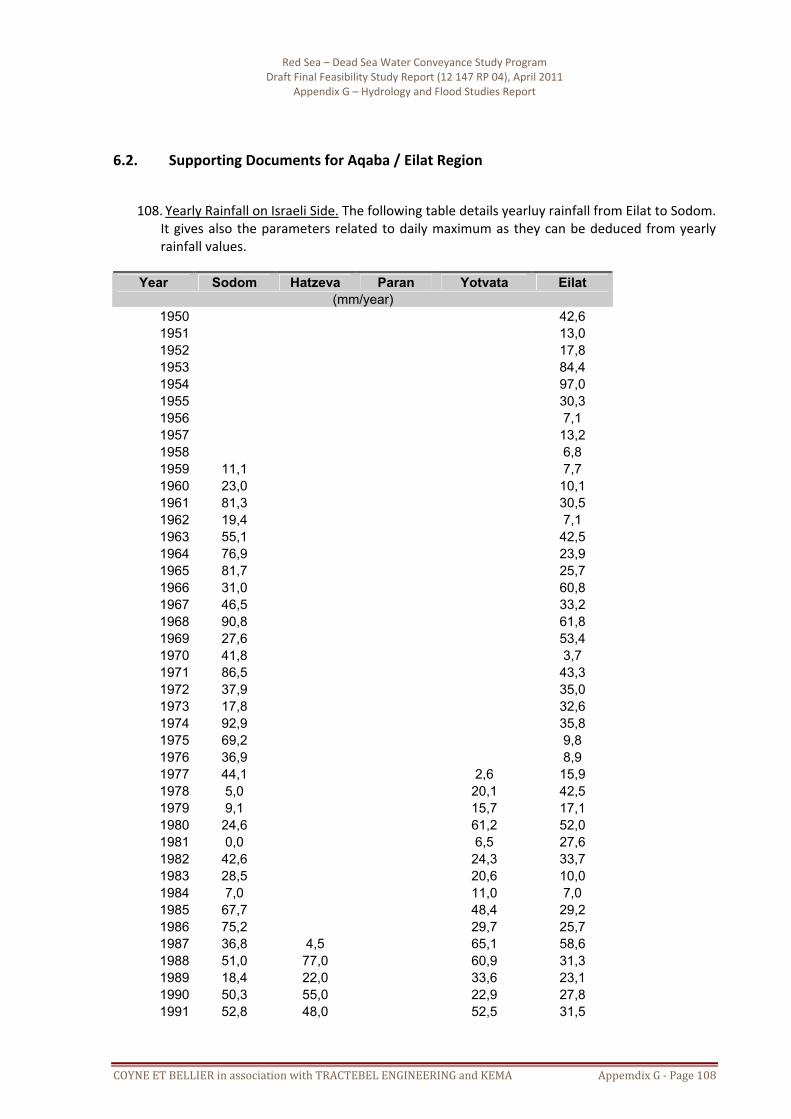
Red Sea – Dead Sea Water Conveyance Study Program Draft Final Feasibility Study Report (12 147 RP 04), April 2011
Appendix G – Hydrology and Flood Studies Report
COYNE ET BELLIER in association with TRACTEBEL ENGINEERING and KEMA Appemdix G ‐ Page 108
6.2. Supporting Documents for Aqaba / Eilat Region
108. Yearly Rainfall on Israeli Side. The following table details yearluy rainfall from Eilat to Sodom. It gives also the parameters related to daily maximum as they can be deduced from yearly rainfall values.
Year Sodom Hatzeva Paran Yotvata Eilat (mm/year)
1950 42,6 1951 13,0 1952 17,8 1953 84,4 1954 97,0 1955 30,3 1956 7,1 1957 13,2 1958 6,8 1959 11,1 7,7 1960 23,0 10,1 1961 81,3 30,5 1962 19,4 7,1 1963 55,1 42,5 1964 76,9 23,9 1965 81,7 25,7 1966 31,0 60,8 1967 46,5 33,2 1968 90,8 61,8 1969 27,6 53,4 1970 41,8 3,7 1971 86,5 43,3 1972 37,9 35,0 1973 17,8 32,6 1974 92,9 35,8 1975 69,2 9,8 1976 36,9 8,9 1977 44,1 2,6 15,9 1978 5,0 20,1 42,5 1979 9,1 15,7 17,1 1980 24,6 61,2 52,0 1981 0,0 6,5 27,6 1982 42,6 24,3 33,7 1983 28,5 20,6 10,0 1984 7,0 11,0 7,0 1985 67,7 48,4 29,2 1986 75,2 29,7 25,7 1987 36,8 4,5 65,1 58,6 1988 51,0 77,0 60,9 31,3 1989 18,4 22,0 33,6 23,1 1990 50,3 55,0 22,9 27,8 1991 52,8 48,0 52,5 31,5

Red Sea – Dead Sea Water Conveyance Study Program Draft Final Feasibility Study Report (12 147 RP 04), April 2011
Appendix G – Hydrology and Flood Studies Report
COYNE ET BELLIER in association with TRACTEBEL ENGINEERING and KEMA Appemdix G ‐ Page 109
Year Sodom Hatzeva Paran Yotvata Eilat
(mm/year) 1992 16,4 31,0 47,1 23,1 1993 51,1 29,0 17,3 18,5 45,2 1994 67,1 70,0 53,5 55,9 39,8 1995 30,4 12,0 12,9 15,7 10,3 1996 32,2 22,0 41,4 11,0 2,9 1997 29,3 61,0 36,8 16,3 38,8 1998 35,5 31,0 22,4 15,2 7,8 1999 21,6 9,3 24,2 32,5 25,0 2000 33,6 28,0 15,9 16,5 18,5 2001 32,8 15,0 6,0 26,6 16,3 2002 25,0 39,0 10,4 11,2 21,3 2003 25,5 27,0 18,4 20,7 11,5 2004 118,1 39,0 41,6 19,4 16,0 2005 26,6 20,0 25,0 6,1 3,8 2006 31,8 49,0 36,9 6,5 3,7 2007 28,9 23,0 10,5 8,1 17,1 2008 22,0 23,0 36,5 8,3
n 50 22 16 32 58 M 41,4 33,4 25,6 25,3 27,1 S 26,0 19,5 13,9 18,3 19,8 Cv 0,629 0,583 0,542 0,721 0,729 Me 33,2 28,5 23,3 19,8 24,5 Max 118,1 77,0 53,5 65,1 97,0 Min 0,0 4,5 6,0 2,6 2,9
Deduced Information about Maximum Daily Rainfall (mm/day) M 12,53 11,40 10,30 10,26 10,51 P0 7,02 5,95 4,90 4,86 5,10 G 7,72 7,53 7,35 7,34 7,38

Red Sea – Dead Sea Water Conveyance Study Program Draft Final Feasibility Study Report (12 147 RP 04), April 2011
Appendix G – Hydrology and Flood Studies Report
COYNE ET BELLIER in association with TRACTEBEL ENGINEERING and KEMA Appemdix G ‐ Page 110
109. 10‐mm Unitgraphs. The following table details the unitgraphs found for the catchment groups A, B and C.
Group A Group B Group C t Q/Qp Q t Q/Qp Q t Q/Qp Q 0 0,00 0,00 0 0,000 0,00 0 0,000 0,00 1 0,36 61,07 1 0,929 193,11 1 0,600 123,43 2 0,98 166,26 2 0,500 103,93 2 0,920 189,26 3 0,77 130,63 3 0,145 30,14 3 0,418 85,99 4 0,40 67,86 4 0,046 9,56 4 0,174 35,80 5 0,20 33,93 5 0,0135 2,81 5 0,0700 14,40 6 0,12 20,36 6 0,004 0,83 6 0,031 6,38 7 0,06 10,18 6 0,0035 0,73 7 0,0135 2,78 8 0,04 6,79 7 0,000 0,00 8 0,006 1,13 9 0,02 2,71 9 0,000 0,00 9 0,015 2,54 10 0,01 1,36 10 0,008 1,36 11 0,003 0,51 12 0,00 0,00
Sum 2,98 505,56 Sum 1,64 341,11 Sum 2,23 459,17 10 728 1 820 000 5 908 1 228 000 8 035 1 653 00010-mm 1 820 000 10-mm 1 228 000 10-mm 1 653 000 Qp 169,65 Qp 207,87 Qp 205,72
Note: t in hours, Q in m3/s.
110. Flood Hydrographs – Storm Centered on Yutum – T = 100‐years – V=20 km/h.
t Yutum Group A Group B Group C A+B+C t Yutum-DS A-DS B-DS C-DS 470 km² Sum 0 0 0 0 0 0 0 0 0 0 0 0 01 0 0 0 0 0 1 0 0 0 0 0 02 0 0 0 0 0 2 0 0 0 0 0 03 0 0 0 0 0 3 0 0 0 0 0 04 0 0 0 0 0 4 0 0 0 0 0 05 0 0 0 0 0 5 0 0 0 0 0 06 0 0 0 0 0 6 0 0 0 0 0 07 0 0 0 0 0 7 0 0 0 0 0 08 0 0 0 0 0 8 0 0 0 0 0 09 0 0 0 0 0 9 0 0 0 0 0 0
10 0 0 0 0 0 10 0 0 0 0 0 011 0 0 0 0 0 11 0 0 0 0 0 012 7 22 68 44 133 12 3 5 28 34 67 7013 30 66 60 82 208 13 18 29 67 80 176 19314 52 70 34 60 164 14 41 59 49 66 174 21515 83 53 24 41 117 15 67 63 29 41 133 20016 115 39 16 29 85 16 99 52 21 32 104 20317 162 30 13 22 65 17 138 40 15 22 76 21418 210 24 12 18 55 18 186 31 13 19 63 24919 268 21 9 15 45 19 238 25 11 16 52 29020 326 16 8 12 37 20 297 21 9 13 42 339

Red Sea – Dead Sea Water Conveyance Study Program Draft Final Feasibility Study Report (12 147 RP 04), April 2011
Appendix G – Hydrology and Flood Studies Report
COYNE ET BELLIER in association with TRACTEBEL ENGINEERING and KEMA Appemdix G ‐ Page 111
t Yutum Group A Group B Group C A+B+C t Yutum-DS A-DS B-DS C-DS 470 km² Sum 21 392 14 8 11 33 21 358 17 8 11 35 39422 458 13 8 10 31 22 425 14 8 10 32 45723 520 12 8 10 30 23 489 13 8 10 31 52024 583 12 7 10 29 24 551 12 7 10 30 58125 634 10 3 7 20 25 609 11 6 8 24 63326 685 6 1 3 10 26 659 9 2 4 15 67427 721 3 0 1 5 27 703 6 1 1 8 71128 757 2 0 1 2 28 738 3 0 1 4 74329 768 1 0 0 1 29 764 2 0 0 2 76630 780 1 0 0 1 30 774 1 0 0 1 77531 773 0 0 0 0 31 777 1 0 0 1 77832 766 0 0 0 0 32 769 0 0 0 0 77033 744 0 0 0 0 33 756 0 0 0 75634 722 0 0 0 0 34 733 0 0 0 73335 692 0 0 0 0 35 708 0 0 0 70836 663 0 0 0 0 36 678 0 0 0 67837 628 0 0 0 0 37 646 0 0 0 64638 593 38 611 0 61139 560 39 577 0 57740 526 40 543 0 54341 489 41 508 0 50842 452 42 471 0 47143 421 43 436 0 43644 390 44 406 0 40645 363 45 377 0 37746 337 46 350 0 35047 312 47 324 0 32448 287 48 300 0 30049 268 49 277 0 27750 249 50 259 0 25951 231 51 240 0 24052 212 52 221 0 22153 193 53 203 0 20354 175 54 184 0 18455 162 55 168 0 16856 150 56 156 0 15657 139 57 144 0 14458 128 58 134 0 13459 118 59 123 0 12360 108 60 113 0 11361 101 61 104 0 10462 94 62 98 0 9863 85 63 90 0 9064 77 64 81 0 8165 71 65 74 0 7466 65 66 68 0 6867 61 67 63 0 6368 57 68 59 0 5969 54 69 55 0 5570 51 70 52 0 5271 47 71 49 0 4972 42 72 44 0 44

Red Sea – Dead Sea Water Conveyance Study Program Draft Final Feasibility Study Report (12 147 RP 04), April 2011
Appendix G – Hydrology and Flood Studies Report
COYNE ET BELLIER in association with TRACTEBEL ENGINEERING and KEMA Appemdix G ‐ Page 112
t Yutum Group A Group B Group C A+B+C t Yutum-DS A-DS B-DS C-DS 470 km² Sum 73 39 73 41 0 4174 36 74 38 0 3875 34 75 35 0 3576 31 76 33 0 3377 29 77 30 0 3078 27 78 28 0 2879 24 79 25 0 2580 22 80 23 0 2381 20 81 21 0 2182 19 82 20 0 2083 17 83 18 0 1884 16 84 17 0 1785 15 85 15 0 1586 14 86 14 0 1487 12 87 13 0 1388 11 88 12 0 1289 10 89 11 0 1190 9 90 10 0 1091 8 91 9 0 992 7 92 8 0 893 6 93 7 0 794 5 94 6 0 695 5 95 5 0 596 4 96 4 0 4 Qp 780 70 68 82 208 Qp 777 63 67 80 176 778 % 100 91 99 97 85

Red Sea – Dead Sea Water Conveyance Study Program Draft Final Feasibility Study Report (12 147 RP 04), April 2011
Appendix G – Hydrology and Flood Studies Report
COYNE ET BELLIER in association with TRACTEBEL ENGINEERING and KEMA Appemdix G ‐ Page 113
111. Flood Hydrographs – Storm Centered on Yutum – T = 1 000‐years – V=20 km/h.
t Yutum Group A Group B Group C A+B+C t Yutum-DS A-DS B-DS C-DS 470 km² Sum 0 0 0 0 0 0 0 0 0 0 0 0 01 0 0 0 0 0 1 0 0 0 0 0 02 0 0 0 0 0 2 0 0 0 0 0 03 0 0 0 0 0 3 0 0 0 0 0 04 0 0 0 0 0 4 0 0 0 0 0 05 0 0 0 0 0 5 0 0 0 0 0 06 0 0 0 0 0 6 0 0 0 0 0 07 0 0 0 0 0 7 0 0 0 0 0 08 0 0 0 0 0 8 0 0 0 0 0 09 0 0 0 0 0 9 0 0 0 0 0 0
10 0 0 0 0 0 10 0 0 0 0 0 011 0 0 0 0 1 11 0 0 0 0 0 012 13 50 156 100 306 12 6 12 64 78 155 16013 51 148 127 180 455 13 30 65 150 177 392 42314 89 148 66 123 338 14 70 131 101 138 369 44015 143 106 44 79 229 15 115 135 55 79 269 38416 196 76 29 54 159 16 169 105 37 60 202 37117 277 57 23 39 119 17 234 77 26 39 142 37718 357 44 22 32 98 18 317 58 22 34 115 43119 456 37 16 27 80 19 405 46 19 27 92 49720 554 29 14 21 63 20 505 37 15 22 74 57921 666 25 13 18 56 21 609 30 13 18 61 67022 777 22 13 18 53 22 721 25 13 18 56 77723 881 21 13 17 51 23 829 23 13 17 53 88124 986 20 12 17 49 24 933 21 13 17 51 98425 1 071 17 5 12 34 25 1 029 19 9 13 41 1 07126 1 156 10 2 5 17 26 1 113 16 3 6 25 1 13827 1 215 5 0 2 8 27 1 187 10 1 2 13 1 20028 1 274 3 0 1 4 28 1 244 6 0 1 7 1 25229 1 292 2 0 0 2 29 1 285 3 0 0 4 1 28930 1 309 1 0 0 1 30 1 300 2 0 0 2 1 30231 1 296 1 0 0 1 31 1 304 1 0 0 1 1 30532 1 283 0 0 0 0 32 1 289 1 0 0 1 1 29033 1 244 0 0 0 0 33 1 265 0 0 0 1 26534 1 205 0 0 0 0 34 1 224 0 0 0 1 22535 1 154 0 0 0 0 35 1 180 0 0 0 1 18136 1 104 0 0 0 0 36 1 129 0 0 0 1 12937 1 044 0 0 0 0 37 1 075 0 0 0 1 07538 985 38 1 015 0 1 01539 929 39 958 0 95840 873 40 902 0 90241 811 41 843 0 84342 749 42 780 0 78043 697 43 723 0 72344 646 44 672 0 67245 602 45 624 0 62446 557 46 580 0 58047 516 47 537 0 53748 475 48 496 0 49649 444 49 459 0 459

Red Sea – Dead Sea Water Conveyance Study Program Draft Final Feasibility Study Report (12 147 RP 04), April 2011
Appendix G – Hydrology and Flood Studies Report
COYNE ET BELLIER in association with TRACTEBEL ENGINEERING and KEMA Appemdix G ‐ Page 114
t Yutum Group A Group B Group C A+B+C t Yutum-DS A-DS B-DS C-DS 470 km² Sum 50 413 50 429 0 42951 382 51 398 0 39852 350 52 366 0 36653 320 53 335 0 33554 289 54 305 0 30555 269 55 279 0 27956 248 56 258 0 25857 230 57 239 0 23958 212 58 221 0 22159 195 59 204 0 20460 179 60 187 0 18761 167 61 173 0 17362 156 62 161 0 16163 141 63 149 0 14964 127 64 134 0 13465 117 65 122 0 12266 107 66 112 0 11267 101 67 104 0 10468 94 68 98 0 9869 89 69 92 0 9270 84 70 87 0 8771 77 71 81 0 8172 70 72 74 0 7473 65 73 68 0 6874 60 74 63 0 6375 56 75 58 0 5876 52 76 54 0 5477 48 77 50 0 5078 44 78 46 0 4679 40 79 42 0 4280 37 80 38 0 3881 34 81 35 0 3582 31 82 33 0 3383 29 83 30 0 3084 27 84 28 0 2885 24 85 26 0 2686 22 86 23 0 2387 20 87 21 0 2188 18 88 19 0 1989 17 89 18 0 1890 15 90 16 0 1691 13 91 14 0 1492 12 92 13 0 1393 10 93 11 0 1194 9 94 10 0 1095 7 95 8 0 896 6 96 7 0 7 Qp 1 309 148 156 180 455 Qp 1 304 135 150 177 392 1 305 % 100 91 96 98 86
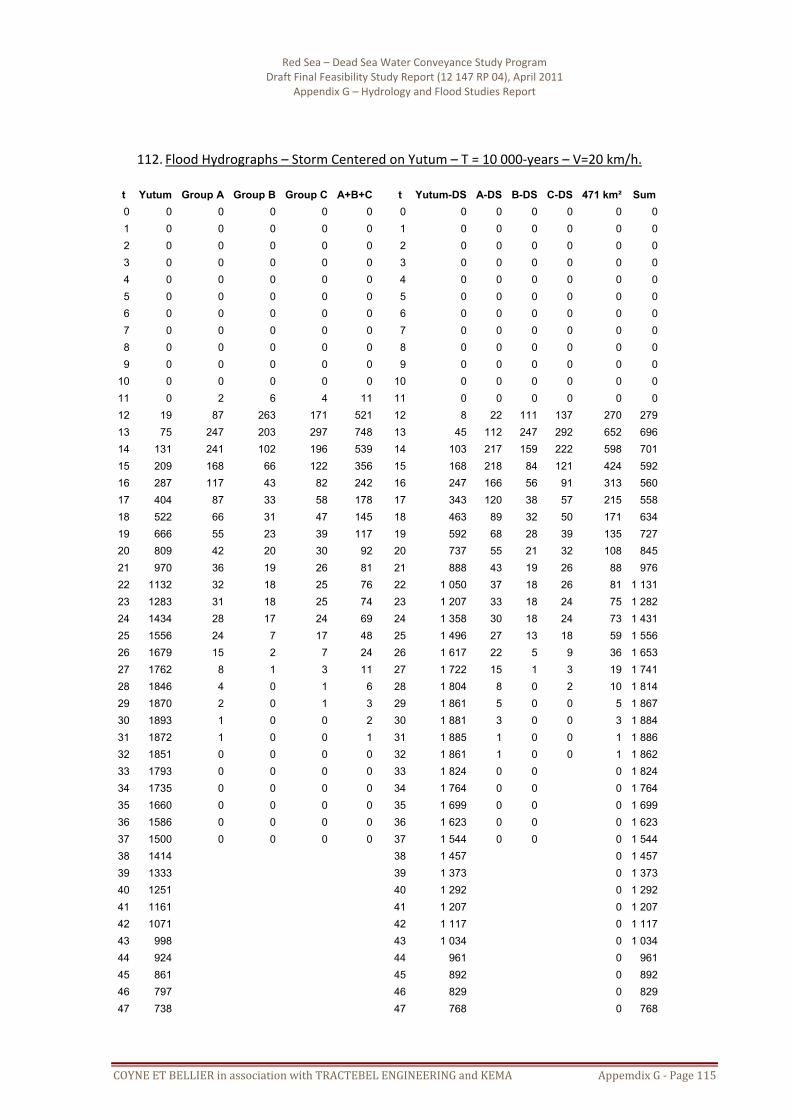
Red Sea – Dead Sea Water Conveyance Study Program Draft Final Feasibility Study Report (12 147 RP 04), April 2011
Appendix G – Hydrology and Flood Studies Report
COYNE ET BELLIER in association with TRACTEBEL ENGINEERING and KEMA Appemdix G ‐ Page 115
112. Flood Hydrographs – Storm Centered on Yutum – T = 10 000‐years – V=20 km/h.
t Yutum Group A Group B Group C A+B+C t Yutum-DS A-DS B-DS C-DS 471 km² Sum 0 0 0 0 0 0 0 0 0 0 0 0 01 0 0 0 0 0 1 0 0 0 0 0 02 0 0 0 0 0 2 0 0 0 0 0 03 0 0 0 0 0 3 0 0 0 0 0 04 0 0 0 0 0 4 0 0 0 0 0 05 0 0 0 0 0 5 0 0 0 0 0 06 0 0 0 0 0 6 0 0 0 0 0 07 0 0 0 0 0 7 0 0 0 0 0 08 0 0 0 0 0 8 0 0 0 0 0 09 0 0 0 0 0 9 0 0 0 0 0 0
10 0 0 0 0 0 10 0 0 0 0 0 011 0 2 6 4 11 11 0 0 0 0 0 012 19 87 263 171 521 12 8 22 111 137 270 27913 75 247 203 297 748 13 45 112 247 292 652 69614 131 241 102 196 539 14 103 217 159 222 598 70115 209 168 66 122 356 15 168 218 84 121 424 59216 287 117 43 82 242 16 247 166 56 91 313 56017 404 87 33 58 178 17 343 120 38 57 215 55818 522 66 31 47 145 18 463 89 32 50 171 63419 666 55 23 39 117 19 592 68 28 39 135 72720 809 42 20 30 92 20 737 55 21 32 108 84521 970 36 19 26 81 21 888 43 19 26 88 97622 1132 32 18 25 76 22 1 050 37 18 26 81 1 13123 1283 31 18 25 74 23 1 207 33 18 24 75 1 28224 1434 28 17 24 69 24 1 358 30 18 24 73 1 43125 1556 24 7 17 48 25 1 496 27 13 18 59 1 55626 1679 15 2 7 24 26 1 617 22 5 9 36 1 65327 1762 8 1 3 11 27 1 722 15 1 3 19 1 74128 1846 4 0 1 6 28 1 804 8 0 2 10 1 81429 1870 2 0 1 3 29 1 861 5 0 0 5 1 86730 1893 1 0 0 2 30 1 881 3 0 0 3 1 88431 1872 1 0 0 1 31 1 885 1 0 0 1 1 88632 1851 0 0 0 0 32 1 861 1 0 0 1 1 86233 1793 0 0 0 0 33 1 824 0 0 0 1 82434 1735 0 0 0 0 34 1 764 0 0 0 1 76435 1660 0 0 0 0 35 1 699 0 0 0 1 69936 1586 0 0 0 0 36 1 623 0 0 0 1 62337 1500 0 0 0 0 37 1 544 0 0 0 1 54438 1414 38 1 457 0 1 45739 1333 39 1 373 0 1 37340 1251 40 1 292 0 1 29241 1161 41 1 207 0 1 20742 1071 42 1 117 0 1 11743 998 43 1 034 0 1 03444 924 44 961 0 96145 861 45 892 0 89246 797 46 829 0 82947 738 47 768 0 768

Red Sea – Dead Sea Water Conveyance Study Program Draft Final Feasibility Study Report (12 147 RP 04), April 2011
Appendix G – Hydrology and Flood Studies Report
COYNE ET BELLIER in association with TRACTEBEL ENGINEERING and KEMA Appemdix G ‐ Page 116
t Yutum Group A Group B Group C A+B+C t Yutum-DS A-DS B-DS C-DS 471 km² Sum
48 679 48 709 0 70949 635 49 657 0 65750 591 50 614 0 61451 546 51 569 0 56952 501 52 524 0 52453 457 53 480 0 48054 414 54 436 0 43655 384 55 398 0 39856 354 56 369 0 36957 329 57 341 0 34158 303 58 316 0 31659 279 59 291 0 29160 255 60 267 0 26761 239 61 247 0 24762 223 62 231 0 23163 202 63 213 0 21364 182 64 192 0 19265 168 65 174 0 17466 153 66 161 0 16167 144 67 149 0 14968 135 68 140 0 14069 128 69 131 0 13170 120 70 124 0 12471 110 71 115 0 11572 100 72 105 0 10573 93 73 97 0 9774 87 74 90 0 9075 80 75 83 0 8376 74 76 77 0 7777 68 77 71 0 7178 63 78 66 0 6679 58 79 60 0 6080 52 80 55 0 5581 48 81 50 0 5082 45 82 47 0 4783 41 83 43 0 4384 38 84 40 0 4085 35 85 36 0 3686 32 86 34 0 3487 29 87 31 0 3188 26 88 28 0 2889 24 89 25 0 2590 21 90 23 0 2391 19 91 20 0 2092 17 92 18 0 1893 15 93 16 0 1694 13 94 14 0 1495 10 95 12 0 1296 8 96 9 0 9 Qp 1 893 247 263 297 748 Qp 1 885 218 247 292 652 1 886 % 99,6 88,2 94,2 98,3

Red Sea – Dead Sea Water Conveyance Study Program Draft Final Feasibility Study Report (12 147 RP 04), April 2011
Appendix G – Hydrology and Flood Studies Report
COYNE ET BELLIER in association with TRACTEBEL ENGINEERING and KEMA Appemdix G ‐ Page 117
113. Flood Hydrographs – Storm Centered on Yutum – PMF – V=20 km/h.
t Yutum Group A Group B Group C A+B+C t Yutum-DS A-DS B-DS C-DS 470 km² Sum 0 0 0 0 0 0 0 0 0 0 0 0 01 0 0 0 0 0 1 0 0 0 0 0 02 0 0 0 0 0 2 0 0 0 0 0 03 0 0 0 0 0 3 0 0 0 0 0 04 0 0 0 0 0 4 0 0 0 0 0 05 0 0 0 0 0 5 0 0 0 0 0 06 0 0 1 1 3 6 0 0 1 1 1 17 0 4 9 6 19 7 0 1 4 5 11 118 0 12 18 17 47 8 0 5 13 15 33 339 0 23 27 29 80 9 0 13 22 27 63 63
10 0 42 55 53 149 10 0 26 39 49 113 11311 0 82 110 106 297 11 0 48 78 97 223 22312 151 479 1 219 851 2 550 12 67 170 567 693 1 429 1 49613 378 1 150 863 1 331 3 344 13 260 575 1 112 1 330 3 017 3 27814 604 1 048 400 815 2 262 14 490 1 005 658 929 2 592 3 08215 912 691 240 476 1 406 15 752 953 319 475 1 747 2 49816 1 220 457 149 302 908 16 1 065 690 198 340 1 228 2 29317 1 667 330 112 205 647 17 1 433 476 131 200 807 2 24018 2 113 240 104 162 507 18 1 889 339 108 175 621 2 51019 2 643 195 76 130 401 19 2 371 250 93 129 471 2 84220 3 172 145 64 98 307 20 2 906 195 70 105 370 3 27621 3 747 124 60 86 270 21 3 454 151 62 84 296 3 75022 4 321 108 59 82 248 22 4 032 125 60 84 269 4 30123 4 846 102 59 80 240 23 4 584 110 59 79 247 4 83124 5 371 91 56 77 224 24 5 106 101 58 79 237 5 34325 5 775 76 24 55 155 25 5 578 89 43 59 191 5 76926 6 180 47 7 24 78 26 5 975 72 16 28 116 6 09127 6 438 25 2 10 37 27 6 316 47 5 10 62 6 37828 6 696 13 1 4 18 28 6 565 27 1 5 33 6 59829 6 739 8 0 2 10 29 6 729 15 0 1 17 6 74630 6 781 4 0 1 5 30 6 759 8 0 1 9 6 76831 6 672 2 0 0 3 31 6 736 5 0 0 5 6 74032 6 562 1 0 0 1 32 6 617 3 0 0 3 6 61933 6 332 1 0 0 1 33 6 455 1 0 1 6 45634 6 101 0 0 0 0 34 6 217 1 0 1 6 21835 5 821 0 0 0 0 35 5 965 0 0 0 5 96636 5 540 0 0 0 0 36 5 681 0 0 0 5 68237 5 226 0 0 0 0 37 5 386 0 0 0 5 38738 4 913 38 5 071 0 5 07139 4 621 39 4 767 0 4 76740 4 329 40 4 476 0 4 47641 4 015 41 4 175 0 4 17542 3 701 42 3 859 0 3 85943 3 445 43 3 571 0 3 57144 3 189 44 3 319 0 3 31945 2 971 45 3 079 0 3 07946 2 752 46 2 863 0 2 863

Red Sea – Dead Sea Water Conveyance Study Program Draft Final Feasibility Study Report (12 147 RP 04), April 2011
Appendix G – Hydrology and Flood Studies Report
COYNE ET BELLIER in association with TRACTEBEL ENGINEERING and KEMA Appemdix G ‐ Page 118
t Yutum Group A Group B Group C A+B+C t Yutum-DS A-DS B-DS C-DS 470 km² Sum
47 2 548 47 2 650 0 2 65048 2 344 48 2 447 0 2 44749 2 190 49 2 265 0 2 26550 2 036 50 2 114 0 2 11451 1 880 51 1 959 0 1 95952 1 724 52 1 803 0 1 80353 1 574 53 1 649 0 1 64954 1 424 54 1 500 0 1 50055 1 322 55 1 371 0 1 37156 1 220 56 1 272 0 1 27257 1 132 57 1 176 0 1 17658 1 044 58 1 088 0 1 08859 961 59 1 002 0 1 00260 879 60 920 0 92061 822 61 849 0 84962 765 62 794 0 79463 696 63 731 0 73164 626 64 661 0 66165 578 65 601 0 60166 531 66 555 0 55567 499 67 514 0 51468 468 68 484 0 48469 441 69 454 0 45470 415 70 428 0 42871 381 71 398 0 39872 347 72 364 0 36473 323 73 334 0 33474 299 74 311 0 31175 277 75 288 0 28876 255 76 266 0 26677 236 77 245 0 24578 216 78 226 0 22679 198 79 207 0 20780 180 80 189 0 18981 167 81 173 0 17382 154 82 160 0 16083 142 83 148 0 14884 130 84 136 0 13685 120 85 125 0 12586 110 86 115 0 11587 100 87 105 0 10588 90 88 95 0 9589 81 89 85 0 8590 73 90 77 0 7791 64 91 69 0 6992 56 92 61 0 6193 49 93 53 0 5394 41 94 45 0 4595 34 95 38 0 3896 27 96 31 0 31
% 100 87 91 100 90

Red Sea – Dead Sea Water Conveyance Study Program Draft Final Feasibility Study Report (12 147 RP 04), April 2011
Appendix G – Hydrology and Flood Studies Report
COYNE ET BELLIER in association with TRACTEBEL ENGINEERING and KEMA Appemdix G ‐ Page 119
114. Flood Hydrographs – Storm Centered on Yutum – T = 100‐years – V=10 km/h.
t Yutum Group A Group B Group C A+B+C t Yutum-DS A-DS B-DS C-DS 470 km² Sum0 0 0 0 0 0 0 0 0 0 0 0 01 0 0 0 0 0 1 0 0 0 0 0 02 0 0 0 0 0 2 0 0 0 0 0 03 0 0 0 0 0 3 0 0 0 0 0 04 0 0 0 0 0 4 0 0 0 0 0 05 0 0 0 0 0 5 0 0 0 0 0 06 0 0 0 0 0 6 0 0 0 0 0 07 0 0 0 0 0 7 0 0 0 0 0 08 0 0 0 0 0 8 0 0 0 0 0 09 0 0 0 0 0 9 0 0 0 0 0 0
10 0 0 0 0 0 10 0 0 0 0 0 011 0 0 0 0 0 11 0 0 0 0 0 012 7 22 68 44 133 12 2 1 14 27 42 4413 30 66 60 82 208 13 11 14 51 74 139 15114 52 70 34 60 164 14 31 40 52 71 163 19415 83 53 24 41 117 15 54 53 37 43 134 18816 115 39 16 29 85 16 84 52 26 32 111 19517 162 30 13 22 65 17 119 45 18 23 87 20618 210 24 12 18 55 18 163 38 14 19 71 23419 268 21 9 15 45 19 213 31 12 16 59 27220 326 16 8 12 37 20 269 26 10 13 48 31721 392 14 8 11 33 21 328 21 8 11 40 36822 458 13 8 10 31 22 393 18 8 10 36 42823 520 12 8 10 30 23 457 15 8 10 33 49024 583 12 7 10 29 24 520 14 7 10 31 55125 634 10 3 7 20 25 580 13 6 8 27 60726 685 6 1 3 10 26 633 11 4 4 19 65227 721 3 0 1 5 27 681 8 2 2 11 69328 757 2 0 1 2 28 720 6 1 1 7 72729 768 1 0 0 1 29 751 4 0 0 4 75530 780 1 0 0 1 30 767 2 0 0 3 76931 773 0 0 0 0 31 775 1 0 0 2 77732 766 0 0 0 0 32 772 1 0 0 1 77333 744 0 0 0 0 33 762 1 0 0 1 76334 722 0 0 0 0 34 743 0 0 0 0 74335 692 0 0 0 0 35 720 0 0 0 0 72036 663 0 0 0 0 36 692 0 0 0 0 69237 628 0 0 0 0 37 661 0 0 0 0 66238 593 38 628 0 62839 560 39 594 0 59440 526 40 560 0 56041 489 41 526 0 52642 452 42 489 0 48943 421 43 453 0 45344 390 44 421 0 42145 363 45 391 0 39146 337 46 364 0 36447 312 47 337 0 33748 287 48 312 0 31249 268 49 289 0 28950 249 50 269 0 26951 231 51 250 0 25052 212 52 231 0 23153 193 53 212 0 21254 175 54 193 0 193

Red Sea – Dead Sea Water Conveyance Study Program Draft Final Feasibility Study Report (12 147 RP 04), April 2011
Appendix G – Hydrology and Flood Studies Report
COYNE ET BELLIER in association with TRACTEBEL ENGINEERING and KEMA Appemdix G ‐ Page 120
t Yutum Group A Group B Group C A+B+C t Yutum-DS A-DS B-DS C-DS 470 km² Sum
55 162 55 176 0 17656 150 56 163 0 16357 139 57 150 0 15058 128 58 139 0 13959 118 59 128 0 12860 108 60 118 0 11861 101 61 109 0 10962 94 62 101 0 10163 85 63 94 0 9464 77 64 85 0 8565 71 65 78 0 7866 65 66 71 0 7167 61 67 65 0 6568 57 68 61 0 6169 54 69 57 0 5770 51 70 54 0 5471 47 71 50 0 5072 42 72 46 0 4673 39 73 43 0 4374 36 74 39 0 3975 34 75 37 0 3776 31 76 34 0 3477 29 77 31 0 3178 27 78 29 0 2979 24 79 27 0 2780 22 80 24 0 2481 20 81 22 0 2282 19 82 21 0 2183 17 83 19 0 1984 16 84 17 0 1785 15 85 16 0 1686 14 86 15 0 1587 12 87 14 0 1488 11 88 12 0 1289 10 89 11 0 1190 9 90 10 0 1091 8 91 9 0 992 7 92 8 0 893 6 93 7 0 794 5 94 6 0 695 5 95 5 0 596 4 96 5 0 5 Qp 780 70 68 82 208 Qp 775 53 52 74 163 777 % 99 77 77 91 79

Red Sea – Dead Sea Water Conveyance Study Program Draft Final Feasibility Study Report (12 147 RP 04), April 2011
Appendix G – Hydrology and Flood Studies Report
COYNE ET BELLIER in association with TRACTEBEL ENGINEERING and KEMA Appemdix G ‐ Page 121
115. Flood Hydrographs – Storm Centered on Yutum – T = 1 000‐years – V=10 km/h.
t Yutum Group A Group B Group C A+B+C t Yutum-DS A-DS B-DS C-DS 470 km² Sum 0 0 0 0 0 0 0 0 0 0 0 0 01 0 0 0 0 0 1 0 0 0 0 0 02 0 0 0 0 0 2 0 0 0 0 0 03 0 0 0 0 0 3 0 0 0 0 0 04 0 0 0 0 0 4 0 0 0 0 0 05 0 0 0 0 0 5 0 0 0 0 0 06 0 0 0 0 0 6 0 0 0 0 0 07 0 0 0 0 0 7 0 0 0 0 0 08 0 0 0 0 0 8 0 0 0 0 0 09 0 0 0 0 0 9 0 0 0 0 0 0
10 0 0 0 0 0 10 0 0 0 0 0 011 0 0 0 0 1 11 0 0 0 0 0 012 13 50 156 100 306 12 3 3 31 63 98 10113 51 148 127 180 455 13 19 32 115 166 313 33214 89 148 66 123 338 14 53 89 111 150 351 40315 143 106 44 79 229 15 93 115 75 84 274 36716 196 76 29 54 159 16 143 109 50 61 220 36417 277 57 23 39 119 17 202 92 34 42 167 37018 357 44 22 32 98 18 278 74 26 34 133 41219 456 37 16 27 80 19 362 59 22 28 109 47120 554 29 14 21 63 20 457 48 17 22 87 54421 666 25 13 18 56 21 558 38 14 19 72 62922 777 22 13 18 53 22 666 32 13 18 63 72923 881 21 13 17 51 23 775 27 13 17 57 83324 986 20 12 17 49 24 881 24 13 17 54 93525 1 071 17 5 12 34 25 982 22 11 14 46 1 02826 1 156 10 2 5 17 26 1 070 19 6 7 32 1 10227 1 215 5 0 2 8 27 1 150 14 3 3 19 1 16928 1 274 3 0 1 4 28 1 214 10 1 1 12 1 22629 1 292 2 0 0 2 29 1 264 6 0 0 7 1 27130 1 309 1 0 0 1 30 1 289 4 0 0 4 1 29431 1 296 1 0 0 1 31 1 302 2 0 0 3 1 30432 1 283 0 0 0 0 32 1 294 2 0 0 2 1 29633 1 244 0 0 0 0 33 1 276 1 0 0 1 1 27734 1 205 0 0 0 0 34 1 242 1 0 0 1 1 24335 1 154 0 0 0 0 35 1 202 0 0 0 0 1 20236 1 104 0 0 0 0 36 1 154 0 0 0 0 1 15437 1 044 0 0 0 0 37 1 101 0 0 0 0 1 10238 985 38 1 044 0 1 04439 929 39 986 0 98640 873 40 929 0 92941 811 41 872 0 87242 749 42 811 0 81143 697 43 751 0 75144 646 44 698 0 69845 602 45 648 0 64846 557 46 602 0 60247 516 47 558 0 55848 475 48 516 0 51649 444 49 477 0 47750 413 50 445 0 44551 382 51 413 0 41352 350 52 382 0 38253 320 53 351 0 35154 289 54 320 0 32055 269 55 292 0 292

Red Sea – Dead Sea Water Conveyance Study Program Draft Final Feasibility Study Report (12 147 RP 04), April 2011
Appendix G – Hydrology and Flood Studies Report
COYNE ET BELLIER in association with TRACTEBEL ENGINEERING and KEMA Appemdix G ‐ Page 122
t Yutum Group A Group B Group C A+B+C t Yutum-DS A-DS B-DS C-DS 470 km² Sum 56 248 56 269 0 26957 230 57 249 0 24958 212 58 230 0 23059 195 59 212 0 21260 179 60 195 0 19561 167 61 180 0 18062 156 62 167 0 16763 141 63 155 0 15564 127 64 141 0 14165 117 65 128 0 12866 107 66 117 0 11767 101 67 108 0 10868 94 68 101 0 10169 89 69 95 0 9570 84 70 89 0 8971 77 71 84 0 8472 70 72 77 0 7773 65 73 71 0 7174 60 74 65 0 6575 56 75 61 0 6176 52 76 56 0 5677 48 77 52 0 5278 44 78 48 0 4879 40 79 44 0 4480 37 80 40 0 4081 34 81 37 0 3782 31 82 34 0 3483 29 83 31 0 3184 27 84 29 0 2985 24 85 27 0 2786 22 86 24 0 2487 20 87 22 0 2288 18 88 20 0 2089 17 89 18 0 1890 15 90 17 0 1791 13 91 15 0 1592 12 92 13 0 1393 10 93 12 0 1294 9 94 10 0 1095 7 95 9 0 996 6 96 7 0 7 Qp 1 309 148 156 180 455 Qp 1 302 115 115 166 351 1 304 % 99 78 74 92 77

Red Sea – Dead Sea Water Conveyance Study Program Draft Final Feasibility Study Report (12 147 RP 04), April 2011
Appendix G – Hydrology and Flood Studies Report
COYNE ET BELLIER in association with TRACTEBEL ENGINEERING and KEMA Appemdix G ‐ Page 123
116. Flood Hydrographs – Storm Centered on Yutum – T = 10 000‐years – V=10 km/h.
t Yutum Group A Group B Group C A+B+C t Yutum-DS A-DS B-DS C-DS 470 km² Sum 0 0 0 0 0 0 0 0 0 0 0 0 01 0 0 0 0 0 1 0 0 0 0 0 02 0 0 0 0 0 2 0 0 0 0 0 03 0 0 0 0 0 3 0 0 0 0 0 04 0 0 0 0 0 4 0 0 0 0 0 05 0 0 0 0 0 5 0 0 0 0 0 06 0 0 0 0 0 6 0 0 0 0 0 07 0 0 0 0 0 7 0 0 0 0 0 08 0 0 0 0 0 8 0 0 0 0 0 09 0 0 0 0 0 9 0 0 0 0 0 0
10 0 0 0 0 0 10 0 0 0 0 0 011 0 2 6 4 11 11 0 0 0 0 0 012 19 87 263 171 521 12 4 6 55 111 172 17713 75 247 203 297 748 13 28 55 193 275 524 55214 131 241 102 196 539 14 77 149 180 242 572 64915 209 168 66 122 356 15 137 189 117 130 437 57316 287 117 43 82 242 16 210 176 76 93 345 55517 404 87 33 58 178 17 296 145 50 62 257 55318 522 66 31 47 145 18 407 115 38 50 203 60919 666 55 23 39 117 19 529 91 31 41 163 69220 809 42 20 30 92 20 667 72 25 32 129 79721 970 36 19 26 81 21 814 57 21 27 105 91822 1 132 32 18 25 76 22 971 47 19 26 91 1 06323 1 283 31 18 25 74 23 1 129 39 18 25 83 1 21224 1 434 28 17 24 69 24 1 282 35 18 24 77 1 36025 1 556 24 7 17 48 25 1 427 31 16 20 66 1 49426 1 679 15 2 7 24 26 1 555 27 9 10 46 1 60127 1 762 8 1 3 11 27 1 669 20 4 4 28 1 69728 1 846 4 0 1 6 28 1 760 14 1 2 17 1 77829 1 870 2 0 1 3 29 1 832 9 1 1 10 1 84230 1 893 1 0 0 2 30 1 866 6 0 0 6 1 87331 1 872 1 0 0 1 31 1 882 4 0 0 4 1 88632 1 851 0 0 0 0 32 1 869 2 0 0 2 1 87133 1 793 0 0 0 0 33 1 842 1 0 1 1 84334 1 735 0 0 0 0 34 1 791 1 0 1 1 79135 1 660 0 0 0 0 35 1 730 0 0 0 1 73136 1 586 0 0 0 0 36 1 659 0 0 0 1 65937 1 500 0 0 0 0 37 1 583 0 0 0 1 58338 1 414 38 1 499 0 1 49939 1 333 39 1 415 0 1 41540 1 251 40 1 333 0 1 33341 1 161 41 1 249 0 1 24942 1 071 42 1 161 0 1 16143 998 43 1 075 0 1 07544 924 44 999 0 99945 861 45 927 0 92746 797 46 861 0 86147 738 47 799 0 79948 679 48 739 0 73949 635 49 683 0 68350 591 50 636 0 63651 546 51 591 0 59152 501 52 546 0 546
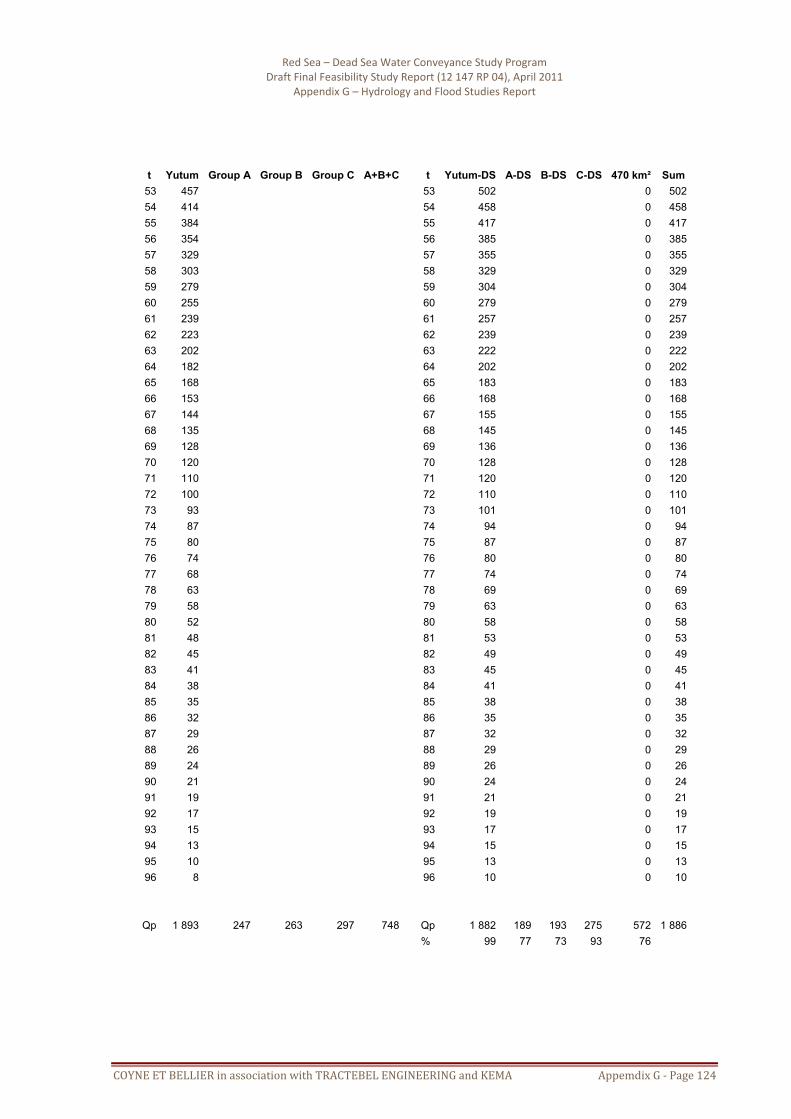
Red Sea – Dead Sea Water Conveyance Study Program Draft Final Feasibility Study Report (12 147 RP 04), April 2011
Appendix G – Hydrology and Flood Studies Report
COYNE ET BELLIER in association with TRACTEBEL ENGINEERING and KEMA Appemdix G ‐ Page 124
t Yutum Group A Group B Group C A+B+C t Yutum-DS A-DS B-DS C-DS 470 km² Sum
53 457 53 502 0 50254 414 54 458 0 45855 384 55 417 0 41756 354 56 385 0 38557 329 57 355 0 35558 303 58 329 0 32959 279 59 304 0 30460 255 60 279 0 27961 239 61 257 0 25762 223 62 239 0 23963 202 63 222 0 22264 182 64 202 0 20265 168 65 183 0 18366 153 66 168 0 16867 144 67 155 0 15568 135 68 145 0 14569 128 69 136 0 13670 120 70 128 0 12871 110 71 120 0 12072 100 72 110 0 11073 93 73 101 0 10174 87 74 94 0 9475 80 75 87 0 8776 74 76 80 0 8077 68 77 74 0 7478 63 78 69 0 6979 58 79 63 0 6380 52 80 58 0 5881 48 81 53 0 5382 45 82 49 0 4983 41 83 45 0 4584 38 84 41 0 4185 35 85 38 0 3886 32 86 35 0 3587 29 87 32 0 3288 26 88 29 0 2989 24 89 26 0 2690 21 90 24 0 2491 19 91 21 0 2192 17 92 19 0 1993 15 93 17 0 1794 13 94 15 0 1595 10 95 13 0 1396 8 96 10 0 10 Qp 1 893 247 263 297 748 Qp 1 882 189 193 275 572 1 886 % 99 77 73 93 76

Red Sea – Dead Sea Water Conveyance Study Program Draft Final Feasibility Study Report (12 147 RP 04), April 2011
Appendix G – Hydrology and Flood Studies Report
COYNE ET BELLIER in association with TRACTEBEL ENGINEERING and KEMA Appemdix G ‐ Page 125
117. Flood Hydrographs – Storm Centered on Yutum – PMF – V=10 km/h.
t Yutum Group A Group B Group C A+B+C t Yutum-DS A-DS B-DS C-DS 470 km² Sum 0 0 0 0 0 0 0 0 0 0 0 0 0 1 0 0 0 0 0 1 0 0 0 0 0 0 2 0 0 0 0 0 2 0 0 0 0 0 0 3 0 0 0 0 0 3 0 0 0 0 0 0 4 0 0 0 0 0 4 0 0 0 0 0 0 5 0 0 0 0 0 5 0 0 0 0 0 0 6 0 0 1 1 3 6 0 0 0 0 0 0 7 0 4 9 6 19 7 0 0 2 5 8 8 8 0 12 18 17 47 8 0 3 9 14 25 25 9 0 23 27 29 80 9 0 8 17 26 51 51
10 0 42 55 53 149 10 0 17 30 45 92 92 11 0 82 110 106 297 11 0 31 59 89 179 179 12 151 479 1 219 851 2 550 12 35 80 317 582 979 1 014 13 378 1 150 863 1 331 3 344 13 177 316 896 1 264 2 475 2 651 14 604 1 048 400 815 2 262 14 383 719 779 1 033 2 531 2 915 15 912 691 240 476 1 406 15 624 859 474 511 1 844 2 468 16 1 220 457 149 302 908 16 916 762 287 351 1 401 2 317 17 1 667 330 112 205 647 17 1 253 605 180 220 1 006 2 259 18 2 113 240 104 162 507 18 1 674 465 130 172 766 2 441 19 2 643 195 76 130 401 19 2 134 352 106 138 596 2 730 20 3 172 145 64 98 307 20 2 648 272 82 106 461 3 108 21 3 747 124 60 86 270 21 3 184 209 68 87 364 3 548 22 4 321 108 59 82 248 22 3 749 166 62 83 311 4 060 23 4 846 102 59 80 240 23 4 310 137 60 80 277 4 587 24 5 371 91 56 77 224 24 4 844 119 58 78 256 5 099 25 5 775 76 24 55 155 25 5 343 104 50 63 217 5 560 26 6 180 47 7 24 78 26 5 769 89 28 32 149 5 918 27 6 438 25 2 10 37 27 6 145 67 12 12 91 6 235 28 6 696 13 1 4 18 28 6 430 46 5 5 56 6 486 29 6 739 8 0 2 10 29 6 645 30 2 2 33 6 678 30 6 781 4 0 1 5 30 6 727 19 1 1 20 6 747 31 6 672 2 0 0 3 31 6 744 11 0 0 12 6 755 32 6 562 1 0 0 1 32 6 663 7 0 0 7 6 670 33 6 332 1 0 0 1 33 6 532 4 0 0 4 6 537 34 6 101 0 0 0 0 34 6 325 3 0 0 3 6 327 35 5 821 0 0 0 0 35 6 088 1 0 0 1 6 090 36 5 540 0 0 0 0 36 5 818 1 0 0 1 5 819 37 5 226 0 0 0 0 37 5 532 0 0 0 0 5 532 38 4 913 38 5 224 0 5 224 39 4 621 39 4 917 0 4 917 40 4 329 40 4 622 0 4 622 41 4 015 41 4 324 0 4 324 42 3 701 42 4 014 0 4 014 43 3 445 43 3 714 0 3 714 44 3 189 44 3 448 0 3 448 45 2 971 45 3 198 0 3 198 46 2 752 46 2 973 0 2 973 47 2 548 47 2 756 0 2 756 48 2 344 48 2 549 0 2 549 49 2 190 49 2 356 0 2 356 50 2 036 50 2 193 0 2 193 51 1 880 51 2 036 0 2 036 52 1 724 52 1 880 0 1 880 53 1 574 53 1 725 0 1 725 54 1 424 54 1 574 0 1 574 55 1 322 55 1 435 0 1 435 56 1 220 56 1 325 0 1 325 57 1 132 57 1 224 0 1 224

Red Sea – Dead Sea Water Conveyance Study Program Draft Final Feasibility Study Report (12 147 RP 04), April 2011
Appendix G – Hydrology and Flood Studies Report
COYNE ET BELLIER in association with TRACTEBEL ENGINEERING and KEMA Appemdix G ‐ Page 126
t Yutum Group A Group B Group C A+B+C t Yutum-DS A-DS B-DS C-DS 470 km² Sum 58 1 044 58 1 133 0 1 133 59 961 59 1 045 0 1 045 60 879 60 961 0 961 61 822 61 885 0 885 62 765 62 823 0 823 63 696 63 763 0 763 64 626 64 695 0 695 65 578 65 631 0 631 66 531 66 580 0 580 67 499 67 535 0 535 68 468 68 500 0 500 69 441 69 469 0 469 70 415 70 442 0 442 71 381 71 413 0 413 72 347 72 380 0 380 73 323 73 349 0 349 74 299 74 323 0 323 75 277 75 299 0 299 76 255 76 277 0 277 77 236 77 256 0 256 78 216 78 236 0 236 79 198 79 217 0 217 80 180 80 198 0 198 81 167 81 181 0 181 82 154 82 167 0 167 83 142 83 154 0 154 84 130 84 142 0 142 85 120 85 131 0 131 86 110 86 120 0 120 87 100 87 110 0 110 88 90 88 100 0 100 89 81 89 90 0 90 90 73 90 81 0 81 91 64 91 73 0 73 92 56 92 65 0 65 93 49 93 57 0 57 94 41 94 49 0 49 95 34 95 42 0 42 96 27 96 34 0 34
Qp 6 781 1 150 1 219 1 331 3 344 Qp 6 744 859 896 1 264 2 531 6 755 % 99 75 73 95 76

Red Sea – Dead Sea Water Conveyance Study Program Draft Final Feasibility Study Report (12 147 RP 04), April 2011
Appendix G – Hydrology and Flood Studies Report
COYNE ET BELLIER in association with TRACTEBEL ENGINEERING and KEMA Appemdix G ‐ Page 127
118. Flood Hydrographs – Storm Centered on Arava – T = 100‐years – V=20 km/h.
t Yutum Group A Group B Group C A+B+C t Yutum-DS A-DS B-DS C-DS 470 km² Sum 0 0 0 0 0 0 0 0 0 0 0 0 01 0 0 0 0 0 1 0 0 0 0 0 02 0 0 0 0 0 2 0 0 0 0 0 03 0 0 0 0 0 3 0 0 0 0 0 04 0 0 0 0 0 4 0 0 0 0 0 05 0 0 0 0 0 5 0 0 0 0 0 06 0 0 0 0 0 6 0 0 0 0 0 07 0 0 0 0 0 7 0 0 0 0 0 08 0 0 0 0 0 8 0 0 0 0 0 09 0 0 0 0 0 9 0 0 0 0 0 0
10 0 0 0 0 0 10 0 0 0 0 0 011 0 0 1 1 2 11 0 0 0 0 0 012 7 59 183 118 360 12 3 14 76 93 183 18613 29 173 146 210 530 13 17 77 175 207 458 47514 50 172 76 142 390 14 39 153 116 160 428 46715 80 122 50 90 262 15 64 156 63 90 309 37316 110 86 33 62 181 16 95 121 42 68 231 32617 156 65 26 44 135 17 132 88 29 44 162 29418 202 50 24 36 111 18 179 66 25 38 129 30819 257 42 18 30 90 19 229 51 22 30 103 33220 313 33 15 23 71 20 285 42 17 25 83 36821 376 28 14 21 63 21 344 33 15 20 68 41222 440 25 14 20 59 22 408 28 14 20 63 47023 500 24 14 19 57 23 469 25 14 19 59 52824 559 22 14 19 54 24 529 24 14 19 57 58625 608 18 6 13 38 25 584 21 10 14 46 63126 657 11 2 6 19 26 633 17 4 7 28 66127 692 6 1 2 9 27 675 11 1 3 15 69028 726 3 0 1 4 28 709 6 0 1 8 71729 737 2 0 0 2 29 733 4 0 0 4 73730 748 1 0 0 1 30 743 2 0 0 2 74531 742 1 0 0 1 31 746 1 0 0 1 74732 735 0 0 0 0 32 739 1 0 0 1 73933 714 0 0 0 0 33 726 0 0 0 72634 693 0 0 0 0 34 704 0 0 0 70435 665 0 0 0 0 35 679 0 0 0 67936 636 0 0 0 0 36 651 0 0 0 65137 603 0 0 0 0 37 620 0 0 0 62038 570 38 586 0 58639 537 39 554 0 55440 505 40 522 0 52241 470 41 488 0 48842 434 42 452 0 45243 404 43 419 0 41944 375 44 390 0 39045 349 45 362 0 36246 323 46 336 0 33647 299 47 311 0 31148 276 48 288 0 28849 258 49 266 0 26650 239 50 249 0 249

Red Sea – Dead Sea Water Conveyance Study Program Draft Final Feasibility Study Report (12 147 RP 04), April 2011
Appendix G – Hydrology and Flood Studies Report
COYNE ET BELLIER in association with TRACTEBEL ENGINEERING and KEMA Appemdix G ‐ Page 128
t Yutum Group A Group B Group C A+B+C t Yutum-DS A-DS B-DS C-DS 470 km² Sum 51 221 51 231 0 23152 203 52 212 0 21253 186 53 194 0 19454 168 54 177 0 17755 156 55 162 0 16256 144 56 150 0 15057 133 57 138 0 13858 123 58 128 0 12859 113 59 118 0 11860 104 60 109 0 10961 97 61 100 0 10062 90 62 94 0 9463 82 63 86 0 8664 74 64 78 0 7865 68 65 71 0 7166 62 66 65 0 6567 59 67 60 0 6068 55 68 57 0 5769 52 69 53 0 5370 49 70 50 0 5071 45 71 47 0 4772 41 72 43 0 4373 38 73 39 0 3974 35 74 36 0 3675 32 75 34 0 3476 30 76 31 0 3177 28 77 29 0 2978 26 78 27 0 2779 23 79 24 0 2480 21 80 22 0 2281 20 81 20 0 2082 18 82 19 0 1983 17 83 17 0 1784 15 84 16 0 1685 14 85 15 0 1586 13 86 14 0 1487 12 87 12 0 1288 11 88 11 0 1189 10 89 10 0 1090 9 90 9 0 991 8 91 8 0 892 7 92 7 0 793 6 93 6 0 694 5 94 6 0 695 4 95 5 0 596 3 96 4 0 4
Qp 748 173 183 210 530 Qp 746 156 175 207 458 747 % 100 90 95 98 86

Red Sea – Dead Sea Water Conveyance Study Program Draft Final Feasibility Study Report (12 147 RP 04), April 2011
Appendix G – Hydrology and Flood Studies Report
COYNE ET BELLIER in association with TRACTEBEL ENGINEERING and KEMA Appemdix G ‐ Page 129
119. Flood Hydrographs – Storm Centered on Arava – T = 1 000‐years – V=20 km/h.
t Yutum Group A Group B Group C A+B+C T Yutum-DS A-DS B-DS C-DS 470 km² Sum 0 0 0 0 0 0 0 0 0 0 0 0 0 1 0 0 0 0 0 1 0 0 0 0 0 0 2 0 0 0 0 0 2 0 0 0 0 0 0 3 0 0 0 0 0 3 0 0 0 0 0 0 4 0 0 0 0 0 4 0 0 0 0 0 0 5 0 0 0 0 0 5 0 0 0 0 0 0 6 0 0 0 0 0 6 0 0 0 0 0 0 7 0 0 0 0 0 7 0 0 0 0 0 0 8 0 0 0 0 0 8 0 0 0 0 0 0 9 0 0 0 0 0 9 0 0 0 0 0 0
10 0 1 2 1 4 10 0 0 0 0 0 0 11 0 5 12 9 27 11 0 0 0 0 0 0 12 12 120 351 232 703 12 5 32 152 189 373 378 13 49 330 266 393 989 13 29 152 328 386 865 895 14 86 316 131 255 702 14 67 289 207 290 786 853 15 137 217 83 156 457 15 110 287 107 155 548 659 16 188 150 54 104 307 16 162 216 70 116 401 564 17 266 111 41 73 225 17 225 154 48 71 273 498 18 343 83 39 59 181 18 304 113 40 63 216 520 19 438 69 29 48 146 19 389 86 35 48 169 558 20 532 53 24 37 114 20 485 69 26 39 135 619 21 639 45 23 33 100 21 584 54 23 32 109 694 22 746 40 22 31 93 22 692 46 23 32 100 792 23 846 38 22 30 91 23 796 41 22 30 93 889 24 947 34 21 30 85 24 896 38 22 30 90 986 25 1 028 29 9 21 59 25 988 34 16 23 73 1 061 26 1 110 18 3 9 30 26 1 069 27 6 11 44 1 113 27 1 167 9 1 4 14 27 1 139 18 2 4 24 1 163 28 1 223 5 0 2 7 28 1 195 10 1 2 13 1 207 29 1 240 3 0 1 4 29 1 234 6 0 1 6 1 240 30 1 257 2 0 0 2 30 1 248 3 0 0 4 1 252 31 1 244 1 0 0 1 31 1 252 2 0 0 2 1 254 32 1 231 1 0 0 1 32 1 238 1 0 0 1 1 239 33 1 194 0 0 0 0 33 1 214 1 0 1 1 215 34 1 157 0 0 0 0 34 1 175 0 0 0 1 176 35 1 108 0 0 0 0 35 1 133 0 0 0 1 133 36 1 059 0 0 0 0 36 1 084 0 0 0 1 084 37 1 003 0 0 0 0 37 1 032 0 0 0 1 032 38 946 38 975 0 975 39 892 39 919 0 919 40 838 40 865 0 865 41 778 41 809 0 809 42 719 42 749 0 749 43 669 43 694 0 694 44 620 44 645 0 645 45 578 45 599 0 599 46 535 46 556 0 556 47 495 47 515 0 515 48 456 48 476 0 476 49 426 49 441 0 441 50 397 50 412 0 412 51 366 51 382 0 382 52 336 52 352 0 352 53 307 53 322 0 322 54 278 54 293 0 293 55 258 55 267 0 267 56 238 56 248 0 248 57 221 57 229 0 229

Red Sea – Dead Sea Water Conveyance Study Program Draft Final Feasibility Study Report (12 147 RP 04), April 2011
Appendix G – Hydrology and Flood Studies Report
COYNE ET BELLIER in association with TRACTEBEL ENGINEERING and KEMA Appemdix G ‐ Page 130
t Yutum Group A Group B Group C A+B+C T Yutum-DS A-DS B-DS C-DS 470 km² Sum 58 203 58 212 0 212 59 187 59 195 0 195 60 171 60 180 0 180 61 160 61 166 0 166 62 149 62 155 0 155 63 136 63 143 0 143 64 122 64 129 0 129 65 113 65 117 0 117 66 103 66 108 0 108 67 97 67 100 0 100 68 91 68 94 0 94 69 86 69 88 0 88 70 81 70 83 0 83 71 74 71 77 0 77 72 67 72 71 0 71 73 63 73 65 0 65 74 58 74 60 0 60 75 54 75 56 0 56 76 50 76 52 0 52 77 46 77 48 0 48 78 42 78 44 0 44 79 39 79 40 0 40 80 35 80 37 0 37 81 33 81 34 0 34 82 30 82 31 0 31 83 28 83 29 0 29 84 25 84 27 0 27 85 23 85 24 0 24 86 21 86 23 0 23 87 20 87 21 0 21 88 18 88 19 0 19 89 16 89 17 0 17 90 14 90 15 0 15 91 13 91 14 0 14 92 11 92 12 0 12 93 10 93 11 0 11 94 8 94 9 0 9 95 7 95 8 0 8 96 6 96 6 0 6
Qp 1 257 330 351 393 989 Qp 1 252 289 328 386 865 1 254 % 100 88 93 98 88

Red Sea – Dead Sea Water Conveyance Study Program Draft Final Feasibility Study Report (12 147 RP 04), April 2011
Appendix G – Hydrology and Flood Studies Report
COYNE ET BELLIER in association with TRACTEBEL ENGINEERING and KEMA Appemdix G ‐ Page 131
120. Flood Hydrographs – Storm Centered on Arava – T = 10 000‐years – V=20 km/h.
t Yutum Group A Group B Group C A+B+C t Yutum-DS A-DS B-DS C-DS 470 km² Sum 0 0 0 0 0 0 0 0 0 0 0 0 01 0 0 0 0 0 1 0 0 0 0 0 02 0 0 0 0 0 2 0 0 0 0 0 03 0 0 0 0 0 3 0 0 0 0 0 04 0 0 0 0 0 4 0 0 0 0 0 05 0 0 0 0 0 5 0 0 0 0 0 06 0 0 0 0 0 6 0 0 0 0 0 07 0 0 0 0 0 7 0 0 0 0 0 08 0 0 0 0 0 8 0 0 0 0 0 09 0 1 2 2 5 9 0 0 1 1 2 2
10 0 5 10 8 23 10 0 2 6 7 14 1411 0 17 30 25 72 11 0 7 18 22 48 4812 18 192 535 361 1 087 12 8 57 237 289 583 59113 72 502 394 593 1 489 13 43 238 495 589 1 322 1 36514 126 472 190 376 1 038 14 99 440 304 426 1 170 1 26915 200 319 118 226 663 15 162 429 154 226 808 96916 275 217 75 147 439 16 238 318 98 165 580 81817 388 159 57 102 318 17 329 224 66 100 391 72018 501 118 53 82 253 18 445 163 55 88 305 75019 639 97 39 66 203 19 568 122 48 66 236 80420 777 73 33 51 157 20 707 97 36 54 187 89421 931 63 31 45 138 21 852 76 32 44 151 1 00422 1 086 55 31 42 128 22 1 008 63 31 44 138 1 14623 1 232 52 31 42 124 23 1 159 56 31 41 128 1 28624 1 377 47 29 40 117 24 1 304 52 30 41 123 1 42625 1 494 40 12 29 81 25 1 437 46 22 31 99 1 53626 1 611 24 4 12 41 26 1 552 37 8 15 60 1 61227 1 692 13 1 5 19 27 1 653 24 2 5 32 1 68628 1 773 7 0 2 9 28 1 732 14 1 3 17 1 74929 1 795 4 0 1 5 29 1 787 8 0 1 9 1 79630 1 817 2 0 0 3 30 1 806 4 0 1 5 1 81131 1 797 1 0 0 1 31 1 810 2 0 0 2 1 81232 1 777 1 0 0 1 32 1 787 1 0 0 1 1 78833 1 721 0 0 0 0 33 1 751 1 0 1 1 75234 1 665 0 0 0 0 34 1 693 0 0 0 1 69435 1 594 0 0 0 0 35 1 631 0 0 0 1 63136 1 522 0 0 0 0 36 1 558 0 0 0 1 55837 1 440 0 0 0 0 37 1 482 0 0 0 1 48238 1 357 38 1 399 0 1 39939 1 279 39 1 318 0 1 31840 1 201 40 1 241 0 1 24141 1 115 41 1 159 0 1 15942 1 029 42 1 072 0 1 07243 958 43 993 0 99344 887 44 923 0 92345 826 45 857 0 85746 766 46 796 0 79647 709 47 737 0 73748 652 48 681 0 68149 610 49 630 0 63050 568 50 589 0 58951 524 51 546 0 54652 481 52 503 0 50353 439 53 460 0 46054 397 54 418 0 41855 369 55 382 0 38256 340 56 355 0 355

Red Sea – Dead Sea Water Conveyance Study Program Draft Final Feasibility Study Report (12 147 RP 04), April 2011
Appendix G – Hydrology and Flood Studies Report
COYNE ET BELLIER in association with TRACTEBEL ENGINEERING and KEMA Appemdix G ‐ Page 132
t Yutum Group A Group B Group C A+B+C t Yutum-DS A-DS B-DS C-DS 470 km² Sum 57 316 57 328 0 32858 291 58 303 0 30359 268 59 279 0 27960 245 60 257 0 25761 229 61 237 0 23762 214 62 222 0 22263 194 63 204 0 20464 175 64 184 0 18465 161 65 168 0 16866 147 66 154 0 15467 139 67 143 0 14368 130 68 134 0 13469 123 69 126 0 12670 115 70 119 0 11971 106 71 111 0 11172 96 72 101 0 10173 90 73 93 0 9374 83 74 86 0 8675 77 75 80 0 8076 71 76 74 0 7477 66 77 68 0 6878 60 78 63 0 6379 55 79 58 0 5880 50 80 53 0 5381 46 81 48 0 4882 43 82 45 0 4583 40 83 41 0 4184 36 84 38 0 3885 34 85 35 0 3586 31 86 32 0 3287 28 87 29 0 2988 25 88 27 0 2789 23 89 24 0 2490 21 90 22 0 2291 18 91 19 0 1992 16 92 17 0 1793 14 93 15 0 1594 12 94 13 0 1395 10 95 11 0 1196 8 96 9 0 9 Qp 1 817 502 535 593 1 489 Qp 1 810 440 495 589 1 322 1 812 % 100 88 93 99 89

Red Sea – Dead Sea Water Conveyance Study Program Draft Final Feasibility Study Report (12 147 RP 04), April 2011
Appendix G – Hydrology and Flood Studies Report
COYNE ET BELLIER in association with TRACTEBEL ENGINEERING and KEMA Appemdix G ‐ Page 133
121. Flood Hydrographs – Storm Centered on Arava – PMF – V=20 km/h.
t Yutum Group A Group B Group C A+B+C t Yutum-DS A-DS B-DS C-DS 470 km² Sum 0 0 0 0 0 0 0 0 0 0 0 0 01 0 0 0 0 0 1 0 0 0 0 0 02 0 0 0 0 0 2 0 0 0 0 0 03 0 0 0 0 0 3 0 0 0 0 0 04 0 0 1 1 2 4 0 0 0 1 1 15 0 3 7 5 15 5 0 1 4 4 9 96 0 10 15 14 39 6 0 4 11 13 27 277 0 23 35 32 90 7 0 12 23 29 64 648 0 45 53 57 156 8 0 26 43 53 123 1239 0 69 68 79 216 9 0 47 60 76 183 183
10 0 103 120 122 345 10 0 73 90 114 277 27711 0 177 218 219 614 11 0 114 162 203 479 47912 145 831 2 022 1 436 4 290 12 64 321 961 1 179 2 461 2 52513 362 1 914 1 406 2 193 5 512 13 250 984 1 833 2 196 5 013 5 26314 580 1 719 640 1 323 3 682 14 470 1 672 1 066 1 512 4 250 4 72015 875 1 121 378 762 2 261 15 722 1 566 507 760 2 833 3 55516 1 171 735 232 477 1 444 16 1 022 1 122 310 541 1 973 2 99517 1 600 526 174 321 1 021 17 1 376 766 204 314 1 283 2 65918 2 029 379 161 253 793 18 1 813 541 167 273 981 2 79519 2 537 307 118 201 625 19 2 276 396 143 199 738 3 01420 3 045 227 98 151 476 20 2 789 306 108 163 578 3 36721 3 597 193 93 133 418 21 3 316 235 95 129 459 3 77522 4 148 167 91 126 383 22 3 870 195 92 130 417 4 28723 4 652 157 90 123 371 23 4 401 171 90 121 382 4 78224 5 156 139 86 119 344 24 4 902 156 88 121 366 5 26725 5 544 117 37 85 238 25 5 355 137 66 91 294 5 64926 5 933 72 11 37 120 26 5 736 111 24 43 178 5 91427 6 181 38 3 15 57 27 6 063 72 7 16 95 6 15828 6 428 21 1 6 28 28 6 303 41 2 8 51 6 35429 6 469 12 0 3 15 29 6 460 23 1 2 26 6 48630 6 510 6 0 1 8 30 6 488 13 0 2 15 6 50331 6 405 4 0 0 4 31 6 466 7 0 0 7 6 47332 6 300 2 0 0 2 32 6 352 4 0 0 4 6 35633 6 079 1 0 0 1 33 6 197 2 0 2 6 19934 5 857 1 0 0 1 34 5 968 1 0 1 5 97035 5 588 0 0 0 0 35 5 727 1 0 1 5 72736 5 318 0 0 0 0 36 5 454 0 0 0 5 45437 5 017 0 0 0 0 37 5 171 0 0 0 5 17138 4 716 38 4 868 0 4 86839 4 436 39 4 576 0 4 57640 4 156 40 4 297 0 4 29741 3 854 41 4 008 0 4 00842 3 553 42 3 705 0 3 70543 3 307 43 3 428 0 3 42844 3 062 44 3 186 0 3 18645 2 852 45 2 956 0 2 95646 2 642 46 2 748 0 2 74847 2 446 47 2 544 0 2 54448 2 250 48 2 349 0 2 34949 2 103 49 2 174 0 2 17450 1 955 50 2 029 0 2 02951 1 805 51 1 880 0 1 88052 1 655 52 1 731 0 1 73153 1 511 53 1 583 0 1 58354 1 367 54 1 440 0 1 44055 1 269 55 1 316 0 1 316

Red Sea – Dead Sea Water Conveyance Study Program Draft Final Feasibility Study Report (12 147 RP 04), April 2011
Appendix G – Hydrology and Flood Studies Report
COYNE ET BELLIER in association with TRACTEBEL ENGINEERING and KEMA Appemdix G ‐ Page 134
t Yutum Group A Group B Group C A+B+C t Yutum-DS A-DS B-DS C-DS 470 km² Sum 56 1 171 56 1 221 0 1 22157 1 087 57 1 129 0 1 12958 1 002 58 1 045 0 1 04559 923 59 962 0 96260 843 60 883 0 88361 789 61 815 0 81562 735 62 762 0 76263 668 63 702 0 70264 601 64 635 0 63565 555 65 577 0 57766 509 66 533 0 53367 479 67 494 0 49468 449 68 465 0 46569 424 69 436 0 43670 398 70 411 0 41171 365 71 382 0 38272 333 72 349 0 34973 310 73 321 0 32174 287 74 298 0 29875 266 75 276 0 27676 245 76 256 0 25677 226 77 236 0 23678 208 78 217 0 21779 190 79 199 0 19980 172 80 181 0 18181 160 81 166 0 16682 147 82 154 0 15483 136 83 142 0 14284 125 84 131 0 13185 115 85 120 0 12086 105 86 110 0 11087 96 87 100 0 10088 86 88 91 0 9189 78 89 82 0 8290 70 90 74 0 7491 62 91 66 0 6692 54 92 58 0 5893 47 93 51 0 5194 40 94 43 0 4395 33 95 36 0 3696 26 96 29 0 29 Qp 6 510 1 914 2 022 2 193 5 512 Qp 6 488 1 672 1 833 2 196 5 013 6 503 % 100 87 91 100 91

Red Sea – Dead Sea Water Conveyance Study Program Draft Final Feasibility Study Report (12 147 RP 04), April 2011
Appendix G – Hydrology and Flood Studies Report
COYNE ET BELLIER in association with TRACTEBEL ENGINEERING and KEMA Appemdix G ‐ Page 135
122. Flood Hydrographs – Storm Centered on Arava – T = 100‐years – V=10 km/h.
t Yutum Group A Group B Group C A+B+C t Yutum-DS A-DS B-DS C-DS 470 km² Sum 0 0 0 0 0 0 0 0 0 0 0 0 01 0 0 0 0 0 1 0 0 0 0 0 02 0 0 0 0 0 2 0 0 0 0 0 03 0 0 0 0 0 3 0 0 0 0 0 04 0 0 0 0 0 4 0 0 0 0 0 05 0 0 0 0 0 5 0 0 0 0 0 06 0 0 0 0 0 6 0 0 0 0 0 07 0 0 0 0 0 7 0 0 0 0 0 08 0 0 0 0 0 8 0 0 0 0 0 09 0 0 0 0 0 9 0 0 0 0 0 0
10 0 0 0 0 0 10 0 0 0 0 0 011 0 0 1 1 2 11 0 0 0 0 0 012 7 59 183 118 360 12 2 4 37 75 116 11813 29 173 146 210 530 13 11 38 135 194 366 37714 50 172 76 142 390 14 29 104 129 174 407 43715 80 122 50 90 262 15 52 134 86 96 316 36816 110 86 33 62 181 16 81 126 56 70 252 33317 156 65 26 44 135 17 114 105 38 47 191 30518 202 50 24 36 111 18 157 85 29 38 151 30819 257 42 18 30 90 19 204 67 24 32 123 32720 313 33 15 23 71 20 258 54 19 25 98 35621 376 28 14 21 63 21 315 43 16 21 80 39522 440 25 14 20 59 22 377 36 15 20 70 44723 500 24 14 19 57 23 439 30 14 19 64 50324 559 22 14 19 54 24 499 27 14 19 60 55925 608 18 6 13 38 25 557 24 12 15 52 60926 657 11 2 6 19 26 608 21 7 8 36 64327 692 6 1 2 9 27 654 16 3 3 22 67628 726 3 0 1 4 28 691 11 1 1 13 70429 737 2 0 0 2 29 721 7 0 0 8 72930 748 1 0 0 1 30 736 4 0 0 5 74131 742 1 0 0 1 31 744 3 0 0 3 74732 735 0 0 0 0 32 741 2 0 0 2 74333 714 0 0 0 0 33 732 1 0 0 1 73334 693 0 0 0 0 34 713 1 0 0 1 71435 665 0 0 0 0 35 691 0 0 0 0 69136 636 0 0 0 0 36 664 0 0 0 0 66437 603 0 0 0 0 37 635 0 0 0 0 63538 570 38 603 0 60339 537 39 570 0 57040 505 40 538 0 53841 470 41 505 0 50542 434 42 469 0 46943 404 43 435 0 43544 375 44 405 0 40545 349 45 376 0 37646 323 46 349 0 34947 299 47 324 0 32448 276 48 300 0 30049 258 49 277 0 27750 239 50 258 0 25851 221 51 240 0 24052 203 52 221 0 22153 186 53 203 0 20354 168 54 186 0 18655 156 55 169 0 169

Red Sea – Dead Sea Water Conveyance Study Program Draft Final Feasibility Study Report (12 147 RP 04), April 2011
Appendix G – Hydrology and Flood Studies Report
COYNE ET BELLIER in association with TRACTEBEL ENGINEERING and KEMA Appemdix G ‐ Page 136
t Yutum Group A Group B Group C A+B+C t Yutum-DS A-DS B-DS C-DS 470 km² Sum 56 144 56 156 0 15657 133 57 144 0 14458 123 58 133 0 13359 113 59 123 0 12360 104 60 113 0 11361 97 61 104 0 10462 90 62 97 0 9763 82 63 90 0 9064 74 64 82 0 8265 68 65 74 0 7466 62 66 68 0 6867 59 67 63 0 6368 55 68 59 0 5969 52 69 55 0 5570 49 70 52 0 5271 45 71 48 0 4872 41 72 45 0 4573 38 73 41 0 4174 35 74 38 0 3875 32 75 35 0 3576 30 76 33 0 3377 28 77 30 0 3078 26 78 28 0 2879 23 79 26 0 2680 21 80 23 0 2381 20 81 21 0 2182 18 82 20 0 2083 17 83 18 0 1884 15 84 17 0 1785 14 85 15 0 1586 13 86 14 0 1487 12 87 13 0 1388 11 88 12 0 1289 10 89 11 0 1190 9 90 10 0 1091 8 91 9 0 992 7 92 8 0 893 6 93 7 0 794 5 94 6 0 695 4 95 5 0 596 3 96 4 0 4 Qp 748 173 183 210 530 Qp 744 134 135 194 407 747 % 99 78 74 92 77

Red Sea – Dead Sea Water Conveyance Study Program Draft Final Feasibility Study Report (12 147 RP 04), April 2011
Appendix G – Hydrology and Flood Studies Report
COYNE ET BELLIER in association with TRACTEBEL ENGINEERING and KEMA Appemdix G ‐ Page 137
123. Flood Hydrographs – Storm Centered on Arava – T = 1 000‐years – V=10 km/h.
t Yutum Group A Group B Group C A+B+C t Yutum-DS A-DS B-DS C-DS 470 km² Sum 0 0 0 0 0 0 0 0 0 0 0 0 0 1 0 0 0 0 0 1 0 0 0 0 0 0 2 0 0 0 0 0 2 0 0 0 0 0 0 3 0 0 0 0 0 3 0 0 0 0 0 0 4 0 0 0 0 0 4 0 0 0 0 0 0 5 0 0 0 0 0 5 0 0 0 0 0 0 6 0 0 0 0 0 6 0 0 0 0 0 0 7 0 0 0 0 0 7 0 0 0 0 0 0 8 0 0 0 0 0 8 0 0 0 0 0 0 9 0 0 0 0 0 9 0 0 0 0 0 0
10 0 1 2 1 4 10 0 0 0 1 1 1 11 0 5 12 9 27 11 0 1 4 7 11 11 12 12 120 351 232 703 12 3 10 78 151 238 241 13 49 330 266 393 989 13 19 76 257 367 700 719 14 86 316 131 255 702 14 50 200 237 317 753 803 15 137 217 83 156 457 15 89 251 151 167 569 658 16 188 150 54 104 307 16 138 230 96 118 445 583 17 266 111 41 73 225 17 194 188 63 78 329 524 18 343 83 39 59 181 18 267 149 47 62 257 524 19 438 69 29 48 146 19 347 116 39 51 206 553 20 532 53 24 37 114 20 439 92 31 40 162 601 21 639 45 23 33 100 21 535 72 26 33 131 666 22 746 40 22 31 93 22 640 59 24 31 114 753 23 846 38 22 30 91 23 744 49 23 30 102 847 24 947 34 21 30 85 24 846 43 22 30 96 941 25 1 028 29 9 21 59 25 942 39 19 24 82 1 02426 1 110 18 3 9 30 26 1 027 33 11 12 56 1 08427 1 167 9 1 4 14 27 1 104 25 5 4 34 1 13828 1 223 5 0 2 7 28 1 165 17 2 2 21 1 18629 1 240 3 0 1 4 29 1 214 11 1 1 13 1 22630 1 257 2 0 0 2 30 1 238 7 0 0 8 1 24531 1 244 1 0 0 1 31 1 250 4 0 0 5 1 25432 1 231 1 0 0 1 32 1 242 3 0 0 3 1 24533 1 194 0 0 0 0 33 1 225 2 0 0 2 1 22734 1 157 0 0 0 0 34 1 193 1 0 0 1 1 19435 1 108 0 0 0 0 35 1 154 1 0 0 1 1 15436 1 059 0 0 0 0 36 1 107 0 0 0 0 1 10837 1 003 0 0 0 0 37 1 057 0 0 0 0 1 05838 946 38 1 002 0 1 00239 892 39 947 0 947 40 838 40 892 0 892 41 778 41 837 0 837 42 719 42 778 0 778 43 669 43 721 0 721 44 620 44 670 0 670 45 578 45 622 0 622 46 535 46 578 0 578 47 495 47 536 0 536 48 456 48 496 0 496 49 426 49 458 0 458 50 397 50 427 0 427 51 366 51 397 0 397 52 336 52 366 0 366 53 307 53 337 0 337 54 278 54 307 0 307 55 258 55 280 0 280

Red Sea – Dead Sea Water Conveyance Study Program Draft Final Feasibility Study Report (12 147 RP 04), April 2011
Appendix G – Hydrology and Flood Studies Report
COYNE ET BELLIER in association with TRACTEBEL ENGINEERING and KEMA Appemdix G ‐ Page 138
t Yutum Group A Group B Group C A+B+C t Yutum-DS A-DS B-DS C-DS 470 km² Sum 56 238 56 258 0 258 57 221 57 239 0 239 58 203 58 221 0 221 59 187 59 204 0 204 60 171 60 188 0 188 61 160 61 173 0 173 62 149 62 161 0 161 63 136 63 149 0 149 64 122 64 136 0 136 65 113 65 123 0 123 66 103 66 113 0 113 67 97 67 104 0 104 68 91 68 97 0 97 69 86 69 91 0 91 70 81 70 86 0 86 71 74 71 80 0 80 72 67 72 74 0 74 73 63 73 68 0 68 74 58 74 63 0 63 75 54 75 58 0 58 76 50 76 54 0 54 77 46 77 50 0 50 78 42 78 46 0 46 79 39 79 42 0 42 80 35 80 39 0 39 81 33 81 35 0 35 82 30 82 33 0 33 83 28 83 30 0 30 84 25 84 28 0 28 85 23 85 26 0 26 86 21 86 24 0 24 87 20 87 22 0 22 88 18 88 20 0 20 89 16 89 18 0 18 90 14 90 16 0 16 91 13 91 14 0 14 92 11 92 13 0 13 93 10 93 11 0 11 94 8 94 10 0 10 95 7 95 8 0 8 96 6 96 7 0 7
Qp 1 257 330 351 393 989 Qp 1 250 251 257 367 753 1 254 % 99 76 73 93 76

Red Sea – Dead Sea Water Conveyance Study Program Draft Final Feasibility Study Report (12 147 RP 04), April 2011
Appendix G – Hydrology and Flood Studies Report
COYNE ET BELLIER in association with TRACTEBEL ENGINEERING and KEMA Appemdix G ‐ Page 139
124. Flood Hydrographs – Storm Centered on Arava – T = 10 000‐years – V=10 km/h.
t Yutum Group A Group B Group C A+B+C t Yutum-DS A-DS B-DS C-DS 470 km² Sum 0 0 0 0 0 0 0 0 0 0 0 0 01 0 0 0 0 0 1 0 0 0 0 0 02 0 0 0 0 0 2 0 0 0 0 0 03 0 0 0 0 0 3 0 0 0 0 0 04 0 0 0 0 0 4 0 0 0 0 0 05 0 0 0 0 0 5 0 0 0 0 0 06 0 0 0 0 0 6 0 0 0 0 0 07 0 0 0 0 0 7 0 0 0 0 0 08 0 0 0 0 0 8 0 0 0 0 0 09 0 1 2 2 5 9 0 0 1 1 2 2
10 0 5 10 8 23 10 0 1 3 6 10 1011 0 17 30 25 72 11 0 3 12 20 35 3512 18 192 535 361 1 087 12 4 21 126 239 385 38913 72 502 394 593 1 489 13 27 123 392 557 1 072 1 09914 126 472 190 376 1 038 14 74 307 353 471 1 131 1 20515 200 319 118 226 663 15 131 379 221 242 842 97316 275 217 75 147 439 16 202 344 138 170 651 85317 388 159 57 102 318 17 284 278 89 109 476 76118 501 118 53 82 253 18 390 217 65 86 369 75919 639 97 39 66 203 19 508 167 54 70 292 79920 777 73 33 51 157 20 640 131 42 55 228 86921 931 63 31 45 138 21 781 102 35 45 183 96422 1 086 55 31 42 128 22 932 82 32 43 158 1 09023 1 232 52 31 42 124 23 1 084 69 31 42 141 1 22624 1 377 47 29 40 117 24 1 231 60 30 41 132 1 36325 1 494 40 12 29 81 25 1 370 53 26 33 112 1 48326 1 611 24 4 12 41 26 1 493 46 15 17 77 1 57027 1 692 13 1 5 19 27 1 603 35 6 6 47 1 65028 1 773 7 0 2 9 28 1 690 24 2 3 29 1 71929 1 795 4 0 1 5 29 1 759 15 1 1 17 1 77630 1 817 2 0 0 3 30 1 792 10 0 0 10 1 80231 1 797 1 0 0 1 31 1 807 6 0 0 6 1 81332 1 777 1 0 0 1 32 1 794 4 0 0 4 1 79833 1 721 0 0 0 0 33 1 768 2 0 0 2 1 77034 1 665 0 0 0 0 34 1 719 1 0 0 1 1 72035 1 594 0 0 0 0 35 1 661 1 0 0 1 1 66236 1 522 0 0 0 0 36 1 593 0 0 0 0 1 59337 1 440 0 0 0 0 37 1 519 0 0 0 0 1 52038 1 357 38 1 439 0 1 43939 1 279 39 1 358 0 1 35840 1 201 40 1 279 0 1 27941 1 115 41 1 199 0 1 19942 1 029 42 1 115 0 1 11543 958 43 1 032 0 1 03244 887 44 959 0 95945 826 45 890 0 89046 766 46 827 0 82747 709 47 767 0 76748 652 48 709 0 70949 610 49 656 0 65650 568 50 611 0 61151 524 51 568 0 56852 481 52 524 0 52453 439 53 482 0 48254 397 54 439 0 43955 369 55 400 0 40056 340 56 369 0 369

Red Sea – Dead Sea Water Conveyance Study Program Draft Final Feasibility Study Report (12 147 RP 04), April 2011
Appendix G – Hydrology and Flood Studies Report
COYNE ET BELLIER in association with TRACTEBEL ENGINEERING and KEMA Appemdix G ‐ Page 140
t Yutum Group A Group B Group C A+B+C t Yutum-DS A-DS B-DS C-DS 470 km² Sum 57 316 57 341 0 34158 291 58 316 0 31659 268 59 291 0 29160 245 60 268 0 26861 229 61 247 0 24762 214 62 230 0 23063 194 63 213 0 21364 175 64 194 0 19465 161 65 176 0 17666 147 66 161 0 16167 139 67 148 0 14868 130 68 139 0 13969 123 69 130 0 13070 115 70 123 0 12371 106 71 115 0 11572 96 72 106 0 10673 90 73 97 0 9774 83 74 90 0 9075 77 75 83 0 8376 71 76 77 0 7777 66 77 71 0 7178 60 78 66 0 6679 55 79 60 0 6080 50 80 55 0 5581 46 81 50 0 5082 43 82 47 0 4783 40 83 43 0 4384 36 84 40 0 4085 34 85 37 0 3786 31 86 34 0 3487 28 87 31 0 3188 25 88 28 0 2889 23 89 25 0 2590 21 90 23 0 2391 18 91 21 0 2192 16 92 18 0 1893 14 93 16 0 1694 12 94 14 0 1495 10 95 12 0 1296 8 96 10 0 10 Qp 1 817 502 535 593 1 489 Qp 1 807 379 392 557 1 131 1 813 % 99 75 73 94 76

Red Sea – Dead Sea Water Conveyance Study Program Draft Final Feasibility Study Report (12 147 RP 04), April 2011
Appendix G – Hydrology and Flood Studies Report
COYNE ET BELLIER in association with TRACTEBEL ENGINEERING and KEMA Appemdix G ‐ Page 141
125. Flood Hydrographs – Storm Centered on Arava – PMF – V=10 km/h.
t Yutum Group A Group B Group C A+B+C T Yutum-DS A-DS B-DS C-DS 470 km² Sum 0 0 0 0 0 0 0 0 0 0 0 0 01 0 0 0 0 0 1 0 0 0 0 0 02 0 0 0 0 0 2 0 0 0 0 0 03 0 0 0 0 0 3 0 0 0 0 0 04 0 0 1 1 2 4 0 0 0 0 1 15 0 3 7 5 15 5 0 0 2 4 6 66 0 10 15 14 39 6 0 2 7 11 21 217 0 23 35 32 90 7 0 7 17 26 50 508 0 45 53 57 156 8 0 16 33 50 99 999 0 69 68 79 216 9 0 32 51 73 156 156
10 0 103 120 122 345 10 0 52 74 108 234 23411 0 177 218 219 614 11 0 81 127 189 397 39712 145 831 2 022 1 436 4 290 12 33 167 553 998 1 719 1 75213 362 1 914 1 406 2 193 5 512 13 170 558 1 488 2 092 4 138 4 30714 580 1 719 640 1 323 3 682 14 368 1 211 1 276 1 686 4 172 4 54015 875 1 121 378 762 2 261 15 599 1 424 766 821 3 010 3 60916 1 171 735 232 477 1 444 16 880 1 252 457 559 2 268 3 14817 1 600 526 174 321 1 021 17 1 203 986 284 346 1 615 2 81818 2 029 379 161 253 793 18 1 607 752 202 268 1 222 2 82919 2 537 307 118 201 625 19 2 049 565 164 214 943 2 99120 3 045 227 98 151 476 20 2 542 434 127 164 724 3 26621 3 597 193 93 133 418 21 3 056 330 105 134 569 3 62622 4 148 167 91 126 383 22 3 599 261 96 128 485 4 08423 4 652 157 90 123 371 23 4 138 214 92 123 429 4 56724 5 156 139 86 119 344 24 4 650 185 90 120 396 5 04525 5 544 117 37 85 238 25 5 129 161 77 97 336 5 46526 5 933 72 11 37 120 26 5 538 137 43 49 229 5 76827 6 181 38 3 15 57 27 5 899 103 18 18 140 6 03928 6 428 21 1 6 28 28 6 173 70 7 8 86 6 25929 6 469 12 0 3 15 29 6 379 45 3 3 51 6 43030 6 510 6 0 1 8 30 6 458 29 1 1 31 6 48931 6 405 4 0 0 4 31 6 474 18 0 0 18 6 49232 6 300 2 0 0 2 32 6 397 11 0 0 11 6 40733 6 079 1 0 0 1 33 6 271 6 0 0 6 6 27834 5 857 1 0 0 1 34 6 072 4 0 0 4 6 07635 5 588 0 0 0 0 35 5 845 2 0 0 2 5 84736 5 318 0 0 0 0 36 5 585 1 0 0 1 5 58637 5 017 0 0 0 0 37 5 311 1 0 0 1 5 31138 4 716 38 5 015 0 5 01539 4 436 39 4 720 0 4 72040 4 156 40 4 437 0 4 43741 3 854 41 4 151 0 4 15142 3 553 42 3 853 0 3 85343 3 307 43 3 566 0 3 56644 3 062 44 3 310 0 3 31045 2 852 45 3 071 0 3 07146 2 642 46 2 854 0 2 85447 2 446 47 2 646 0 2 64648 2 250 48 2 447 0 2 44749 2 103 49 2 262 0 2 26250 1 955 50 2 105 0 2 10551 1 805 51 1 955 0 1 95552 1 655 52 1 805 0 1 80553 1 511 53 1 656 0 1 65654 1 367 54 1 511 0 1 51155 1 269 55 1 378 0 1 378

Red Sea – Dead Sea Water Conveyance Study Program Draft Final Feasibility Study Report (12 147 RP 04), April 2011
Appendix G – Hydrology and Flood Studies Report
COYNE ET BELLIER in association with TRACTEBEL ENGINEERING and KEMA Appemdix G ‐ Page 142
t Yutum Group A Group B Group C A+B+C T Yutum-DS A-DS B-DS C-DS 470 km² Sum 56 1 171 56 1 272 0 1 27257 1 087 57 1 175 0 1 17558 1 002 58 1 087 0 1 08759 923 59 1 003 0 1 00360 843 60 923 0 92361 789 61 849 0 84962 735 62 790 0 79063 668 63 732 0 73264 601 64 667 0 66765 555 65 606 0 60666 509 66 556 0 55667 479 67 513 0 51368 449 68 480 0 48069 424 69 450 0 45070 398 70 424 0 42471 365 71 396 0 39672 333 72 365 0 36573 310 73 335 0 33574 287 74 310 0 31075 266 75 287 0 28776 245 76 266 0 26677 226 77 245 0 24578 208 78 226 0 22679 190 79 208 0 20880 172 80 190 0 19081 160 81 174 0 17482 147 82 160 0 16083 136 83 148 0 14884 125 84 136 0 13685 115 85 125 0 12586 105 86 115 0 11587 96 87 105 0 10588 86 88 96 0 9689 78 89 86 0 8690 70 90 78 0 7891 62 91 70 0 7092 54 92 62 0 6293 47 93 54 0 5494 40 94 47 0 4795 33 95 40 0 4096 26 96 33 0 33 Qp 6 510 1 914 2 022 2 193 5 512 Qp 6 474 1 424 1 488 2 092 4 172 6 492 % 99 74 74 95 76

Red Sea – Dead Sea Water Conveyance Study Program Draft Final Feasibility Study Report (12 147 RP 04), April 2011
Appendix G – Hydrology and Flood Studies Report
COYNE ET BELLIER in association with TRACTEBEL ENGINEERING and KEMA Appemdix G ‐ Page 143
6.3. Supporting Documents for Cross Drainage
126. Complements about the description of catchments under study. These complements concern the Area Reduction Factor (ARF), the thalweg slope (i) and the yearly rainfall (Pyr).
Catchment A (km²) ARF i Pyr (mm/year)r 4 85 0,89 0,083 93 5 161 0,85 0,049 164 6 35 0,93 0,066 97 7 186 0,84 0,044 162
14 17 0,95 0,111 217 19 15 0,96 0,134 207 22 11 0,98 0,099 184 37 79 0,90 0,068 261 59 11 0,98 0,104 173 74 65 0,91 0,078 162 89 149 0,85 0,056 178
93 147 0,85 0,039 119
115 59 0,91 0,064 83 122 74 0,90 0,054 94 123 263 0,80 0,037 109 133 34 0,93 0,065 81 141 54 0,92 0,065 89

Red Sea – Dead Sea Water Conveyance Study Program Draft Final Feasibility Study Report (12 147 RP 04), April 2011
Appendix G – Hydrology and Flood Studies Report
COYNE ET BELLIER in association with TRACTEBEL ENGINEERING and KEMA Appemdix G ‐ Page 144
127. Complements about the “α” coefficients. These complements concern the station name, the yearly rainfall Pyr (in mm/year) and the station elevation (in masl).
Station α Pyr Z
Group 1 selected El Reisha 0,136 65,7 Durra 0,145 Group 2 Rabba 0,212 341,4 920 Aqaba Airport 0,220 26,7 100 Dana 0,221 191,4 1250Wadi Yutum 0,230 300 Uneiza 0,244 137,5 1050Qatraneh 0,245 72,8 768 Ma'an 0,255 40,9 1069Qatraneh 0,263 72,8 768 Uneiza-Form 0,265 137,5 1050Rabba 0,276 242,0 920 Group 3 Ma'an-Form 0,302 100,0 1069Madaba-Form 0,309 300,0 785 Wadi Musa 0,326 179,0 1115Ras En Naqb 0,372 148,0 1570Q.A.I 0,378 160,8 722 Wadi Musa-Form 0,383 179,0 1115Rajif 0,387 114,7 750 Group 4 Dhaba 0,393 125,0 750 Dhaba 0,428 125,0 750 Madaba 0,444 300,0 785 Madaba 0,452 300,0 785 Dhiban 0,455 239,0 745 Rashadiya 0,456 194,3 1500Dhiban 0,461 239,0 745 Judayda 0,472 201,0 567 2
Group 5 Busaira 0,484 192,8 1100Dhiban 0,496 239,0 745 Mazar 0,501 283,0 1250Mazar 0,536 283,0 1250Tafileh-Form 0,543 203,3 1260Judayda 0,549 200,0 567 Tafileh 0,550 203,3 1260Tafileh 0,553 203,3 1260Dhiban-Form 0,559 239,0 745 Tafileh 0,567 195,7 1260

Red Sea – Dead Sea Water Conveyance Study Program Draft Final Feasibility Study Report (12 147 RP 04), April 2011
Appendix G – Hydrology and Flood Studies Report
COYNE ET BELLIER in association with TRACTEBEL ENGINEERING and KEMA Appemdix G ‐ Page 145
128. Complements about hypsometric curves, computation of Pyr and CN‐a. These complements are detailed in the tables below.
Catchment 4
Z S% Zbar Pbar dS PxdS CN CNxdS 924 0% 518 5% 721 161 5% 8,04 83,3 4,16 364 10% 441 139 5% 7,23 86,4 4,49 215 15% 289 127 5% 6,15 88,0 4,26
71 20% 143 116 5% 5,87 89,6 4,56 -42 25% 14 105 5% 5,13 91,0 4,43
-120 30% -81 98 5% 4,72 92,1 4,43 -166 35% -143 93 5% 4,71 92,7 4,68 -212 40% -189 90 5% 4,86 93,2 5,06 -253 45% -233 86 5% 4,00 93,7 4,35 -289 50% -271 83 5% 4,40 94,1 4,98 -315 55% -302 81 5% 3,69 94,5 4,31 -336 60% -325 79 5% 3,95 94,7 4,74 -351 65% -343 78 6% 4,36 94,9 5,34 -356 69% -353 77 3% 2,45 95,0 3,04 -366 75% -361 76 7% 4,96 95,1 6,20 -371 79% -369 76 4% 2,93 95,2 3,70 -377 84% -374 75 5% 3,42 95,3 4,33 -382 89% -379 75 5% 4,06 95,3 5,17 -387 97% -384 74 8% 6,03 95,4 7,74 -392 100% -389 74 3% 2,15 95,4 2,77 93,11 mm 92,8
Catchment 5
Z S% Zbar Pbar dS PxdS CN CNxdS 1 517 0% 1 311 5% 1 414 215 5% 10,47 75,7 3,69 1 260 10% 1 286 205 5% 9,69 77,2 3,65 1 216 15% 1 238 201 6% 11,61 77,7 4,48 1 179 20% 1 197 198 5% 9,55 78,1 3,77 1 142 25% 1 161 195 5% 9,91 78,5 3,98 1 098 30% 1 120 192 5% 8,76 79,0 3,60 1 039 35% 1 069 188 5% 9,91 79,5 4,19
988 40% 1 014 184 5% 9,25 80,1 4,03 929 45% 959 179 5% 8,53 80,7 3,84 870 50% 900 175 5% 9,15 81,4 4,26 812 55% 841 170 5% 8,40 82,0 4,05 738 60% 775 165 5% 8,09 82,7 4,05 621 65% 679 158 5% 8,12 83,8 4,32 503 70% 562 148 5% 7,16 85,1 4,10 415 75% 459 140 5% 7,20 86,2 4,42 327 80% 371 133 5% 6,47 87,1 4,23 194 85% 261 125 5% 6,50 88,3 4,60
48 90% 121 114 5% 5,66 89,9 4,47 -158 95% -55 100 5% 4,97 91,8 4,56 -364 100% -261 84 5% 4,16 94,0 4,66
164 mm 82,9

Red Sea – Dead Sea Water Conveyance Study Program Draft Final Feasibility Study Report (12 147 RP 04), April 2011
Appendix G – Hydrology and Flood Studies Report
COYNE ET BELLIER in association with TRACTEBEL ENGINEERING and KEMA Appemdix G ‐ Page 146
Catchment 6
Z S% Zbar Pbar dS PxdS CN CNxdS 508 0,0% 288 5,0% 398 136 5% 6,75 86,8 4,32 207 10,0% 248 124 5% 6,19 88,5 4,42 146 14,9% 176 118 5% 5,79 89,3 4,37 85 19,9% 116 113 5% 5,72 89,9 4,54 45 25,1% 65 109 5% 5,61 90,5 4,64 11 30,4% 28 107 5% 5,71 90,9 4,87 -20 34,9% -5 104 4% 4,61 91,2 4,04 -57 39,9% -38 101 5% 5,16 91,6 4,66 -91 44,9% -74 99 5% 4,89 92,0 4,56 -131 50,2% -111 96 5% 5,03 92,4 4,86 -165 54,8% -148 93 5% 4,33 92,8 4,33 -196 59,8% -180 90 5% 4,46 93,1 4,60 -226 64,9% -211 88 5% 4,49 93,5 4,77 -260 70,2% -243 85 5% 4,54 93,8 4,99 -287 74,7% -273 83 5% 3,78 94,2 4,29 -307 79,9% -297 81 5% 4,21 94,4 4,90 -321 84,7% -314 80 5% 3,79 94,6 4,49 -331 90,7% -326 79 6% 4,73 94,7 5,68 -338 95,6% -334 78 5% 3,83 94,8 4,64 -358 100,0% -348 77 4% 3,42 95,0 4,21 97 mm 92,2
Catchment 7
Z S% Zbar Pbar dS PxdS CN CNxdS 1 605 0% 1 461 5% 1 533 224 5% 11,19 74,5 3,71 1 393 10% 1 427 216 5% 10,46 75,6 3,66 1 317 15% 1 355 210 5% 11,33 76,4 4,11 1 264 20% 1 290 205 5% 10,50 77,1 3,94 1 218 25% 1 241 202 5% 9,56 77,6 3,68 1 150 30% 1 184 197 5% 9,85 78,3 3,91 1 067 35% 1 108 191 5% 9,52 79,1 3,94
976 40% 1 021 184 5% 8,92 80,0 3,87 870 45% 923 177 5% 9,11 81,1 4,18 763 50% 816 168 5% 8,55 82,3 4,18 672 55% 718 161 5% 7,57 83,3 3,93 566 60% 619 153 5% 7,67 84,4 4,24 460 65% 513 145 5% 7,58 85,6 4,49 377 70% 418 137 5% 7,00 86,6 4,42 301 75% 339 131 5% 5,95 87,5 3,97 210 80% 255 124 5% 6,40 88,4 4,55
81 85% 145 116 5% 6,01 89,6 4,65 -10 90% 36 107 5% 5,09 90,8 4,31
-109 95% -59 100 5% 5,16 91,8 4,75 -336 100% -222 87 5% 4,32 93,6 4,65
162 mm 83,2

Red Sea – Dead Sea Water Conveyance Study Program Draft Final Feasibility Study Report (12 147 RP 04), April 2011
Appendix G – Hydrology and Flood Studies Report
COYNE ET BELLIER in association with TRACTEBEL ENGINEERING and KEMA Appemdix G ‐ Page 147
Catchment 14
Z S% Zbar Pbar dS PxdS CN CNxdS 1 555 0% 1 427 5% 1 491 338 5% 16,81 70,9 3,53 1 352 10% 1 390 319 5% 15,15 72,8 3,46 1 256 15% 1 304 302 5% 16,10 74,4 3,96 1 128 20% 1 192 281 5% 14,22 76,4 3,87 1 069 25% 1 099 263 5% 13,43 78,2 3,99 1 043 30% 1 056 255 5% 12,12 78,9 3,75 1 021 35% 1 032 250 5% 13,67 79,4 4,33 1 000 40% 1 011 246 5% 11,71 79,8 3,79
979 45% 989 242 5% 12,79 80,2 4,24 941 50% 960 237 5% 10,83 80,7 3,70 861 55% 901 225 5% 11,11 81,8 4,03 792 60% 827 211 5% 11,06 83,2 4,36 723 65% 757 198 5% 9,41 84,5 4,02 632 70% 677 183 5% 9,00 86,0 4,24 536 75% 584 165 5% 8,56 87,7 4,55 461 80% 498 148 5% 7,38 89,3 4,44 397 85% 429 135 5% 6,67 90,6 4,46 338 90% 368 123 5% 6,31 91,7 4,68 285 95% 312 113 5% 5,41 92,7 4,45 189 100% 237 99 5% 5,03 94,1 4,81
217 mm 82,7
Catchment 19
Z S% Zbar Pbar dS PxdS CN CNxdS 1 551 0,0% 1 327 5,0% 1 439 328 5% 16,34 71,9 3,58 1 226 10,0% 1 276 297 5% 14,79 74,9 3,73 1 114 15,0% 1 170 277 5% 13,91 76,8 3,86 1 065 20,0% 1 089 261 5% 13,14 78,3 3,94 1 044 24,7% 1 055 255 5% 11,94 79,0 3,70 1 023 30,0% 1 033 251 5% 13,22 79,4 4,19
991 35,2% 1 007 246 5% 12,83 79,9 4,17 953 40,1% 972 239 5% 11,67 80,5 3,93 900 45,2% 927 230 5% 11,81 81,3 4,17 852 50,2% 876 221 5% 11,09 82,3 4,14 804 55,2% 828 211 5% 10,43 83,2 4,10 767 59,8% 785 203 5% 9,43 84,0 3,89 719 65,1% 743 195 5% 10,29 84,8 4,47 660 70,0% 689 185 5% 9,12 85,7 4,23 580 74,9% 620 172 5% 8,38 87,0 4,25 404 79,9% 492 147 5% 7,33 89,4 4,45 324 85,1% 364 123 5% 6,35 91,8 4,75 281 89,7% 302 111 5% 5,20 92,9 4,36 238 94,8% 260 103 5% 5,17 93,7 4,71 185 100,0% 212 94 5% 4,89 94,6 4,94
207 mm 83,6

Red Sea – Dead Sea Water Conveyance Study Program Draft Final Feasibility Study Report (12 147 RP 04), April 2011
Appendix G – Hydrology and Flood Studies Report
COYNE ET BELLIER in association with TRACTEBEL ENGINEERING and KEMA Appemdix G ‐ Page 148
Catchment 22
Z S% Zbar Pbar dS PxdS CN CNxdS 1 139 0% 1 025 5% 1 082 260 5% 12,96 78,5 3,91
970 10% 998 244 5% 12,65 80,0 4,15 930 15% 950 235 5% 11,07 80,9 3,82 889 20% 909 227 5% 11,93 81,7 4,29 860 25% 874 220 5% 10,54 82,3 3,94 830 30% 845 215 5% 10,70 82,9 4,13 797 35% 814 209 5% 11,25 83,4 4,50 764 40% 781 202 5% 9,55 84,1 3,96 731 45% 748 196 5% 10,70 84,7 4,62 702 50% 716 190 5% 8,84 85,2 3,96 672 55% 687 184 5% 8,70 85,8 4,05 639 60% 656 178 5% 9,50 86,4 4,60 606 65% 623 172 5% 8,59 87,0 4,34 577 70% 591 166 5% 7,73 87,6 4,07 533 75% 555 159 5% 8,04 88,2 4,46 466 80% 499 149 5% 7,71 89,3 4,63 393 85% 430 135 5% 6,66 90,6 4,45 338 90% 365 123 5% 6,22 91,8 4,64 272 95% 305 111 5% 5,63 92,9 4,69 198 100% 235 98 5% 4,83 94,2 4,63
184 mm 85,9
Catchment 37
Z S% Zbar Pbar dS PxdS CN CNxdS 1 725 0% 1 527 5% 1 626 364 5% 18,47 68,4 3,47 1 467 11% 1 497 339 5% 18,48 70,8 3,86 1 430 15% 1 448 330 5% 15,08 71,7 3,28 1 382 20% 1 406 322 5% 15,80 72,5 3,56 1 328 25% 1 355 312 5% 15,00 73,4 3,53 1 274 30% 1 301 302 5% 15,83 74,4 3,90 1 226 35% 1 250 292 5% 14,93 75,4 3,85 1 178 40% 1 202 283 5% 13,04 76,2 3,51 1 124 45% 1 151 273 5% 14,42 77,2 4,08 1 076 50% 1 100 263 5% 13,59 78,1 4,03 1 040 55% 1 058 255 4% 11,29 78,9 3,49
998 60% 1 019 248 6% 13,90 79,6 4,47 968 65% 983 241 5% 11,37 80,3 3,79 932 70% 950 235 5% 12,68 80,9 4,37 895 75% 913 228 4% 9,99 81,6 3,58 847 80% 871 220 5% 11,42 82,4 4,28 799 85% 823 211 5% 10,37 83,3 4,10 727 90% 763 199 5% 10,23 84,4 4,34 547 95% 637 175 5% 8,58 86,7 4,26 186 100% 366 123 5% 6,22 91,7 4,63
261 mm 78,4

Red Sea – Dead Sea Water Conveyance Study Program Draft Final Feasibility Study Report (12 147 RP 04), April 2011
Appendix G – Hydrology and Flood Studies Report
COYNE ET BELLIER in association with TRACTEBEL ENGINEERING and KEMA Appemdix G ‐ Page 149
Catchment 59
Z S% Zbar Pbar dS PxdS CN CNxdS 1 082 0%
971 5% 1 027 249 5% 12,23 79,5 3,90 923 10% 947 234 5% 12,26 81,0 4,24 871 15% 897 225 5% 10,86 81,9 3,96 829 20% 850 216 5% 10,15 82,8 3,89 781 25% 805 207 5% 10,43 83,6 4,21 743 30% 762 199 5% 10,67 84,4 4,53 719 35% 731 193 5% 9,07 85,0 4,00 691 40% 705 188 5% 9,96 85,5 4,53 660 45% 675 182 5% 9,18 86,0 4,33 625 50% 643 176 5% 8,75 86,6 4,30 573 55% 599 168 5% 8,22 87,4 4,29 532 60% 552 159 5% 8,10 88,3 4,50 511 65% 521 153 5% 7,19 88,9 4,18 487 70% 499 149 6% 8,17 89,3 4,91 466 75% 476 144 5% 6,69 89,7 4,16 435 80% 450 139 5% 7,02 90,2 4,54 404 85% 419 133 5% 6,19 90,8 4,21 362 90% 383 126 6% 6,95 91,4 5,03 293 95% 328 116 5% 5,60 92,5 4,47 196 100% 244 100 5% 5,03 94,0 4,73
173 mm 86,9
Catchment 74
Z S% Zbar Pbar dS PxdS CN CNxdS 1 733 0% 1 566 5% 1 649 239 5% 11,55 71,4 3,44 1 386 10% 1 476 220 5% 11,00 74,2 3,71 1 261 15% 1 323 202 5% 9,98 76,6 3,78 1 201 20% 1 231 192 5% 10,03 78,1 4,08 1 165 25% 1 183 187 5% 8,96 78,9 3,79 1 135 30% 1 150 183 5% 8,54 79,4 3,71 1 105 34% 1 120 180 5% 8,79 79,9 3,91 1 075 40% 1 090 176 6% 10,01 80,4 4,57 1 051 45% 1 063 173 4% 7,70 80,9 3,60 1 027 50% 1 039 170 6% 9,39 81,2 4,48
991 55% 1 009 167 5% 8,73 81,7 4,27 944 60% 968 162 5% 7,71 82,4 3,91 866 65% 905 155 5% 7,97 83,4 4,28 782 70% 824 146 5% 7,10 84,7 4,12 716 75% 749 138 5% 6,96 85,9 4,34 651 80% 683 130 5% 6,08 87,0 4,06 579 85% 615 123 5% 6,50 88,1 4,67 507 90% 543 114 5% 5,60 89,3 4,37 375 95% 441 103 5% 5,16 90,9 4,55 202 100% 289 86 5% 4,35 93,4 4,73
162 mm 82,4

Red Sea – Dead Sea Water Conveyance Study Program Draft Final Feasibility Study Report (12 147 RP 04), April 2011
Appendix G – Hydrology and Flood Studies Report
COYNE ET BELLIER in association with TRACTEBEL ENGINEERING and KEMA Appemdix G ‐ Page 150
Catchment 89
Z S% Zbar Pbar dS PxdS CN CNxdS 1 727 0% 1 592 5% 1 659 240 5% 11,71 71,2 3,47 1 549 10% 1 570 230 5% 11,81 72,6 3,73 1 505 15% 1 527 225 5% 11,31 73,3 3,68 1 462 20% 1 484 221 5% 11,34 74,0 3,81 1 419 25% 1 440 216 5% 10,10 74,7 3,50 1 365 30% 1 392 210 5% 10,92 75,5 3,92 1 278 35% 1 321 202 5% 9,87 76,7 3,74 1 181 40% 1 229 192 5% 10,00 78,2 4,07 1 137 45% 1 159 184 5% 8,97 79,3 3,87 1 099 50% 1 118 179 5% 8,90 80,0 3,97 1 067 55% 1 083 175 5% 8,54 80,5 3,92 1 040 60% 1 053 172 5% 8,27 81,0 3,90 1 013 65% 1 026 169 5% 8,40 81,4 4,05
980 70% 997 166 5% 8,34 81,9 4,12 916 75% 948 160 5% 8,40 82,7 4,34 791 80% 853 149 5% 7,46 84,3 4,20 683 85% 737 136 5% 6,92 86,1 4,37 575 90% 629 124 5% 6,08 87,9 4,30 483 95% 529 113 5% 5,86 89,5 4,64 202 100% 342 92 5% 4,55 92,5 4,58
178 mm 80,2
Catchment 93
Z S% Zbar Pbar dS PxdS CN CNxdS 1 722 0% 1 615 5% 1 668 155 5% 7,88 70,9 3,61 1 585 10% 1 600 150 5% 7,71 72,0 3,69 1 555 15% 1 570 148 5% 6,97 72,5 3,40 1 489 20% 1 522 145 5% 7,46 73,3 3,76 1 418 25% 1 454 141 5% 7,06 74,4 3,73 1 352 30% 1 385 136 5% 6,94 75,5 3,85 1 299 35% 1 325 132 5% 6,81 76,5 3,94 1 257 40% 1 278 129 5% 6,13 77,3 3,67 1 215 45% 1 236 126 5% 6,54 78,0 4,03 1 173 50% 1 194 124 5% 5,83 78,6 3,70 1 132 55% 1 152 121 5% 5,84 79,3 3,83 1 084 60% 1 108 118 5% 5,88 80,1 3,99 1 024 65% 1 054 115 5% 6,20 81,0 4,38
965 70% 994 111 5% 5,47 81,9 4,05 851 75% 908 105 5% 5,16 83,4 4,10 744 80% 797 98 5% 4,76 85,2 4,15 636 85% 690 91 5% 4,47 86,9 4,29 547 90% 592 84 5% 4,33 88,6 4,55 475 95% 511 79 5% 3,91 89,9 4,46 195 100% 335 67 5% 3,42 92,8 4,71
119 mm 79,9

Red Sea – Dead Sea Water Conveyance Study Program Draft Final Feasibility Study Report (12 147 RP 04), April 2011
Appendix G – Hydrology and Flood Studies Report
COYNE ET BELLIER in association with TRACTEBEL ENGINEERING and KEMA Appemdix G ‐ Page 151
Catchment 115
Z S% Zbar Pbar dS PxdS CN CNxdS 1 320 0,0% 1 126 5,1% 1 223 126 5% 6,33 78,2 3,94 1 020 10,0% 1 073 116 5% 5,75 80,6 4,00
897 14,9% 959 108 5% 5,29 82,5 4,04 787 19,8% 842 101 5% 4,91 84,4 4,12 695 25,1% 741 94 5% 4,96 86,1 4,55 633 30,1% 664 89 5% 4,44 87,4 4,36 589 35,3% 611 85 5% 4,48 88,2 4,63 562 40,2% 576 83 5% 4,10 88,8 4,38 540 45,2% 551 82 5% 4,08 89,2 4,46 523 50,0% 532 80 5% 3,82 89,5 4,27 505 54,4% 514 79 4% 3,47 89,8 3,94 479 60,1% 492 78 6% 4,44 90,2 5,16 452 64,9% 466 76 5% 3,62 90,6 4,33 422 69,7% 437 74 5% 3,54 91,1 4,36 382 75,3% 402 72 6% 4,07 91,7 5,20 351 80,3% 367 69 5% 3,47 92,3 4,62 312 85,1% 331 67 5% 3,19 92,8 4,41 272 90,2% 292 64 5% 3,32 93,5 4,81 232 94,7% 252 62 4% 2,74 94,1 4,16 197 100,0% 215 59 5% 3,18 94,8 5,06
83 mm 88,8
Catchment 122
Z S% Zbar Pbar dS PxdS CN CNxdS 1 435 0,0% 1 329 4,9% 1 382 136 5% 6,58 74,8 3,61 1 261 9,9% 1 295 130 5% 6,55 76,3 3,83 1 178 15,1% 1 219 125 5% 6,56 77,6 4,06 1 110 19,8% 1 144 120 5% 5,69 78,8 3,72 1 047 25,0% 1 079 116 5% 5,99 80,0 4,12
980 30,0% 1 013 112 5% 5,56 81,1 4,03 892 34,9% 936 107 5% 5,25 82,4 4,05 810 40,0% 851 101 5% 5,22 83,9 4,33 747 44,8% 778 96 5% 4,56 85,1 4,03 684 50,0% 715 92 5% 4,84 86,2 4,52 611 55,0% 647 88 5% 4,36 87,3 4,33 553 60,2% 582 84 5% 4,39 88,5 4,65 514 65,1% 534 80 5% 3,95 89,3 4,39 480 70,2% 497 78 5% 3,94 89,9 4,54 446 75,4% 463 76 5% 3,96 90,5 4,73 412 79,8% 429 74 4% 3,25 91,1 4,03 374 84,8% 393 71 5% 3,51 91,7 4,52 330 89,8% 352 68 5% 3,42 92,4 4,62 252 95,1% 291 64 5% 3,44 93,4 4,99 199 100,0% 226 60 5% 2,93 94,6 4,61
94 mm 85,7
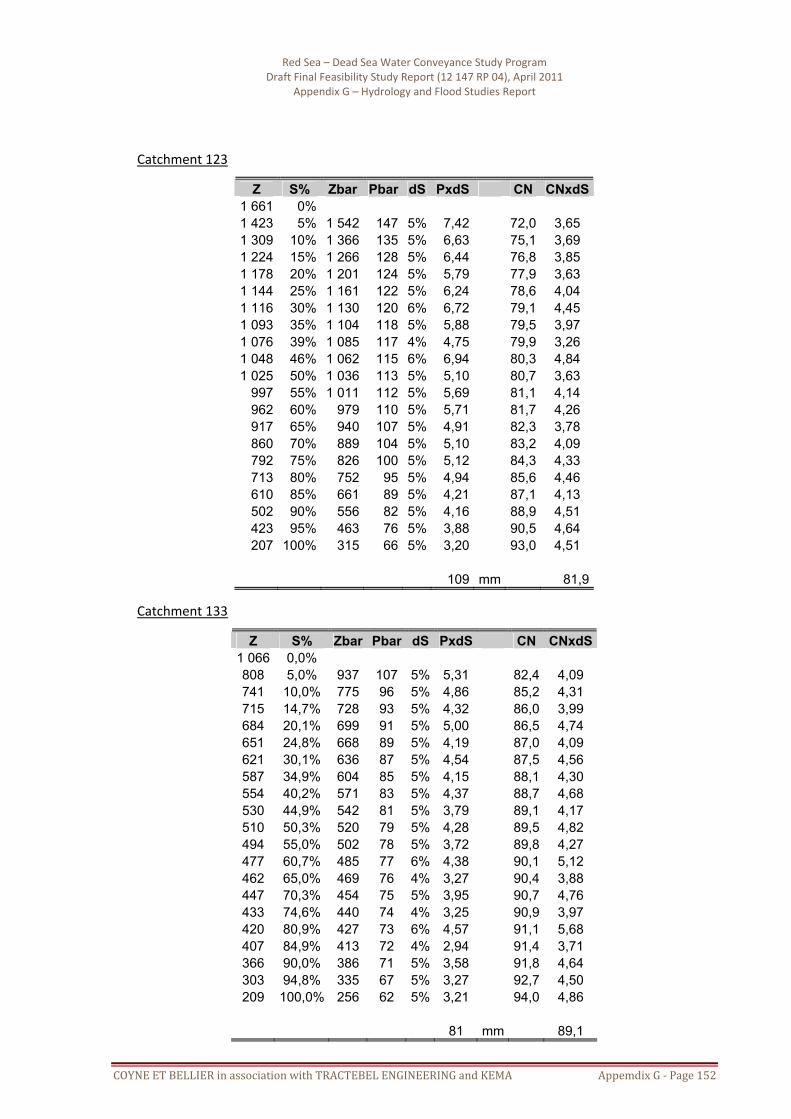
Red Sea – Dead Sea Water Conveyance Study Program Draft Final Feasibility Study Report (12 147 RP 04), April 2011
Appendix G – Hydrology and Flood Studies Report
COYNE ET BELLIER in association with TRACTEBEL ENGINEERING and KEMA Appemdix G ‐ Page 152
Catchment 123
Z S% Zbar Pbar dS PxdS CN CNxdS 1 661 0% 1 423 5% 1 542 147 5% 7,42 72,0 3,65 1 309 10% 1 366 135 5% 6,63 75,1 3,69 1 224 15% 1 266 128 5% 6,44 76,8 3,85 1 178 20% 1 201 124 5% 5,79 77,9 3,63 1 144 25% 1 161 122 5% 6,24 78,6 4,04 1 116 30% 1 130 120 6% 6,72 79,1 4,45 1 093 35% 1 104 118 5% 5,88 79,5 3,97 1 076 39% 1 085 117 4% 4,75 79,9 3,26 1 048 46% 1 062 115 6% 6,94 80,3 4,84 1 025 50% 1 036 113 5% 5,10 80,7 3,63
997 55% 1 011 112 5% 5,69 81,1 4,14 962 60% 979 110 5% 5,71 81,7 4,26 917 65% 940 107 5% 4,91 82,3 3,78 860 70% 889 104 5% 5,10 83,2 4,09 792 75% 826 100 5% 5,12 84,3 4,33 713 80% 752 95 5% 4,94 85,6 4,46 610 85% 661 89 5% 4,21 87,1 4,13 502 90% 556 82 5% 4,16 88,9 4,51 423 95% 463 76 5% 3,88 90,5 4,64 207 100% 315 66 5% 3,20 93,0 4,51
109 mm 81,9
Catchment 133
Z S% Zbar Pbar dS PxdS CN CNxdS 1 066 0,0% 808 5,0% 937 107 5% 5,31 82,4 4,09 741 10,0% 775 96 5% 4,86 85,2 4,31 715 14,7% 728 93 5% 4,32 86,0 3,99 684 20,1% 699 91 5% 5,00 86,5 4,74 651 24,8% 668 89 5% 4,19 87,0 4,09 621 30,1% 636 87 5% 4,54 87,5 4,56 587 34,9% 604 85 5% 4,15 88,1 4,30 554 40,2% 571 83 5% 4,37 88,7 4,68 530 44,9% 542 81 5% 3,79 89,1 4,17 510 50,3% 520 79 5% 4,28 89,5 4,82 494 55,0% 502 78 5% 3,72 89,8 4,27 477 60,7% 485 77 6% 4,38 90,1 5,12 462 65,0% 469 76 4% 3,27 90,4 3,88 447 70,3% 454 75 5% 3,95 90,7 4,76 433 74,6% 440 74 4% 3,25 90,9 3,97 420 80,9% 427 73 6% 4,57 91,1 5,68 407 84,9% 413 72 4% 2,94 91,4 3,71 366 90,0% 386 71 5% 3,58 91,8 4,64 303 94,8% 335 67 5% 3,27 92,7 4,50 209 100,0% 256 62 5% 3,21 94,0 4,86
81 mm 89,1

Red Sea – Dead Sea Water Conveyance Study Program Draft Final Feasibility Study Report (12 147 RP 04), April 2011
Appendix G – Hydrology and Flood Studies Report
COYNE ET BELLIER in association with TRACTEBEL ENGINEERING and KEMA Appemdix G ‐ Page 153
Catchment 141
Z S% Zbar Pbar dS PxdS CN CNxdS 1 162 0% 1 014 5% 1 088 117 5% 5,69 79,8 3,89
948 10% 981 110 5% 5,76 81,6 4,28 896 15% 922 106 5% 5,29 82,6 4,13 848 20% 872 103 5% 4,89 83,5 3,98 804 25% 826 100 5% 5,00 84,3 4,24 770 30% 787 97 5% 4,85 85,0 4,25 741 35% 755 95 5% 4,59 85,5 4,13 715 40% 728 93 5% 4,51 86,0 4,17 685 45% 700 91 5% 4,80 86,4 4,55 652 50% 668 89 5% 4,62 87,0 4,50 619 55% 635 87 5% 4,53 87,6 4,56 593 60% 606 85 4% 3,77 88,1 3,91 563 65% 578 83 5% 4,38 88,5 4,66 537 70% 550 81 5% 4,12 89,0 4,50 511 75% 524 80 5% 4,04 89,5 4,53 482 80% 496 78 5% 3,85 89,9 4,45 445 85% 463 76 5% 3,80 90,5 4,54 404 90% 424 73 5% 3,69 91,2 4,60 352 95% 378 70 5% 3,43 92,0 4,50 219 100% 286 64 5% 3,22 93,5 4,70
89 mm 87,1

Red Sea – Dead Sea Water Conveyance Study Program Draft Final Feasibility Study Report (12 147 RP 04), April 2011
Appendix G – Hydrology and Flood Studies Report
COYNE ET BELLIER in association with TRACTEBEL ENGINEERING and KEMA Appemdix G ‐ Page 154
129. Complements about the unit‐hydrographs. Unit hydrographs (10 mm of runoff, 1‐hour storm) are presented below.
Ghor Safi Area
Cat 4 Cat 5 Cat 6 Cat 7 t Q-HU t Q-HU t Q-HU t Q-HU 0 0,0 0 0,0 0 0,0 0 0,0 1 93,9 1 34,9 1 46,2 1 28,7 2 91,4 2 110,9 2 34,2 2 100,3 3 34,1 3 114,6 3 10,9 3 130,3 4 11,9 4 82,2 4 3,5 4 97,7 5 3,9 5 46,1 5 1,2 5 63,8 6 1,6 6 26,2 6 0,4 6 36,5 7 0,5 7 14,2 7 0,0 7 23,5 8 0,0 8 8,3 8 13,8 9 4,5 9 8,7
Sum 237,361 10 2,7 10 5,2 Volume 854 500 11 1,7 11 3,3
12 1,0 12 2,0 13 0,5 13 1,2 14 0,0 14 0,8 15 0,3 Sum 447,861 Sum 96,361 16 0,0 Volume 1 612 300 Volume 346 900 Sum 515,972 Volume 1 857 500
Catchments between Shoubalk and Wadi Musa
t HU-14 HU-19 HU-22 HU-37 HU-59 HU-74 HU-89 0 0,0 0,0 0,0 0,0 0,0 0,0 0,0 1 29,6 29,7 21,5 56,4 21,9 66,6 82,4 2 12,4 9,5 6,9 89,4 7,0 68,8 158,4 3 3,4 2,2 1,6 42,8 1,6 27,7 89,6 4 0,9 0,5 0,4 18,3 0,4 10,6 44,8 5 0,3 0,1 0,1 7,6 0,1 4,2 19,5 6 0,0 0,0 0,0 3,2 0,0 1,6 10,1 7 1,5 0,6 4,6 8 0,7 0,0 2,2 9 0,0 1,1
10 S 46,6 42,1 30,5 219,9 31,0 180,0 412,7 V 167 700 151 500 109 800 791 700 111 500 648 000 1 485 800

Red Sea – Dead Sea Water Conveyance Study Program Draft Final Feasibility Study Report (12 147 RP 04), April 2011
Appendix G – Hydrology and Flood Studies Report
COYNE ET BELLIER in association with TRACTEBEL ENGINEERING and KEMA Appemdix G ‐ Page 155
Catchments between Wadi Musa and Ras En Naqb
t HU-93 HU-115 HU-122 HU-123 HU-133 HU-141 0 0,0 0,0 0,0 0,0 0,0 0,0 1 23,4 60,6 41,2 40,5 44,7 59,3 2 82,1 62,6 79,3 141,8 33,2 57,8 3 105,5 25,2 44,8 184,2 10,6 21,6 4 79,9 9,6 22,4 138,1 3,4 7,5 5 44,8 3,8 9,8 90,2 1,2 2,5 6 27,7 1,4 5,0 51,6 0,4 1,0 7 19,2 0,6 2,3 33,1 0,0 0,3 8 9,8 0,0 1,1 19,5 0,0 9 6,3 0,6 12,3 10 3,6 0,0 7,4 11 2,3 4,6 12 1,4 2,8 13 0,8 1,7 14 0,4 1,1 15 0,0 0,4 16 0,0
S 407,4 163,7 206,6 729,3 93,4 149,9 V 1 466 500 589 400 743 600 2 625 400 336 300 539 800

Red Sea – Dead Sea Water Conveyance Study Program Draft Final Feasibility Study Report (12 147 RP 04), April 2011
Appendix G – Hydrology and Flood Studies Report
COYNE ET BELLIER in association with TRACTEBEL ENGINEERING and KEMA Appemdix G ‐ Page 156
130. Flood Hydrographs. The flood hydrographs are given below.
Catchment 4
t Q-2 Q-5 Q-10 Q-50 Q-100 Q-300 Q-500 Q-1000 Q-4000 Q-5000 Q-10000 PMF 0 0 0 0 0 0 0 0 0 0 0 0 0 1 0 0 0 0 0 0 0 0 0 0 0 0 2 0 0 0 0 0 0 0 0 0 0 0 1 3 0 0 0 0 0 0 0 0 0 0 0 7 4 0 0 0 0 0 0 0 0 0 0 0 19 5 0 0 0 0 0 0 0 0 1 1 2 34 6 0 0 0 0 0 1 1 2 4 4 5 49 7 0 0 0 0 1 3 3 4 8 8 10 65 8 0 0 0 1 3 6 7 9 14 14 16 85 9 0 0 0 4 6 11 12 14 20 21 24 110
10 0 0 2 8 11 18 20 23 32 33 37 147 11 0 3 6 17 22 33 36 42 54 56 62 220 12 20 56 86 156 185 237 260 290 356 366 396 1 141 13 27 69 102 178 209 264 289 321 390 401 433 1 214 14 18 43 62 105 122 151 166 184 222 228 245 673 15 12 26 37 62 71 88 96 106 126 130 140 377 16 8 18 25 40 46 56 61 67 81 83 89 235 17 7 14 19 30 34 41 45 50 59 61 65 171 18 5 11 15 24 27 33 36 39 47 48 51 133 19 5 9 13 20 23 27 30 32 38 39 42 110 20 4 8 11 17 20 24 26 29 34 35 37 96 21 4 7 10 16 18 21 23 26 30 31 33 87 22 3 7 9 14 16 19 21 23 27 28 30 79 23 3 6 9 13 15 18 20 22 25 26 28 73 24 3 6 8 12 14 16 18 20 23 24 26 68 25 2 3 5 7 8 10 11 12 14 14 15 40 26 1 1 2 3 3 4 4 4 5 5 6 14 27 0 0 1 1 1 1 1 1 2 2 2 5 28 0 0 0 0 0 0 0 0 1 1 1 2 29 0 0 0 0 0 0 0 0 0 0 0 1 30 0 0 0 0 0 0 0 0 0 0 0 0 Qp 27 69 102 178 209 264 289 321 390 401 433 1 214

Red Sea – Dead Sea Water Conveyance Study Program Draft Final Feasibility Study Report (12 147 RP 04), April 2011
Appendix G – Hydrology and Flood Studies Report
COYNE ET BELLIER in association with TRACTEBEL ENGINEERING and KEMA Appemdix G ‐ Page 157
Catchment 4 - A=85 km² - Probable Maximum Flood (PMF)
0
100
200
300
400
500
600
700
800
900
1 000
1 100
1 200
1 300
0 2 4 6 8 10 12 14 16 18 20 22 24 26 28 30
Time (hours)
Dis
char
ge (m
3/s)
PMF
Catchment 4 - A = 85 km² - Extreme Floods
0
50
100
150
200
250
300
350
400
450
500
0 2 4 6 8 10 12 14 16 18 20 22 24 26 28 30
Time (hours)
Dis
char
ge (m
3/s)
Q-100Q-500Q-1000Q-5000Q-10000
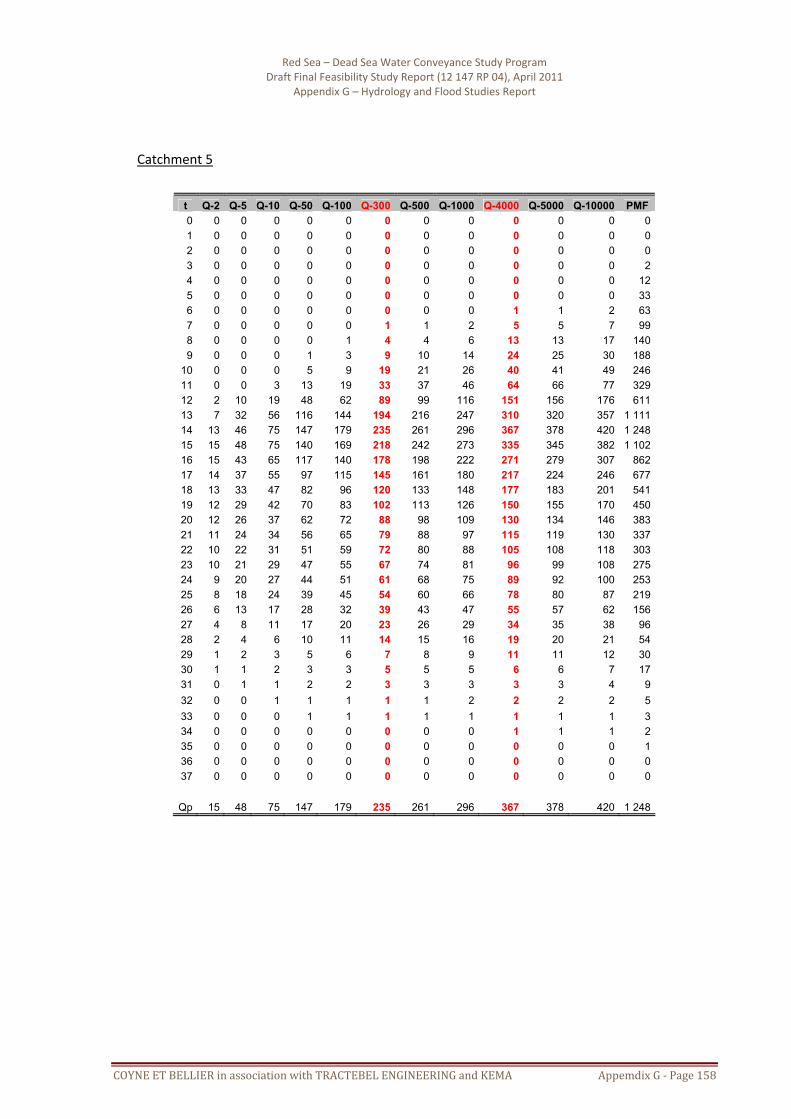
Red Sea – Dead Sea Water Conveyance Study Program Draft Final Feasibility Study Report (12 147 RP 04), April 2011
Appendix G – Hydrology and Flood Studies Report
COYNE ET BELLIER in association with TRACTEBEL ENGINEERING and KEMA Appemdix G ‐ Page 158
Catchment 5
t Q-2 Q-5 Q-10 Q-50 Q-100 Q-300 Q-500 Q-1000 Q-4000 Q-5000 Q-10000 PMF 0 0 0 0 0 0 0 0 0 0 0 0 0 1 0 0 0 0 0 0 0 0 0 0 0 0 2 0 0 0 0 0 0 0 0 0 0 0 0 3 0 0 0 0 0 0 0 0 0 0 0 2 4 0 0 0 0 0 0 0 0 0 0 0 12 5 0 0 0 0 0 0 0 0 0 0 0 33 6 0 0 0 0 0 0 0 0 1 1 2 63 7 0 0 0 0 0 1 1 2 5 5 7 99 8 0 0 0 0 1 4 4 6 13 13 17 140 9 0 0 0 1 3 9 10 14 24 25 30 188
10 0 0 0 5 9 19 21 26 40 41 49 246 11 0 0 3 13 19 33 37 46 64 66 77 329 12 2 10 19 48 62 89 99 116 151 156 176 611 13 7 32 56 116 144 194 216 247 310 320 357 1 111 14 13 46 75 147 179 235 261 296 367 378 420 1 248 15 15 48 75 140 169 218 242 273 335 345 382 1 102 16 15 43 65 117 140 178 198 222 271 279 307 862 17 14 37 55 97 115 145 161 180 217 224 246 677 18 13 33 47 82 96 120 133 148 177 183 201 541 19 12 29 42 70 83 102 113 126 150 155 170 450 20 12 26 37 62 72 88 98 109 130 134 146 383 21 11 24 34 56 65 79 88 97 115 119 130 337 22 10 22 31 51 59 72 80 88 105 108 118 303 23 10 21 29 47 55 67 74 81 96 99 108 275 24 9 20 27 44 51 61 68 75 89 92 100 253 25 8 18 24 39 45 54 60 66 78 80 87 219 26 6 13 17 28 32 39 43 47 55 57 62 156 27 4 8 11 17 20 23 26 29 34 35 38 96 28 2 4 6 10 11 14 15 16 19 20 21 54 29 1 2 3 5 6 7 8 9 11 11 12 30 30 1 1 2 3 3 5 5 5 6 6 7 17 31 0 1 1 2 2 3 3 3 3 3 4 9 32 0 0 1 1 1 1 1 2 2 2 2 5 33 0 0 0 1 1 1 1 1 1 1 1 3 34 0 0 0 0 0 0 0 0 1 1 1 2 35 0 0 0 0 0 0 0 0 0 0 0 1 36 0 0 0 0 0 0 0 0 0 0 0 0 37 0 0 0 0 0 0 0 0 0 0 0 0 Qp 15 48 75 147 179 235 261 296 367 378 420 1 248

Red Sea – Dead Sea Water Conveyance Study Program Draft Final Feasibility Study Report (12 147 RP 04), April 2011
Appendix G – Hydrology and Flood Studies Report
COYNE ET BELLIER in association with TRACTEBEL ENGINEERING and KEMA Appemdix G ‐ Page 159
Catchment 5 - A = 161 km² - Probable Maximum Flood PMF
0
150
300
450
600
750
900
1 050
1 200
1 350
0 2 4 6 8 10 12 14 16 18 20 22 24 26 28 30 32 34 36 38
Time (hours)
Dis
char
ge (m
3/s)
PMF
Catchment 5 - A=161 km² - Extreme Floods
0
50
100
150
200
250
300
350
400
450
0 2 4 6 8 10 12 14 16 18 20 22 24 26 28 30 32 34 36 38
Time (hours)
Dis
char
ge (m
3/s)
Q-100Q-500Q-1000Q-5000Q-10000

Red Sea – Dead Sea Water Conveyance Study Program Draft Final Feasibility Study Report (12 147 RP 04), April 2011
Appendix G – Hydrology and Flood Studies Report
COYNE ET BELLIER in association with TRACTEBEL ENGINEERING and KEMA Appemdix G ‐ Page 160
Catchment 6
t Q-2 Q-5 Q-10 Q-50 Q-100 Q-300 Q-500 Q-1000 Q-4000 Q-5000 Q-10000 PMF 0 0 0 0 0 0 0 0 0 0 0 0 0 1 0 0 0 0 0 0 0 0 0 0 0 0 2 0 0 0 0 0 0 0 0 0 0 0 0 3 0 0 0 0 0 0 0 0 0 0 0 2 4 0 0 0 0 0 0 0 0 0 0 0 6 5 0 0 0 0 0 0 0 0 0 0 0 12 6 0 0 0 0 0 0 0 0 1 1 1 19 7 0 0 0 0 0 1 1 1 2 2 3 26 8 0 0 0 0 0 2 2 3 4 4 5 34 9 0 0 0 1 2 4 4 5 8 8 9 45
10 0 0 0 2 4 6 7 9 12 12 14 62 11 0 0 2 6 8 13 14 16 21 22 25 96 12 7 24 37 71 84 109 121 137 168 173 190 562 13 8 24 37 67 79 101 112 126 152 157 172 494 14 6 15 21 37 43 54 60 68 80 83 91 253 15 4 9 13 22 26 32 35 39 46 48 52 141 16 3 6 9 15 17 21 23 26 31 32 34 92 17 2 5 7 11 13 16 18 19 23 24 26 68 18 2 4 6 9 10 13 14 15 18 19 20 53 19 2 4 5 8 9 11 12 13 15 16 17 45 20 1 3 4 7 8 10 11 12 14 14 15 40 21 1 3 4 6 7 9 10 11 13 13 14 36 22 1 3 4 6 7 8 9 10 12 12 13 33 23 1 2 3 5 6 7 8 9 11 11 12 31 24 1 2 3 5 6 7 8 8 10 10 11 29 25 1 1 2 3 3 4 4 4 5 5 6 15 26 0 0 1 1 1 1 1 1 2 2 2 5 27 0 0 0 0 0 0 0 0 1 1 1 1 28 0 0 0 0 0 0 0 0 0 0 0 0 29 0 0 0 0 0 0 0 0 0 0 0 0 30 0 0 0 0 0 0 0 0 0 0 0 0 Qp 8 24 37 71 84 109 121 137 168 173 190 562

Red Sea – Dead Sea Water Conveyance Study Program Draft Final Feasibility Study Report (12 147 RP 04), April 2011
Appendix G – Hydrology and Flood Studies Report
COYNE ET BELLIER in association with TRACTEBEL ENGINEERING and KEMA Appemdix G ‐ Page 161
Catchment 6 - A=35 km² - Probable Maximum Flood (PMF)
0
50
100
150
200
250
300
350
400
450
500
550
600
0 2 4 6 8 10 12 14 16 18 20 22 24 26 28 30
Time (hours)
Dis
char
ge (m
3/s)
PMF
Catchment 6 - A = 35 km² - Extreme Floods
0
20
40
60
80
100
120
140
160
180
200
220
0 2 4 6 8 10 12 14 16 18 20 22 24 26 28 30
Time (hours)
Dis
char
ge (m
3/s)
Q-100Q-500Q-1000Q-5000Q-10000

Red Sea – Dead Sea Water Conveyance Study Program Draft Final Feasibility Study Report (12 147 RP 04), April 2011
Appendix G – Hydrology and Flood Studies Report
COYNE ET BELLIER in association with TRACTEBEL ENGINEERING and KEMA Appemdix G ‐ Page 162
Catchment 7
t Q-2 Q-5 Q-10 Q-50 Q-100 Q-300 Q-500 Q-1000 Q-4000 Q-5000 Q-10000 PMF 0 0 0 0 0 0 0 0 0 0 0 0 0 1 0 0 0 0 0 0 0 0 0 0 0 0 2 0 0 0 0 0 0 0 0 0 0 0 0 3 0 0 0 0 0 0 0 0 0 0 0 1 4 0 0 0 0 0 0 0 0 0 0 0 9 5 0 0 0 0 0 0 0 0 0 0 0 27 6 0 0 0 0 0 0 0 0 1 1 1 56 7 0 0 0 0 0 0 0 1 4 4 5 94 8 0 0 0 0 0 3 3 4 10 10 14 137 9 0 0 0 1 2 7 8 11 20 21 27 187
10 0 0 0 4 7 15 17 23 36 37 45 248 11 0 0 2 11 16 30 33 41 59 61 73 333 12 1 7 14 40 53 77 86 101 135 139 159 586 13 6 25 46 102 128 174 193 223 284 293 330 1 067 14 12 42 72 148 182 239 266 304 381 393 439 1 345 15 15 47 76 149 181 233 259 294 365 377 419 1 240 16 16 44 70 132 159 202 225 254 312 322 357 1 030 17 15 40 61 111 133 166 185 209 255 263 290 817 18 15 36 54 96 114 141 157 176 213 220 243 671 19 14 32 47 83 98 121 134 150 180 186 205 556 20 13 29 42 73 86 105 117 130 156 161 177 474 21 12 27 39 65 77 93 103 115 138 142 156 412 22 12 25 35 60 70 84 93 104 124 128 140 365 23 11 23 33 55 64 76 85 95 112 116 127 329 24 11 22 31 51 59 71 79 88 104 107 117 301 25 10 20 28 46 53 63 70 78 92 95 104 267 26 8 15 22 35 41 49 54 60 71 73 80 203 27 5 10 14 23 27 31 35 39 46 48 52 132 28 3 6 9 14 16 20 22 24 28 29 32 81 29 2 4 5 8 10 12 13 14 16 17 19 49 30 1 2 3 5 6 7 8 9 11 11 12 30 31 1 1 2 3 4 4 5 5 6 6 7 18 32 0 1 1 2 2 3 3 3 4 4 4 11 33 0 0 1 1 1 2 2 2 2 2 2 6 34 0 0 0 1 1 1 1 1 1 1 1 4 35 0 0 0 0 0 1 1 1 1 1 1 2 36 0 0 0 0 0 0 0 0 0 0 0 1 37 0 0 0 0 0 0 0 0 0 0 0 0 38 0 0 0 0 0 0 0 0 0 0 0 0 39 0 0 0 0 0 0 0 0 0 0 0 0 Qp 16 47 76 149 182 239 266 304 381 393 439 1 345

Red Sea – Dead Sea Water Conveyance Study Program Draft Final Feasibility Study Report (12 147 RP 04), April 2011
Appendix G – Hydrology and Flood Studies Report
COYNE ET BELLIER in association with TRACTEBEL ENGINEERING and KEMA Appemdix G ‐ Page 163
Catchment 7 - A = 186 km² - Probable Maximum Flood PMF
0
150
300
450
600
750
900
1 050
1 200
1 350
1 500
0 2 4 6 8 10 12 14 16 18 20 22 24 26 28 30 32 34 36 38 40
Time (hours)
Dis
char
ge (m
3/s)
PMF
Catchment 7 - A=186 km² - Extreme Floods
0
50
100
150
200
250
300
350
400
450
500
0 2 4 6 8 10 12 14 16 18 20 22 24 26 28 30 32 34 36 38 40
Time (hours)
Dis
char
ge (m
3/s)
Q-100Q-500Q-1000Q-5000Q-10000

Red Sea – Dead Sea Water Conveyance Study Program Draft Final Feasibility Study Report (12 147 RP 04), April 2011
Appendix G – Hydrology and Flood Studies Report
COYNE ET BELLIER in association with TRACTEBEL ENGINEERING and KEMA Appemdix G ‐ Page 164
Catchment 14
t Q-2 Q-5 Q-10 Q-50 Q-100 Q-300 Q-500 Q-1000 Q-4000 Q-5000 Q-10000 PMF 0 0 0 0 0 0 0 0 0 0 0 0 0 1 0 0 0 0 0 0 0 0 0 0 0 0 2 0 0 0 0 0 0 0 0 0 0 0 5 3 0 0 0 0 0 0 0 0 1 1 1 13 4 0 0 0 0 0 1 1 2 3 3 3 20 5 0 0 0 1 1 3 3 3 5 5 6 27 6 0 0 1 2 3 5 5 6 8 8 9 32 7 0 1 1 3 4 6 7 8 10 10 12 38 8 0 1 2 5 6 8 9 10 13 13 15 44 9 1 2 3 7 8 10 11 13 17 17 18 52
10 1 3 5 9 11 14 15 17 21 22 24 64 11 3 6 8 14 16 20 22 24 29 30 33 85 12 12 22 29 45 52 63 68 75 89 91 98 239 13 10 18 23 35 41 49 53 58 68 70 75 179 14 7 12 16 24 27 32 35 38 44 45 49 115 15 6 9 12 17 20 23 25 27 32 33 35 82 16 5 8 10 14 16 19 20 22 25 26 28 65 17 4 7 8 12 13 16 17 19 21 22 24 55 18 4 6 7 11 12 14 15 17 20 20 21 49 19 4 5 7 10 11 13 14 15 18 18 19 44 20 3 5 6 9 10 12 13 14 17 17 18 41 21 3 5 6 9 10 11 12 13 16 16 17 38 22 3 5 6 8 9 10 11 12 15 15 16 36 23 3 4 5 8 9 10 11 12 14 14 15 34 24 3 4 5 7 8 9 10 11 13 13 14 33 25 1 2 2 3 3 4 4 4 5 5 5 12 26 0 0 1 1 1 1 1 1 1 1 1 3 27 0 0 0 0 0 0 0 0 0 0 0 1 28 0 0 0 0 0 0 0 0 0 0 0 0 29 0 0 0 0 0 0 0 0 0 0 0 0 Qp 12 22 29 45 52 63 68 75 89 91 98 239

Red Sea – Dead Sea Water Conveyance Study Program Draft Final Feasibility Study Report (12 147 RP 04), April 2011
Appendix G – Hydrology and Flood Studies Report
COYNE ET BELLIER in association with TRACTEBEL ENGINEERING and KEMA Appemdix G ‐ Page 165
Catchment 14 - A = 17 km² - Probable Maximum Flood PMF
0
20
40
60
80
100
120
140
160
180
200
220
240
0 2 4 6 8 10 12 14 16 18 20 22 24 26 28 30
Time (hours)
Dis
char
ge (m
3/s)
PMF
Catchment 14 - A=17 km² - Extreme Floods
0
10
20
30
40
50
60
70
80
90
100
110
0 2 4 6 8 10 12 14 16 18 20 22 24 26 28 30Time (hours)
Dis
char
ge (m
3/s)
Q-100Q-500Q-1000Q-5000Q-10000

Red Sea – Dead Sea Water Conveyance Study Program Draft Final Feasibility Study Report (12 147 RP 04), April 2011
Appendix G – Hydrology and Flood Studies Report
COYNE ET BELLIER in association with TRACTEBEL ENGINEERING and KEMA Appemdix G ‐ Page 166
Catchment 19
t Q-2 Q-5 Q-10 Q-50 Q-100 Q-300 Q-500 Q-1000 Q-4000 Q-5000 Q-10000 PMF 0 0 0 0 0 0 0 0 0 0 0 0 0 1 0 0 0 0 0 0 0 0 0 0 0 0 2 0 0 0 0 0 0 0 0 0 0 0 5 3 0 0 0 0 0 0 0 0 1 1 1 13 4 0 0 0 0 0 1 1 2 3 3 4 21 5 0 0 0 1 1 3 3 4 5 5 6 27 6 0 0 1 2 3 5 5 6 8 8 9 33 7 0 1 1 3 4 7 7 8 10 10 12 38 8 0 1 2 5 6 8 9 10 13 13 15 44 9 1 2 4 7 8 10 11 13 17 17 18 52
10 1 4 5 9 11 14 15 17 21 22 24 64 11 3 6 8 14 16 20 22 24 29 30 33 85 12 12 22 29 45 52 62 67 74 88 90 97 238 13 10 18 23 35 41 48 52 57 67 69 74 179 14 7 12 16 24 27 32 34 37 44 45 48 114 15 6 9 12 17 20 23 25 27 31 32 35 81 16 5 8 10 14 16 19 20 22 25 26 28 64 17 4 7 8 12 13 16 17 18 21 22 23 54 18 4 6 7 11 12 14 15 16 20 20 21 48 19 3 5 7 10 11 13 14 15 18 18 19 44 20 3 5 6 9 10 12 13 14 17 17 18 41 21 3 5 6 9 10 11 12 13 16 16 17 38 22 3 5 6 8 9 10 11 12 15 15 16 36 23 3 4 5 8 9 10 11 12 14 14 15 34 24 3 4 5 7 8 9 10 11 13 13 14 32 25 1 1 2 3 3 4 4 4 5 5 5 12 26 0 0 1 1 1 1 1 1 1 1 1 3 27 0 0 0 0 0 0 0 0 0 0 0 1 28 0 0 0 0 0 0 0 0 0 0 0 0 29 0 0 0 0 0 0 0 0 0 0 0 0
Qp 12 22 29 45 52 62 67 74 88 90 97 238

Red Sea – Dead Sea Water Conveyance Study Program Draft Final Feasibility Study Report (12 147 RP 04), April 2011
Appendix G – Hydrology and Flood Studies Report
COYNE ET BELLIER in association with TRACTEBEL ENGINEERING and KEMA Appemdix G ‐ Page 167
Catchment 19 - A = 15 km² - Probable Maximum Flood PMF
0
20
40
60
80
100
120
140
160
180
200
220
240
0 2 4 6 8 10 12 14 16 18 20 22 24 26 28 30
Time (hours)
Dis
char
ge (m
3/s)
PMF
Catchment 19 - A=15 km² - Extreme Floods
0
10
20
30
40
50
60
70
80
90
100
0 2 4 6 8 10 12 14 16 18 20 22 24 26 28 30
Time (hours)
Dis
char
ge (m
3/s)
Q-100Q-500Q-1000Q-5000Q-10000

Red Sea – Dead Sea Water Conveyance Study Program Draft Final Feasibility Study Report (12 147 RP 04), April 2011
Appendix G – Hydrology and Flood Studies Report
COYNE ET BELLIER in association with TRACTEBEL ENGINEERING and KEMA Appemdix G ‐ Page 168
Catchment 22
t Q-2 Q-5 Q-10 Q-50 Q-100 Q-300 Q-500 Q-1000 Q-4000 Q-5000 Q-10000 PMF 0 0 0 0 0 0 0 0 0 0 0 0 0 1 0 0 0 0 0 0 0 0 0 0 0 0 2 0 0 0 0 0 0 0 0 0 0 0 3 3 0 0 0 0 0 0 0 0 0 0 1 8 4 0 0 0 0 0 1 1 1 2 2 2 12 5 0 0 0 0 1 2 2 2 3 3 3 16 6 0 0 0 1 1 3 3 3 4 4 5 19 7 0 0 1 2 2 4 4 4 6 6 7 22 8 0 1 1 3 3 5 5 6 8 8 8 27 9 0 1 2 4 5 6 7 8 10 10 11 32
10 1 2 3 6 7 8 9 10 13 13 14 40 11 2 4 5 9 10 13 14 16 19 19 21 56 12 10 18 23 37 42 51 55 61 72 74 79 198 13 7 12 16 24 28 33 36 39 46 47 51 124 14 5 8 10 15 17 19 21 23 27 28 30 72 15 3 5 7 10 12 14 15 16 19 19 20 49 16 3 4 6 8 9 11 12 13 15 15 16 38 17 2 4 5 7 8 9 10 11 13 13 13 32 18 2 3 4 6 7 8 9 9 11 11 12 28 19 2 3 4 5 6 7 8 8 10 10 11 25 20 2 3 3 5 6 6 7 8 9 9 10 23 21 2 3 3 5 5 6 7 7 9 9 9 22 22 2 2 3 4 5 6 6 7 8 8 9 20 23 1 2 3 4 5 6 6 6 8 8 8 19 24 1 2 3 4 4 6 6 6 7 7 8 18 25 0 1 1 1 1 2 2 2 2 2 2 5 26 0 0 0 0 0 0 0 0 0 0 1 1 27 0 0 0 0 0 0 0 0 0 0 0 0 28 0 0 0 0 0 0 0 0 0 0 0 0 29 0 0 0 0 0 0 0 0 0 0 0 0 Qp 10 18 23 37 42 51 55 61 72 74 79 198

Red Sea – Dead Sea Water Conveyance Study Program Draft Final Feasibility Study Report (12 147 RP 04), April 2011
Appendix G – Hydrology and Flood Studies Report
COYNE ET BELLIER in association with TRACTEBEL ENGINEERING and KEMA Appemdix G ‐ Page 169
Catchment 22 - A = 11 km² - Probable Maximum Flood PMF
0
20
40
60
80
100
120
140
160
180
200
0 2 4 6 8 10 12 14 16 18 20 22 24 26 28 30
Time (hours)
Dis
char
ge (m
3/s)
PMF
Catchment 22 - A=11 km² - Extreme Floods
0
10
20
30
40
50
60
70
80
0 2 4 6 8 10 12 14 16 18 20 22 24 26 28 30
Time (hours)
Dis
char
ge (m
3/s)
Q-100Q-500Q-1000Q-5000Q-10000
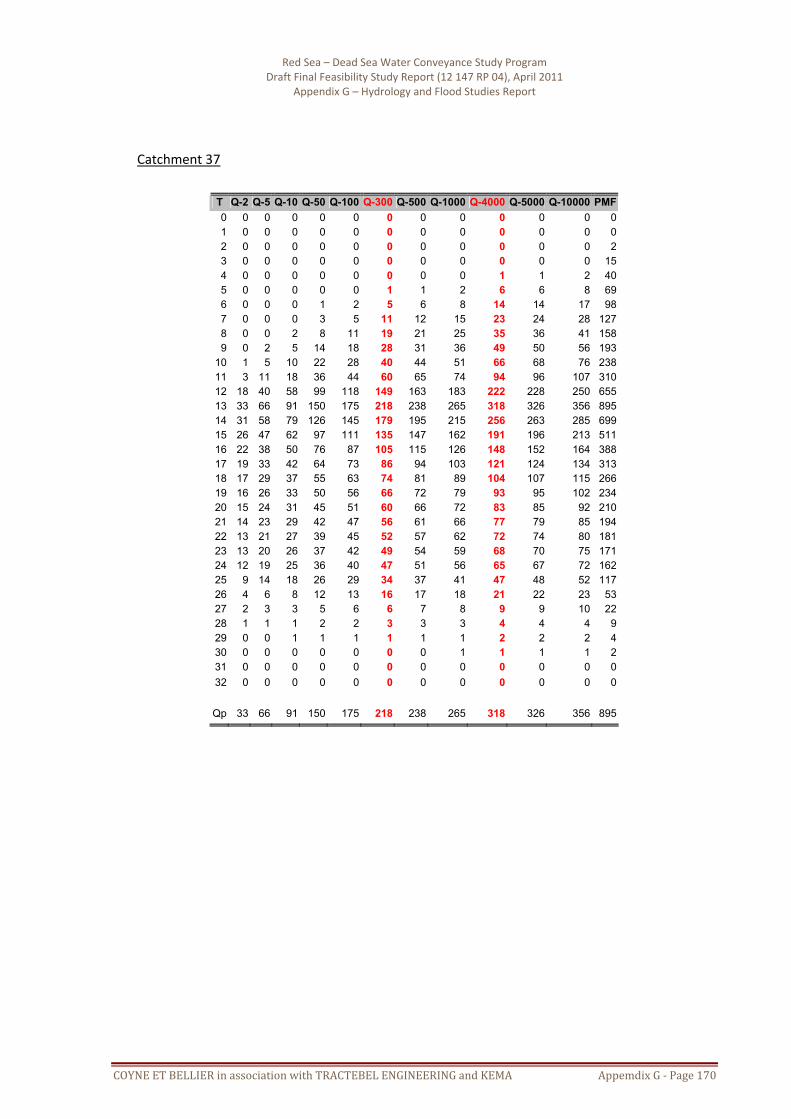
Red Sea – Dead Sea Water Conveyance Study Program Draft Final Feasibility Study Report (12 147 RP 04), April 2011
Appendix G – Hydrology and Flood Studies Report
COYNE ET BELLIER in association with TRACTEBEL ENGINEERING and KEMA Appemdix G ‐ Page 170
Catchment 37
T Q-2 Q-5 Q-10 Q-50 Q-100 Q-300 Q-500 Q-1000 Q-4000 Q-5000 Q-10000 PMF 0 0 0 0 0 0 0 0 0 0 0 0 0 1 0 0 0 0 0 0 0 0 0 0 0 0 2 0 0 0 0 0 0 0 0 0 0 0 2 3 0 0 0 0 0 0 0 0 0 0 0 15 4 0 0 0 0 0 0 0 0 1 1 2 40 5 0 0 0 0 0 1 1 2 6 6 8 69 6 0 0 0 1 2 5 6 8 14 14 17 98 7 0 0 0 3 5 11 12 15 23 24 28 127 8 0 0 2 8 11 19 21 25 35 36 41 158 9 0 2 5 14 18 28 31 36 49 50 56 193
10 1 5 10 22 28 40 44 51 66 68 76 238 11 3 11 18 36 44 60 65 74 94 96 107 310 12 18 40 58 99 118 149 163 183 222 228 250 655 13 33 66 91 150 175 218 238 265 318 326 356 895 14 31 58 79 126 145 179 195 215 256 263 285 699 15 26 47 62 97 111 135 147 162 191 196 213 511 16 22 38 50 76 87 105 115 126 148 152 164 388 17 19 33 42 64 73 86 94 103 121 124 134 313 18 17 29 37 55 63 74 81 89 104 107 115 266 19 16 26 33 50 56 66 72 79 93 95 102 234 20 15 24 31 45 51 60 66 72 83 85 92 210 21 14 23 29 42 47 56 61 66 77 79 85 194 22 13 21 27 39 45 52 57 62 72 74 80 181 23 13 20 26 37 42 49 54 59 68 70 75 171 24 12 19 25 36 40 47 51 56 65 67 72 162 25 9 14 18 26 29 34 37 41 47 48 52 117 26 4 6 8 12 13 16 17 18 21 22 23 53 27 2 3 3 5 6 6 7 8 9 9 10 22 28 1 1 1 2 2 3 3 3 4 4 4 9 29 0 0 1 1 1 1 1 1 2 2 2 4 30 0 0 0 0 0 0 0 1 1 1 1 2 31 0 0 0 0 0 0 0 0 0 0 0 0 32 0 0 0 0 0 0 0 0 0 0 0 0 Qp 33 66 91 150 175 218 238 265 318 326 356 895

Red Sea – Dead Sea Water Conveyance Study Program Draft Final Feasibility Study Report (12 147 RP 04), April 2011
Appendix G – Hydrology and Flood Studies Report
COYNE ET BELLIER in association with TRACTEBEL ENGINEERING and KEMA Appemdix G ‐ Page 171
Catchment 37 - A = 79 km² - Probable Maximum Flood PMF
0
100
200
300
400
500
600
700
800
900
0 2 4 6 8 10 12 14 16 18 20 22 24 26 28 30 32
Time (hours)
Dis
char
ge (m
3/s)
PMF
Catchment 37 - A=79 km² - Extreme Floods
0
50
100
150
200
250
300
350
400
0 2 4 6 8 10 12 14 16 18 20 22 24 26 28 30 32
Time (hours)
Dis
char
ge (m
3/s)
Q-100Q-500Q-1000Q-5000Q-10000

Red Sea – Dead Sea Water Conveyance Study Program Draft Final Feasibility Study Report (12 147 RP 04), April 2011
Appendix G – Hydrology and Flood Studies Report
COYNE ET BELLIER in association with TRACTEBEL ENGINEERING and KEMA Appemdix G ‐ Page 172
Catchment 59
t Q-2 Q-5 Q-10 Q-50 Q-100 Q-300 Q-500 Q-1000 Q-4000 Q-5000 Q-10000 PMF 0 0 0 0 0 0 0 0 0 0 0 0 0 1 0 0 0 0 0 0 0 0 0 0 0 0 2 0 0 0 0 0 0 0 0 0 0 0 3 3 0 0 0 0 0 0 0 0 1 1 1 8 4 0 0 0 0 0 1 1 1 2 2 2 12 5 0 0 0 1 1 2 2 2 3 3 4 16 6 0 0 0 1 2 3 3 3 5 5 5 19 7 0 0 1 2 2 4 4 4 6 6 7 23 8 0 1 1 3 3 5 5 6 8 8 9 27 9 0 1 2 4 5 6 7 8 10 10 11 32
10 1 2 3 6 7 8 9 10 13 13 14 40 11 2 4 5 9 10 13 14 16 19 19 21 56 12 9 18 23 37 42 51 55 60 72 74 79 197 13 7 12 16 24 27 33 36 39 46 47 50 123 14 4 8 10 14 16 19 21 23 27 28 30 71 15 3 5 7 10 11 14 15 16 19 19 20 49 16 3 4 5 8 9 10 11 12 15 15 16 38 17 2 4 5 7 8 9 10 10 12 12 13 32 18 2 3 4 6 7 8 9 9 11 11 12 28 19 2 3 4 5 6 7 8 8 10 10 11 25 20 2 3 3 5 6 6 7 8 9 9 10 23 21 2 3 3 5 5 6 7 7 9 9 9 21 22 2 2 3 4 5 6 6 7 8 8 8 20 23 1 2 3 4 5 6 6 6 8 8 8 19 24 1 2 3 4 4 6 6 6 7 7 8 18 25 0 1 1 1 1 2 2 2 2 2 2 5 26 0 0 0 0 0 0 0 0 0 0 1 1 27 0 0 0 0 0 0 0 0 0 0 0 0 28 0 0 0 0 0 0 0 0 0 0 0 0 29 0 0 0 0 0 0 0 0 0 0 0 0 Qp 9 18 23 37 42 51 55 60 72 74 79 197

Red Sea – Dead Sea Water Conveyance Study Program Draft Final Feasibility Study Report (12 147 RP 04), April 2011
Appendix G – Hydrology and Flood Studies Report
COYNE ET BELLIER in association with TRACTEBEL ENGINEERING and KEMA Appemdix G ‐ Page 173
Catchment 59 - A = 11 km² - Probable Maximum Flood PMF
0
20
40
60
80
100
120
140
160
180
200
0 2 4 6 8 10 12 14 16 18 20 22 24 26 28 30
Time (hours)
Dis
char
ge (m
3/s)
PMF
Catchment 59 - A=11 km² - Extreme Floods
0
10
20
30
40
50
60
70
80
90
0 2 4 6 8 10 12 14 16 18 20 22 24 26 28 30
Time (hours)
Dis
char
ge (m
3/s)
Q-100Q-500Q-1000Q-5000Q-10000

Red Sea – Dead Sea Water Conveyance Study Program Draft Final Feasibility Study Report (12 147 RP 04), April 2011
Appendix G – Hydrology and Flood Studies Report
COYNE ET BELLIER in association with TRACTEBEL ENGINEERING and KEMA Appemdix G ‐ Page 174
Catchment 74
t Q-2 Q-5 Q-10 Q-50 Q-100 Q-300 Q-500 Q-1000 Q-4000 Q-5000 Q-10000 PMF 0 0 0 0 0 0 0 0 0 0 0 0 0 1 0 0 0 0 0 0 0 0 0 0 0 0 2 0 0 0 0 0 0 0 0 0 0 0 1 3 0 0 0 0 0 0 0 0 0 0 0 11 4 0 0 0 0 0 0 0 0 0 0 1 27 5 0 0 0 0 0 0 0 1 3 3 3 46 6 0 0 0 0 0 2 2 3 7 7 9 65 7 0 0 0 1 2 5 6 8 13 13 15 84 8 0 0 0 3 5 9 10 13 19 20 23 105 9 0 0 0 7 10 16 17 20 28 29 33 131
10 0 1 1 12 16 23 25 30 41 42 46 166 11 0 5 4 21 27 38 41 47 61 63 69 228 12 10 31 31 85 104 132 144 163 202 208 225 643 13 16 43 44 106 127 158 173 195 238 245 265 728 14 14 34 36 78 93 114 125 140 168 173 187 498 15 12 25 27 56 66 81 88 98 118 121 129 338 16 10 20 22 43 50 60 66 74 87 90 97 248 17 8 17 18 35 41 49 53 59 70 72 77 196 18 7 15 16 30 35 41 45 50 59 61 65 165 19 7 13 14 27 31 37 40 44 52 53 57 142 20 6 12 13 24 28 33 36 40 47 48 52 128 21 6 11 12 22 26 30 33 37 44 45 48 118 22 6 11 12 21 24 28 31 34 41 42 44 110 23 5 10 11 20 23 27 29 32 38 39 42 103 24 5 10 11 19 22 26 28 31 36 37 39 97 25 3 6 7 12 13 16 17 19 22 23 24 60 26 1 2 3 5 5 6 7 7 9 9 10 23 27 0 1 1 2 2 3 3 3 3 3 4 9 28 0 0 0 1 1 1 1 1 1 1 1 3 29 0 0 0 0 0 0 0 0 0 0 0 1 30 0 0 0 0 0 0 0 0 0 0 0 0 31 0 0 0 0 0 0 0 0 0 0 0 0
Qp 16 43 44 106 127 158 173 195 238 245 265 728
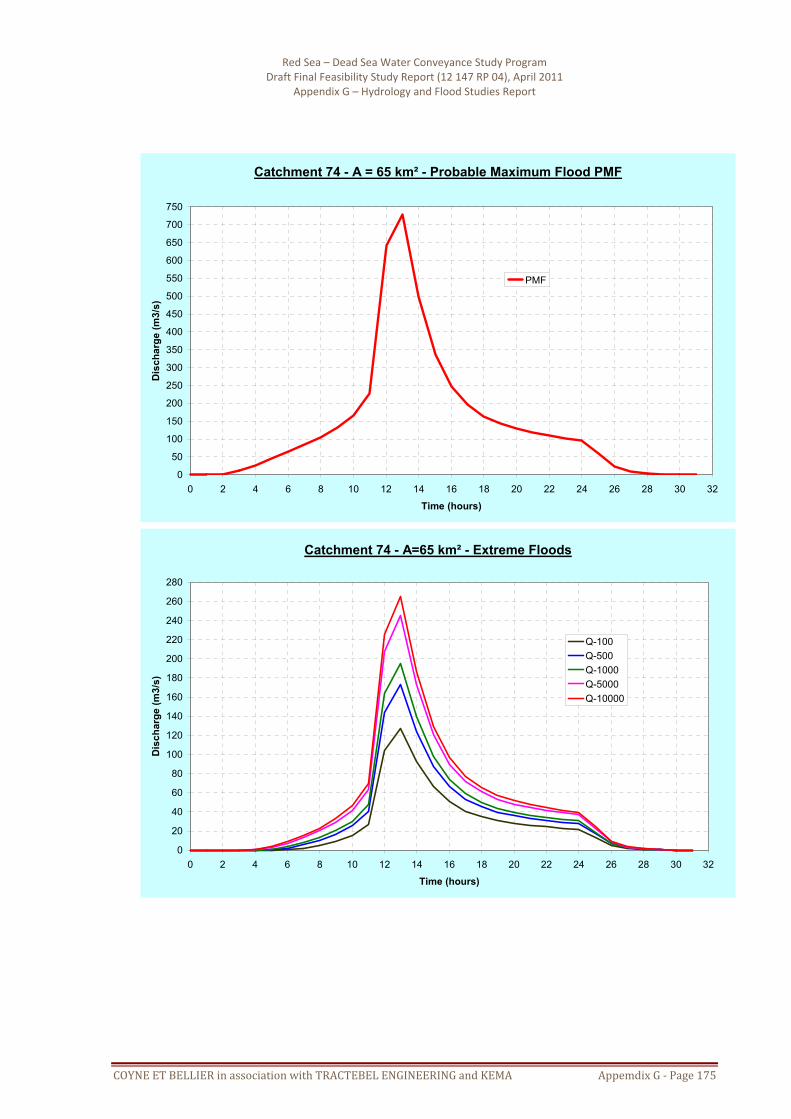
Red Sea – Dead Sea Water Conveyance Study Program Draft Final Feasibility Study Report (12 147 RP 04), April 2011
Appendix G – Hydrology and Flood Studies Report
COYNE ET BELLIER in association with TRACTEBEL ENGINEERING and KEMA Appemdix G ‐ Page 175
Catchment 74 - A = 65 km² - Probable Maximum Flood PMF
0
50
100
150
200
250
300
350
400
450
500
550
600
650
700
750
0 2 4 6 8 10 12 14 16 18 20 22 24 26 28 30 32
Time (hours)
Dis
char
ge (m
3/s)
PMF
Catchment 74 - A=65 km² - Extreme Floods
0
20
40
60
80
100
120
140
160
180
200
220
240
260
280
0 2 4 6 8 10 12 14 16 18 20 22 24 26 28 30 32
Time (hours)
Dis
char
ge (m
3/s)
Q-100Q-500Q-1000Q-5000Q-10000

Red Sea – Dead Sea Water Conveyance Study Program Draft Final Feasibility Study Report (12 147 RP 04), April 2011
Appendix G – Hydrology and Flood Studies Report
COYNE ET BELLIER in association with TRACTEBEL ENGINEERING and KEMA Appemdix G ‐ Page 176
Catchment 89
t Q-2 Q-5 Q-10 Q-50 Q-100 Q-300 Q-500 Q-1000 Q-4000 Q-5000 Q-10000 PMF 0 0 0 0 0 0 0 0 0 0 0 0 0 1 0 0 0 0 0 0 0 0 0 0 0 0 2 0 0 0 0 0 0 0 0 0 0 0 0 3 0 0 0 0 0 0 0 0 0 0 0 1 4 0 0 0 0 0 0 0 0 0 0 0 10 5 0 0 0 0 0 0 0 0 0 0 0 31 6 0 0 0 0 0 0 0 0 1 1 1 59 7 0 0 0 0 0 0 0 1 4 4 6 92 8 0 0 0 0 0 3 3 5 11 11 14 131 9 0 0 0 1 2 8 9 13 22 23 28 178
10 0 0 0 5 8 18 20 26 40 41 48 242 11 0 0 2 14 21 37 41 50 71 73 83 350 12 7 27 46 102 127 175 195 223 284 293 323 1 039 13 19 63 101 202 244 323 360 407 507 523 572 1 710 14 21 60 92 174 208 268 299 336 413 426 464 1 334 15 19 49 72 131 155 198 220 245 299 308 334 933 16 16 38 55 97 114 143 159 176 213 220 238 645 17 14 31 45 76 89 110 123 137 164 169 182 486 18 12 27 37 63 73 89 99 110 131 135 146 381 19 11 23 32 53 62 75 84 93 110 113 122 315 20 10 21 29 47 54 66 73 81 96 99 106 271 21 9 19 26 42 48 58 65 71 84 87 93 236 22 9 17 24 38 44 53 59 65 77 79 85 215 23 8 16 22 36 41 49 55 60 71 73 79 198 24 8 15 21 33 38 46 51 56 66 68 73 184 25 6 12 16 26 30 35 39 43 51 53 56 142 26 3 6 8 13 15 18 20 22 26 27 29 73 27 2 3 4 6 7 9 10 11 13 13 14 35 28 1 1 2 3 3 4 4 5 6 6 6 16 29 0 1 1 1 2 2 2 2 3 3 3 8 30 0 0 0 1 1 1 1 1 1 1 1 3 31 0 0 0 0 0 0 0 0 1 1 1 1 32 0 0 0 0 0 0 0 0 0 0 0 0 Qp 21 63 101 202 244 323 360 407 507 523 572 1 710

Red Sea – Dead Sea Water Conveyance Study Program Draft Final Feasibility Study Report (12 147 RP 04), April 2011
Appendix G – Hydrology and Flood Studies Report
COYNE ET BELLIER in association with TRACTEBEL ENGINEERING and KEMA Appemdix G ‐ Page 177
Catchment 89 - A = 149 km² - Probable Maximum Flood PMF
0
150
300
450
600
750
900
1 050
1 200
1 350
1 500
1 650
1 800
0 2 4 6 8 10 12 14 16 18 20 22 24 26 28 30 32 34
Time (hours)
Dis
char
ge (m
3/s)
PMF
Catchment 89 - A=149 km² - Extreme Floods
0
100
200
300
400
500
600
0 2 4 6 8 10 12 14 16 18 20 22 24 26 28 30 32 34
Time (hours)
Dis
char
ge (m
3/s)
Q-100Q-500Q-1000Q-5000Q-10000
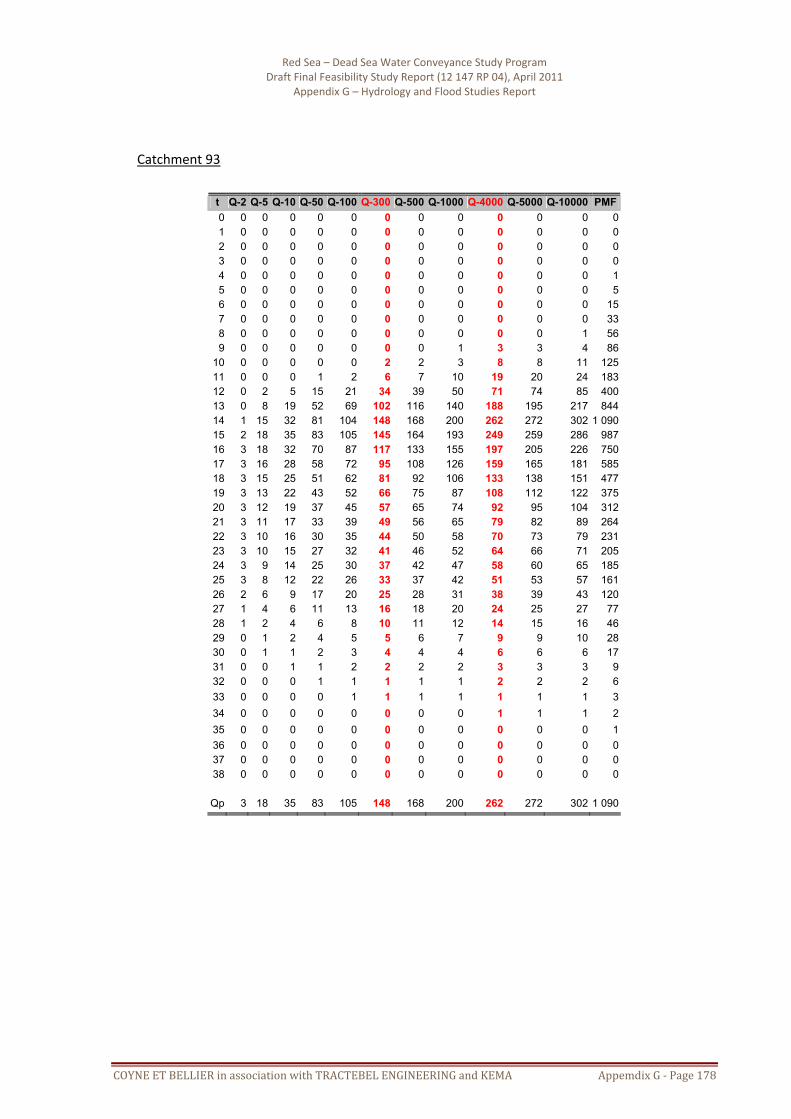
Red Sea – Dead Sea Water Conveyance Study Program Draft Final Feasibility Study Report (12 147 RP 04), April 2011
Appendix G – Hydrology and Flood Studies Report
COYNE ET BELLIER in association with TRACTEBEL ENGINEERING and KEMA Appemdix G ‐ Page 178
Catchment 93
t Q-2 Q-5 Q-10 Q-50 Q-100 Q-300 Q-500 Q-1000 Q-4000 Q-5000 Q-10000 PMF 0 0 0 0 0 0 0 0 0 0 0 0 0 1 0 0 0 0 0 0 0 0 0 0 0 0 2 0 0 0 0 0 0 0 0 0 0 0 0 3 0 0 0 0 0 0 0 0 0 0 0 0 4 0 0 0 0 0 0 0 0 0 0 0 1 5 0 0 0 0 0 0 0 0 0 0 0 5 6 0 0 0 0 0 0 0 0 0 0 0 15 7 0 0 0 0 0 0 0 0 0 0 0 33 8 0 0 0 0 0 0 0 0 0 0 1 56 9 0 0 0 0 0 0 0 1 3 3 4 86
10 0 0 0 0 0 2 2 3 8 8 11 125 11 0 0 0 1 2 6 7 10 19 20 24 183 12 0 2 5 15 21 34 39 50 71 74 85 400 13 0 8 19 52 69 102 116 140 188 195 217 844 14 1 15 32 81 104 148 168 200 262 272 302 1 090 15 2 18 35 83 105 145 164 193 249 259 286 987 16 3 18 32 70 87 117 133 155 197 205 226 750 17 3 16 28 58 72 95 108 126 159 165 181 585 18 3 15 25 51 62 81 92 106 133 138 151 477 19 3 13 22 43 52 66 75 87 108 112 122 375 20 3 12 19 37 45 57 65 74 92 95 104 312 21 3 11 17 33 39 49 56 65 79 82 89 264 22 3 10 16 30 35 44 50 58 70 73 79 231 23 3 10 15 27 32 41 46 52 64 66 71 205 24 3 9 14 25 30 37 42 47 58 60 65 185 25 3 8 12 22 26 33 37 42 51 53 57 161 26 2 6 9 17 20 25 28 31 38 39 43 120 27 1 4 6 11 13 16 18 20 24 25 27 77 28 1 2 4 6 8 10 11 12 14 15 16 46 29 0 1 2 4 5 5 6 7 9 9 10 28 30 0 1 1 2 3 4 4 4 6 6 6 17 31 0 0 1 1 2 2 2 2 3 3 3 9 32 0 0 0 1 1 1 1 1 2 2 2 6 33 0 0 0 0 1 1 1 1 1 1 1 3 34 0 0 0 0 0 0 0 0 1 1 1 2 35 0 0 0 0 0 0 0 0 0 0 0 1 36 0 0 0 0 0 0 0 0 0 0 0 0 37 0 0 0 0 0 0 0 0 0 0 0 0 38 0 0 0 0 0 0 0 0 0 0 0 0 Qp 3 18 35 83 105 148 168 200 262 272 302 1 090

Red Sea – Dead Sea Water Conveyance Study Program Draft Final Feasibility Study Report (12 147 RP 04), April 2011
Appendix G – Hydrology and Flood Studies Report
COYNE ET BELLIER in association with TRACTEBEL ENGINEERING and KEMA Appemdix G ‐ Page 179
Catchment 93 - A = 147 km² - Probable Maximum Flood PMF
0
100
200
300
400
500
600
700
800
900
1 000
1 100
0 2 4 6 8 10 12 14 16 18 20 22 24 26 28 30 32 34 36 38 40
Time (hours)
Dis
char
ge (m
3/s)
PMF
Catchment 93 - A=147 km² - Extreme Floods
0
50
100
150
200
250
300
350
0 2 4 6 8 10 12 14 16 18 20 22 24 26 28 30 32 34 36 38 40
Time (hours)
Dis
char
ge (m
3/s)
Q-100Q-500Q-1000Q-5000Q-10000

Red Sea – Dead Sea Water Conveyance Study Program Draft Final Feasibility Study Report (12 147 RP 04), April 2011
Appendix G – Hydrology and Flood Studies Report
COYNE ET BELLIER in association with TRACTEBEL ENGINEERING and KEMA Appemdix G ‐ Page 180
Catchment 115
t Q-2 Q-5 Q-10 Q-50 Q-100 Q-300 Q-500 Q-1000 Q-4000 Q-5000 Q-10000 PMF 0 0 0 0 0 0 0 0 0 0 0 0 0 1 0 0 0 0 0 0 0 0 0 0 0 0 2 0 0 0 0 0 0 0 0 0 0 0 0 3 0 0 0 0 0 0 0 0 0 0 0 1 4 0 0 0 0 0 0 0 0 0 0 0 4 5 0 0 0 0 0 0 0 0 0 0 0 12 6 0 0 0 0 0 0 0 0 0 0 0 21 7 0 0 0 0 0 0 0 0 1 1 1 31 8 0 0 0 0 0 1 1 1 3 3 4 43 9 0 0 0 0 0 2 2 3 7 7 8 60
10 0 0 0 1 2 5 6 8 12 12 15 84 11 0 0 0 4 7 12 13 17 23 24 28 131 12 3 18 30 68 88 116 129 151 190 196 215 710 13 5 25 40 85 108 141 156 181 223 230 252 797 14 4 18 28 55 68 87 96 111 136 140 152 464 15 3 12 18 34 42 53 59 67 82 84 91 269 16 3 9 13 23 29 35 39 45 53 55 60 173 17 2 7 10 17 21 26 29 32 39 40 43 122 18 2 6 8 14 17 21 23 26 30 31 34 95 19 2 5 7 12 14 17 19 21 25 26 28 76 20 1 4 6 10 12 14 16 18 21 22 24 67 21 1 4 5 9 11 14 15 17 19 20 22 60 22 1 4 5 8 10 12 13 15 17 18 20 54 23 1 3 5 8 9 11 12 14 16 17 18 50 24 1 3 4 7 9 11 12 13 16 16 17 46 25 1 2 3 4 5 6 7 8 10 10 10 28 26 0 1 1 2 2 3 3 3 4 4 4 11 27 0 0 0 1 1 1 1 1 1 1 2 4 28 0 0 0 0 0 0 0 0 1 1 1 2 29 0 0 0 0 0 0 0 0 0 0 0 1 30 0 0 0 0 0 0 0 0 0 0 0 0 31 0 0 0 0 0 0 0 0 0 0 0 0 Qp 5 25 40 85 108 141 156 181 223 230 252 797

Red Sea – Dead Sea Water Conveyance Study Program Draft Final Feasibility Study Report (12 147 RP 04), April 2011
Appendix G – Hydrology and Flood Studies Report
COYNE ET BELLIER in association with TRACTEBEL ENGINEERING and KEMA Appemdix G ‐ Page 181
Catchment 115 - A = 59 km² - Probable Maximum Flood PMF
050
100150200250300350400450500550600650700750800850
0 2 4 6 8 10 12 14 16 18 20 22 24 26 28 30 32
Time (hours)
Dis
char
ge (m
3/s)
PMF
Catchment 115 - A=59 km² - Extreme Floods
0
20
40
60
80
100
120
140
160
180
200
220
240
260
0 2 4 6 8 10 12 14 16 18 20 22 24 26 28 30 32
Time (hours)
Dis
char
ge (m
3/s)
Q-100Q-500Q-1000Q-5000Q-10000

Red Sea – Dead Sea Water Conveyance Study Program Draft Final Feasibility Study Report (12 147 RP 04), April 2011
Appendix G – Hydrology and Flood Studies Report
COYNE ET BELLIER in association with TRACTEBEL ENGINEERING and KEMA Appemdix G ‐ Page 182
Catchment 122
t Q-2 Q-5 Q-10 Q-50 Q-100 Q-300 Q-500 Q-1000 Q-4000 Q-5000 Q-10000 PMF 0 0 0 0 0 0 0 0 0 0 0 0 0 1 0 0 0 0 0 0 0 0 0 0 0 0 2 0 0 0 0 0 0 0 0 0 0 0 0 3 0 0 0 0 0 0 0 0 0 0 0 0 4 0 0 0 0 0 0 0 0 0 0 0 1 5 0 0 0 0 0 0 0 0 0 0 0 6 6 0 0 0 0 0 0 0 0 0 0 0 14 7 0 0 0 0 0 0 0 0 0 0 0 24 8 0 0 0 0 0 0 0 0 1 1 1 38 9 0 0 0 0 0 0 0 1 3 3 4 55
10 0 0 0 0 0 3 3 4 8 8 10 80 11 0 0 0 1 3 7 8 11 17 18 21 124 12 1 8 16 40 54 76 85 99 129 134 149 539 13 3 20 38 85 111 151 169 193 247 256 281 943 14 4 19 33 69 88 118 132 149 188 195 213 687 15 4 14 24 49 62 80 90 102 127 132 144 448 16 3 11 18 34 42 54 61 68 84 87 95 286 17 3 9 14 25 31 39 44 50 61 63 68 203 18 2 7 11 20 24 30 34 38 46 48 52 150 19 2 6 9 16 20 25 28 31 37 38 42 118 20 2 5 8 14 17 20 23 26 31 32 35 98 21 2 5 7 12 14 18 20 22 26 27 30 82 22 2 4 6 11 13 16 18 20 24 25 26 73 23 1 4 6 10 12 14 16 18 21 22 24 67 24 1 4 5 9 11 13 15 17 20 21 22 62 25 1 3 4 7 8 11 12 13 15 16 17 47 26 1 1 2 4 4 5 6 7 8 8 9 24 27 0 1 1 2 2 3 3 3 4 4 4 12 28 0 0 0 1 1 1 1 1 2 2 2 5 29 0 0 0 0 0 1 1 1 1 1 1 3 30 0 0 0 0 0 0 0 0 0 0 0 1 31 0 0 0 0 0 0 0 0 0 0 0 0 32 0 0 0 0 0 0 0 0 0 0 0 0 Qp 4 20 38 85 111 151 169 193 247 256 281 943

Red Sea – Dead Sea Water Conveyance Study Program Draft Final Feasibility Study Report (12 147 RP 04), April 2011
Appendix G – Hydrology and Flood Studies Report
COYNE ET BELLIER in association with TRACTEBEL ENGINEERING and KEMA Appemdix G ‐ Page 183
Catchment 122 - A = 74 km² - Probable Maximum Flood PMF
0
100
200
300
400
500
600
700
800
900
1 000
0 2 4 6 8 10 12 14 16 18 20 22 24 26 28 30 32 34
Time (hours)
Dis
char
ge (m
3/s)
PMF
Catchment 122 - A=74 km² - Extreme Floods
0
50
100
150
200
250
300
0 2 4 6 8 10 12 14 16 18 20 22 24 26 28 30 32 34
Time (hours)
Dis
char
ge (m
3/s)
Q-100Q-500Q-1000Q-5000Q-10000

Red Sea – Dead Sea Water Conveyance Study Program Draft Final Feasibility Study Report (12 147 RP 04), April 2011
Appendix G – Hydrology and Flood Studies Report
COYNE ET BELLIER in association with TRACTEBEL ENGINEERING and KEMA Appemdix G ‐ Page 184
Catchment 123
t Q-2 Q-5 Q-10 Q-50 Q-100 Q-300 Q-500 Q-1000 Q-4000 Q-5000 Q-10000 PMF 0 0 0 0 0 0 0 0 0 0 0 0 0 1 0 0 0 0 0 0 0 0 0 0 0 0 2 0 0 0 0 0 0 0 0 0 0 0 0 3 0 0 0 0 0 0 0 0 0 0 0 0 4 0 0 0 0 0 0 0 0 0 0 0 1 5 0 0 0 0 0 0 0 0 0 0 0 7 6 0 0 0 0 0 0 0 0 0 0 0 22 7 0 0 0 0 0 0 0 0 0 0 0 48 8 0 0 0 0 0 0 0 0 0 0 1 85 9 0 0 0 0 0 0 0 1 3 3 5 132
10 0 0 0 0 0 2 2 4 11 11 15 194 11 0 0 0 1 2 8 9 13 26 27 34 286 12 0 2 6 20 30 52 59 71 105 109 127 632 13 0 9 25 74 102 154 176 205 281 292 331 1 335 14 1 17 43 118 157 227 259 298 397 413 465 1 737 15 2 21 48 121 159 223 254 290 380 395 442 1 576 16 3 22 46 109 140 191 218 247 320 333 371 1 274 17 3 21 41 91 115 154 176 199 255 265 294 976 18 4 19 36 78 98 129 147 165 210 218 241 780 19 4 18 32 67 83 108 123 138 173 180 199 627 20 4 16 29 58 72 93 106 118 148 154 169 522 21 4 15 26 52 64 81 92 103 128 133 146 443 22 4 14 24 47 57 72 82 92 113 118 129 385 23 4 13 22 43 52 65 74 83 102 106 116 341 24 4 13 21 39 48 60 68 76 92 96 105 308 25 4 11 19 35 43 53 60 67 82 85 93 270 26 3 9 14 27 33 40 46 51 62 65 71 204 27 2 6 9 18 21 26 30 33 40 42 46 132 28 1 4 6 11 13 16 18 20 25 26 28 81 29 1 2 3 6 8 10 11 12 14 15 17 48 30 0 1 2 4 5 6 7 7 9 9 10 30 31 0 1 1 2 3 4 4 4 6 6 6 18 32 0 0 1 1 2 2 2 3 3 3 4 11 33 0 0 0 1 1 1 1 2 2 2 2 6 34 0 0 0 0 1 1 1 1 1 1 1 4 35 0 0 0 0 0 0 0 1 1 1 1 2 36 0 0 0 0 0 0 0 0 0 0 0 1 37 0 0 0 0 0 0 0 0 0 0 0 0 38 0 0 0 0 0 0 0 0 0 0 0 0 39 0 0 0 0 0 0 0 0 0 0 0 0 Qp 4 22 48 121 159 227 259 298 397 413 465 1 737

Red Sea – Dead Sea Water Conveyance Study Program Draft Final Feasibility Study Report (12 147 RP 04), April 2011
Appendix G – Hydrology and Flood Studies Report
COYNE ET BELLIER in association with TRACTEBEL ENGINEERING and KEMA Appemdix G ‐ Page 185
Catchment 123 - A = 263 km² - Probable Maximum Flood PMF
0
150
300
450
600
750
900
1 050
1 200
1 350
1 500
1 650
1 800
1 950
0 2 4 6 8 10 12 14 16 18 20 22 24 26 28 30 32 34 36 38 40
Time (hours)
Dis
char
ge (m
3/s)
PMF
Catchment 123 - A=263 km² - Extreme Floods
0
50
100
150
200
250
300
350
400
450
500
0 2 4 6 8 10 12 14 16 18 20 22 24 26 28 30 32 34 36 38 40
Time (hours)
Dis
char
ge (m
3/s)
Q-100Q-500Q-1000Q-5000Q-10000

Red Sea – Dead Sea Water Conveyance Study Program Draft Final Feasibility Study Report (12 147 RP 04), April 2011
Appendix G – Hydrology and Flood Studies Report
COYNE ET BELLIER in association with TRACTEBEL ENGINEERING and KEMA Appemdix G ‐ Page 186
Catchment 133
t Q-2 Q-5 Q-10 Q-50 Q-100 Q-300 Q-500 Q-1000 Q-4000 Q-5000 Q-10000 PMF 0 0 0 0 0 0 0 0 0 0 0 0 0 1 0 0 0 0 0 0 0 0 0 0 0 0 2 0 0 0 0 0 0 0 0 0 0 0 0 3 0 0 0 0 0 0 0 0 0 0 0 1 4 0 0 0 0 0 0 0 0 0 0 0 5 5 0 0 0 0 0 0 0 0 0 0 0 10 6 0 0 0 0 0 0 0 0 0 0 0 15 7 0 0 0 0 0 0 0 0 1 1 1 22 8 0 0 0 0 0 1 1 1 2 2 3 30 9 0 0 0 0 0 2 2 3 5 5 6 40
10 0 0 0 1 2 4 4 5 9 9 10 56 11 0 0 0 4 5 8 9 12 16 17 19 87 12 2 14 25 57 65 87 97 112 140 144 160 518 13 3 15 26 55 63 81 91 105 129 133 147 457 14 2 10 16 31 35 45 50 57 69 71 79 235 15 2 6 10 19 21 26 29 33 40 41 45 131 16 1 5 7 13 14 18 20 22 27 28 30 85 17 1 4 5 10 11 13 15 17 20 21 23 63 18 1 3 4 8 9 11 12 13 16 16 18 49 19 1 3 4 7 8 9 10 12 14 14 15 42 20 1 2 3 6 7 8 9 10 13 13 14 37 21 1 2 3 5 6 7 8 9 11 11 12 34 22 1 2 3 5 6 7 8 9 10 10 11 31 23 1 2 3 5 5 6 7 8 10 10 10 28 24 1 2 3 4 5 6 7 7 9 9 10 27 25 0 1 1 2 2 3 3 4 5 5 5 14 26 0 0 0 1 1 1 1 1 1 1 2 4 27 0 0 0 0 0 0 0 0 0 0 0 1 28 0 0 0 0 0 0 0 0 0 0 0 0 29 0 0 0 0 0 0 0 0 0 0 0 0 30 0 0 0 0 0 0 0 0 0 0 0 0 Qp 3 15 26 57 65 87 97 112 140 144 160 518

Red Sea – Dead Sea Water Conveyance Study Program Draft Final Feasibility Study Report (12 147 RP 04), April 2011
Appendix G – Hydrology and Flood Studies Report
COYNE ET BELLIER in association with TRACTEBEL ENGINEERING and KEMA Appemdix G ‐ Page 187
Catchment 133 - A=34 km² - Probable Maximum Flood (PMF)
0
50
100
150
200
250
300
350
400
450
500
550
0 2 4 6 8 10 12 14 16 18 20 22 24 26 28 30
Time (hours)
Dis
char
ge (m
3/s)
PMF
Catchment 133 - A = 34 km² - Extreme Floods
0
20
40
60
80
100
120
140
160
180
0 2 4 6 8 10 12 14 16 18 20 22 24 26 28 30
Time (hours)
Dis
char
ge (m
3/s)
Q-100Q-500Q-1000Q-5000Q-10000
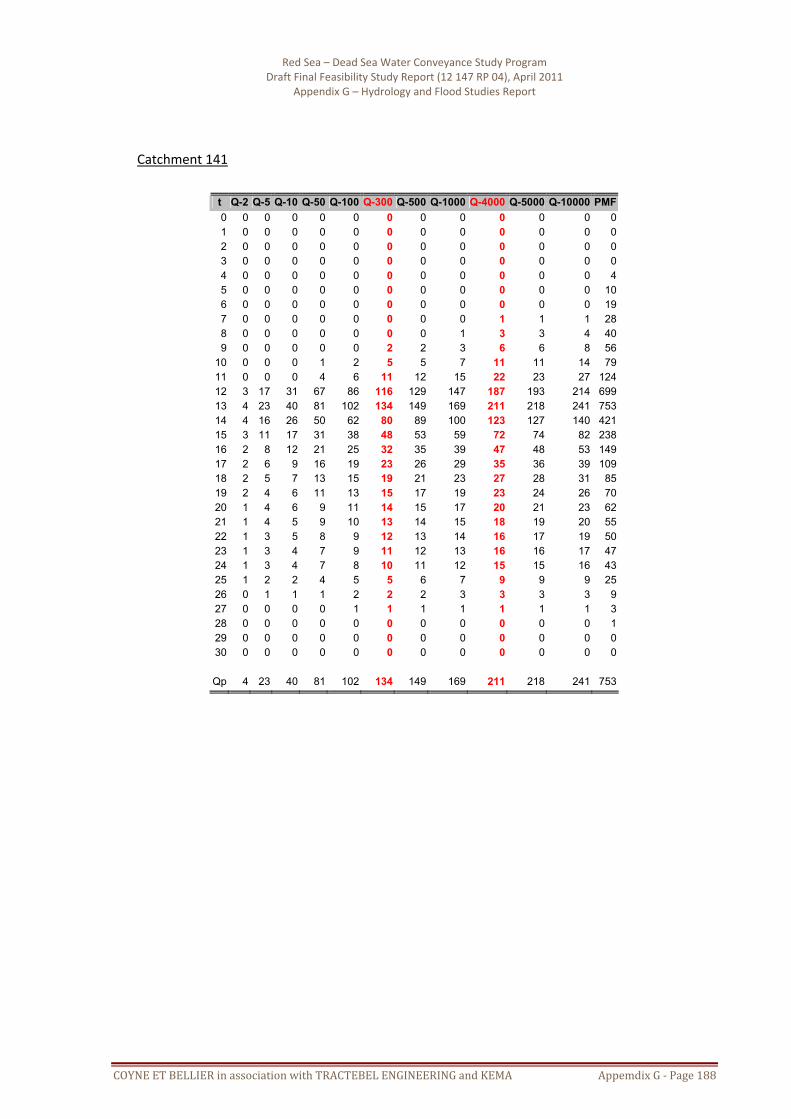
Red Sea – Dead Sea Water Conveyance Study Program Draft Final Feasibility Study Report (12 147 RP 04), April 2011
Appendix G – Hydrology and Flood Studies Report
COYNE ET BELLIER in association with TRACTEBEL ENGINEERING and KEMA Appemdix G ‐ Page 188
Catchment 141
t Q-2 Q-5 Q-10 Q-50 Q-100 Q-300 Q-500 Q-1000 Q-4000 Q-5000 Q-10000 PMF 0 0 0 0 0 0 0 0 0 0 0 0 0 1 0 0 0 0 0 0 0 0 0 0 0 0 2 0 0 0 0 0 0 0 0 0 0 0 0 3 0 0 0 0 0 0 0 0 0 0 0 0 4 0 0 0 0 0 0 0 0 0 0 0 4 5 0 0 0 0 0 0 0 0 0 0 0 10 6 0 0 0 0 0 0 0 0 0 0 0 19 7 0 0 0 0 0 0 0 0 1 1 1 28 8 0 0 0 0 0 0 0 1 3 3 4 40 9 0 0 0 0 0 2 2 3 6 6 8 56
10 0 0 0 1 2 5 5 7 11 11 14 79 11 0 0 0 4 6 11 12 15 22 23 27 124 12 3 17 31 67 86 116 129 147 187 193 214 699 13 4 23 40 81 102 134 149 169 211 218 241 753 14 4 16 26 50 62 80 89 100 123 127 140 421 15 3 11 17 31 38 48 53 59 72 74 82 238 16 2 8 12 21 25 32 35 39 47 48 53 149 17 2 6 9 16 19 23 26 29 35 36 39 109 18 2 5 7 13 15 19 21 23 27 28 31 85 19 2 4 6 11 13 15 17 19 23 24 26 70 20 1 4 6 9 11 14 15 17 20 21 23 62 21 1 4 5 9 10 13 14 15 18 19 20 55 22 1 3 5 8 9 12 13 14 16 17 19 50 23 1 3 4 7 9 11 12 13 16 16 17 47 24 1 3 4 7 8 10 11 12 15 15 16 43 25 1 2 2 4 5 5 6 7 9 9 9 25 26 0 1 1 1 2 2 2 3 3 3 3 9 27 0 0 0 0 1 1 1 1 1 1 1 3 28 0 0 0 0 0 0 0 0 0 0 0 1 29 0 0 0 0 0 0 0 0 0 0 0 0 30 0 0 0 0 0 0 0 0 0 0 0 0 Qp 4 23 40 81 102 134 149 169 211 218 241 753

Red Sea – Dead Sea Water Conveyance Study Program Draft Final Feasibility Study Report (12 147 RP 04), April 2011
Appendix G – Hydrology and Flood Studies Report
COYNE ET BELLIER in association with TRACTEBEL ENGINEERING and KEMA Appemdix G ‐ Page 189
Catchment 141 - A=54 km² - Probable Maximum Flood (PMF)
0
100
200
300
400
500
600
700
800
0 2 4 6 8 10 12 14 16 18 20 22 24 26 28 30
Time (hours)
Dis
char
ge (m
3/s)
PMF
Catchment 141 - A = 54 km² - Extreme Floods
0
50
100
150
200
250
0 2 4 6 8 10 12 14 16 18 20 22 24 26 28 30
Time (hours)
Dis
char
ge (m
3/s)
Q-100Q-500Q-1000Q-5000Q-10000

Red Sea – Dead Sea Water Conveyance Study Program Draft Final Feasibility Study Report (12 147 RP 04), April 2011
Appendix G – Hydrology and Flood Studies Report
COYNE ET BELLIER in association with TRACTEBEL ENGINEERING and KEMA Appemdix G ‐ Page 190
6.4. Supporting Document for Truce Canal Floods
131. 24‐hour Rainfall vs. Return Period. The following table details the 24‐hour rainfall taken into consideration for the hydrograph computations.
T Cat.0 Cat. 1a Cat. 1b Cat. 1c Cat. 2 Cat. 3 Cat. 4 Cat. 5 2 12,3 14,9 17,2 16,4 14,1 16,9 15,0 20,9 5 21,1 23,9 26,2 25,8 23,0 26,3 23,9 31,7 10 26,9 29,9 32,2 32,1 28,9 32,5 29,8 38,9 50 39,7 43,2 45,4 45,8 41,8 46,1 42,7 54,7
100 45,1 48,8 50,9 51,6 47,3 51,8 48,1 61,3 500 57,6 61,7 63,8 64,9 59,9 65,1 60,7 76,7
1 000 63,0 67,2 69,3 70,7 65,4 70,8 66,2 83,4 5 000 75,5 80,1 82,1 84,1 78,0 84,1 78,7 98,8 10 000 80,9 85,7 87,7 89,8 83,4 89,8 84,2 105,4 PMP 199 205 195 212 201 210 197 244
(mm/24 hr)

Red Sea – Dead Sea Water Conveyance Study Program Draft Final Feasibility Study Report (12 147 RP 04), April 2011
Appendix G – Hydrology and Flood Studies Report
COYNE ET BELLIER in association with TRACTEBEL ENGINEERING and KEMA Appemdix G ‐ Page 191
132. Flood Hydrographs – Catchment 0. For this subcatchment (main stream), there is no need to perform flood routing computations. The following table and graphs detail the obtained results.
t Q-2 Q-5 Q-10 Q-50 Q-100 Q-500 Q-1000 Q-5000 Q-10000 PMF 0 0 0 0 0 0 0 0 0 0 01 0 0 0 0 0 0 0 0 0 02 0 0 0 0 0 0 0 0 0 03 0 0 0 0 0 0 0 0 0 04 0 0 0 0 0 0 0 0 0 05 0 0 0 0 0 0 0 0 0 06 0 0 0 0 0 0 0 0 0 07 0 0 0 0 0 0 0 0 0 08 0 0 0 0 0 0 0 0 0 09 0 0 0 0 0 0 0 0 0 0
10 0 0 0 0 0 0 0 0 0 111 0 0 0 0 0 0 0 1 1 412 0 2 2 6 8 13 15 23 26 6913 1 4 6 14 18 29 35 51 59 15314 3 8 12 28 35 58 68 100 114 29715 5 17 24 55 69 114 134 194 220 57016 9 27 38 88 109 177 208 299 338 87517 13 39 55 123 152 246 288 412 464 1 19718 17 48 68 151 186 299 349 495 556 1 43219 20 57 80 174 215 342 398 561 630 1 61820 23 61 86 185 227 359 416 583 654 1 67721 24 63 88 187 229 359 415 578 647 1 65722 24 62 86 180 220 341 394 545 609 1 55723 24 61 84 173 210 324 374 514 573 1 46524 23 57 79 159 193 295 339 464 517 1 31825 22 54 74 149 180 273 314 428 476 1 21226 21 51 69 138 167 252 289 392 436 1 10927 20 47 64 126 152 229 262 355 393 1 00028 18 43 58 114 137 205 234 316 350 88929 16 39 53 102 123 184 210 283 313 79430 15 34 47 91 109 162 185 248 275 69831 13 30 41 78 94 140 160 214 237 60032 11 26 35 67 81 120 136 183 202 51233 9 22 30 57 68 101 115 153 170 43034 8 18 25 48 57 85 97 129 143 36235 7 15 21 40 48 71 81 108 120 30436 6 13 18 34 40 60 69 92 102 25837 5 11 15 28 34 51 58 77 85 21738 4 9 12 24 28 42 48 64 71 18139 3 8 10 20 24 35 40 53 59 14940 3 6 9 17 20 29 34 45 50 12641 2 5 7 14 17 25 28 38 42 10642 2 4 6 12 14 21 24 32 35 89

Red Sea – Dead Sea Water Conveyance Study Program Draft Final Feasibility Study Report (12 147 RP 04), April 2011
Appendix G – Hydrology and Flood Studies Report
COYNE ET BELLIER in association with TRACTEBEL ENGINEERING and KEMA Appemdix G ‐ Page 192
t Q-2 Q-5 Q-10 Q-50 Q-100 Q-500 Q-1000 Q-5000 Q-10000 PMF
43 2 4 5 10 12 17 20 26 29 7344 1 3 4 8 10 15 17 22 25 6245 1 3 4 7 8 12 14 19 21 5246 1 2 3 6 7 10 12 16 17 4447 1 2 3 5 6 9 10 13 14 3748 1 2 2 4 5 7 8 11 12 3149 1 1 2 3 4 6 7 9 10 2550 0 1 1 3 3 5 6 7 8 2151 0 1 1 2 3 4 5 6 7 1752 0 1 1 2 2 3 4 5 6 1453 0 1 1 1 2 2 3 4 4 1054 0 0 1 1 1 2 2 2 3 755 0 0 0 1 1 1 1 2 2 556 0 0 0 1 1 1 1 1 2 457 0 0 0 0 1 1 1 1 1 358 0 0 0 0 0 1 1 1 1 259 0 0 0 0 0 0 0 1 1 260 0 0 0 0 0 0 0 0 0 161 0 0 0 0 0 0 0 0 0 162 0 0 0 0 0 0 0 0 0 163 0 0 0 0 0 0 0 0 0 064 0 0 0 0 0 0 0 0 0 065 0 0 0 0 0 0 0 0 0 0
Sum 378 963 1 331 2 735 3 331 5 137 5 927 8 179 9 129 23 338V (m3) 1 360 518 3 467 403 4 791 592 9 847 592 11 990 244 18 492 358 21 338 875 29 442 666 32 863 656 84 016 831V/A (mm) 1,46 3,72 5,14 10,57 12,87 19,84 22,90 31,59 35,26 90,15Qp (m3/s) 24 63 88 187 229 359 416 583 654 1 677K(Qp) 0,81 1,66 1,94 2,59 2,76 3,15 3,28 3,57 3,67 4,48CN 90,50 87,30 85,00 83,00 82,00 81,00 80,50 80,25 80,00 63,00

Red Sea – Dead Sea Water Conveyance Study Program Draft Final Feasibility Study Report (12 147 RP 04), April 2011
Appendix G – Hydrology and Flood Studies Report
COYNE ET BELLIER in association with TRACTEBEL ENGINEERING and KEMA Appemdix G ‐ Page 193
Main Stream Nb 0 (932 km²) - Usual Floods
0
50
100
150
200
0 6 12 18 24 30 36 42 48 54 60 66 72
Time t (hours)
Dis
char
ge Q
(m3/
s)
Q-2Q-5Q-10Q-50
Main Stream Nb 0 (932 km²) - Extreme Floods
0
100
200
300
400
500
600
700
0 6 12 18 24 30 36 42 48 54 60 66 72
Time t (hours)
Dis
char
ge Q
(m3/
s)
Q-100Q-500Q-1000Q-5000Q-10000

Red Sea – Dead Sea Water Conveyance Study Program Draft Final Feasibility Study Report (12 147 RP 04), April 2011
Appendix G – Hydrology and Flood Studies Report
COYNE ET BELLIER in association with TRACTEBEL ENGINEERING and KEMA Appemdix G ‐ Page 194
133. Flood Hydrographs – Catchment 1a. See following tables and graphs.
A. Flood Hydrographs – Without Routing
t Q-2 Q-5 Q-10 Q-50 Q-100 Q-500 Q-1000 Q-5000 Q-10000 PMF 0 0 0 0 0 0 0 0 0 0 01 0 0 0 0 0 0 0 0 0 02 0 0 0 0 0 0 0 0 0 03 0 0 0 0 0 0 0 0 0 04 0 0 0 0 0 0 0 0 0 05 0 0 0 0 0 0 0 0 0 06 0 0 0 0 0 0 0 0 0 07 0 0 0 0 0 0 0 0 0 08 0 0 0 0 0 0 0 0 0 09 0 0 0 0 0 0 0 0 0 0
10 0 0 0 0 0 0 0 0 0 011 0 0 0 0 0 0 0 0 0 012 1 2 4 10 12 19 23 32 37 9213 3 9 15 35 44 68 80 111 130 32014 7 21 35 76 95 146 173 237 275 67915 12 37 61 132 165 251 296 405 469 1 15516 19 56 92 196 244 368 434 590 682 1 67617 26 72 116 241 299 447 525 710 817 2 00718 31 82 130 264 325 483 565 759 871 2 13619 33 85 132 262 322 473 551 736 841 2 05920 34 84 129 252 307 449 521 691 788 1 92721 33 81 122 235 285 413 478 632 717 1 75322 32 75 113 213 258 371 428 562 636 1 55323 31 71 105 196 236 338 389 508 574 1 40024 29 66 98 180 217 309 354 462 521 1 26925 27 61 89 163 196 277 318 412 463 1 12826 25 56 81 147 176 249 284 368 413 1 00527 23 50 73 131 157 220 251 324 363 88428 20 44 63 113 135 189 216 278 311 75629 17 37 53 95 113 159 181 233 260 63330 14 31 44 79 94 132 150 194 217 52631 11 24 35 63 75 105 119 153 171 41632 9 19 28 49 59 82 94 120 135 32733 7 15 22 39 46 65 74 95 106 25934 6 12 17 31 36 51 58 75 83 20335 4 9 14 24 29 40 46 59 66 16036 3 7 11 19 23 32 36 47 52 12737 3 6 8 15 18 25 29 37 41 10038 2 5 7 12 14 20 23 29 32 7939 2 4 5 9 11 16 18 23 26 6340 1 3 4 7 9 12 14 18 20 4941 1 2 3 6 7 10 11 14 16 3842 1 2 3 5 5 7 8 11 12 2943 1 1 2 3 4 5 6 7 8 2044 0 1 1 2 3 4 4 5 6 1545 0 1 1 2 2 3 3 4 4 1146 0 1 1 1 2 2 2 3 3 847 0 0 1 1 1 2 2 2 2 648 0 0 0 1 1 1 1 2 2 449 0 0 0 1 1 1 1 1 1 350 0 0 0 0 0 1 1 1 1 2

Red Sea – Dead Sea Water Conveyance Study Program Draft Final Feasibility Study Report (12 147 RP 04), April 2011
Appendix G – Hydrology and Flood Studies Report
COYNE ET BELLIER in association with TRACTEBEL ENGINEERING and KEMA Appemdix G ‐ Page 195
t Q-2 Q-5 Q-10 Q-50 Q-100 Q-500 Q-1000 Q-5000 Q-10000 PMF
51 0 0 0 0 0 0 0 1 1 152 0 0 0 0 0 0 0 0 0 153 0 0 0 0 0 0 0 0 0 054 0 0 0 0 0 0 0 0 0 055 0 0 0 0 0 0 0 0 0 0
Sum 473 1 133 1 720 3 309 4 027 5 843 6 767 8 952 10 176 24 880
V (m3) 1 701
198 4 078
917 6 190
55111 912
67214 498
94921 034
29124 359
814 32 225
768 36 635
25889 567
900V/A (mm) 1,21 2,90 4,40 8,46 10,30 14,94 17,30 22,89 26,02 63,61Qp (m3/s) 34 85 132 264 325 483 565 759 871 2 136K(Qp) 0,79 1,61 2,00 2,62 2,81 3,16 3,30 3,57 3,69 4,50CN 87,15 83,25 81,40 78,25 77,00 74,50 73,75 72,00 71,75 52,00
B. Floods Hydrographs Routed to Truce Canal
t Q-2 DS Q-5 DS Q-10 DS Q-50 DS Q-100 DS Q-500 DS Q-1000 DS Q-5000 DS Q-10000 DS PMF DS 0 0 0 0 0 0 0 0 0 0 01 0 0 0 0 0 0 0 0 0 02 0 0 0 0 0 0 0 0 0 03 0 0 0 0 0 0 0 0 0 04 0 0 0 0 0 0 0 0 0 05 0 0 0 0 0 0 0 0 0 06 0 0 0 0 0 0 0 0 0 07 0 0 0 0 0 0 0 0 0 08 0 0 0 0 0 0 0 0 0 09 0 0 0 0 0 0 0 0 0 0
10 0 0 0 0 0 0 0 0 0 011 0 0 0 0 0 0 0 0 0 012 0 0 0 0 0 0 0 0 0 013 0 0 0 0 0 0 0 0 0 014 0 1 2 4 6 9 11 15 17 4315 1 4 7 16 21 32 38 52 61 15116 3 10 17 38 48 74 87 120 140 34417 7 20 33 72 90 137 163 223 258 63618 11 32 52 111 138 209 247 336 389 95719 15 44 71 148 184 277 325 441 509 1 25120 20 54 86 177 219 327 383 517 595 1 46021 23 61 97 197 243 360 421 566 649 1 59122 26 67 104 208 256 377 440 588 673 1 65023 28 69 107 211 259 379 441 587 670 1 64124 28 70 107 209 255 372 431 573 652 1 59625 29 70 106 204 248 359 416 551 626 1 53026 29 68 103 195 237 342 396 521 591 1 44427 28 66 98 185 224 322 372 488 553 1 34928 27 63 93 174 210 300 346 453 512 1 24929 26 59 87 161 194 276 318 415 468 1 14130 24 54 80 146 176 250 287 374 422 1 02731 22 49 72 132 158 224 257 334 376 91632 20 43 64 116 139 197 226 293 330 80433 17 38 55 101 121 171 196 254 285 69434 15 33 48 87 104 147 168 217 244 59435 13 28 41 74 88 124 142 184 207 50336 11 24 34 62 74 105 120 155 174 42337 9 20 29 52 62 88 100 130 145 35338 8 17 24 43 52 73 83 108 121 29439 6 14 20 36 43 60 69 89 100 243

Red Sea – Dead Sea Water Conveyance Study Program Draft Final Feasibility Study Report (12 147 RP 04), April 2011
Appendix G – Hydrology and Flood Studies Report
COYNE ET BELLIER in association with TRACTEBEL ENGINEERING and KEMA Appemdix G ‐ Page 196
t Q-2 DS Q-5 DS Q-10 DS Q-50 DS Q-100 DS Q-500 DS Q-1000 DS Q-5000 DS Q-10000 DS PMF DS 40 5 11 16 30 35 50 57 74 82 20141 4 9 14 24 29 41 47 60 68 16542 4 8 11 20 24 34 38 50 55 13543 3 6 9 16 20 27 31 40 45 11044 2 5 7 13 16 22 25 33 36 8945 2 4 6 11 13 18 20 26 29 7146 2 3 5 9 10 14 16 21 23 5747 1 3 4 7 8 11 13 17 19 4548 1 2 3 5 6 9 10 13 15 3649 1 2 2 4 5 7 8 10 12 2850 1 1 2 3 4 6 6 8 9 2251 0 1 1 3 3 4 5 6 7 1752 0 1 1 2 2 3 4 5 6 1453 0 1 1 2 2 3 3 4 4 1154 0 0 1 1 1 2 2 3 3 855 0 0 1 1 1 2 2 2 3 6
Sum 472 1 133 1 720 3 310 4 029 5 846 6 771 8 957 10 184 24 898V (m3) 1 700 831 4 079 322 6 192 025 11 917 795 14 505 866 21 046 089 24 374 359 32 246 966 36 660 621 89 631 648V/A (mm) 1,21 2,90 4,40 8,46 10,30 14,95 17,31 22,90 26,04 63,66Qp (m3/s) 29 70 107 211 259 379 441 588 673 1 650K(Qp) 0,64 1,44 1,82 2,42 2,61 2,95 3,08 3,34 3,46 4,26
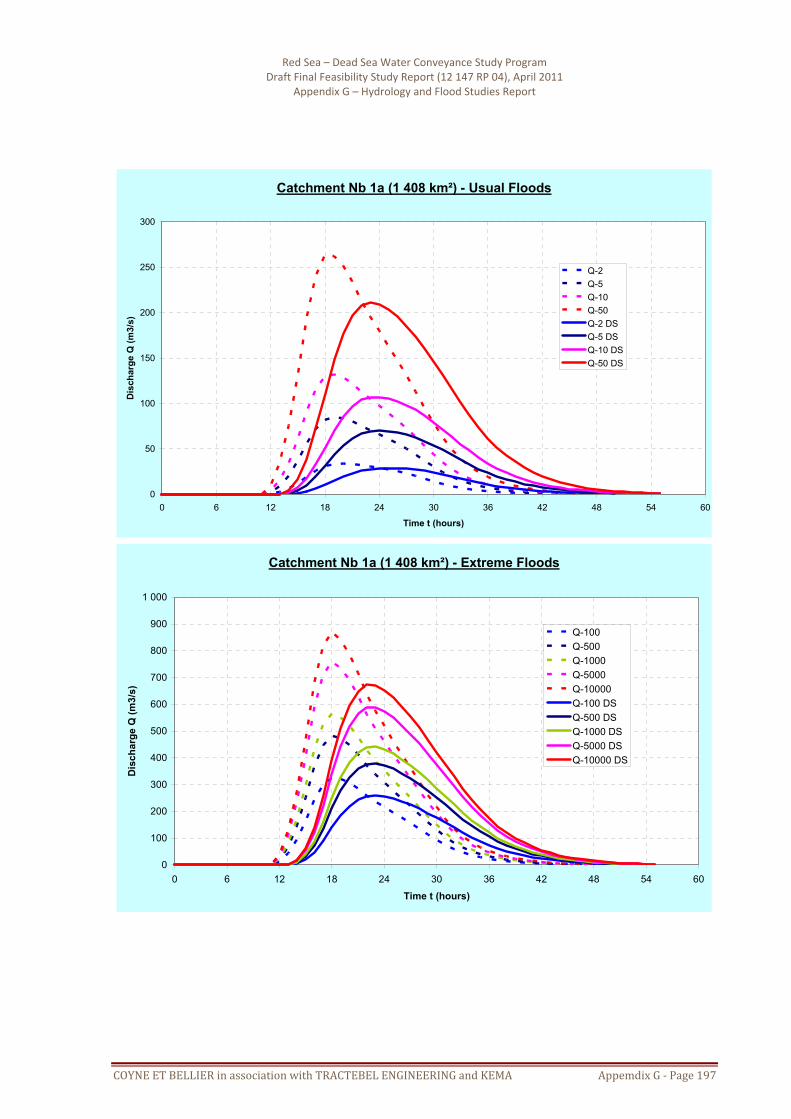
Red Sea – Dead Sea Water Conveyance Study Program Draft Final Feasibility Study Report (12 147 RP 04), April 2011
Appendix G – Hydrology and Flood Studies Report
COYNE ET BELLIER in association with TRACTEBEL ENGINEERING and KEMA Appemdix G ‐ Page 197
Catchment Nb 1a (1 408 km²) - Usual Floods
0
50
100
150
200
250
300
0 6 12 18 24 30 36 42 48 54 60
Time t (hours)
Dis
char
ge Q
(m3/
s)
Q-2Q-5Q-10Q-50Q-2 DSQ-5 DSQ-10 DSQ-50 DS
Catchment Nb 1a (1 408 km²) - Extreme Floods
0
100
200
300
400
500
600
700
800
900
1 000
0 6 12 18 24 30 36 42 48 54 60
Time t (hours)
Dis
char
ge Q
(m3/
s)
Q-100Q-500Q-1000Q-5000Q-10000Q-100 DSQ-500 DSQ-1000 DSQ-5000 DSQ-10000 DS
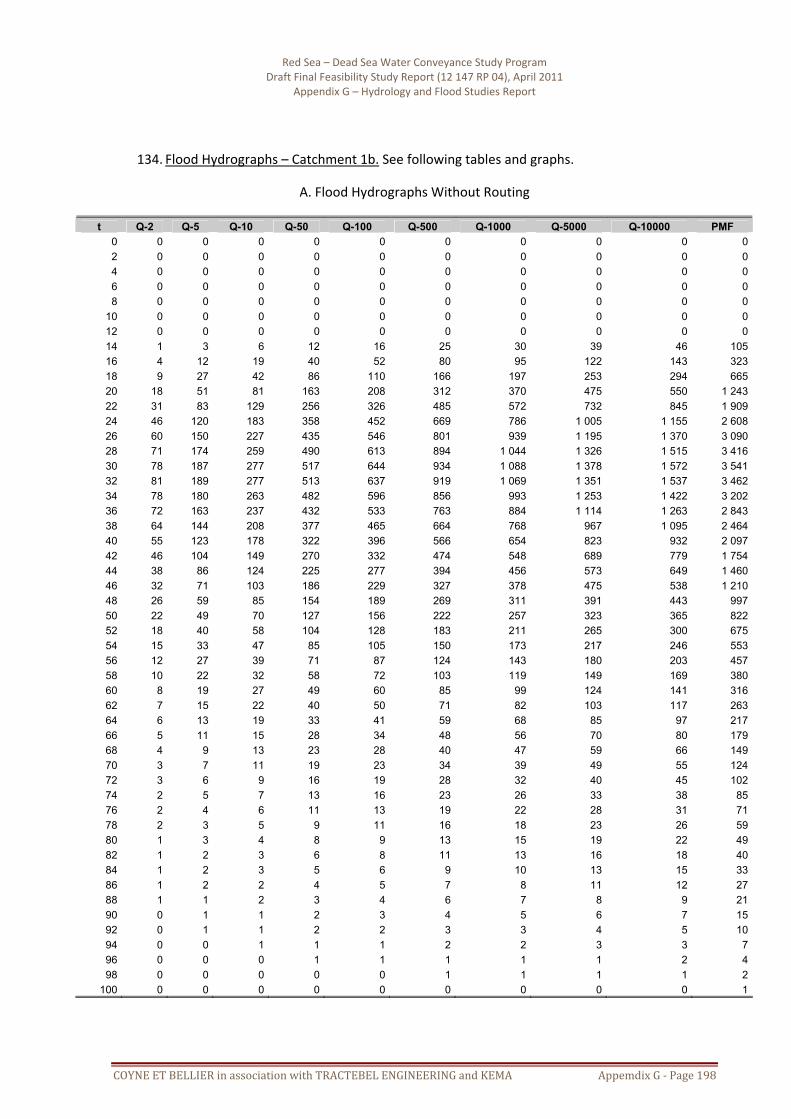
Red Sea – Dead Sea Water Conveyance Study Program Draft Final Feasibility Study Report (12 147 RP 04), April 2011
Appendix G – Hydrology and Flood Studies Report
COYNE ET BELLIER in association with TRACTEBEL ENGINEERING and KEMA Appemdix G ‐ Page 198
134. Flood Hydrographs – Catchment 1b. See following tables and graphs.
A. Flood Hydrographs Without Routing
t Q-2 Q-5 Q-10 Q-50 Q-100 Q-500 Q-1000 Q-5000 Q-10000 PMF 0 0 0 0 0 0 0 0 0 0 02 0 0 0 0 0 0 0 0 0 04 0 0 0 0 0 0 0 0 0 06 0 0 0 0 0 0 0 0 0 08 0 0 0 0 0 0 0 0 0 0
10 0 0 0 0 0 0 0 0 0 012 0 0 0 0 0 0 0 0 0 014 1 3 6 12 16 25 30 39 46 10516 4 12 19 40 52 80 95 122 143 32318 9 27 42 86 110 166 197 253 294 66520 18 51 81 163 208 312 370 475 550 1 24322 31 83 129 256 326 485 572 732 845 1 90924 46 120 183 358 452 669 786 1 005 1 155 2 60826 60 150 227 435 546 801 939 1 195 1 370 3 09028 71 174 259 490 613 894 1 044 1 326 1 515 3 41630 78 187 277 517 644 934 1 088 1 378 1 572 3 54132 81 189 277 513 637 919 1 069 1 351 1 537 3 46234 78 180 263 482 596 856 993 1 253 1 422 3 20236 72 163 237 432 533 763 884 1 114 1 263 2 84338 64 144 208 377 465 664 768 967 1 095 2 46440 55 123 178 322 396 566 654 823 932 2 09742 46 104 149 270 332 474 548 689 779 1 75444 38 86 124 225 277 394 456 573 649 1 46046 32 71 103 186 229 327 378 475 538 1 21048 26 59 85 154 189 269 311 391 443 99750 22 49 70 127 156 222 257 323 365 82252 18 40 58 104 128 183 211 265 300 67554 15 33 47 85 105 150 173 217 246 55356 12 27 39 71 87 124 143 180 203 45758 10 22 32 58 72 103 119 149 169 38060 8 19 27 49 60 85 99 124 141 31662 7 15 22 40 50 71 82 103 117 26364 6 13 19 33 41 59 68 85 97 21766 5 11 15 28 34 48 56 70 80 17968 4 9 13 23 28 40 47 59 66 14970 3 7 11 19 23 34 39 49 55 12472 3 6 9 16 19 28 32 40 45 10274 2 5 7 13 16 23 26 33 38 8576 2 4 6 11 13 19 22 28 31 7178 2 3 5 9 11 16 18 23 26 5980 1 3 4 8 9 13 15 19 22 4982 1 2 3 6 8 11 13 16 18 4084 1 2 3 5 6 9 10 13 15 3386 1 2 2 4 5 7 8 11 12 2788 1 1 2 3 4 6 7 8 9 2190 0 1 1 2 3 4 5 6 7 1592 0 1 1 2 2 3 3 4 5 1094 0 0 1 1 1 2 2 3 3 796 0 0 0 1 1 1 1 1 2 498 0 0 0 0 0 1 1 1 1 2
100 0 0 0 0 0 0 0 0 0 1

Red Sea – Dead Sea Water Conveyance Study Program Draft Final Feasibility Study Report (12 147 RP 04), April 2011
Appendix G – Hydrology and Flood Studies Report
COYNE ET BELLIER in association with TRACTEBEL ENGINEERING and KEMA Appemdix G ‐ Page 199
t Q-2 Q-5 Q-10 Q-50 Q-100 Q-500 Q-1000 Q-5000 Q-10000 PMF
102 0 0 0 0 0 0 0 0 0 0104 0 0 0 0 0 0 0 0 0 0106 0 0 0 0 0 0 0 0 0 0108 0 0 0 0 0 0 0 0 0 0110 0 0 0 0 0 0 0 0 0 0
Sum 934 2 203 3 246 6 037 7 506 10 858 12 638 15 993 18 219 41 051V (m3) 3 363 756 7 931 543 11 685 573 21 733 077 27 023 065 39 088 099 45 495 136 57 575 817 65 589 349 147 785 291V/A (mm) 0,93 2,20 3,24 6,02 7,49 10,83 12,61 15,96 18,18 40,96Qp (m3/s) 81 189 277 517 644 934 1 088 1 378 1 572 3 541K(Qp) 0,79 1,62 1,99 2,60 2,82 3,18 3,33 3,56 3,69 4,48CN 83,65 79,50 77,25 73,25 72,00 69,00 68,10 65,25 64,75 45,50
B. Flood Hydrographs Routed to Truce Canal
t Q-2 DS Q-5 DS Q-10 DS Q-50 DS Q-100 DS Q-500 DS Q-1000 DS Q-5000 DS Q-10000 DS PMF DS 0 0 0 0 0 0 0 0 0 0 02 0 0 0 0 0 0 0 0 0 04 0 0 0 0 0 0 0 0 0 06 0 0 0 0 0 0 0 0 0 08 0 0 0 0 0 0 0 0 0 0
10 0 0 0 0 0 0 0 0 0 012 0 0 0 0 0 0 0 0 0 014 0 0 0 0 0 0 0 0 0 016 0 0 0 0 0 0 0 0 0 018 0 1 1 3 4 6 7 9 11 2520 1 3 5 11 14 21 25 33 38 8722 3 9 15 31 40 60 72 93 108 24424 7 20 32 65 83 125 149 192 222 50326 13 37 58 116 148 221 262 336 388 87828 22 57 88 175 222 330 388 497 573 1 29530 31 80 121 237 299 441 518 662 760 1 71632 40 102 153 295 371 544 638 813 932 2 10234 49 121 181 344 431 629 736 936 1 070 2 41436 56 135 201 378 472 687 802 1 018 1 162 2 62038 60 143 212 396 493 715 833 1 055 1 203 2 71240 62 146 215 399 496 716 833 1 054 1 201 2 70542 61 143 211 389 483 696 809 1 023 1 164 2 62244 59 137 201 370 459 660 767 968 1 100 2 47846 56 129 188 345 427 614 712 899 1 021 2 29948 52 118 173 316 391 561 651 821 933 2 10050 47 107 156 286 353 507 588 741 841 1 89452 42 96 140 256 316 453 525 662 751 1 69154 38 86 124 227 280 401 465 586 665 1 49656 33 75 110 200 246 353 408 515 584 1 31458 29 66 96 174 215 308 357 449 509 1 14660 25 58 83 152 187 268 310 390 443 99662 22 50 72 131 162 232 269 338 383 86364 19 43 62 114 140 200 232 292 331 74466 16 37 54 98 120 172 199 251 285 64068 14 32 46 84 103 148 171 215 244 54970 12 27 40 72 88 126 146 184 209 47072 10 23 34 61 76 108 125 157 178 401

Red Sea – Dead Sea Water Conveyance Study Program Draft Final Feasibility Study Report (12 147 RP 04), April 2011
Appendix G – Hydrology and Flood Studies Report
COYNE ET BELLIER in association with TRACTEBEL ENGINEERING and KEMA Appemdix G ‐ Page 200
t Q-2 DS Q-5 DS Q-10 DS Q-50 DS Q-100 DS Q-500 DS Q-1000 DS Q-5000 DS Q-10000 DS PMF DS
74 9 20 29 52 64 92 106 134 152 34276 8 17 25 44 55 78 90 114 129 29078 6 14 21 38 46 66 77 97 110 24680 5 12 18 32 39 56 65 82 93 20982 5 10 15 27 33 48 55 69 79 17784 4 9 13 23 28 40 47 59 67 15086 3 7 11 19 24 34 39 50 56 12688 3 6 9 16 20 29 33 42 47 10790 2 5 8 14 17 24 28 35 40 9092 2 4 6 12 14 20 23 29 33 7594 2 4 5 10 12 17 19 24 28 6296 1 3 4 8 10 14 16 20 23 5198 1 2 4 6 8 11 13 16 18 41
100 1 2 3 5 6 9 10 13 15 33102 1 2 2 4 5 7 8 11 12 27104 1 1 2 3 4 6 7 8 10 21106 0 1 1 3 3 5 5 7 8 17108 0 1 1 2 3 4 4 5 6 14110 0 1 1 2 2 3 3 4 5 11
Sum 935 2 204 3 248 6 042 7 513 10 868 12 650 16 010 18 239 41 095V (m3) 3 364 301 7 935 479 11 692 863 21 750 583 27 046 535 39 125 397 45 540 351 57 635 162 65 659 201 147 943 732V/A (mm) 0,93 2,20 3,24 6,03 7,50 10,84 12,62 15,97 18,20 41,00Qp (m3/s) 62 146 215 399 496 716 833 1 055 1 203 2 712K(Qp) 0,53 1,36 1,74 2,35 2,56 2,92 3,07 3,30 3,43 4,22

Red Sea – Dead Sea Water Conveyance Study Program Draft Final Feasibility Study Report (12 147 RP 04), April 2011
Appendix G – Hydrology and Flood Studies Report
COYNE ET BELLIER in association with TRACTEBEL ENGINEERING and KEMA Appemdix G ‐ Page 201
Catchment Nb 1b (3 608 km²) - Usual Floods
0
50
100
150
200
250
300
350
400
450
500
550
0 6 12 18 24 30 36 42 48 54 60 66 72 78 84 90 96 102 108 114 120
Time t (hours)
Dis
char
ge Q
(m3/
s)
Q-2Q-5Q-10Q-50Q-2 DSQ-5 DSQ-10 DSQ-50 DS
Catchment Nb 1b (3 608 km²) - Extreme Floods
0
200
400
600
800
1 000
1 200
1 400
1 600
1 800
0 6 12 18 24 30 36 42 48 54 60 66 72 78 84 90 96 102 108 114 120
Time t (hours)
Dis
char
ge Q
(m3/
s)
Q-100Q-500Q-1000Q-5000Q-10000Q-100 DSQ-500 DSQ-1000 DSQ-5000 DSQ-10000 DS
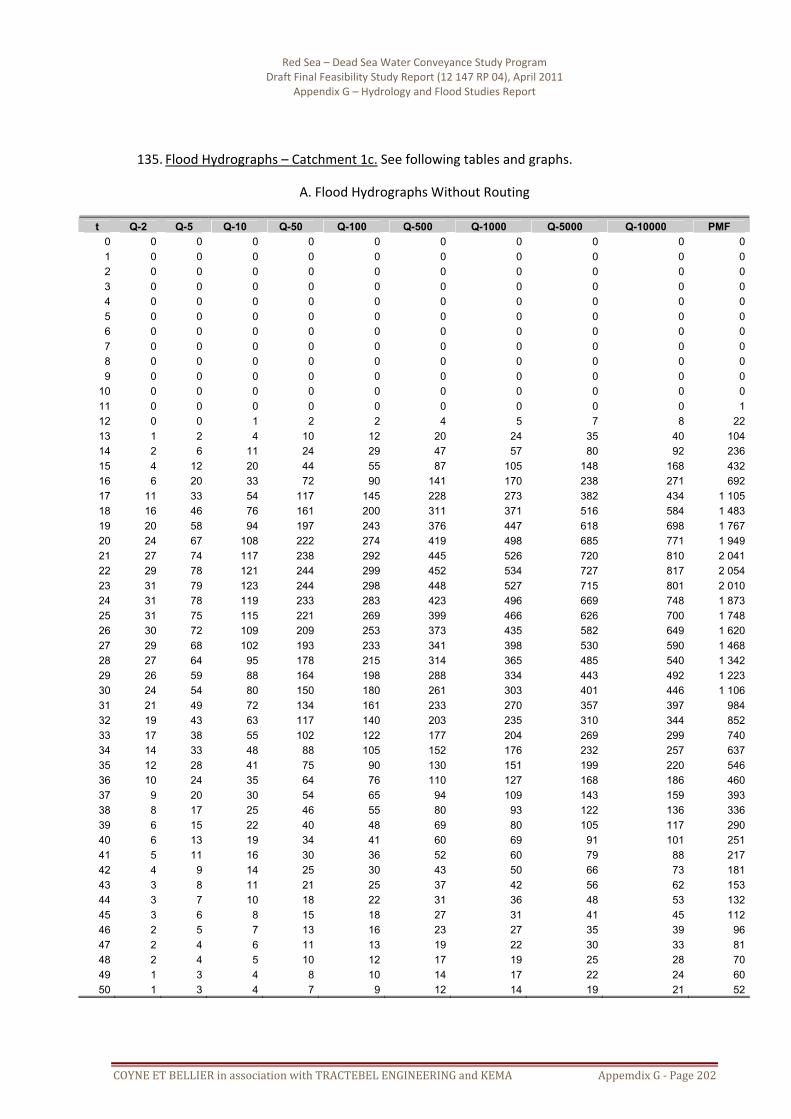
Red Sea – Dead Sea Water Conveyance Study Program Draft Final Feasibility Study Report (12 147 RP 04), April 2011
Appendix G – Hydrology and Flood Studies Report
COYNE ET BELLIER in association with TRACTEBEL ENGINEERING and KEMA Appemdix G ‐ Page 202
135. Flood Hydrographs – Catchment 1c. See following tables and graphs.
A. Flood Hydrographs Without Routing
t Q-2 Q-5 Q-10 Q-50 Q-100 Q-500 Q-1000 Q-5000 Q-10000 PMF 0 0 0 0 0 0 0 0 0 0 01 0 0 0 0 0 0 0 0 0 02 0 0 0 0 0 0 0 0 0 03 0 0 0 0 0 0 0 0 0 04 0 0 0 0 0 0 0 0 0 05 0 0 0 0 0 0 0 0 0 06 0 0 0 0 0 0 0 0 0 07 0 0 0 0 0 0 0 0 0 08 0 0 0 0 0 0 0 0 0 09 0 0 0 0 0 0 0 0 0 0
10 0 0 0 0 0 0 0 0 0 011 0 0 0 0 0 0 0 0 0 112 0 0 1 2 2 4 5 7 8 2213 1 2 4 10 12 20 24 35 40 10414 2 6 11 24 29 47 57 80 92 23615 4 12 20 44 55 87 105 148 168 43216 6 20 33 72 90 141 170 238 271 69217 11 33 54 117 145 228 273 382 434 1 10518 16 46 76 161 200 311 371 516 584 1 48319 20 58 94 197 243 376 447 618 698 1 76720 24 67 108 222 274 419 498 685 771 1 94921 27 74 117 238 292 445 526 720 810 2 04122 29 78 121 244 299 452 534 727 817 2 05423 31 79 123 244 298 448 527 715 801 2 01024 31 78 119 233 283 423 496 669 748 1 87325 31 75 115 221 269 399 466 626 700 1 74826 30 72 109 209 253 373 435 582 649 1 62027 29 68 102 193 233 341 398 530 590 1 46828 27 64 95 178 215 314 365 485 540 1 34229 26 59 88 164 198 288 334 443 492 1 22330 24 54 80 150 180 261 303 401 446 1 10631 21 49 72 134 161 233 270 357 397 98432 19 43 63 117 140 203 235 310 344 85233 17 38 55 102 122 177 204 269 299 74034 14 33 48 88 105 152 176 232 257 63735 12 28 41 75 90 130 151 199 220 54636 10 24 35 64 76 110 127 168 186 46037 9 20 30 54 65 94 109 143 159 39338 8 17 25 46 55 80 93 122 136 33639 6 15 22 40 48 69 80 105 117 29040 6 13 19 34 41 60 69 91 101 25141 5 11 16 30 36 52 60 79 88 21742 4 9 14 25 30 43 50 66 73 18143 3 8 11 21 25 37 42 56 62 15344 3 7 10 18 22 31 36 48 53 13245 3 6 8 15 18 27 31 41 45 11246 2 5 7 13 16 23 27 35 39 9647 2 4 6 11 13 19 22 30 33 8148 2 4 5 10 12 17 19 25 28 7049 1 3 4 8 10 14 17 22 24 6050 1 3 4 7 9 12 14 19 21 52

Red Sea – Dead Sea Water Conveyance Study Program Draft Final Feasibility Study Report (12 147 RP 04), April 2011
Appendix G – Hydrology and Flood Studies Report
COYNE ET BELLIER in association with TRACTEBEL ENGINEERING and KEMA Appemdix G ‐ Page 203
t Q-2 Q-5 Q-10 Q-50 Q-100 Q-500 Q-1000 Q-5000 Q-10000 PMF
51 1 2 3 6 7 11 12 16 18 4452 1 2 3 5 6 9 10 14 15 3853 1 2 2 4 5 8 9 12 13 3254 1 1 2 4 5 7 8 10 11 2855 1 1 2 3 4 6 6 8 9 2356 0 1 1 3 3 5 5 7 8 1957 0 1 1 2 3 4 4 6 6 1658 0 1 1 2 2 3 4 5 5 1359 0 1 1 1 2 2 3 3 4 960 0 0 1 1 1 2 2 2 3 761 0 0 0 1 1 1 1 2 2 562 0 0 0 1 1 1 1 1 2 463 0 0 0 0 1 1 1 1 1 364 0 0 0 0 0 1 1 1 1 265 0 0 0 0 0 0 0 1 1 266 0 0 0 0 0 0 0 0 1 167 0 0 0 0 0 0 0 0 0 168 0 0 0 0 0 0 0 0 0 169 0 0 0 0 0 0 0 0 0 070 0 0 0 0 0 0 0 0 0 071 0 0 0 0 0 0 0 0 0 072 0 0 0 0 0 0 0 0 0 0
Sum 521 1 299 1 984 3 869 4 706 7 020 8 237 11 115 12 440 31 164V (m3) 1 877 382 4 677 185 7 141 925 13 929 114 16 939 968 25 273 482 29 654 395 40 014 316 44 784 257 112 189 218V/A (mm) 1,46 3,65 5,57 10,86 13,20 19,70 23,11 31,19 34,91 87,44Qp (m3/s) 31 79 123 244 299 452 534 727 817 2 054K(Qp) 0,78 1,62 2,01 2,62 2,80 3,16 3,31 3,58 3,69 4,51CN 86,40 83,25 81,80 79,50 78,50 77,00 76,75 76,00 75,75 58,60
B. Flood Hydrographs Routed to Truce Canal
t Q-2 DS Q-5 DS Q-10 DS Q-50 DS Q-100 DS Q-500 DS Q-1000 DS Q-5000 DS Q-10000 DS PMF DS 0 0 0 0 0 0 0 0 0 0 01 0 0 0 0 0 0 0 0 0 02 0 0 0 0 0 0 0 0 0 03 0 0 0 0 0 0 0 0 0 04 0 0 0 0 0 0 0 0 0 05 0 0 0 0 0 0 0 0 0 06 0 0 0 0 0 0 0 0 0 07 0 0 0 0 0 0 0 0 0 08 0 0 0 0 0 0 0 0 0 09 0 0 0 0 0 0 0 0 0 0
10 0 0 0 0 0 0 0 0 0 011 0 0 0 0 0 0 0 0 0 012 0 0 0 0 0 0 0 0 0 013 0 0 0 1 1 1 1 2 2 614 0 1 1 3 4 6 7 11 12 3215 1 2 3 8 10 15 19 27 30 7816 1 4 7 15 19 31 37 52 59 15217 2 7 12 27 33 52 63 89 101 25818 4 12 21 45 56 87 105 147 167 42519 6 19 30 65 81 127 152 211 239 609

Red Sea – Dead Sea Water Conveyance Study Program Draft Final Feasibility Study Report (12 147 RP 04), April 2011
Appendix G – Hydrology and Flood Studies Report
COYNE ET BELLIER in association with TRACTEBEL ENGINEERING and KEMA Appemdix G ‐ Page 204
t Q-2 DS Q-5 DS Q-10 DS Q-50 DS Q-100 DS Q-500 DS Q-1000 DS Q-5000 DS Q-10000 DS PMF DS 20 9 25 41 86 107 165 197 274 310 78721 11 31 50 106 130 201 239 331 374 94622 13 37 59 123 151 232 276 380 428 1 08223 15 42 67 137 169 257 305 419 471 1 19024 17 47 73 149 182 277 328 449 504 1 27125 19 50 78 156 191 289 341 464 521 1 31226 20 52 81 161 196 296 349 474 532 1 33627 21 54 83 164 200 300 353 478 535 1 34428 22 55 84 164 200 299 351 474 531 1 33029 22 55 84 163 198 295 346 467 522 1 30830 22 54 83 160 195 290 339 457 511 1 27731 22 54 81 157 190 282 330 443 495 1 23732 21 52 79 151 183 271 317 426 475 1 18733 21 50 75 144 175 259 302 405 451 1 12734 20 48 72 137 166 245 286 382 427 1 06435 19 45 68 129 156 230 269 359 401 99936 18 42 64 121 146 215 251 336 374 93337 17 40 59 113 136 200 234 312 348 86638 15 37 55 105 126 186 217 289 322 80339 14 34 51 97 117 172 200 267 298 74240 13 32 47 89 108 159 185 246 275 68441 12 29 44 82 100 146 170 227 253 63042 11 27 40 76 92 134 157 209 232 57943 10 25 37 69 84 123 143 191 212 52944 10 23 34 64 77 112 131 174 194 48345 9 21 31 58 70 103 120 159 177 44146 8 19 28 53 64 94 109 145 161 40247 7 17 26 48 58 85 99 132 147 36648 7 16 23 44 53 77 90 120 133 33249 6 14 21 40 48 70 82 109 121 30150 5 13 19 36 44 64 74 99 110 27351 5 12 17 33 40 58 67 89 100 24852 5 11 16 30 36 52 61 81 90 22453 4 10 14 27 32 47 55 73 82 20354 4 9 13 24 29 43 50 66 74 18355 3 8 12 22 26 39 45 60 67 16656 3 7 11 20 24 35 41 54 60 14957 3 6 10 18 22 31 37 49 54 13458 2 6 9 16 19 28 33 44 49 12159 2 5 8 14 17 25 30 39 44 10960 2 5 7 13 16 23 26 35 39 9761 2 4 6 12 14 20 24 31 35 8762 2 4 6 10 12 18 21 28 31 7863 1 3 5 9 11 16 19 25 28 6964 1 3 4 8 10 15 17 22 25 6265 1 3 4 7 9 13 15 20 22 5566 1 2 4 7 8 12 14 18 20 4967 1 2 3 6 7 10 12 16 18 4468 1 2 3 5 6 9 11 14 16 3969 1 2 3 5 6 8 10 13 14 3570 1 2 2 4 5 7 9 11 13 3171 1 1 2 4 4 7 8 10 11 2872 1 1 2 3 4 6 7 9 10 25
Sum 517 1 289 1 969 3 842 4 673 6 973 8 182 11 041 12 358 30 961

Red Sea – Dead Sea Water Conveyance Study Program Draft Final Feasibility Study Report (12 147 RP 04), April 2011
Appendix G – Hydrology and Flood Studies Report
COYNE ET BELLIER in association with TRACTEBEL ENGINEERING and KEMA Appemdix G ‐ Page 205
Q-2 DS Q-5 DS Q-10 DS Q-50 DS Q-100 DS Q-500 DS Q-1000 DS Q-5000 DS Q-10000 DS PMF DS
V (m3) 1 862 179 4 641 818 7 089 478 13 831 077 16 821 947 25 101 298 29 454 374 39 748 996 44 489 368 111 457 905V/A (mm) 1,45 3,62 5,53 10,78 13,11 19,56 22,96 30,98 34,68 86,87Qp (m3/s) 22 55 84 164 200 300 353 478 535 1 344K(Qp) 0,48 1,29 1,66 2,26 2,44 2,80 2,94 3,21 3,31 4,13
Catchment Nb 1c (1 283 km²) - Usual Floods
0
50
100
150
200
250
300
0 6 12 18 24 30 36 42 48 54 60 66 72 78
Time t (hours)
Dis
char
ge Q
(m3/
s)
Q-2Q-5Q-10Q-50Q-2 DSQ-5 DSQ-10 DSQ-50 DS
Catchment Nb 1c (1 283 km²) - Extreme Floods
0
100
200
300
400
500
600
700
800
900
0 6 12 18 24 30 36 42 48 54 60 66 72 78
Time t (hours)
Dis
char
ge Q
(m3/
s)
Q-100Q-500Q-1000Q-5000Q-10000Q-100 DSQ-500 DSQ-1000 DSQ-5000 DSQ-10000 DS

Red Sea – Dead Sea Water Conveyance Study Program Draft Final Feasibility Study Report (12 147 RP 04), April 2011
Appendix G – Hydrology and Flood Studies Report
COYNE ET BELLIER in association with TRACTEBEL ENGINEERING and KEMA Appemdix G ‐ Page 206
136. Flood Hydrographs – Catchment 2. See following tables and graphs.
A. Flood Hydrographs Without Routing
t Q-2 Q-5 Q-10 Q-50 Q-100 Q-500 Q-1000 Q-5000 Q-10000 PMF 0 0 0 0 0 0 0 0 0 0 0 1 0 0 0 0 0 0 0 0 0 0 2 0 0 0 0 0 0 0 0 0 0 3 0 0 0 0 0 0 0 0 0 0 4 0 0 0 0 0 0 0 0 0 0 5 0 0 0 0 0 0 0 0 0 0 6 0 0 0 0 0 0 0 0 0 0 7 0 0 0 0 0 0 0 0 0 0 8 0 0 0 0 0 0 0 0 0 0 9 0 0 0 0 0 0 0 0 0 0
10 0 0 0 0 0 0 0 0 0 0 11 0 0 0 0 0 0 0 0 0 1 12 0 1 1 2 3 5 6 8 10 25 13 1 3 6 13 16 25 30 42 48 120 14 3 8 14 30 37 59 70 98 110 275 15 5 16 26 56 70 110 130 180 202 504 16 9 26 43 91 113 178 209 289 324 810 17 15 43 70 148 183 286 337 464 519 1 295 18 21 60 97 203 251 390 457 627 699 1 743 19 27 75 120 248 305 471 550 750 836 2 080 20 32 87 137 279 343 525 612 830 924 2 297 21 36 95 148 298 365 555 646 873 970 2 409 22 38 99 154 305 373 564 656 882 978 2 427 23 40 101 155 304 371 558 646 866 960 2 378 24 40 98 150 290 353 526 608 810 897 2 220 25 39 95 144 275 334 495 571 758 838 2 073 26 38 91 136 259 313 462 533 705 778 1 923 27 36 85 127 239 288 423 486 641 707 1 745 28 34 80 118 221 266 389 446 587 647 1 596 29 32 74 109 203 244 356 408 536 590 1 456 30 29 68 100 185 222 323 370 485 534 1 317 31 27 61 90 165 199 288 330 432 476 1 172 32 24 54 79 144 173 251 287 375 413 1 016 33 21 47 69 126 151 218 249 326 358 882 34 18 40 59 108 130 188 215 281 308 759 35 15 35 51 93 111 161 184 240 264 651 36 13 29 43 78 94 136 155 203 223 548 37 11 25 37 67 80 116 132 173 190 468 38 9 21 31 57 68 99 113 148 163 400 39 8 18 27 49 59 85 97 127 140 345 40 7 16 23 42 51 74 84 110 121 299 41 6 14 20 37 44 64 73 95 105 258 42 5 11 17 31 37 53 61 80 88 216 43 4 10 14 26 31 45 52 67 74 183 44 4 8 12 22 27 39 44 58 64 157 45 3 7 10 19 23 33 38 49 54 133 46 3 6 9 16 20 28 32 42 46 114 47 2 5 8 14 17 24 27 36 39 97 48 2 4 6 12 14 21 24 31 34 83 49 2 4 6 10 12 18 20 26 29 71 50 1 3 5 9 11 15 17 23 25 62 51 1 3 4 8 9 13 15 19 21 53

Red Sea – Dead Sea Water Conveyance Study Program Draft Final Feasibility Study Report (12 147 RP 04), April 2011
Appendix G – Hydrology and Flood Studies Report
COYNE ET BELLIER in association with TRACTEBEL ENGINEERING and KEMA Appemdix G ‐ Page 207
t Q-2 Q-5 Q-10 Q-50 Q-100 Q-500 Q-1000 Q-5000 Q-10000 PMF
52 1 2 3 6 8 11 13 17 18 45 53 1 2 3 5 7 10 11 14 16 39 54 1 2 3 5 6 8 9 12 13 33 55 1 1 2 4 5 7 8 10 11 27 56 1 1 2 3 4 6 7 8 9 23 57 0 1 2 3 3 5 5 7 8 19 58 0 1 1 2 3 4 4 6 6 15 59 0 1 1 2 2 3 3 4 5 11 60 0 1 1 1 1 2 2 3 3 8 61 0 0 1 1 1 2 2 2 2 6 62 0 0 0 1 1 1 1 2 2 5 63 0 0 0 1 1 1 1 1 1 4 64 0 0 0 0 1 1 1 1 1 3 65 0 0 0 0 0 1 1 1 1 2 66 0 0 0 0 0 0 0 1 1 1 67 0 0 0 0 0 0 0 0 0 1 68 0 0 0 0 0 0 0 0 0 1 69 0 0 0 0 0 0 0 0 0 0 70 0 0 0 0 0 0 0 0 0 0 71 0 0 0 0 0 0 0 0 0 0 72 0 0 0 0 0 0 0 0 0 0
Sum 666 1 642 2 492 4 816 5 853 8 729 10 093 13 466 14 906 36 904 V/A (mm) 1,44 3,56 5,40 10,43 12,68 18,91 21,86 29,17 32,29 79,94 Qp (m3/s) 40 101 155 305 373 564 656 882 978 2 427 K(Qp) 0,79 1,64 2,03 2,64 2,83 3,20 3,34 3,61 3,70 4,53 CN 88,62 85,40 83,90 81,50 80,50 79,00 78,50 77,50 77,00 59,00
B. Flood Hydrographs Routed to Truce Canal
t Q-2 DS Q-5 DS Q-10 DS Q-50 DS Q-100 DS Q-500 DS Q-1000 DS Q-5000 DS Q-10000 DS PMF DS
0 0 0 0 0 0 0 0 0 0 01 0 0 0 0 0 0 0 0 0 02 0 0 0 0 0 0 0 0 0 03 0 0 0 0 0 0 0 0 0 04 0 0 0 0 0 0 0 0 0 05 0 0 0 0 0 0 0 0 0 06 0 0 0 0 0 0 0 0 0 07 0 0 0 0 0 0 0 0 0 08 0 0 0 0 0 0 0 0 0 09 0 0 0 0 0 0 0 0 0 0
10 0 0 0 0 0 0 0 0 0 011 0 0 0 0 0 0 0 0 0 112 0 0 0 1 1 1 1 2 2 613 0 1 2 4 5 7 9 13 15 3714 1 3 5 12 15 24 29 40 45 11415 2 8 12 27 34 53 63 88 99 24816 5 14 23 50 62 98 115 160 179 44817 8 24 39 84 104 163 192 265 297 74318 13 38 61 129 160 250 294 404 452 1 12819 18 53 85 177 219 340 399 547 610 1 52120 24 67 107 221 272 420 491 670 746 1 858

Red Sea – Dead Sea Water Conveyance Study Program Draft Final Feasibility Study Report (12 147 RP 04), April 2011
Appendix G – Hydrology and Flood Studies Report
COYNE ET BELLIER in association with TRACTEBEL ENGINEERING and KEMA Appemdix G ‐ Page 208
T Q-2 DS Q-5 DS Q-10 DS Q-50 DS Q-100 DS Q-500 DS Q-1000 DS Q-5000 DS Q-10000 DS PMF DS
21 29 79 125 255 314 481 561 762 849 2 11022 33 88 138 279 342 521 607 822 913 2 26923 36 94 146 292 358 542 630 849 943 2 34024 38 97 150 295 361 543 630 846 938 2 32525 39 97 148 289 352 527 611 816 904 2 23826 39 95 144 278 338 503 582 774 857 2 11927 38 92 138 264 320 473 546 724 800 1 97928 37 87 130 247 298 440 506 669 739 1 82529 35 82 122 229 277 406 467 615 679 1 67530 33 77 113 212 255 373 428 563 621 1 53131 30 71 104 193 233 339 389 511 563 1 38832 28 64 94 174 209 305 349 458 504 1 24233 25 57 84 155 186 270 309 404 445 1 09534 22 50 74 136 163 236 270 353 389 95835 19 44 64 118 142 205 235 307 337 83136 17 38 56 102 122 177 202 264 290 71537 14 33 48 87 105 151 173 226 248 61138 12 28 41 74 89 129 148 193 212 52239 10 24 35 64 76 110 126 165 181 44740 9 20 30 55 66 95 108 142 156 38441 8 17 26 47 56 82 93 122 134 33142 7 15 22 40 48 70 80 105 115 28443 6 13 19 34 41 60 68 89 98 24144 5 11 16 29 35 51 58 76 83 20545 4 9 14 25 30 43 49 65 71 17546 3 8 12 21 25 37 42 55 61 14947 3 7 10 18 22 31 36 47 52 12748 3 6 8 15 19 27 31 40 44 10949 2 5 7 13 16 23 26 34 38 9350 2 4 6 11 14 20 23 29 32 8051 2 4 5 10 12 17 19 25 28 6852 1 3 5 8 10 14 17 22 24 5953 1 3 4 7 9 12 14 19 20 5054 1 2 3 6 7 11 12 16 17 4355 1 2 3 5 6 9 10 13 15 3756 1 2 2 4 5 8 9 11 13 3157 1 1 2 4 4 6 7 10 11 2658 1 1 2 3 4 5 6 8 9 2159 0 1 1 3 3 4 5 6 7 1760 0 1 1 2 2 3 4 5 5 1361 0 1 1 2 2 3 3 4 4 1062 0 0 1 1 1 2 2 3 3 863 0 0 1 1 1 2 2 2 2 664 0 0 0 1 1 1 1 2 2 565 0 0 0 1 1 1 1 1 1 366 0 0 0 0 0 1 1 1 1 367 0 0 0 0 0 1 1 1 1 268 0 0 0 0 0 0 0 1 1 1

Red Sea – Dead Sea Water Conveyance Study Program Draft Final Feasibility Study Report (12 147 RP 04), April 2011
Appendix G – Hydrology and Flood Studies Report
COYNE ET BELLIER in association with TRACTEBEL ENGINEERING and KEMA Appemdix G ‐ Page 209
T Q-2 DS Q-5 DS Q-10 DS Q-50 DS Q-100 DS Q-500 DS Q-1000 DS Q-5000 DS Q-10000 DS PMF DS
69 0 0 0 0 0 0 0 0 0 170 0 0 0 0 0 0 0 0 0 171 0 0 0 0 0 0 0 0 0 072 0 0 0 0 0 0 0 0 0 0
Sum 666 1 642 2 492 4 816 5 853 8 729 10 093 13 466 14 906 36 905V (Mm3) 2,40 5,91 8,97 17,34 21,07 31,42 36,34 48,48 53,66 132,86V/A (mm) 1,44 3,56 5,40 10,43 12,68 18,91 21,86 29,17 32,29 79,94Qp (m3/s) 39 97 150 295 361 543 630 849 943 2 340K(Qp) 0,77 1,60 2,00 2,61 2,80 3,17 3,30 3,57 3,67 4,50

Red Sea – Dead Sea Water Conveyance Study Program Draft Final Feasibility Study Report (12 147 RP 04), April 2011
Appendix G – Hydrology and Flood Studies Report
COYNE ET BELLIER in association with TRACTEBEL ENGINEERING and KEMA Appemdix G ‐ Page 210
Catchment Nb 2 (1 662 km²) - Usual Floods
0
50
100
150
200
250
300
350
0 6 12 18 24 30 36 42 48 54 60 66 72 78
Time t (hours)
Dis
char
ge Q
(m3/
s)
Q-2Q-5Q-10Q-50Q-2 DSQ-5 DSQ-10 DSQ-50 DS
Catchment Nb 2 (1 662 km²) - Extreme Floods
0
200
400
600
800
1 000
1 200
0 6 12 18 24 30 36 42 48 54 60 66 72 78
Time t (hours)
Dis
char
ge Q
(m3/
s)
Q-100Q-500Q-1000Q-5000Q-10000Q-100 DSQ-500 DSQ-1000 DSQ-5000 DSQ-10000 DS

Red Sea – Dead Sea Water Conveyance Study Program Draft Final Feasibility Study Report (12 147 RP 04), April 2011
Appendix G – Hydrology and Flood Studies Report
COYNE ET BELLIER in association with TRACTEBEL ENGINEERING and KEMA Appemdix G ‐ Page 211
137. Flood Hydrographs – Catchment 3. See following tables and graphs.
A. Flood Hydrographs Without Routing
t Q-2 Q-5 Q-10 Q-50 Q-100 Q-500 Q-1000 Q-5000 Q-10000 PMF 0 0 0 0 0 0 0 0 0 0 0 1 0 0 0 0 0 0 0 0 0 0 2 0 0 0 0 0 0 0 0 0 0 3 0 0 0 0 0 0 0 0 0 0 4 0 0 0 0 0 0 0 0 0 0 5 0 0 0 0 0 0 0 0 0 0 6 0 0 0 0 0 0 0 0 0 0 7 0 0 0 0 0 0 0 0 0 0 8 0 0 0 0 0 0 0 0 0 0 9 0 0 0 0 0 0 0 0 0 0
10 0 0 0 0 0 0 0 0 0 0 11 0 0 0 0 0 1 3 7 9 23 12 3 10 30 71 91 148 177 248 282 679 13 15 45 117 264 332 526 619 841 944 2 260 14 35 94 223 480 598 925 1 078 1 440 1 606 3 834 15 53 128 271 550 676 1 019 1 177 1 550 1 719 4 094 16 61 136 267 516 628 925 1 062 1 381 1 526 3 628 17 62 133 247 462 558 809 924 1 191 1 312 3 114 18 61 125 223 407 488 698 793 1 015 1 115 2 644 19 58 117 201 358 427 604 684 870 953 2 259 20 55 108 182 320 380 534 603 763 835 1 977 21 53 102 168 291 345 481 542 684 747 1 768 22 50 95 155 265 313 434 488 613 669 1 582 23 47 89 143 244 287 396 445 557 607 1 436 24 45 85 134 227 267 367 411 515 561 1 325 25 41 77 121 203 238 327 367 458 498 1 177 26 33 62 97 162 190 260 291 363 395 932 27 22 42 65 108 127 173 194 242 263 621 28 14 26 40 67 79 108 121 150 163 386 29 9 16 25 42 49 67 75 93 101 239 30 5 10 15 26 30 41 46 57 62 146 31 3 6 9 16 18 25 28 35 38 90 32 2 4 6 10 11 16 18 22 24 56 33 1 2 4 6 7 10 11 13 15 34 34 1 1 2 3 4 6 6 8 8 20 35 0 1 1 2 2 3 4 4 5 12 36 0 0 1 1 1 2 2 3 3 6 37 0 0 0 1 1 1 1 1 1 3 38 0 0 0 0 0 0 0 0 0 1 39 0 0 0 0 0 0 0 0 0 0
Sum 733 1 515 2 748 5 100 6 146 8 904 10 168 13 127 14 462 34 346 V (Mm3) 2,64 5,45 9,89 18,36 22,13 32,05 36,60 47,26 52,06 123,65 V/A (mm) 1,35 2,78 5,05 9,37 11,29 16,36 18,69 24,12 26,58 63,12 Qp (m3/s) 62 136 271 550 676 1 019 1 177 1 550 1 719 4 094 K(Qp) 1,07 1,79 2,42 3,08 3,27 3,64 3,78 4,03 4,13 4,93 CN 85,50 81,00 80,65 77,57 76,32 74,03 73,15 71,12 70,33 50,59
B.

Red Sea – Dead Sea Water Conveyance Study Program Draft Final Feasibility Study Report (12 147 RP 04), April 2011
Appendix G – Hydrology and Flood Studies Report
COYNE ET BELLIER in association with TRACTEBEL ENGINEERING and KEMA Appemdix G ‐ Page 212
Flood Hydrographs Routed to Truce Canal
t Q-2 DS Q-5 DS Q-10 DS Q-50 DS Q-100 DS Q-500 DS Q-1000 DS Q-5000 DS Q-10000 DS PMF DS0 0 0 0 0 0 0 0 0 0 01 0 0 0 0 0 0 0 0 0 02 0 0 0 0 0 0 0 0 0 03 0 0 0 0 0 0 0 0 0 04 0 0 0 0 0 0 0 0 0 05 0 0 0 0 0 0 0 0 0 06 0 0 0 0 0 0 0 0 0 07 0 0 0 0 0 0 0 0 0 08 0 0 0 0 0 0 0 0 0 09 0 0 0 0 0 0 0 0 0 0
10 0 0 0 0 0 0 0 0 0 011 0 0 0 0 0 0 0 0 0 012 0 0 0 1 1 3 4 7 8 2013 1 5 15 34 43 71 84 119 135 32514 8 23 60 135 170 270 319 435 489 1 17315 20 54 130 283 353 550 643 864 966 2 30816 34 85 190 396 490 748 869 1 153 1 283 3 06017 45 107 222 446 548 822 949 1 247 1 383 3 29318 53 118 232 452 551 814 936 1 221 1 350 3 21019 56 121 228 432 523 763 874 1 131 1 247 2 96320 57 119 216 400 481 695 792 1 019 1 120 2 65921 56 114 202 366 438 625 710 909 998 2 36622 55 109 187 333 398 563 638 812 890 2 10923 53 103 173 304 361 508 573 727 795 1 88224 50 97 160 278 329 460 518 654 714 1 69125 48 92 149 256 302 420 472 594 648 1 53326 45 85 137 233 274 379 426 535 583 1 37827 40 75 119 202 237 327 367 460 501 1 18328 32 60 96 161 190 261 292 366 398 94129 24 46 72 121 142 195 219 273 297 70230 18 33 52 87 102 140 157 196 213 50431 12 23 36 61 71 98 109 137 149 35132 9 16 25 41 49 67 75 93 101 23933 6 11 17 28 33 45 50 63 68 16134 4 7 11 19 22 30 33 42 45 10735 3 5 7 12 14 19 22 27 30 7036 2 3 5 8 9 13 14 17 19 4537 1 2 3 5 6 8 9 11 12 2938 1 1 2 3 4 5 6 7 7 1839 0 1 1 2 2 3 3 4 4 11
Sum 732 1 514 2 746 5 098 6 143 8 900 10 163 13 121 14 456 34 332V (Mm3) 2,64 5,45 9,89 18,35 22,12 32,04 36,59 47,24 52,04 123,59V/A (mm) 1,35 2,78 5,05 9,37 11,29 16,35 18,68 24,11 26,56 63,09Qp (m3/s) 57 121 232 452 551 822 949 1 247 1 383 3 293K(Qp) 0,99 1,68 2,28 2,90 3,08 3,45 3,58 3,83 3,93 4,73

Red Sea – Dead Sea Water Conveyance Study Program Draft Final Feasibility Study Report (12 147 RP 04), April 2011
Appendix G – Hydrology and Flood Studies Report
COYNE ET BELLIER in association with TRACTEBEL ENGINEERING and KEMA Appemdix G ‐ Page 213
Catchment Nb 3 (1 959 km²) - Usual Floods
0
50
100
150
200
250
300
350
400
450
500
550
600
0 6 12 18 24 30 36 42
Time t (hours)
Dis
char
ge Q
(m3/
s)
Q-2Q-5Q-10Q-50Q-2 DSQ-5 DSQ-10 DSQ-50 DS
Catchment Nb 3 (1 959 km²) - Extreme Floods
0
200
400
600
800
1 000
1 200
1 400
1 600
1 800
2 000
0 6 12 18 24 30 36 42
Time t (hours)
Dis
char
ge Q
(m3/
s)
Q-100Q-500Q-1000Q-5000Q-10000Q-100 DSQ-500 DSQ-1000 DSQ-5000 DSQ-10000 DS

Red Sea – Dead Sea Water Conveyance Study Program Draft Final Feasibility Study Report (12 147 RP 04), April 2011
Appendix G – Hydrology and Flood Studies Report
COYNE ET BELLIER in association with TRACTEBEL ENGINEERING and KEMA Appemdix G ‐ Page 214
138. Flood Hydrographs – Catchment 4. See following tables and graphs.
A. Flood Hydrographs Without Routing
t Q-2 Q-5 Q-10 Q-50 Q-100 Q-500 Q-1000 Q-5000 Q-10000 PMF 0 0 0 0 0 0 0 0 0 0 0 1 0 0 0 0 0 0 0 0 0 0 2 0 0 0 0 0 0 0 0 0 0 3 0 0 0 0 0 0 0 0 0 0 4 0 0 0 0 0 0 0 0 0 0 5 0 0 0 0 0 0 0 0 0 0 6 0 0 0 0 0 0 0 0 0 0 7 0 0 0 0 0 0 0 0 0 0 8 0 0 0 0 0 0 0 0 0 1 9 0 0 0 0 0 0 0 1 1 6
10 0 0 0 0 0 1 1 3 5 18 11 0 0 0 0 1 3 4 10 14 44 12 0 1 1 4 6 13 17 32 40 118 13 1 3 6 17 23 44 56 90 108 299 14 2 9 16 41 54 97 120 184 217 581 15 4 18 32 77 101 176 216 320 373 980 16 8 31 54 128 167 284 345 500 576 1 497 17 14 51 89 206 265 441 531 755 864 2 218 18 21 74 127 287 366 598 713 1 001 1 138 2 900 19 29 97 162 358 453 728 864 1 199 1 358 3 441 20 37 116 192 413 521 825 975 1 341 1 513 3 818 21 44 132 215 454 569 891 1 048 1 431 1 609 4 044 22 50 145 231 479 597 926 1 085 1 471 1 650 4 132 23 55 153 242 492 610 936 1 092 1 472 1 647 4 112 24 58 157 244 487 600 912 1 062 1 422 1 588 3 950 25 60 158 243 477 586 883 1 025 1 366 1 522 3 778 26 61 157 239 463 567 848 981 1 301 1 448 3 585 27 61 153 231 441 538 800 923 1 219 1 355 3 347 28 60 147 221 419 509 753 868 1 142 1 267 3 124 29 58 140 209 393 478 703 809 1 061 1 176 2 898 30 54 131 194 363 440 646 743 972 1 077 2 649 31 50 119 177 329 398 582 669 874 967 2 377 32 45 106 157 291 352 513 589 768 850 2 088 33 39 93 138 254 308 449 514 671 742 1 821 34 34 81 119 220 266 388 445 580 641 1 573 35 29 69 102 189 228 333 381 497 549 1 348 36 25 59 87 160 194 282 323 421 465 1 142 37 21 50 74 137 165 240 276 359 397 975 38 18 43 63 116 141 205 235 307 339 833 39 15 36 54 100 120 176 202 263 291 714 40 13 31 46 86 104 151 174 226 250 615 41 11 27 40 74 89 130 149 195 216 529 42 10 23 34 63 76 110 126 165 182 447 43 8 19 29 53 64 93 107 140 154 379 44 7 17 24 45 55 80 91 119 132 324 45 6 14 21 39 47 68 78 102 112 276 46 5 12 18 33 40 58 67 87 96 236 47 4 10 15 28 34 49 57 74 82 201 48 4 9 13 24 29 42 49 63 70 172 49 3 8 11 21 25 36 42 54 60 148

Red Sea – Dead Sea Water Conveyance Study Program Draft Final Feasibility Study Report (12 147 RP 04), April 2011
Appendix G – Hydrology and Flood Studies Report
COYNE ET BELLIER in association with TRACTEBEL ENGINEERING and KEMA Appemdix G ‐ Page 215
t Q-2 Q-5 Q-10 Q-50 Q-100 Q-500 Q-1000 Q-5000 Q-10000 PMF
50 3 7 10 18 22 31 36 47 52 128 51 2 6 8 15 18 27 31 40 44 109 52 2 5 7 13 16 23 26 34 38 93 53 2 4 6 11 13 20 22 29 32 80 54 1 3 5 9 11 17 19 25 27 67 55 1 3 4 8 10 14 16 21 23 57 56 1 2 4 7 8 12 14 18 19 48 57 1 2 3 6 7 10 11 15 16 39 58 1 2 3 5 6 8 9 12 13 32 59 1 1 2 4 4 6 7 9 10 25 60 1 1 2 3 3 5 6 7 8 19 61 0 1 1 2 3 4 4 6 6 15 62 0 1 1 2 2 3 3 4 5 12 63 0 1 1 1 2 2 3 3 4 9 64 0 0 1 1 1 2 2 3 3 7 65 0 0 0 1 1 1 2 2 2 5 66 0 0 0 1 1 1 1 1 2 4 67 0 0 0 0 0 1 1 1 1 3 68 0 0 0 0 0 0 1 1 1 2 69 0 0 0 0 0 0 0 0 0 1 70 0 0 0 0 0 0 0 0 0 0 71 0 0 0 0 0 0 0 0 0 0 72 0 0 0 0 0 0 0 0 0 0
Sum 1 044 2 738 4 230 8 366 10 316 15 681 18 266 24 537 27 448 68 490 V (Mm3) 3,76 9,86 15,23 30,12 37,14 56,45 65,76 88,33 98,81 246,56 V/A (mm) 1,50 3,94 6,09 12,04 14,84 22,56 26,28 35,30 39,49 98,55 Qp (m3/s) 61 158 244 492 610 936 1 092 1 472 1 650 4 132 K(Qp) 0,84 1,74 2,15 2,81 3,01 3,42 3,56 3,85 3,95 4,82 CN 87,9 85,4 84,3 82,70 82,11 81,45 81,32 81,01 80,97 66,54
B. Flood Hydrographs Routed to Truce Canal
t Q-2 DS Q-5 DS Q-10 DS Q-50 DS Q-100 DS Q-500 DS Q-1000 DS Q-5000 DS Q-10000 DS PMF DS0 0 0 0 0 0 0 0 0 0 01 0 0 0 0 0 0 0 0 0 02 0 0 0 0 0 0 0 0 0 03 0 0 0 0 0 0 0 0 0 04 0 0 0 0 0 0 0 0 0 05 0 0 0 0 0 0 0 0 0 06 0 0 0 0 0 0 0 0 0 07 0 0 0 0 0 0 0 0 0 08 0 0 0 0 0 0 0 0 0 19 0 0 0 0 0 0 0 1 1 6
10 0 0 0 0 0 1 1 3 5 1811 0 0 0 0 1 3 4 10 14 4412 0 1 2 5 7 14 18 31 37 10613 1 3 5 13 17 31 39 61 73 20014 2 6 11 26 35 61 76 116 136 36515 3 12 21 51 66 115 140 207 241 63616 5 20 35 82 107 181 220 320 370 96417 9 31 53 122 157 263 318 457 525 1 35918 13 45 78 178 228 377 453 643 735 1 88819 19 64 108 243 310 506 604 848 965 2 462

Red Sea – Dead Sea Water Conveyance Study Program Draft Final Feasibility Study Report (12 147 RP 04), April 2011
Appendix G – Hydrology and Flood Studies Report
COYNE ET BELLIER in association with TRACTEBEL ENGINEERING and KEMA Appemdix G ‐ Page 216
t Q-2 DS Q-5 DS Q-10 DS Q-50 DS Q-100 DS Q-500 DS Q-1000 DS Q-5000 DS Q-10000 DS PMF DS20 25 84 140 308 391 629 747 1 039 1 177 2 98921 32 102 169 365 461 733 867 1 196 1 351 3 41422 39 119 193 410 515 810 954 1 307 1 472 3 70523 45 132 213 444 554 863 1 014 1 379 1 550 3 88824 50 143 227 465 579 893 1 045 1 413 1 584 3 96225 54 149 234 472 584 892 1 041 1 399 1 565 3 90426 57 152 237 469 579 877 1 020 1 365 1 524 3 78927 59 153 235 460 566 851 987 1 314 1 464 3 63328 59 151 230 444 543 812 940 1 245 1 385 3 43029 59 146 221 423 516 767 886 1 170 1 300 3 21230 57 140 211 399 486 719 828 1 091 1 210 2 98531 54 132 198 373 453 667 768 1 008 1 117 2 75232 51 123 183 342 415 610 701 918 1 017 2 50333 47 112 166 309 374 548 629 822 910 2 23834 42 100 148 274 332 485 557 727 805 1 97735 37 88 130 241 292 426 488 637 705 1 73136 32 77 113 210 254 370 424 553 611 1 50137 28 66 98 180 218 318 364 475 525 1 28938 24 57 84 155 187 272 312 407 450 1 10439 21 49 72 132 160 233 267 348 385 94540 18 41 61 113 136 199 228 297 329 80741 15 35 52 97 117 170 196 255 282 69342 13 30 45 83 101 147 168 219 243 59643 11 26 38 71 86 125 143 187 207 50844 9 22 33 60 73 106 122 159 176 43245 8 19 28 51 62 91 104 136 150 36846 7 16 24 44 53 77 89 116 128 31447 6 14 20 37 45 66 76 99 109 26848 5 12 17 32 39 56 65 84 93 22949 4 10 15 27 33 48 55 72 80 19650 4 9 13 23 28 41 47 62 68 16751 3 7 11 20 24 35 41 53 59 14452 3 6 9 17 21 30 35 45 50 12353 2 5 8 15 18 26 30 39 43 10554 2 5 7 13 15 22 25 33 37 9055 2 4 6 11 13 19 22 28 31 7656 1 3 5 9 11 16 18 24 26 6557 1 3 4 8 9 13 15 20 22 5458 1 2 4 6 8 11 13 17 18 4559 1 2 3 5 6 9 11 14 15 3760 1 2 2 4 5 8 9 11 12 3061 1 1 2 4 4 6 7 9 10 2462 0 1 2 3 3 5 5 7 8 1963 0 1 1 2 3 4 4 5 6 1564 0 1 1 2 2 3 3 4 5 1165 0 1 1 1 2 2 3 3 4 966 0 0 1 1 1 2 2 3 3 767 0 0 0 1 1 1 1 2 2 568 0 0 0 1 1 1 1 1 2 469 0 0 0 0 0 1 1 1 1 370 0 0 0 0 0 0 1 1 1 271 0 0 0 0 0 0 0 0 0 172 0 0 0 0 0 0 0 0 0 0
Sum 1 044 2 737 4 227 8 359 10 307 15 667 18 250 24 517 27 428 68 447

Red Sea – Dead Sea Water Conveyance Study Program Draft Final Feasibility Study Report (12 147 RP 04), April 2011
Appendix G – Hydrology and Flood Studies Report
COYNE ET BELLIER in association with TRACTEBEL ENGINEERING and KEMA Appemdix G ‐ Page 217
Q-2 DS Q-5 DS Q-10 DS Q-50 DS Q-100 DS Q-500 DS Q-1000 DS Q-5000 DS Q-10000 DS PMF DS
V (Mm3) 3,76 9,85 15,22 30,09 37,11 56,40 65,70 88,26 98,74 246,41V/A (mm) 1,50 3,94 6,08 12,03 14,83 22,54 26,26 35,28 39,46 98,49Qp (m3/s) 59 153 237 472 584 893 1 045 1 413 1 584 3 962K(Qp) 0,81 1,71 2,12 2,77 2,97 3,37 3,52 3,81 3,91 4,78
Wadi Hasa Nb 4 (2 502 km²) - Usual Floods
0
50
100
150
200
250
300
350
400
450
500
550
0 6 12 18 24 30 36 42 48 54 60 66 72 78
Time t (hours)
Dis
char
ge Q
(m3/
s)
Q-2Q-5Q-10Q-50Q-2 DSQ-5 DSQ-10 DSQ-50 DS
Wadi Hasa Nb 4 (2 502 km²) - Extreme Floods
0
200
400
600
800
1 000
1 200
1 400
1 600
1 800
0 6 12 18 24 30 36 42 48 54 60 66 72 78
Time t (hours)
Dis
char
ge Q
(m3/
s)
Q-100Q-500Q-1000Q-5000Q-10000Q-100 DSQ-500 DSQ-1000 DSQ-5000 DSQ-10000 DS

Red Sea – Dead Sea Water Conveyance Study Program Draft Final Feasibility Study Report (12 147 RP 04), April 2011
Appendix G – Hydrology and Flood Studies Report
COYNE ET BELLIER in association with TRACTEBEL ENGINEERING and KEMA Appemdix G ‐ Page 218
Wadi Hasa Nb 4 (2 502 km²) - Probable Maximum Flood (PMF)
0
500
1 000
1 500
2 000
2 500
3 000
3 500
4 000
4 500
0 10 20 30 40 50 60 70 80
Time t (hours)
Dis
char
ge Q
(m3/
s)

Red Sea – Dead Sea Water Conveyance Study Program Draft Final Feasibility Study Report (12 147 RP 04), April 2011
Appendix G – Hydrology and Flood Studies Report
COYNE ET BELLIER in association with TRACTEBEL ENGINEERING and KEMA Appemdix G ‐ Page 219
139. Flood Hydrographs – Catchment 5. See following tables and graphs.
A. Flood Hydrographs Without Routing
t Q-2 Q-5 Q-10 Q-50 Q-100 Q-500 Q-1000 Q-5000 Q-10000 PMF 0 0 0 0 0 0 0 0 0 0 0 1 0 0 0 0 0 0 0 0 0 0 2 0 0 0 0 0 0 0 0 0 0 3 0 0 0 0 0 0 0 0 0 0 4 0 0 0 0 0 0 0 0 0 0 5 0 0 0 0 0 0 0 0 0 0 6 0 0 0 0 0 0 0 0 0 0 7 0 0 0 0 0 0 0 0 0 0 8 0 0 0 0 0 0 0 0 0 4 9 0 0 0 0 0 0 0 1 2 18
10 0 0 0 0 0 1 1 6 10 56 11 0 0 0 0 1 6 10 24 32 132 12 1 5 10 28 38 73 92 143 168 507 13 4 20 39 99 130 224 271 390 446 1 245 14 9 40 72 173 223 367 437 610 691 1 873 15 13 49 85 190 241 382 451 617 695 1 850 16 15 50 81 171 215 332 388 524 587 1 542 17 16 46 74 149 185 281 327 436 486 1 262 18 15 42 66 129 158 236 272 360 399 1 027 19 15 39 58 111 135 199 229 300 332 846 20 14 35 53 98 119 173 198 257 284 720 21 13 33 48 88 106 154 175 227 250 629 22 13 30 44 79 95 137 155 200 220 550 23 12 28 41 72 87 123 140 179 197 491 24 12 26 38 67 80 113 129 164 180 447 25 11 24 34 60 71 100 114 145 159 392 26 9 19 27 47 56 79 90 114 125 309 27 6 13 18 32 38 53 60 76 83 204 28 4 8 11 20 23 33 37 47 51 127 29 2 5 7 12 15 20 23 29 32 79 30 1 3 4 7 9 12 14 18 19 48 31 1 2 3 5 5 8 9 11 12 29 32 1 1 2 3 3 5 5 7 7 18 33 0 1 1 2 2 3 3 4 5 11 34 0 0 1 1 1 2 2 2 3 6 35 0 0 0 1 1 1 1 1 2 4 36 0 0 0 0 0 1 1 1 1 2 37 0 0 0 0 0 0 0 0 0 1 38 0 0 0 0 0 0 0 0 0 0 39 0 0 0 0 0 0 0 0 0 0
Sum 186 520 816 1 645 2 040 3 116 3 633 4 893 5 477 14 428 V (Mm3) 0,67 1,87 2,94 5,92 7,34 11,22 13,08 17,61 19,72 51,94 V/A (mm) 1,60 4,46 7,01 14,13 17,53 26,78 31,21 42,04 47,06 123,96 Qp (m3/s) 16 50 85 190 241 382 451 617 695 1 873 K(Qp) 1,07 2,00 2,43 3,08 3,27 3,64 3,78 4,03 4,13 4,93 CN 82,52 80,17 79,13 77,63 77,08 76,46 76,34 76,05 76,02 62,47
B.

Red Sea – Dead Sea Water Conveyance Study Program Draft Final Feasibility Study Report (12 147 RP 04), April 2011
Appendix G – Hydrology and Flood Studies Report
COYNE ET BELLIER in association with TRACTEBEL ENGINEERING and KEMA Appemdix G ‐ Page 220
Flood Hydrographs Routed to Truce Canal
t Q-2 DS Q-5 DS Q-10 DS Q-50 DS Q-100 DS Q-500 DS Q-1000 DS Q-5000 DS Q-10000 DS PMF DS0 0 0 0 0 0 0 0 0 0 01 0 0 0 0 0 0 0 0 0 02 0 0 0 0 0 0 0 0 0 03 0 0 0 0 0 0 0 0 0 04 0 0 0 0 0 0 0 0 0 05 0 0 0 0 0 0 0 0 0 06 0 0 0 0 0 0 0 0 0 07 0 0 0 0 0 0 0 0 0 08 0 0 0 0 0 0 0 0 0 49 0 0 0 0 0 0 0 1 2 18
10 0 0 0 0 0 1 1 6 10 5611 0 0 0 0 1 6 10 24 32 13212 0 0 1 2 3 10 15 31 41 15713 1 4 7 20 27 51 65 104 123 38214 2 13 25 65 85 148 180 262 302 85815 6 27 50 120 156 259 311 438 499 1 36916 10 38 67 154 197 318 377 523 591 1 59117 13 44 74 161 204 322 379 518 582 1 54818 14 45 73 154 193 298 349 471 528 1 38819 15 43 69 140 174 264 307 411 459 1 19420 15 41 63 125 153 230 266 352 391 1 01021 14 38 58 110 135 200 230 302 335 85822 14 35 52 99 120 175 201 262 290 73723 13 32 48 88 107 155 177 230 253 63924 13 30 44 80 96 138 158 203 224 56125 12 28 41 73 88 125 142 182 200 50026 11 26 37 66 78 111 126 161 177 44027 10 22 31 55 66 93 106 135 148 36728 8 17 24 43 51 72 81 103 113 28029 5 12 17 31 36 51 58 74 81 19930 4 8 12 21 25 35 40 50 55 13631 3 6 8 14 17 23 26 34 37 9132 2 4 5 9 11 15 17 22 24 5933 1 2 3 6 7 10 11 14 15 3834 1 2 2 4 4 6 7 9 10 2435 0 1 1 2 3 4 4 6 6 1536 0 1 1 1 2 2 3 3 4 937 0 0 1 1 1 1 2 2 2 638 0 0 0 0 1 1 1 1 1 339 0 0 0 0 0 0 1 1 1 2
Sum 186 519 816 1 645 2 042 3 126 3 650 4 936 5 536 14 671V (Mm3) 0,67 1,87 2,94 5,92 7,35 11,25 13,14 17,77 19,93 52,81V/A (mm) 1,60 4,46 7,01 14,13 17,54 26,86 31,36 42,41 47,56 126,05Qp (m3/s) 15 45 74 161 204 322 379 523 591 1 591K(Qp) 1,02 1,92 2,32 2,95 3,14 3,51 3,64 3,90 4,00 4,80

Red Sea – Dead Sea Water Conveyance Study Program Draft Final Feasibility Study Report (12 147 RP 04), April 2011
Appendix G – Hydrology and Flood Studies Report
COYNE ET BELLIER in association with TRACTEBEL ENGINEERING and KEMA Appemdix G ‐ Page 221
Catchment Nb 5 (419 km²) - Usual Floods
0
50
100
150
200
0 6 12 18 24 30 36 42
Time t (hours)
Dis
char
ge Q
(m3/
s)
Q-2Q-5Q-10Q-50Q-2 DSQ-5 DSQ-10 DSQ-50 DS
Catchment Nb 5 (419 km²) - Extreme Floods
0
100
200
300
400
500
600
700
800
0 6 12 18 24 30 36 42
Time t (hours)
Dis
char
ge Q
(m3/
s)
Q-100Q-500Q-1000Q-5000Q-10000Q-100 DSQ-500 DSQ-1000 DSQ-5000 DSQ-10000 DS
i Krichak, S.O., Alpert, P., Bassat, K. and Kunin, P. 2007. The surface climatology of the eastern Mediterranean region obtained in a three‐member ensemble climate change simulation experiment. Advances in Geosciences 12: 67‐80.
ii Tsvieli, Y and Zangvil, A. 2005. Synoptic climatological analysis of ‘wet and ‘dry’ Red Sea Troughs over Israel. International Journal of Climatology 25: 1997‐2015.
iii Krichak, S. O., Alpert, P. and Kunin, P. 2009. Numerical simulation of seasonal distribution of precipitation over the eastern Mediterranean with a RCM. Climate Dynamics DOI 10.1007/s00382‐009‐0649‐x
iv Kahana, R., Ziv, B., Enzel, Y. and Dayan, U. 2002. Synoptic climatology of major floods in the Negev Desert, Israel. International Journal of Climatology 22: 867‐882.