3d public pipeline regulatory standards--a case study of
TRANSCRIPT

3D public pipeline regulatory standards--a case study of Taiwan
Scarlet Liu a* , Tony Li b a Law School, Nankai University, Tianjin 300071, China
b National Kaohsiung University of Applied Sciences, Kaohsiung 80778, Taiwan
*Corresponding author: Scarlet Liu, PhD, [email protected]
Abstract
Complex underground pipeline makes it difficult for management. In recent years, along with the
gradual implementation of various construction projects of the government, public underground
pipeline are constantly changed and expanded. Most pipelines are buried layer by layer. However,
currently they are presented in a 2D manner which is difficult to show their exact location and
properly manage. This paper hopes to adopt 3D GIS, propose regulatory standards and provisions for
3D pipeline, set up 3D pipeline system with standard procedures and verification mechanism via
project management and 3D geographic information technology. And it intends to establish effective
pipeline safety management regulations so as to maintain life and property safety of the public.
Key words: 3D GIS, pipeline verification procedures, support mechanism, project management
1 Introduction
Since the establishment of "Standards and Policies for Public Facility Pipeline Database" by
Land Resources Information System in 1998, Taiwan has started to promote national public
facility pipeline database. Construction and Planning Agency, Ministry of the Interior
cooperates the 10-year Plan of Land Resources Information System. Over the past decade, it
had provided great support to the governments and units in various regions, and set up
consistent "Common Specifications for Public Facility Pipeline Database Configuration" so
that each agency can follow and implement it and ensure to obtain quality outcomes.
Therefore, currently, more and more public facility pipeline databases as well as
corresponding management and supply systems are being developed and launched. Gradually,
consensus has been reached in terms of the promotion target. The system priority suggested
by Common Specifications has been considered as an indicator by the governments at county
and city levels 1.
Second International Conference on Economic and Business Management (FEBM 2017)
Copyright © 2017, the Authors. Published by Atlantis Press. This is an open access article under the CC BY-NC license (http://creativecommons.org/licenses/by-nc/4.0/).
Advances in Economics, Business and Management Research, volume 33
246

The differences in the outcomes promoted by the governments at county and city levels lie in
the facts that if system construction manufactures can fully understand their needs, and if the
governments can understand relevant data standards, regulations, and controlling points of
system supporting operations, summarize the characteristics of pipeline units, and design
feasible promotion procedures and mechanisms based on policy directions and targets, in
order to reach the final goals of promotion. If manufactures do not have the ability to verify
system quality, the most pressure of system failure will be borne by the undertakers.
Therefore, the professionalism of process planning is the key to the success policy and
supporting system 2-3.
2 3D pipeline application requirement and function analysis
Table 1 – Necessary functions of 3D pipeline geographic information system and the compliance of
agencies
No. Necessary Functions Taipei City New Taipei City Kaohsiung City
1 Terrain indigitation (e.g. orthoimage, DEM) Yes Yes Yes
2 Underground pipeline (transparent, see-through)
display Yes Yes Yes
3 3D model indigitation Yes Yes Yes
4 Mass data display performance Unknown Test of Banqiao
District
Test with >1.00 million
entries of information
5 Integration of 2D, 3D, and street view modes No Yes No
6 Dual window, synchronization and asynchronous
mode No No Yes
7 Digging engineering, digging simulation mode Yes Yes Yes
8 Accident simulation (gas leak, explosion) No No Yes
9 Ring field display and pipeline data analysis Only display Yes Yes
10 Pipeline conflict analysis No No Yes
11 3D graph-text inter-checking Yes Yes Yes
12 3D data note No Yes Yes
13 Pipeline pixel floating and positioning display No Yes No
14 Pipeline pixel engineering mark No Yes No
15 Pipeline GML read No Yes No
16 Direct link to ArcGIS Server spatial database Yes Yes Yes
Traditional 3D geographic information system is often positioned as simulation display.
Coupled with terrain features and models, the existing terrain is presented via simulation.
Advances in Economics, Business and Management Research, volume 33
247

Hence, it is attractive to present slopes, plains, and cities with small scale and wide range.
However, as 3D application requirements of pipeline data often must be shown with large
scale and closely related to data quality (e.g. diameter and depth), there are few cases in
domestic practice. And there are differences in target setting. Thus, this study, based on the
application characteristics of pipeline data, put forward the necessary characteristics of
demand, compare the current implementation progresses by agencies (At present, the agencies
which promote pilot 3D public facility pipeline geographic information system include Taipei
City, New Taipei City, and Kaohsiung City) to facilitate assessment and promotion 4-5. See
Table 1 for details.
3 Pipeline standard regulations and integration planning
3.1 Source of geographic images and application planning
This study collected information on public facility pipeline database and analyzed the
basic image resources of 3D pipeline geographic system planning in Taichung City, as
shown in Table 2.
In terms of the application of 3D public facility pipeline system, it will be key points to
be considered in future design and implementation to match basic images under different
scales with corresponding functions of pipelines, allow 3D pipeline system to meet
engineering practice, and meet system implementation performance.
Table 2 – List of basic image resources of Taichung City
No. Name of Spatial Data Units
1 1‰ numerical topographic map Department of Urban Development
2 Orthoimage Department of Urban Development
3 Administrative boundary images Civil Affairs Bureau
4 Road system images Construction Bureau
5 Building images Department of Urban Development
6 Images of important landmarks Research, Development and
Evaluation Commission
7 House number images Civil Affairs Bureau
8 3D key building model Information Center
Advances in Economics, Business and Management Research, volume 33
248
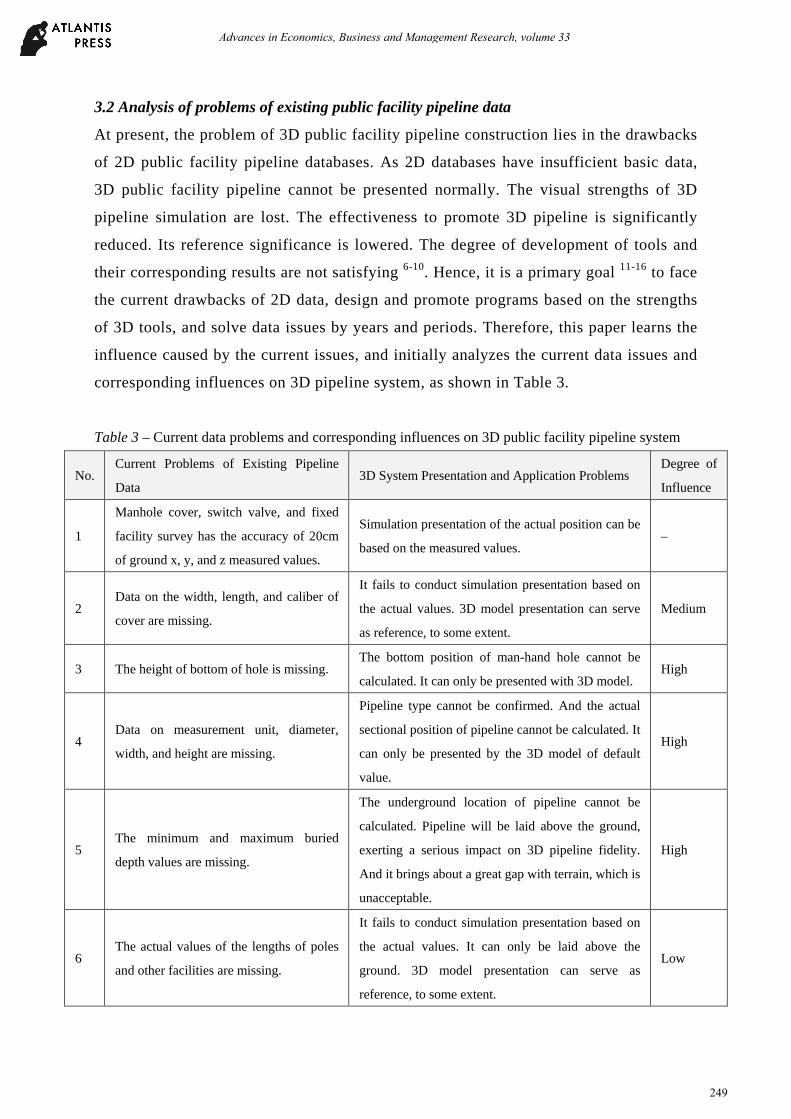
3.2 Analysis of problems of existing public facility pipeline data
At present, the problem of 3D public facility pipeline construction lies in the drawbacks
of 2D public facility pipeline databases. As 2D databases have insufficient basic data,
3D public facility pipeline cannot be presented normally. The visual strengths of 3D
pipeline simulation are lost. The effectiveness to promote 3D pipeline is significantly
reduced. Its reference significance is lowered. The degree of development of tools and
their corresponding results are not satisfying 6-10. Hence, it is a primary goal 11-16 to face
the current drawbacks of 2D data, design and promote programs based on the strengths
of 3D tools, and solve data issues by years and periods. Therefore, this paper learns the
influence caused by the current issues, and initially analyzes the current data issues and
corresponding influences on 3D pipeline system, as shown in Table 3.
Table 3 – Current data problems and corresponding influences on 3D public facility pipeline system
No. Current Problems of Existing Pipeline
Data 3D System Presentation and Application Problems
Degree of
Influence
1
Manhole cover, switch valve, and fixed
facility survey has the accuracy of 20cm
of ground x, y, and z measured values.
Simulation presentation of the actual position can be
based on the measured values. –
2 Data on the width, length, and caliber of
cover are missing.
It fails to conduct simulation presentation based on
the actual values. 3D model presentation can serve
as reference, to some extent.
Medium
3 The height of bottom of hole is missing. The bottom position of man-hand hole cannot be
calculated. It can only be presented with 3D model. High
4 Data on measurement unit, diameter,
width, and height are missing.
Pipeline type cannot be confirmed. And the actual
sectional position of pipeline cannot be calculated. It
can only be presented by the 3D model of default
value.
High
5 The minimum and maximum buried
depth values are missing.
The underground location of pipeline cannot be
calculated. Pipeline will be laid above the ground,
exerting a serious impact on 3D pipeline fidelity.
And it brings about a great gap with terrain, which is
unacceptable.
High
6 The actual values of the lengths of poles
and other facilities are missing.
It fails to conduct simulation presentation based on
the actual values. It can only be laid above the
ground. 3D model presentation can serve as
reference, to some extent.
Low
Advances in Economics, Business and Management Research, volume 33
249

As mentioned above, through large-scale survey and construction plan, the completeness
and correctness of the current 2D pipeline data still need to be improved. Due to the
underground characteristics of pipeline, data problem really affects the correct
presentation of 3D public pipeline data and system. Over the past few years,
Construction and Planning Agency, Ministry of the Interior cooperated with the
governments at county and city levels to control the source of new pipelines in pipeline
excavation engineering, ensure data integrity and correctness, and render smooth
follow-up 2D and 3D applications. The key controlling points of update and maintenance
mechanism for new pipeline engineering drawing are described as follows 17-22:
3.2.1 Accuracy of new and maintained pipelines (plane and elevation):
(1) TWD97 or TWD97 (2010) secondary zoning system shall be adopted as plane coordinate
system (The municipal government shall maintain and measure the coordinates based on the
overall basic drawing). With respect to elevation coordinates, TWVD2001 elevation control
system will be suitable.
(2) The allowable error of the measurement of the coordinates of hole cover center and fixed
facilities is 20cm. The allowable error of the measurement of the linear coordinate of pipeline
is 20cm. The allowable error of the measurement of the special lines along the turning parts of
pipeline is 30cm.
(3) elevation measurement of hole cover elevation and turning points (and branch points) of
pipeline shall be measured based on the wire points set up with the known controlling points
in an indirect manner. The allowable error of the elevation measurement is 20cm.
A. Regulations on the operation control before, during, and after construction, as well as digital photo shooting (as the basis for information visual inspection):
a. During construction, digital photos of construction site shall be shoot (The photos shall
include shooting time. Text and numbers shall be clearly displayed).
b. Digital photos shall clearly show the scope of construction. After pipeline is laid and before
backfill, pay close attention to measurement marks and engineering conditions. Photos shall
be classified into three major categories of those before construction (current situation),
during construction (including traffic maintenance, road section, excavation equipment,
excavation depth, pipe depth, and pipeline layout), and after construction (including backfill
recovery, tamping equipment, and sampling countersignature).
B. Regulations on property data configuration of onsite pipeline survey and measurement:
Advances in Economics, Business and Management Research, volume 33
250

a. Coordinates, elevation, category code, identifier, man-hand hole (and facility) number,
management unit, job distinction, depth of burying, and so on.
b. Pipeline: measurement unit, diameter, width, height, buried depths of the starting and end
points, and so on.
c. Hole cover and fixed facilities: site height, hole depth, cover width, cover length, body
diameter, depth of burying, and so on.
C. Regulations on the update and maintenance of images (operating methods, standard format conversion, and online update):
a. System-related function design: Verify data integrity.
b. Online update of SOP: Push pipeline units to operate according to standards
c. Incompliance with controlling measures: Punishment with scores deducted.
d. Submit data: Survey data and files, photos and description, and other supporting files.
To sum up, after the source control of the regulations on new pipeline engineering and
maintenance and update of support mechanism, the next step is to face the issue of
integrity and correctness of pipeline database of existing and buried pipelines. This is
also a key point to be promoted by Construction and Planning Agency, Ministry of the
Interior at the next stage. Hence, it is the challenge and key point of this study to propose
suitable pipeline data update program and support mechanism, properly manage the
characteristics of 3D pipeline geographic information system, and plan auxiliary
operating standards 23-26.
4 3D public pipeline data correction system and regulatory support mechanism planning
At present, counties and cities follow the policy direction proposed by Construction and
Planning Agency to investigate the original data provided by pipeline units. The units
that cannot provide property data or provide incomplete property data are listed. In light
of the analysis of the common quality issues reflected in six major pipelines, the
reliability of the key field property data of 3D pipeline is still low currently. It is
necessary to plan rigorous and feasible support mechanism and raise 3D pipeline system
to auxiliary analysis level for the application of subsequent pipeline units and approval
units. The poor quality of current pipeline data shall be gradually improved. The initial
planning is described as follows:
Advances in Economics, Business and Management Research, volume 33
251

4.1 Promote data integrity, develop correction system for existing pipeline, and reinforce
the correction of data by and control of pipeline units:
(1) The system requires pipeline unit to correct by themselves. And it shall record the update
of account authority. The results and progress of update of images by pipeline units shall be
tracked monthly. The key points of design and regulation are described as follows:
a. Pipeline units update and correct images and conduct regular self-supervision.
b. Supervision and tracking by management units: Excellent pipeline units shall be rewarded
as appropriate, while those getting slack shall be punished.
c. Establishment of close partnership among up, middle, and down streams: The supervised
and tracked data shall be regularly reported to Construction and Planning Agency.
(2) In line with 3D system, a set of 3D pipeline correction and management system shall be
created. 3D model shall support data correction.
(3) The existing pipeline data shall be verified. And conflicting modules shall be developed.
(4) The update and correction rates of images shall be checked by year and month. Statistics
of rate of reaching the standard and difference value shall be conducted and displayed via
figures.
(5) Two-stage correction model shall be designed. At the first stage, the missing properties
shall be added. And doubtful spatial data shall be confirmed. Relevant pipeline data shall be
extracted from exclusive image platforms. And each entry of data shall be reviewed. And
corresponding properties shall be corrected. The system shall record correction and
maintenance time and check integrity and logic rationality.
(6) At the second stage, in terms of doubtful spatial data, the pixel position of original
configuration data shall be locked and unchanged. The doubtful parts shall be confirmed. And
support mechanism shall be employed to correct follow-up data.
4.2 Design of support mechanism for data correctness:
In terms of doubtful data and setting of screening factors, through the conflict analysis
and presentation of 3D pipeline system, data correctness shall be gradually corrected.
The key points of the design of support mechanism are described as follows:
(1) Conflicting point first choice model shall be set up to gradually correct correctness.
(2) Design of screening factors for pipeline conflict analysis: The factors like pipeline basic
images, import road sections (width), and intersections, shall be set. 3D pipeline conflict
analysis shall be carried out for all pipeline images.
Advances in Economics, Business and Management Research, volume 33
252

(3) According to analysis result, the order of conflicting points shall be listed and provided to
the competent department to hold follow-up coordination meeting on conflicting data of
pipeline units and conduct data correction.
(4) The order of conflicting points can be analyzed based on the importance of factors. For
instance, the quantity of conflicts between important road sections and pipeline types can be
used for sorting.
(5) Demonstration area can be selected for pilot implementation to identify operating
bottleneck, which is beneficial for the improvement of operating procedures and follow-up
promotion of compliance by regions.
(6) Corrected conflicting data are feedback to pipeline data to serve as reference of
indigitation of follow-up pipeline image update.
5 Conclusions
Over the years, Construction and Planning Agency of Taiwan allocates funds to the
governments at county and city levels to construct pipeline data and system functions.
However, the effects are limited. Moreover, the undertakers of units do not have specialty in
IT. Pipeline management systems are still 2D. They fail to use information technology to
improve data quality. Let alone they can have the chance to review the preciseness of
engineering management regulations.
Laws and regulations are related to lives and property, even if such laws and regulations are
on management. Take China for instance. In the past few years, frequent explosion of gas and
wrong excavation occurred in Tianjin, Kunshan, and Qingdao. They are resolute to thorough
solve the issues of pipeline. 3D pipeline is the most important method to manage pipeline.
Through spatial calculation and analysis and data verification procedures, the correctness of
pipeline data is improved. Therefore, it is a must to introduce new technology and engineering
knowledge to set up more rigorous management regulations, better control engineering
quality, reduce cost, and improve quality. More importantly, regulations and standards for
public engineer shall be set up to secure the lives of people.
At present, Taiwan has begun to develop 3D pipeline management system and had fairly
complete management procedures. The system mainly verifies and manages pipeline data,
and plans the standard procedures for pipeline data configuration. Through scientific
management, governmental units are expected to gradually clarify pipeline data and safeguard
the safety of the public via more precise spatial analysis function. Although Kaohsiung
Advances in Economics, Business and Management Research, volume 33
253

experienced tragic gas exploration events, we shall turn crisis into opportunity. 3D pipeline
system shall support the existing 2D pipeline system. Engineering management standards and
regulations shall be set up. Coupled with efficient management procedures for analysis and
verification, more rigorous 3D public pipeline regulations and most advanced pipeline
management system can be developed.
References
1. Wen, J.L., 2004. The Influence of the Lifeline Manhole coverlid on Roughness of the
Road, master’s thesis, Graduate Institute of Civil Engineering, National Central
University, Taoyuan.
2. Chen, P.Y., Lin, M.S., Sung, Y.M., Sung, H.J., 2005. Study on Pipeline Excavation
Application Management System and Support Governmental Policies, 2005 Annual
Meeting and Seminar of Taiwan Geographic Information Society, Taichung.
3. Public pipeline & public facility pipeline
website: http://w3.cpami.gov.tw/pw/web/index.html
4. Information Center, Ministry of the Interior. 2005. Report on the Results of
Establishment of Standards and Policies Related to Data Circulation and Sharing Land
Resources Information System, Taipei.
5. Information Center, Ministry of the Interior. 2006. Report on the Results of
Establishment of Standards and Policies Related to Data Circulation and Sharing Land
Resources Information System (2nd Year), Taipei.
6. Tsai, S.B., Wei, Y.M., Chen, K.Y., Xu, T., et al. 2016. Evaluating Green Suppliers from
Green Environmental Perspective. Environment and Planning B-Planning & Design,
2016, 43(5), 941-959.
7. Tsai, S.B. 2016. Using Grey Models for Forecasting China’s Growth Trends in
Renewable Energy Consumption. Clean Technologies and Environmental Policy,
2016, 18, 563-571.
8. Guo, J.J. and Tsai, S.B. 2015. Discussing and Evaluating Green Supply Chain
Suppliers: A Case Study of the Printed Circuit Board Industry in China. South African
Journal of Industrial Engineering, 2015, 26(2), 56-67.
9. Tsai, S.B., Huang, C.Y., Wang, C.K., Chen, Q., et al. 2016. Using a Mixed Model to
Evaluate Job Satisfaction in High-Tech Industries. Plos One, 2016, 11(5): e0154071.
doi:10.1371/journal.pone.0154071
Advances in Economics, Business and Management Research, volume 33
254

10. Lee, Y.C., Chu, W.H., Chen, Q., Tsai, S.B., et al. 2016. Integrating DEMATEL Model
and Failure Mode and Effects Analysis to Determine the Priority in Solving
Production Problems. Advances in Mechanical Engineering, 2016, 8(4), 1-12.
11. Tsai, S.B., Xue, Y., Zhang, J., Chen, Q., et al. 2016. Models for Forecasting Growth
Trends in Renewable Energy. Renewable & Sustainable Energy Reviews, 2016, DOI:
10.1016/j.rser.2016.06.001.
12. Qu, Q., Chen, K.Y., Wei, Y.M., et al. 2015. Using Hybrid Model to Evaluate
Performance of Innovation and Technology Professionals in Marine Logistics Industry
Mathematical Problems in Engineering, 2015, Article ID 361275, 8 pages,
http://dx.doi.org/10.1155/2015/361275.
13. Zhou, J. Wang, Q., Tsai, S.B., et al. 2016. How to Evaluate the Job Satisfaction of
Development Personnel. IEEE Transactions on Systems Man Cybernetics-Systems,
2016, 10.1109/TSMC.2016.2519860.
14. Su, J. M., Lee, S. C., Tsai, S. B. & Lu, T. L. 2016. A comprehensive survey of the
relationship between self‑efficacy and performance for the governmental auditors.
SpringerPlus, 2016, 5:508. DOI 10.1186/s40064-016-2104-x.
15. Tsai, S.B., Lee, Y.C. & Guo, J.J. 2014. Using modified grey forecasting models to
forecast the growth trends of green materials. Proceedings of the Institution of
Mechanical Engineers, Part B: Journal of Engineering Manufacture, 2014, 228(6):
931-940.
16. Chen, H.M., Wu, C.H., Tsai, S.B., Yu, J., et al. 2016. Exploring key factors in online
shopping with a hybrid model. SpringerPlus, 2016, 5:2046. DOI
10.1186/s40064-016-3746-4.
17. Deng, X.Y., Hu, Y., Deng Y. & Mahadevan, S. 2014. Environmental impact assessment
impact assessment based on numbers. Expert Systems with Applications, 2014, 41 (2),
635-643.
18. Wang, J., Yang, J., Chen Q. & Tsai, S.B. 2016. Collaborative Production Structure of
Knowledge-sharing Behavior in Internet Communities. Mobile Information Systems,
Article ID 8269474, 9 pages, http://dx.doi.org/10.1155/2016/8269474.
19. Wang, J., Yang, J., Chen Q. & Tsai, S.B. 2016. Creating the Sustainable Conditions
for Knowledge Information Sharing in Virtual Community. SpringerPlus, 5:1019, DOI
10.1186/s40064-016-2702-7.
Advances in Economics, Business and Management Research, volume 33
255

20. Lee, Y.C., Wang, Y.C., Chien, C.H., Wu, C.H., et al. 2016. Applying Revised Gap
Analysis Model in Measuring Hotel Service Quality, SpringerPlus, 5:1191, DOI
10.1186/s40064-016-2823-z.
21. Lee, Y.C., Wang, Y.C., Lu, S.C., Hsieh, Y.F., et al. 2016. An Empirical Research on
Customer Satisfaction Study: A Consideration of Different Levels of Performance.
SpringerPlus, 5:1577, DOI 10.1186/s40064-016-3208-z.
22. Chin, T., Tsai, S.B., Fang, K., Zhu, W., et al. 2016. EO-Performance relationships in
Reverse Internationalization by Chinese Global Startup OEMs: Social Networks and
Strategic Flexibility. PLoS ONE, 11(9): e0162175, doi:10.1371/journal.pone.0162175.
23. Lee, S.C., Su, J.M., Tsai, S.B., Lu, T.L., et al. 2016. A comprehensive survey of
government auditors’ self‑efficacy and professional Development for improving audit
quality. SpringerPlus, 5:1263, DOI 10.1186/s40064-016-2903-0.
24. Chen, H.M., Wu, C.H., Tsai, S.B., Yu, J., et al. 2016. Exploring key factors in online
shopping with a hybrid model. Springer Plus, 5:2046, DOI
10.1186/s40064-016-3746-4.
25. Ge, B., Jiang, D., Gao, Y., & Tsai, S.B. 2016. The Influence of Legitimacy on a
Proactive Green Orientation and Green Performance: A Study Based on Transitional
Economy Scenarios in China. Sustainability, 8, 1344, 1-20. doi:10.3390/su8121344.
26. Tsai. 2017. Using the DEMATEL model to explore the job satisfaction of research
and development professionals in china's photovoltaic cell industry. Renewable &
Sustainable Energy Reviews, 2017, DOI: http://dx.doi.org/10.1016/j.rser.2017.07.014
Advances in Economics, Business and Management Research, volume 33
256