3d seismic profiles for shale plays - · pdf file3d seismic profiles of u s shale 3d ......
TRANSCRIPT

3D Seismic Profiles of U S Shale 3D Seismic Profiles of U.S. Shale Plays -- An AAPG E-Symposiumy y p
David PaddockSchlumbergerSchlumberger
Rick Lewis and Jessie Cryer Schlumberger DCS Data Services (Petrophysics)Rick Lewis and Jessie Cryer, Schlumberger DCS Data Services (Petrophysics)Colin Sayers and Roberto Suarez-Rivera, Schlumberger DCS GeomechanicsJohn Young and Pat Kist, Schlumberger WesternGecoDavid Paddock and Lei Zhang Schlumberger DCS Reservoir Seismic ServicesDavid Paddock and Lei Zhang, Schlumberger DCS Reservoir Seismic ServicesBrian Toelle and Ron Martin, Schlumberger DCS Consulting ServicesJoel Le Calvez, Schlumberger DCS StimMAP Microseismic

Treasure Map
Gammon Excello/MulkyNew Albany
BakkenAntrim
Caney &Woodford
NiobraraGammon Excello/Mulky
GreenRiver
Monterey Devonian/OhioMarcellus
McClure
Cane CreekFloyd &
ConasaguaPalo Duro
Lewis &Mancos
Barnett Fayetteville
Palo Duro
Barnett &Woodford
Haynesville
Woodford
Woodford
Eagle Ford

Introduction
Motivation– Gas shales and their economics
• 30% or fewer of wells are profitable• 50% of Barnett perfs have no flow (typical?)• 70% of flow from 30% of perfs• 70% of flow from 30% of perfs• Is it possible to perf less and drill less. To attain the same profitability from
15% of the forward-looking capital investment?
Challenges for gas shales– Identify sweetspots, optimize drilling, and optimize completions
Disciplines: Petrophysics, geomechanics. Support from seismic. The goal: Prediction of success. It’s achievable.g Most operators only use seismic for well design and hazard avoidance

Organic Rich Shales: Siltstones and Marls
Barnett Woodford Caney/FayettevilleTypical
• A solution for each. Plus details of stress, open fractures, structure, and overburden
Barnett Woodford Caney/FayettevilleTypical
Kerogen
Gas-filled porosity
Shale by Shale: Characteristics and seismic solutions
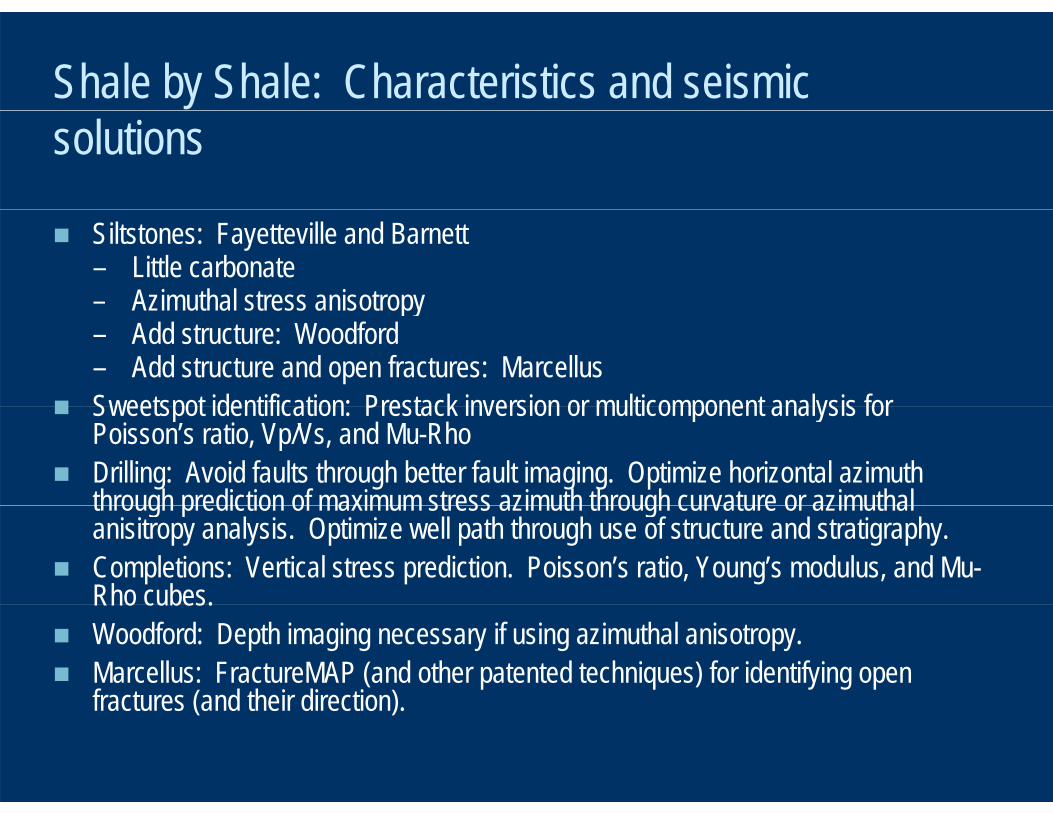
Siltstones: Fayetteville and Barnett– Little carbonate– Azimuthal stress anisotropyAzimuthal stress anisotropy– Add structure: Woodford– Add structure and open fractures: Marcellus
Sweetspot identification: Prestack inversion or multicomponent analysis for Sweetspot identification: Prestack inversion or multicomponent analysis for Poisson’s ratio, Vp/Vs, and Mu-Rho
Drilling: Avoid faults through better fault imaging. Optimize horizontal azimuth through prediction of maximum stress azimuth through curvature or azimuthal through prediction of maximum stress azimuth through curvature or azimuthal anisitropy analysis. Optimize well path through use of structure and stratigraphy.
Completions: Vertical stress prediction. Poisson’s ratio, Young’s modulus, and Mu-Rho cubes.Rho cubes.
Woodford: Depth imaging necessary if using azimuthal anisotropy. Marcellus: FractureMAP (and other patented techniques) for identifying open
fractures (and their direction)fractures (and their direction).

Shale by Shale: Characteristics and seismic solutions
Not a gas shale: The Bakken Formation– Mixed clastic/carbonate middle member– Better production where thin– Pore pressure important– Fractures important (open?)– Lithology and rock quality important
Resolution is king Middle Bakken is below conventional seismic resolution even with high cut Resolution is king. Middle Bakken is below conventional seismic resolution, even with high cut frequencies of 75 Hertz.
Sweetspots: – Rock quality: Prestack inversion or multicomponent analysis for the prediction of porosity and Rock quality: Prestack inversion or multicomponent analysis for the prediction of porosity and
lithology– Fracturing: Infer from thickness and curvature. Measure with seismic azimuthal velocity
analysis, AVO Az and Ampl Az, but need depth imaging to do so. – Pore Pressure: Integrated seismic velocity analysis with well logs information– Pore Pressure: Integrated seismic velocity analysis with well logs information
Drilling: Avoid faults through better fault imaging. Optimize horizontal azimuth through prediction of maximum stress anisotropy through curvature or azimuthal anisitropy analysis; also predict good and bad geobodies. Optimize well path through use of structure.
Completions: Pore pressure and vertical stress prediction. Poisson’s ratio, Young’s modulus, Mu-Rho, and pore pressure cubes.

Shale by Shale: Characteristics and seismic solutions
Marls: Haynesville and Eagle Ford Formations– Carbonate rich (Haynesville regional)
Little / no azimuthal stress anisotropy– Little / no azimuthal stress anisotropy– Small faults known to be an annoyance in the Haynesville
Sweetspot identification: Much more complicated that siltstones. p pOptimize carbonate/clastic ratio. Pre-stack inversion or multicomponent analysis for Vcarbonate, Vshale, and porosity. Pore pressure may be important.pressure may be important.
Drilling: – Avoid faults through better fault imaging.
O ti i ll th th h f i i f t t– Optimize well path through use of seismic for structure. Completions: Pore pressure and vertical stress prediction. Poisson’s
ratio, Young’s modulus, Mu-Rho, and pore pressure cubes.ratio, Young s modulus, Mu Rho, and pore pressure cubes. Haynesville: Detailed attention to structure and fault delineation

Technical Content
Sweetspot identification Drilling Optimization Drilling Optimization Completions Support Predicting Success Cost / Benefit Cost / Benefit Conclusions Review
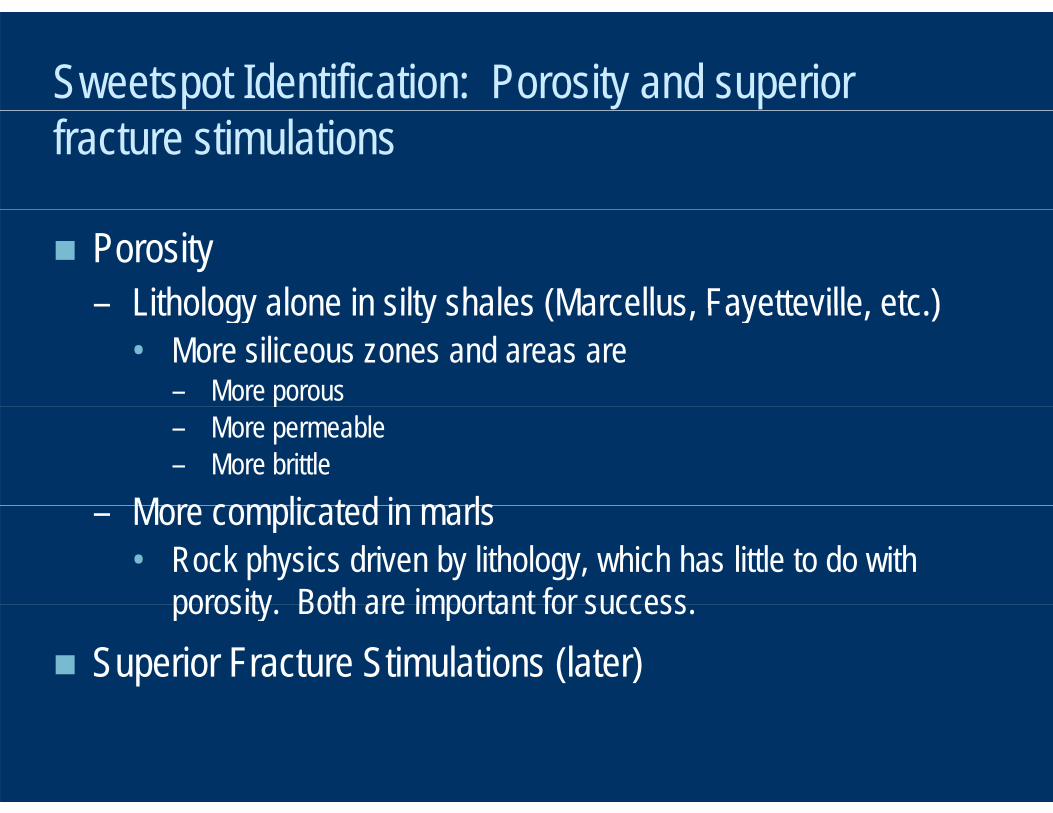
Sweetspot Identification: Porosity and superior fracture stimulations
Porosity– Lithology alone in silty shales (Marcellus Fayetteville etc )Lithology alone in silty shales (Marcellus, Fayetteville, etc.)
• More siliceous zones and areas are– More porous– More permeable– More brittle
More complicated in marls– More complicated in marls• Rock physics driven by lithology, which has little to do with
porosity Both are important for successporosity. Both are important for success.
Superior Fracture Stimulations (later)

Core: Scratch test scale to log scaleThe laminated texture of TGS reservoirs
lt i i ti f t i l
g
results in variations of material properties that differ primarily along the vertical direction (across beds).
The resulting material propertiesThe resulting material properties (petrophysical and mechanical) are best characterized using anisotropic medium models (e.g., transverse isotropic or
th t i )orthotropic).
The implication of anisotropy is that material properties are different in the vertical direction (perpendicular tovertical direction (perpendicular to bedding) and horizontal direction (parallel to bedding), and that these vary strongly with orientation to beddingbedding.
Log-scale heterogeneity (colors) obtained via n-dimensional l t l i f lcluster analysis of logs.
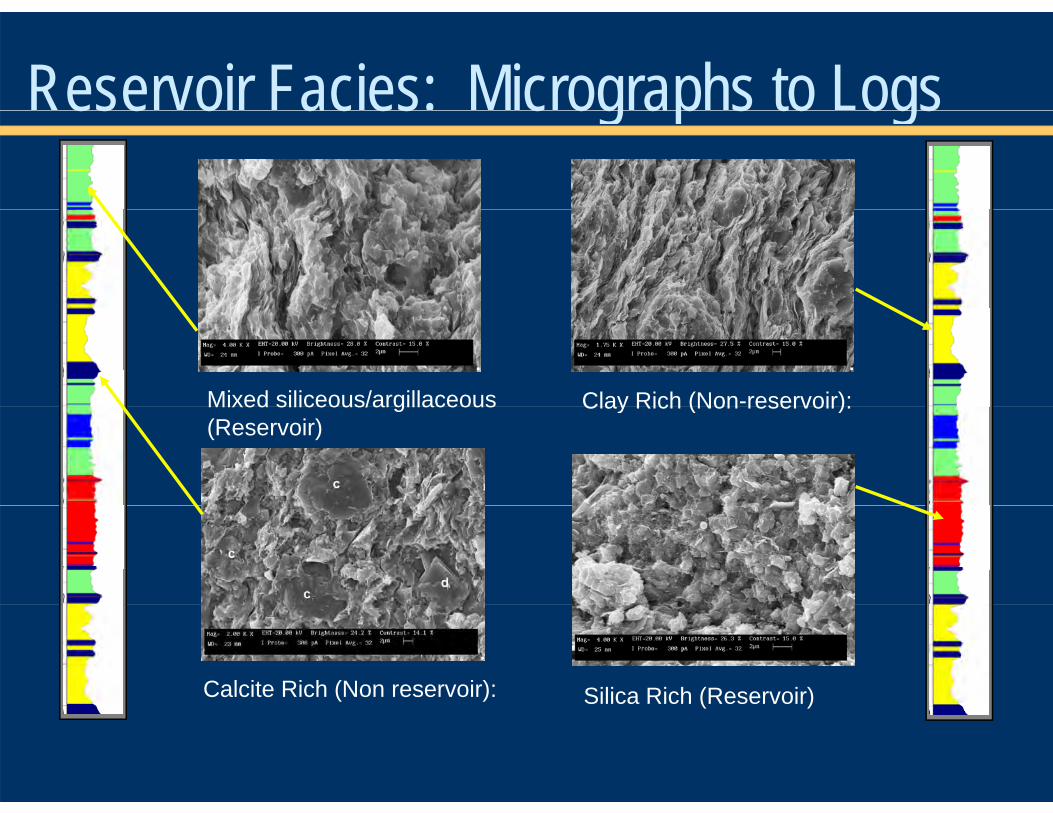
Reservoir Facies: Micrographs to Logsese o ac es c og ap s to ogs
Clay Rich (Non-reservoir):Mixed siliceous/argillaceous Clay Rich (Non reservoir):Mixed siliceous/argillaceous(Reservoir)
Calcite Rich (Non reservoir): Silica Rich (Reservoir)Silica Rich (Reservoir)

Conventional Seismic DataMigrated Conventional Seismic
Target
+ -

Sweetspot IdentificationPoisson’s Ratio from Prestack Inversion
p
Target
Low High

Conventional seismic versus rock physics inversionAcoustic ImpedanceAcoustic Impedance Poisson’s RatioPoisson’s Ratio
Low HighLow HighLow HighLow Highgg
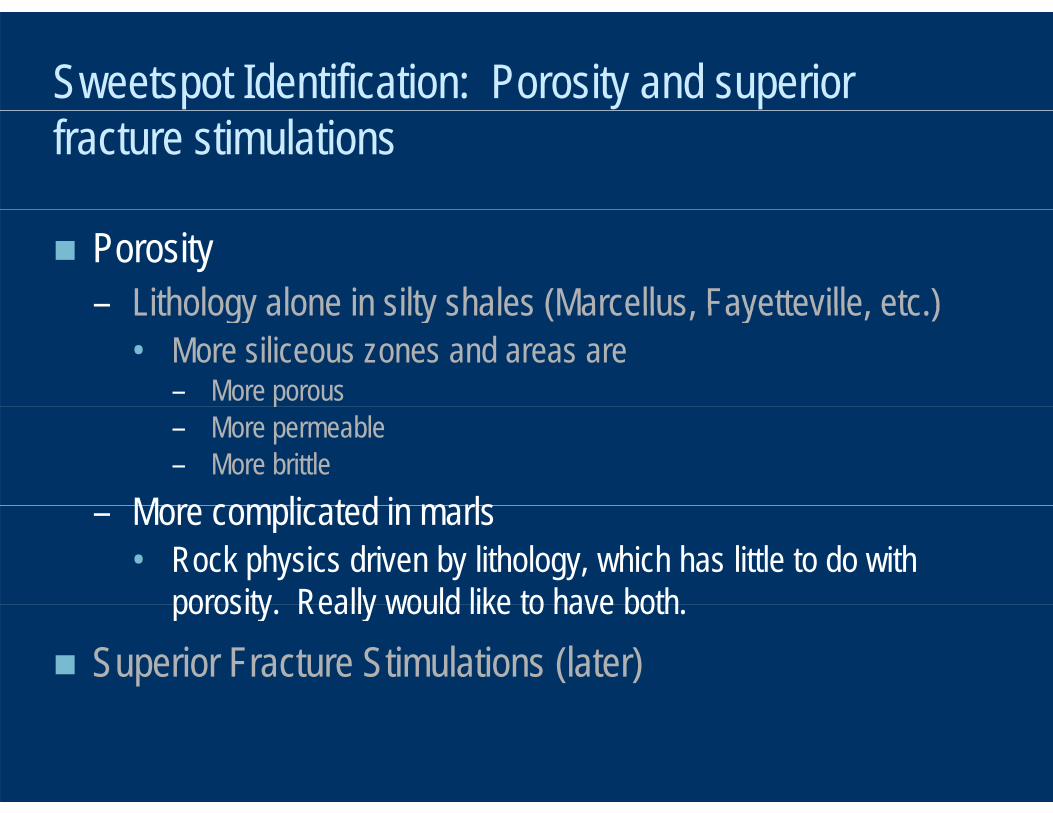
Sweetspot Identification: Porosity and superior fracture stimulations
Porosity– Lithology alone in silty shales (Marcellus Fayetteville etc )Lithology alone in silty shales (Marcellus, Fayetteville, etc.)
• More siliceous zones and areas are– More porous– More permeable– More brittle
More complicated in marls– More complicated in marls• Rock physics driven by lithology, which has little to do with
porosity Really would like to have bothporosity. Really would like to have both.
Superior Fracture Stimulations (later)

Sweetspot Identification: Porosity in marls
Rock physics driven by lithology, which has little to do with porosityp y– Success driven by both lithology and porosity– Petrophysical approach
• Measurement: Compare multiple measurements to discern lithology, porosity and kerogen
• Neural network: Compare simpler and more limited well log • Neural network: Compare simpler and more limited well log measurements to core
– SeismicSeismic• Multiple measurements (multicomponent or AVO) to derive
Vcarbonate, Vshale, and porosityN l– No example
Sweetspot Identification: Porosity and superior fracture stimulations
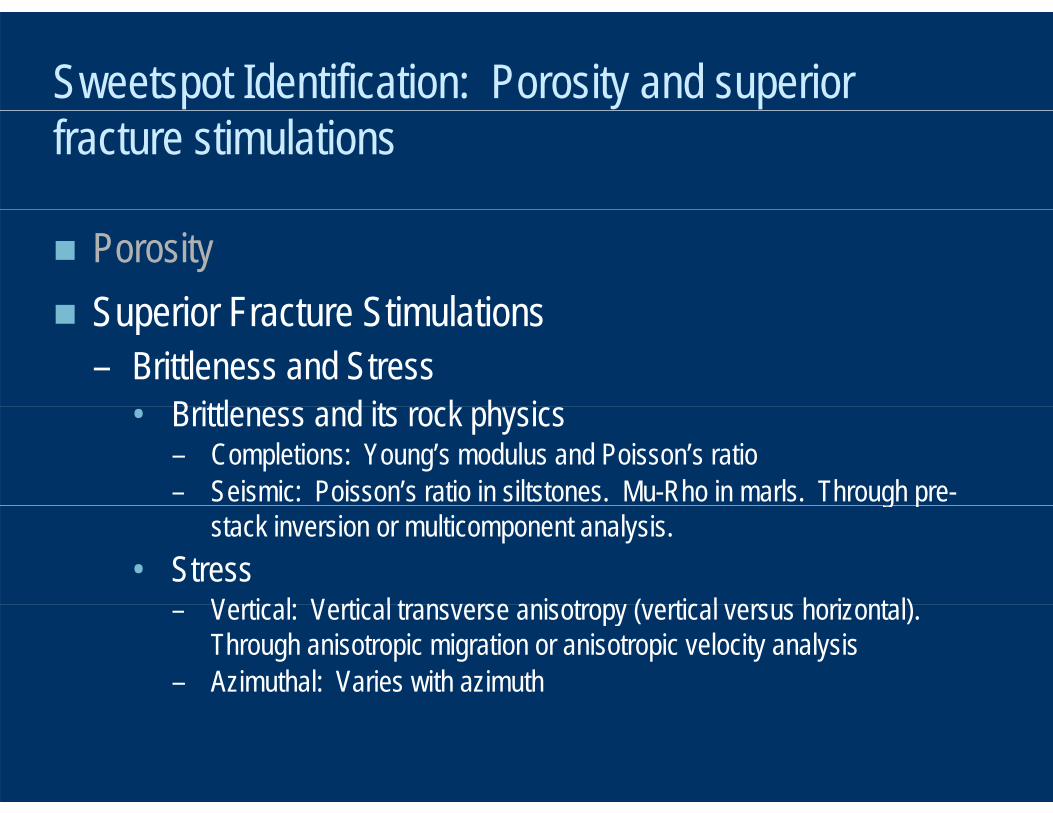
Porosity Superior Fracture Stimulations Superior Fracture Stimulations
– Brittleness and StressB ittl d it k h i• Brittleness and its rock physics– Completions: Young’s modulus and Poisson’s ratio– Seismic: Poisson’s ratio in siltstones. Mu-Rho in marls. Through pre-g p
stack inversion or multicomponent analysis.• Stress
Vertical Vertical trans erse anisotrop ( ertical ers s hori ontal) – Vertical: Vertical transverse anisotropy (vertical versus horizontal). Through anisotropic migration or anisotropic velocity analysis
– Azimuthal: Varies with azimuth
Sweetspot Identification: Porosity and superior fracture stimulations
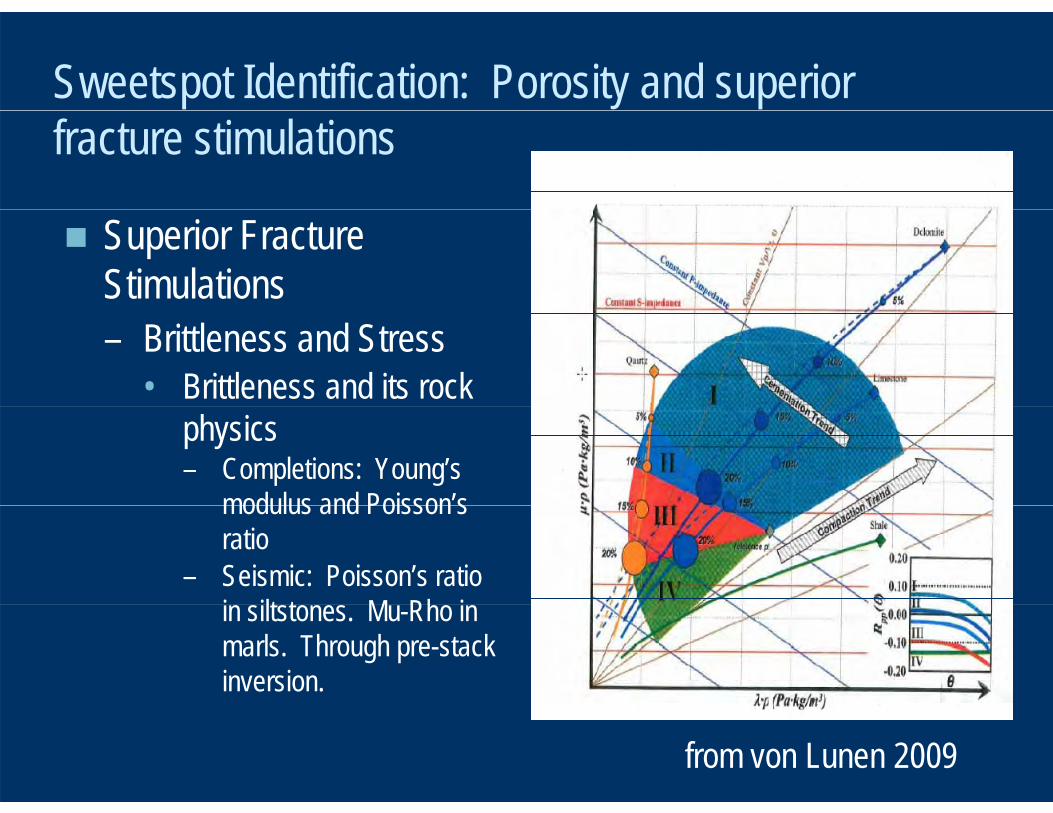
Superior Fracture Stimulations– Brittleness and Stress
• Brittleness and its rock physics– Completions: Young’s
modulus and Poisson’s modulus and Poisson s ratio
– Seismic: Poisson’s ratio i ilt t M Rh i in siltstones. Mu-Rho in marls. Through pre-stack inversion.
from von Lunen 2009

Sweetspot Identification: Porosity and superior fracture stimulations
Porosity Superior Fracture Stimulations Superior Fracture Stimulations
– Brittleness and StressSt• Stress– Vertical: Vertical transverse anisotropy
(vertical versus horizontal). Through VTI ( ) ganisotropic migration (eta for time migration; delta and epsilon for depth migration)
– Azimuthal: Varies with azimuth. Through Azimuthal: Varies with azimuth. Through curvature analysis, azimuthal anisotropy analysis, Amplitude Azim, AVO Azim, and/or 3D Mechanical Earth Modeling3D Mechanical Earth Modeling.

VTI Anisotropic Migration for a Better Structural Image and a Measurement of Stressand a Measurement of Stress
Isotropic Migration VTI Anisotropic Migration y T
ime
y Tim
e
Two W
ay
Two W
ay
Offset / Angle Offset / AngleOffset / Angle Offset / AnglePSTM Seismic Gathers

Sweetspot Identification: Porosity and superior fracture stimulations
Porosity Superior Fracture Stimulations Superior Fracture Stimulations
– Brittleness and StressSt• Stress– Vertical:– Azimuthal: Varies with azimuth. Through g
curvature analysis, azimuthal anisotropy analysis, Amplitude Azim, AVO Azim, and/or 3D Mechanical Earth Modeling. Not an issue 3D Mechanical Earth Modeling. Not an issue in Haynesville or Eagle Ford (?).

Sweetspot Identification: Porosity and superior fracture stimulations
Curvature– Simplest azimuthal stress methodSimplest azimuthal stress method
• A good idea to tie to stress measurements in wells– See Rich and Ammerman: Changes in frac
azimuth within one well agree with changes in curvature (a Barnett example)curvature (a Barnett example)
Azimuthal anisotropy (next slide)P i i th t l h– Pre-imaging the most popular approach• Adequate for low dip and absence of
overburden velocity effectsoverburden velocity effects

Measuring Fractures with Seismicg
1000 -
y Seismic
100 -
Fre
quen
cy Seismic
10 -
. Fra
ctur
e
1 -
Cum
.
Core ImageLog
No Seismic Image
from Mattner (2002)
10 mm1 mm 0.1 m 1 m 10 m 100 m
Fractal Parameterfrom Mattner (2002)

Anisotropy—Cookie Perspective (map view)py p ( p )Source
Source Slowness Source
Receiver
Slowness or travel
time ellipseReceiver ellipse
Source
Receiver
Receiver

Anisotropy—Cookie Perspective (map view)Source
Source
py p ( p )
Source Slowness or travel
time Receiver time ellipse
Source
Receiver
Receiver

Anisotropy—Cookie Perspective (map view)Source
Source
py p ( p )
Source
Receiver
Slowness or travel
time Receiverellipse
Source
Receiver
Receiver

Post-imaging azimuthal anisotropy analysisPost imaging azimuthal anisotropy analysis
S li i 4 diff
azimuth groups in degrees4Survey split into 4 different
azimuth groups
PSTM each azimuth group with the same velocity
EXAMPLE:
1. 15 - 60
2. 60 - 105
3. 105 - 150
4. 150 - 195
1
43
2
1
2
34
Residual velocities picked post migration for each azimuth
group using a spatially continuous method
Attribute cubes produced by analyzing changes in velocity
with azimuth
Fracture Analysis from Velocities
Residual velocities applied and trim statics calculated to align horizons between azimuths
The same 3 attribute cubes are produced from the velocity and amplitude analysis:
1. Ellipticity (B)
2. Fracture Density or Percent Anisotropy
3 Fracture Orientation (phi0)
Far angle stacks produced – 18 to 36 degrees
3. Fracture Orientation (phi0)
The ellipticity and fracture orientation are defined by the following equation
f(phi) = A + B cos(2(phi – phi0)) Where A is the average value
phi0Attribute cubes produced by
analyzing changes in amplitude with azimuth
of the attribute
Fracture Density or Percent Anisotropy is the Ellipticity normalized by the following equation:
Percent Anisotropy = 2B/(A+B) * 100
Fracture Analysis from Amplitudes
Deliverables: Segy’s for each of 1,2, and 3 above for both velocity and amplitude analysis (6 total)

Azimuthal Anisotropy: Amount and Direction(Amount shown)
Map view at targetMap view at targetDisplays azimuthal variations in
anisotropyanisotropy low indicates little
fracturing and small ac u g a d s adifferential stress
high indicates higher g gfracture storage of gas, and large differential stress
Low High
Results from Ant Tracking complements analysis
Low High

Sweetspot Identification: Porosity and superior fracture stimulations
Additional Azimuthal: – Take azimuthal anisotropic cube and Take azimuthal anisotropic cube and
evaluate Amplitude Azim and AVO Azim (patented).(pate ted)• Can detect multiple fracture sets having
different azimuths and whether open or closed
– 3D Mechanical Earth Modeling• Full integration of all seismic and well log
measurements, including the evaluation and simulation of the effects of blowdownand simulation of the effects of blowdown

Technical Content
Sweetspot identification Drilling Optimization Drilling Optimization Completions Support Predicting Success Cost / Benefit Cost / Benefit Conclusions Review

Drilling optimizationg p
Staying in zone– Drill in a brittle zone or drill in
the hot Gamma Ray?• Seismic has the solution
either wayeither way– Prestack inversion or
multicomponent analysis for Poisson’s ratio (siltstones) or Poisson s ratio (siltstones) or Mu-Rho (for marlstones)
Azimuth optimization– Curvature or azimuthal velocity
analysisanalysis
Technical Content
Sweetspot identification Drilling Optimization Drilling Optimization Completions Support Predicting Success Cost / Benefit Cost / Benefit Conclusions Review

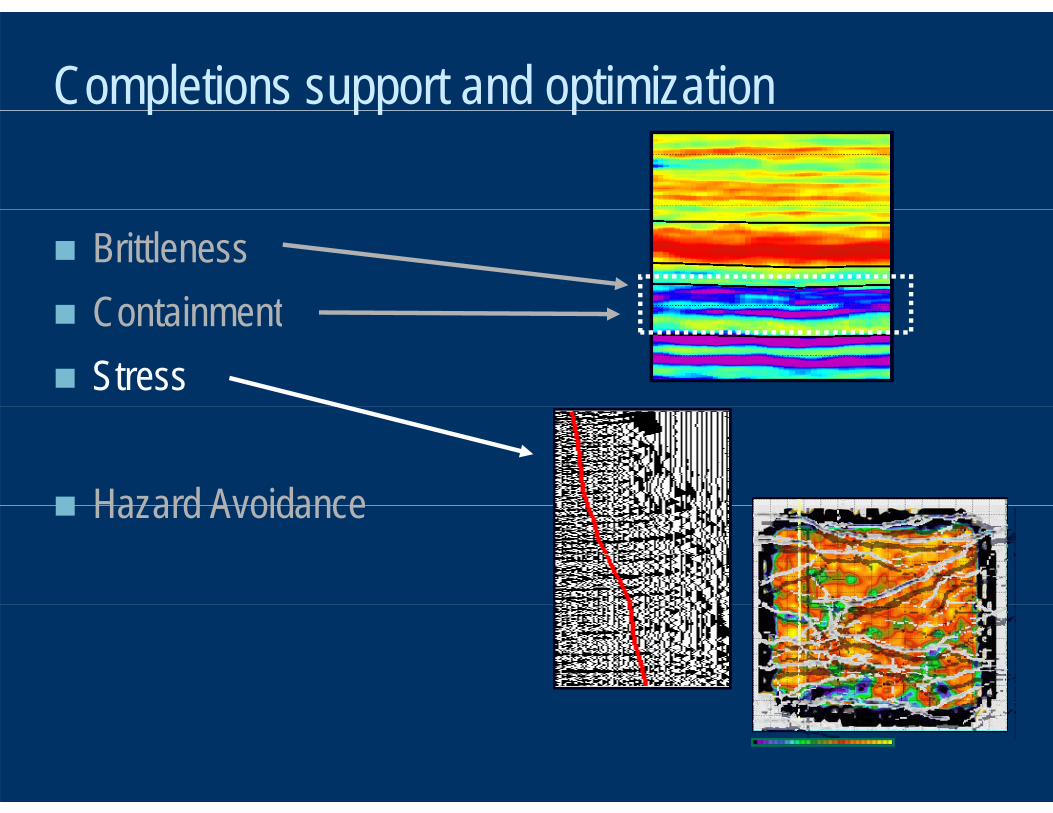
Completions support and optimizationp pp p
Brittleness Containment Containment Stress
Hazard Avoidance Hazard Avoidance

Completions support and optimizationp pp p
Brittleness– Poisson’s ratio in
Poisson’s Ratio from Prestack InversionPoisson s ratio in siltstones
– Mu-Rho in marlsMu Rho in marls Containment
St ti h– Stratigraphy– Ductile – brittle – ductile– On same vertical scale
as an induced fracture
Completions support and optimizationp pp p
Brittleness Containment Containment Stress
Hazard Avoidance Hazard Avoidance

Completions support and optimizationp pp p
Stress– Vertical velocity Vertical velocity
anisotropy helps predict fracture growthactu e g o t
– Curvature and azimuthal velocity anisotropy help y py ppredict fracture geometry / direction, which can vary widely within a single lateral
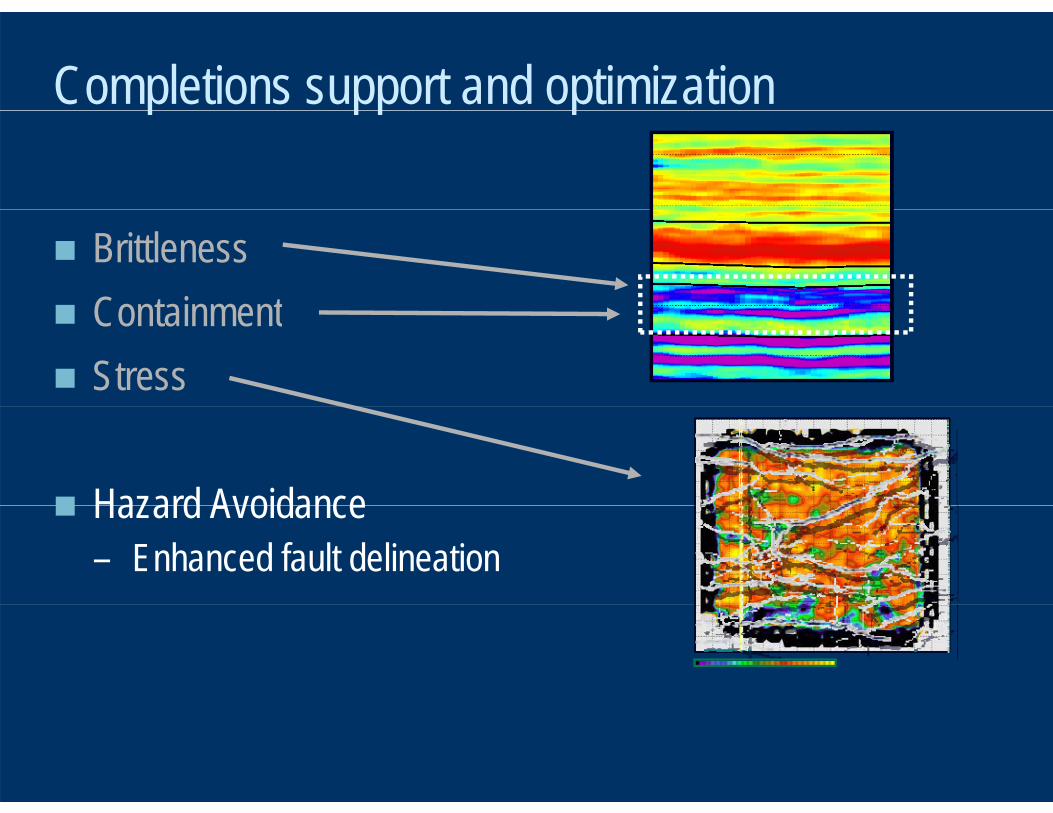
Completions support and optimizationp pp p
Brittleness Containment Containment Stress
Hazard Avoidance Hazard Avoidance– Enhanced fault delineation

Fault Delineation
Shale
Shale
Shale

Fault Image Enhancement Workflowg
Fault AttributeFi l C bEd E h tEd E h t Final CubeEdge EnhancementEdge Enhancement
Seismic FaultsFaults
Fault System Analysis
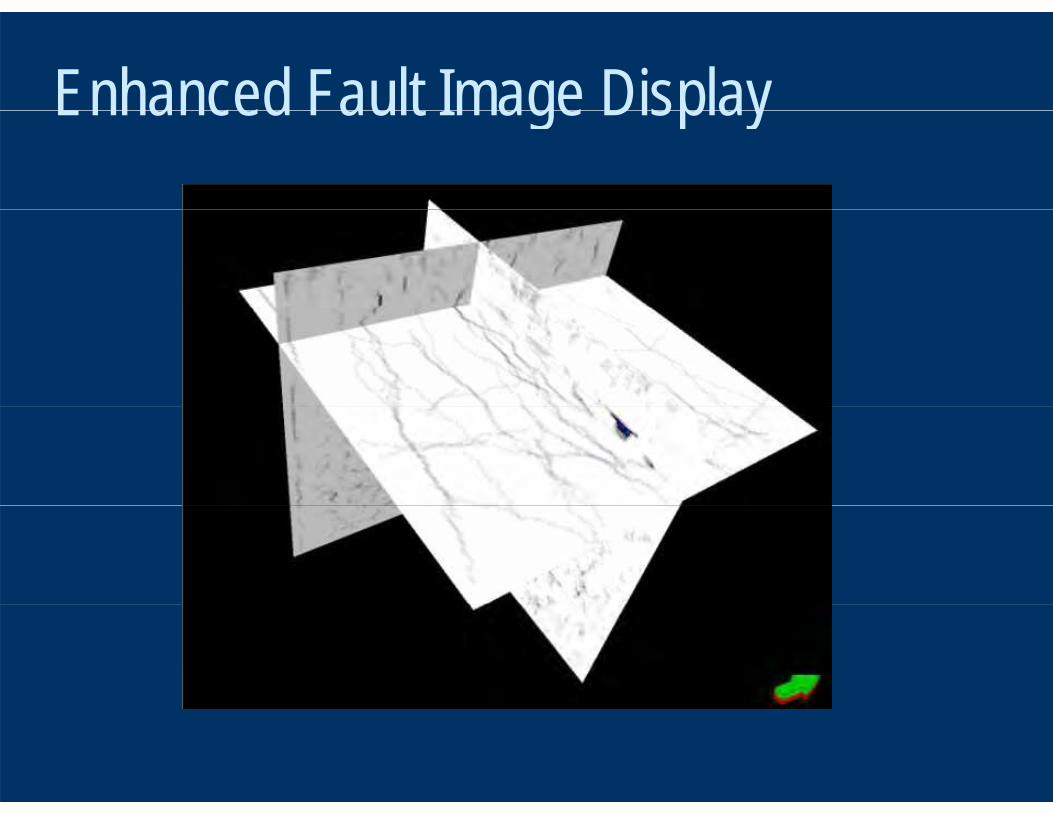
Enhanced Fault Image DisplayEnhanced Fault Image Display
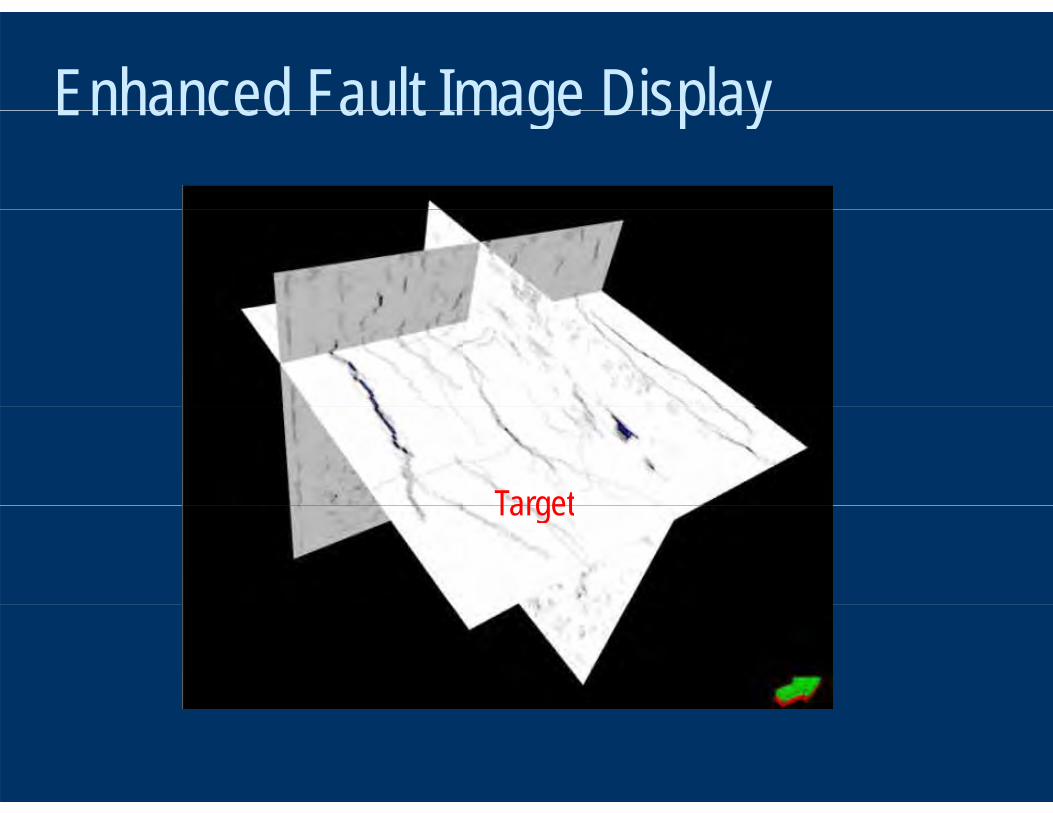
Enhanced Fault Image DisplayEnhanced Fault Image Display
TargetTarget
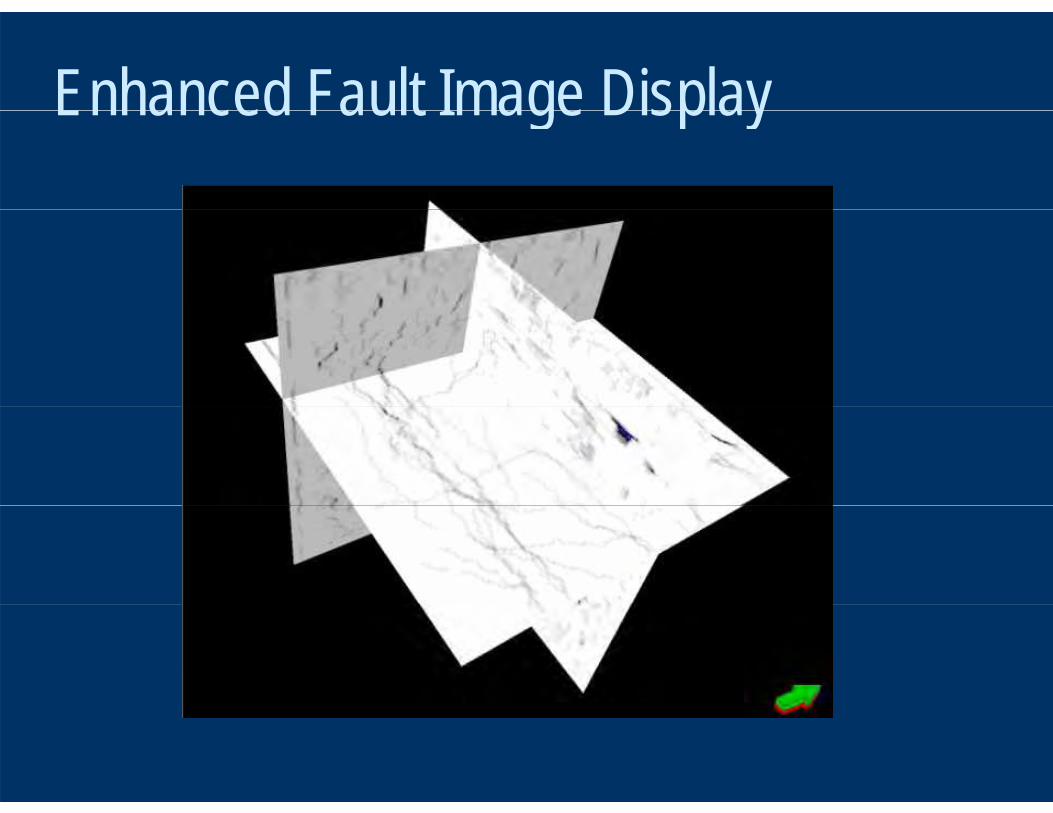
Enhanced Fault Image DisplayEnhanced Fault Image Display

Enhanced Fault Image DisplayEnhanced Fault Image Display

Integration—The Bigger Picture
Acoustic Impedance
g gg• Fractogram – azimuthal stress prediction• Seismic Inversion - rock properties for sweetspot identification Acoustic Impedance
Poisson’s Ratio
Seismic Inversion rock properties for sweetspot identification• Ant Tracking - subtle fault identification• Sonic Scanner - calibration
Fractogram
Sonic Scanner Fast Shear Azimuth
Technical Content
Sweetspot identification Drilling Optimization Drilling Optimization Completions Support Predicting Success Cost / Benefit Cost / Benefit Conclusions Review

Prediction of success (patented)Colin Sayers, Schlumberger Geomechanics
Post-drill calibration– EUR as a function of
• induced fracture area within reservoirG i l
ndex
• Gas in place• Permeability . . .
P d ill di tiEU
R In Pre-drill prediction
– EUR as a function of • Estimated stress
f (HP, MSV, Curvature)
• Estimated stress• Brittleness• PorosityPorosity• Gas in place . . .

Technical Content
Sweetspot identification Drilling Optimization Drilling Optimization Completions Support Predicting Success Cost / Benefit Cost / Benefit Conclusions Review

Cost / Benefit Analysisy
Cost of seismic (assumes 50 square mile survey)– Acquistion and processing : $200 000 per square mile Acquistion and processing : $200,000 per square mile – Seismic interpretation and analysis $10,000 per square mileTi Li Time Line– Permitting, acquisition and processing: 5 - 21 months– Ant Tracking, and inversion to rock properties: 2 months– 3D Mechanical Earth Modeling: 6 months– Average Marcellus or Haynesville: 8 – 9 months
– Typical lease term: 3 years
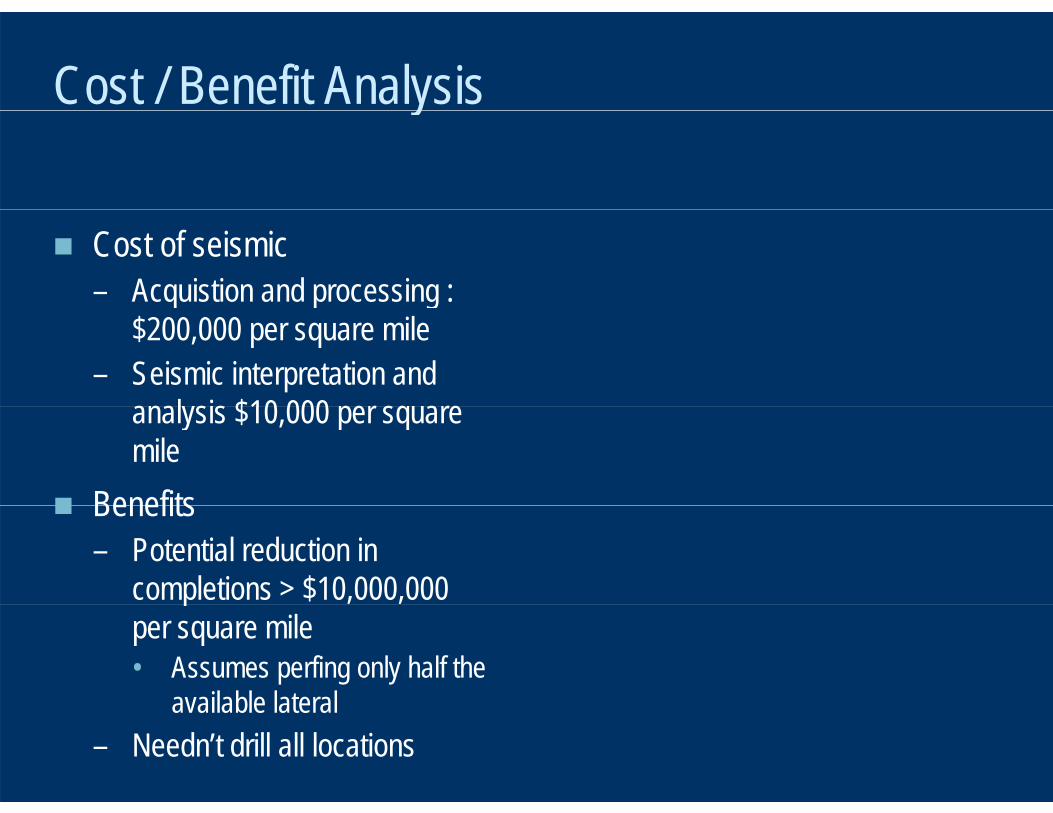
Cost / Benefit Analysisy
Cost of seismic– Acquistion and processing : g
$200,000 per square mile – Seismic interpretation and
analysis $10 000 per square analysis $10,000 per square mile
Benefits Benefits– Potential reduction in
completions > $10,000,000 p , ,per square mile• Assumes perfing only half the
available lateral available lateral – Needn’t drill all locations

Technical Content
Sweetspot identification Drilling Optimization Drilling Optimization Completions Support Predicting Success Cost / Benefit Cost / Benefit Conclusions Review
Conclusions
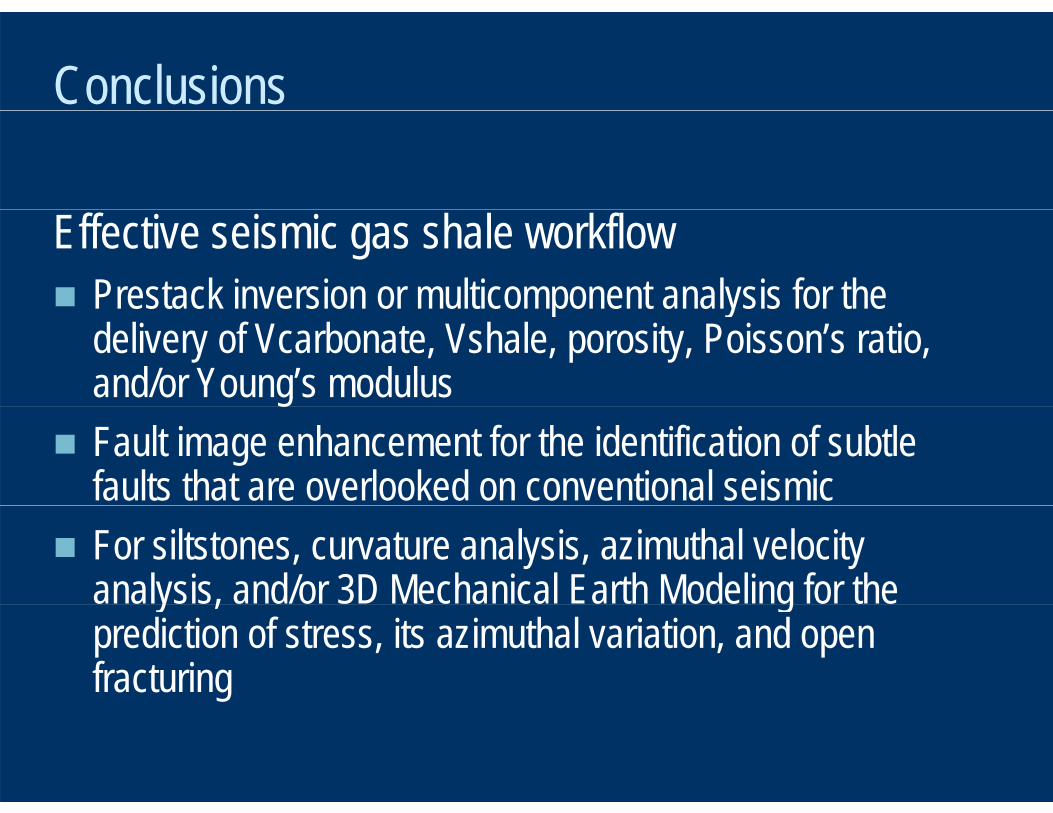
Effective seismic gas shale workflow Prestack inversion or multicomponent analysis for the Prestack inversion or multicomponent analysis for the
delivery of Vcarbonate, Vshale, porosity, Poisson’s ratio, and/or Young’s modulus
Fault image enhancement for the identification of subtle faults that are overlooked on conventional seismic
For siltstones, curvature analysis, azimuthal velocity analysis, and/or 3D Mechanical Earth Modeling for the y , gprediction of stress, its azimuthal variation, and open fracturing

Review: Shale by Shale: Characteristics and seismic solutions
Siltstones: Fayetteville and Barnett– Little carbonate– Azimuthal stress anisotropyAzimuthal stress anisotropy– Add structure: Woodford– Add structure and open fractures: Marcellus
Sweetspot identification: Prestack inversion or multicomponent analysis for Sweetspot identification: Prestack inversion or multicomponent analysis for Poisson’s ratio, Vp/Vs, and Lambda-Mu
Drilling: Avoid faults through better fault imaging. Optimize horizontal azimuth through prediction of maximum stress azimuth through curvature or azimuthal through prediction of maximum stress azimuth through curvature or azimuthal anisitropy analysis. Optimize well path through use of structure and stratigraphy.
Completions: Vertical stress prediction. Poisson’s ratio, Young’s modulus, and Mu-Rho cubes.Rho cubes.
Woodford: Depth imaging necessary if using azimuthal anisotropy. Marcellus: FractureMAP (and other patented techniques) for identifying open
fractures (and their direction)fractures (and their direction).

Shale by Shale: Characteristics and seismic solutions
Not a gas shale: The Bakken Formation– Mixed clastic/carbonate middle member– Better production where thin– Pore pressure important– Fractures important (open?)– Lithology and rock quality important
Resolution is king Middle Bakken is below conventional seismic resolution even with high cut Resolution is king. Middle Bakken is below conventional seismic resolution, even with high cut frequencies of 75 Hertz.
Sweetspots: – Rock quality: Prestack inversion or multicomponent analysis for the prediction of porosity and Rock quality: Prestack inversion or multicomponent analysis for the prediction of porosity and
lithology– Fracturing: Infer from thickness and curvature. Measure with seismic azimuthal velocity
analysis, AVO Az and Ampl Az, but need depth imaging to do so. – Pore Pressure: Integrated seismic velocity analysis with well logs information– Pore Pressure: Integrated seismic velocity analysis with well logs information
Drilling: Avoid faults through better fault imaging. Optimize horizontal azimuth through prediction of maximum stress anisotropy through curvature or azimuthal anisitropy analysis; also predict good and bad geobodies. Optimize well path through use of structure.
Completions: Pore pressure and vertical stress prediction. Poisson’s ratio, Young’s modulus, Mu-Rho, and pore pressure cubes.

Shale by Shale: Characteristics and seismic solutions
Marls: Haynesville and Eagle Ford Formations– Carbonate rich (Haynesville regional)
Little / no azimuthal stress anisotropy– Little / no azimuthal stress anisotropy– Small faults known to be an annoyance in the Haynesville
Sweetspot identification: Much more complicated than siltstones. p pOptimize carbonate/clastic ratio. Pre-stack inversion or multicomponent analysis for Vcarbonate, Vshale, and porosity. Pore pressure may be important.pressure may be important.
Drilling: – Avoid faults through better fault imaging.
O ti i ll th th h f i i f t t– Optimize well path through use of seismic for structure. Completions: Pore pressure and vertical stress prediction. Poisson’s
ratio, Young’s modulus, and Mu-Rho cubes.ratio, Young s modulus, and Mu Rho cubes. Haynesville: Detailed attention to structure and fault delineation