seismic reservoir characterization in resource shale plays ... · seismic reservoir...
TRANSCRIPT

P r a c t i c a l a p p l i c at i o n s o f a n i s o t r o p y
758 The Leading Edge July 2011
SPECIAL SECTION: P r a c t i c a l a p p l i c a t i o n s o f a n i s o t r o p y
758 The Leading Edge July 2011
Seismic reservoir characterization in resource shale plays: Stress analysis and sweet spot discrimination
Surface seismic data have proven to be an invaluable asset for organizations producing hydrocarbons from
unconventional resource plays. Initially, a primary benefit of surface seismic was the ability to locate and avoid drilling into zones with faults, fractures, and karsting which adversely affected the ability to complete the well successfully. More recent advances in prestack seismic data analysis yield attributes that appear to be correlated to formation lithology, rock strength, and stress fields. Knowledge and proper utilization of these attributes may prove valuable in the optimization of drilling and completion activities.
In this article, we show an integrated seismic approach based on prestack azimuthal seismic data analysis and well-log information to identify sweet spots, estimate geomechani-cal properties, and in-situ principal stresses. Properties such as Young’s modulus and Poisson’s ratio provide valuable in-formation for facies identification, mineral content, and rock strength. From these, we may infer preferential drilling lo-cations or sweet spots. Additionally, analysis of differential horizontal stress may be calibrated to field observations yield-ing stress-field predictions such as fracture-initiation pressure and closure pressure which are valuable during the comple-tion stage of the fracture stimulation process. The reliability of these estimates has been addressed by incorporating triaxial core measurements. Relative production estimates can be de-rived by combining geomechanical and stress properties by estimating porosity, volume of shale, carbonate content, and water saturation. The goal is to ultimately use these volumes in a predictive mode for proper well placement and comple-tion practices.
This paper focuses on the integrated seismic methodol-ogy; a detailed calibration study is in progress and the results will be presented in a sequel paper.
MethodologyTraditionally, isotropic prestack seismic data assists in deter-mining rock property values via detailed reservoir-oriented gather conditioning, followed by prestack seismic inversion and multi-attribute analysis. This analysis provides quan-titative understanding of host rock geomechanical proper-ties such as acoustic impedance, Poisson’s ratio, and Young’s modulus. These properties are in turn related to quantitative reservoir properties such as porosity, mineral and TOC (total organic carbon) content.
Understanding fracture behavior in shales requires azi-muthal anisotropic analysis and interpretation. The preserva-tion of azimuths from the processed seismic gathers through azimuthal velocity and AVO analysis, in combination with geomechanical properties derived from isotropic methods, can be used to predict in-situ stresses acting on shale reser-
ArcAngelo SenA, gAbino cAStillo, Kevin cheSSer, Simon voiSey, Jorge eStrAdA, JuAn cArcuz, emilio cArmonA, and Peggy hodgKinS, Hampson-Russell Software & Services, a CGGVeritas Company
voirs. Such stresses, when oriented, would yield oriented frac-ture patterns during well completion and can be used in a predictive mode for optimal well completions.
The relationship between stress and strain is controlled by the elastic properties of the rock and is given by Hooke’s law. Therefore, it represents the fundamentals of hydraulic fractur-ing (that is, the deformation and fracturing of rock is caused by stressing it with hydraulic pressure in the borehole). Gray et al. (2010) use linear slip theory following Iverson (2010) to estimate these properties from seismic data. Principal stresses are estimated by combining elastic rock properties derived from seismic inversion with azimuthal velocity and AVO analysis of conventional 3D seismic data (Gray, 2011). An important parameter for prediction of hydraulic fractures, the differential horizontal stress ratio (DHSR), can be estimated solely from the seismic parameters, without any knowledge of
the stress state of the reservoir. These estimated stresses should be calibrated to the stress state of the reservoir derived from drilling and completion data, microseismic analysis, and re-gional information. In some cases, optimal targets exhibit rel-atively high values of isotropic Young’s modulus (more brit-tle) and low DHSR (no preferential orientation). Such zones are more prone to fracturing in a complex pattern leading to a greater stimulated volume and production (Rich and Am-merman, 2010). The optimal workflow is shown in Figure 1.
Haynesville case studyIn a shale gas reservoir, the organic-rich shale is both the source and the reservoir rock. Unlike conventional gas pro-duction, shale gas potential is not confined to limited traps
Figure 1. Reservoir characterization workflow.

July 2011 The Leading Edge 759
P r a c t i c a l a p p l i c at i o n s o f a n i s o t r o p y P r a c t i c a l a p p l i c at i o n s o f a n i s o t r o p ySPECIAL SECTION: P r a c t i c a l a p p l i c a t i o n s o f a n i s o t r o p y
or structures, and may exist across large geographic areas.The Haynesville Formation is a black, organic-rich shale
of Upper Jurassic age that underlies much of the Gulf Coast area of the United States. The Haynesville Formation overlies the Smackover Formation and is overlain by rocks of the Cot-ton Valley Group. Its economic viability has primarily been a result of advances in horizontal well drilling and hydraulic fracturing. Drilling and completion costs vary with an aver-age well cost of about US $7.5 million. Average drilling time ranges from 35 to 50 days.
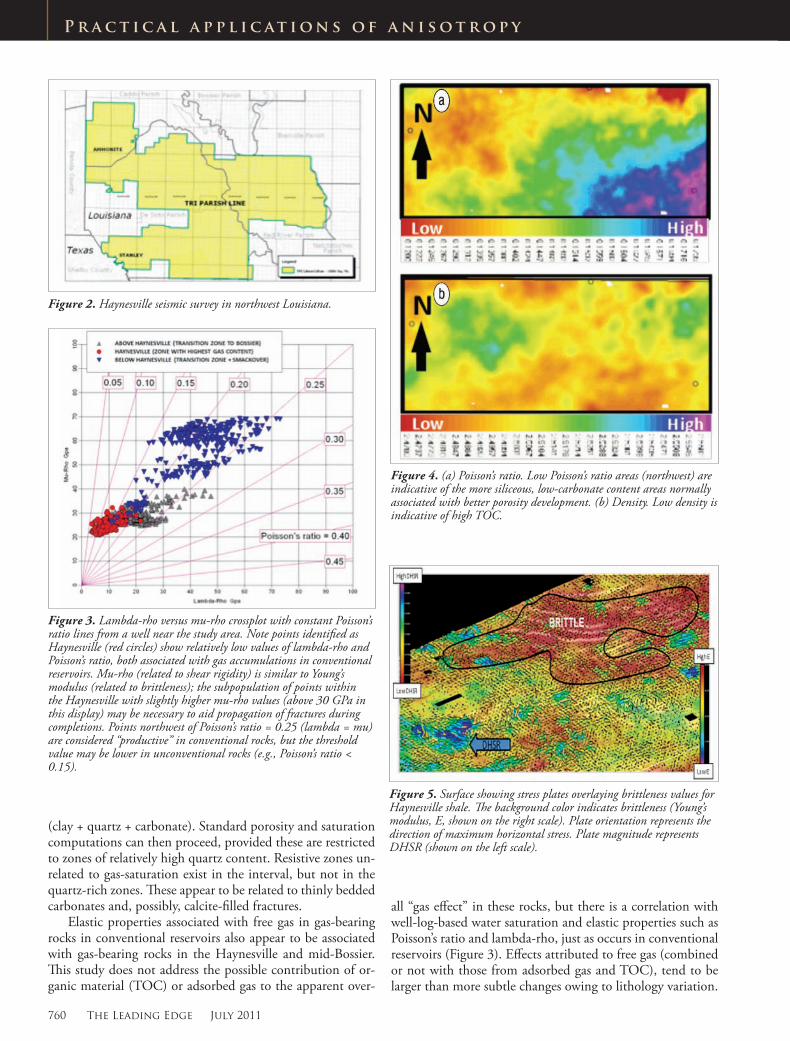
Using the workflow described in the previous section, we present the results from a Haynesville study in northwest Louisiana, USA (Figure 2). Potentially brittle zones have been identified based on elastic properties (Goodway et al., 2007) and their associated differential horizontal stress ratio, fracture-initiation pressure, and closure stress have been esti-mated. These findings are calibrated with existing production and well test data to determine optimal zones for drilling and completion.
Seismically derived rock propertiesWell logs provide necessary calibration for all phases of seis-mic analysis and are themselves calibrated to core measure-ments. Well-to-seismic ties generate a composite wavelet, and filtered logs supply the low-frequency background model for seismic inversion. Petrophysical analysis links reservoir prop-erties such as porosity and gas saturation to elastic proper-ties such as Poisson’s ratio and Young’s modulus, which are also key elements in stress analysis. Pore-pressure estimation yields additional elements in stress analysis, including ver-tical stress and fracture pressure. In the Haynesville, high-productivity zones have been associated with areas of high pore pressure. Calibration of dynamic measurements from logs with static measurements from core samples provides lo-cal dynamic-to-static transforms which are carried forward to seismic analysis.
Of all wells available for the study, those drilled with oil-based mud and heavier mud weights tend to have fewer borehole issues in the Bossier/Haynesville interval and ulti-mately contributed higher-quality log data. These served as a guide for conditioning poorer-quality data. Shallow data required considerable editing in all but one project well, in deference to the subsequent use of density and traveltime in well-to-seismic ties and pore-pressure estimation. Aside from data conditioning in washed-out intervals, the most common problem is depth registration, owing to tool-pulls, which oc-cur even where the borehole is in gauge. Dipole sonic data were available at least from the uppermost Bossier to total depth.
Petrophysical methods used for conventional reservoir analysis appear to work well in the Haynesville and mid-Bossier, despite the fact that these reservoirs are unconven-tional. This is not a foregone conclusion, given the fact that the only log measurements common to the study wells com-prise the conventional open-hole suite (density, neutron, resistivity, gamma ray, and sonic). The caveat is that X-ray diffraction data are required to calibrate the lithology model
NEOS-041_TLE.indd 1 6/3/11 5:11 PM
760 The Leading Edge July 2011
P r a c t i c a l a p p l i c at i o n s o f a n i s o t r o p y
(clay + quartz + carbonate). Standard porosity and saturation computations can then proceed, provided these are restricted to zones of relatively high quartz content. Resistive zones un-related to gas-saturation exist in the interval, but not in the quartz-rich zones. These appear to be related to thinly bedded carbonates and, possibly, calcite-filled fractures.
Elastic properties associated with free gas in gas-bearing rocks in conventional reservoirs also appear to be associated with gas-bearing rocks in the Haynesville and mid-Bossier. This study does not address the possible contribution of or-ganic material (TOC) or adsorbed gas to the apparent over-
all “gas effect” in these rocks, but there is a correlation with well-log-based water saturation and elastic properties such as Poisson’s ratio and lambda-rho, just as occurs in conventional reservoirs (Figure 3). Effects attributed to free gas (combined or not with those from adsorbed gas and TOC), tend to be larger than more subtle changes owing to lithology variation.
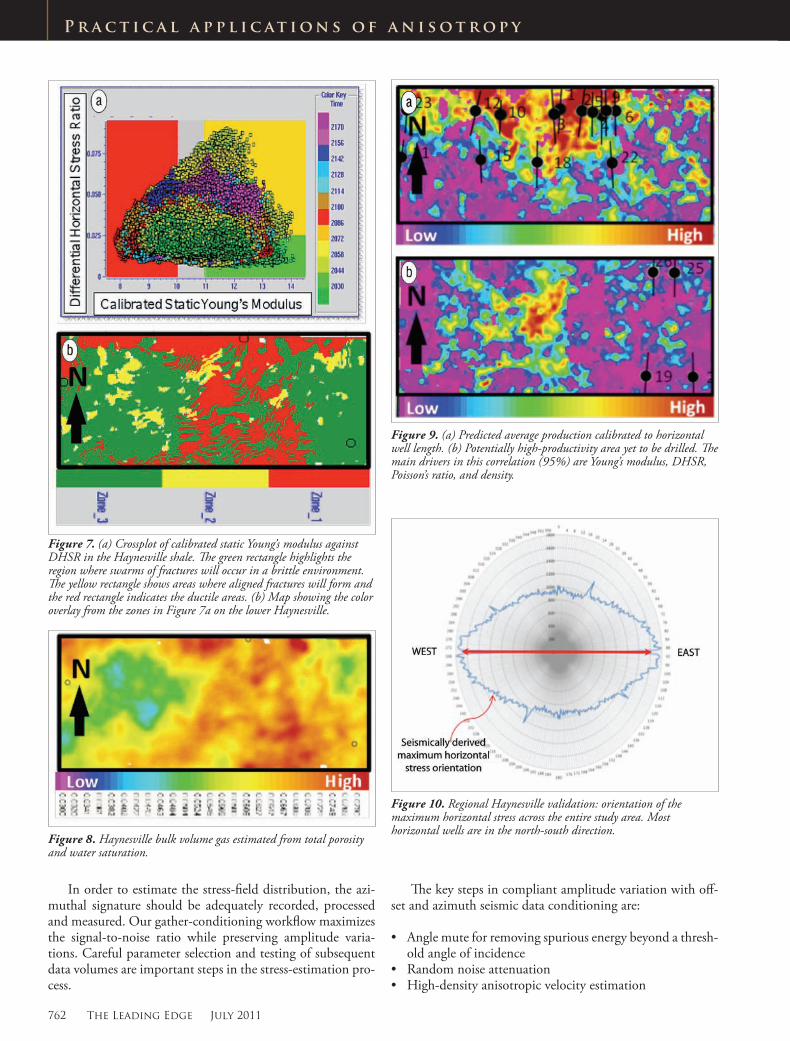
Figure 4. (a) Poisson’s ratio. Low Poisson’s ratio areas (northwest) are indicative of the more siliceous, low-carbonate content areas normally associated with better porosity development. (b) Density. Low density is indicative of high TOC.
Figure 5. Surface showing stress plates overlaying brittleness values for Haynesville shale. The background color indicates brittleness (Young’s modulus, E, shown on the right scale). Plate orientation represents the direction of maximum horizontal stress. Plate magnitude represents DHSR (shown on the left scale).
Figure 2. Haynesville seismic survey in northwest Louisiana.
Figure 3. Lambda-rho versus mu-rho crossplot with constant Poisson’s ratio lines from a well near the study area. Note points identified as Haynesville (red circles) show relatively low values of lambda-rho and Poisson’s ratio, both associated with gas accumulations in conventional reservoirs. Mu-rho (related to shear rigidity) is similar to Young’s modulus (related to brittleness); the subpopulation of points within the Haynesville with slightly higher mu-rho values (above 30 GPa in this display) may be necessary to aid propagation of fractures during completions. Points northwest of Poisson’s ratio = 0.25 (lambda = mu) are considered “productive” in conventional rocks, but the threshold value may be lower in unconventional rocks (e.g., Poisson’s ratio < 0.15).

July 2011 The Leading Edge 761
P r a c t i c a l a p p l i c at i o n s o f a n i s o t r o p y P r a c t i c a l a p p l i c at i o n s o f a n i s o t r o p y
Anisotropy analysisThe heterogeneity in the anisotropy plays a key role in the sweet-spot discrimination and optimization of horizontal well placement on the Haynesville reservoir. Vertical trans-verse isotropy (VTI) and horizontal transverse isotropy (HTI) are key components of the solution. VTI is important to the interval-velocity estimation for the initial model building in the simultaneous inversion process and pore-pressure predic-tion in the Haynesville. Even small VTI heterogeneity values produced measurable velocity changes. VTI is estimated via higher-order NMO to correct for the layering effect (Sena, 1991). HTI plays an important role in the differential stress analyses. Kinematic effects were removed in order to analyze the amplitude variation with azimuth (AVAZ) behavior.
Figure 6. (a) Fracture-initiation pressure and (b) closure pressure, in psi units, for a horizontal well in the Haynesville.
NEOS-041_TLE.indd 3 6/3/11 5:11 PM
762 The Leading Edge July 2011
P r a c t i c a l a p p l i c at i o n s o f a n i s o t r o p y
In order to estimate the stress-field distribution, the azi-muthal signature should be adequately recorded, processed and measured. Our gather-conditioning workflow maximizes the signal-to-noise ratio while preserving amplitude varia-tions. Careful parameter selection and testing of subsequent data volumes are important steps in the stress-estimation pro-cess.
The key steps in compliant amplitude variation with off-set and azimuth seismic data conditioning are:
• Angle mute for removing spurious energy beyond a thresh-old angle of incidence
• Random noise attenuation• High-density anisotropic velocity estimation
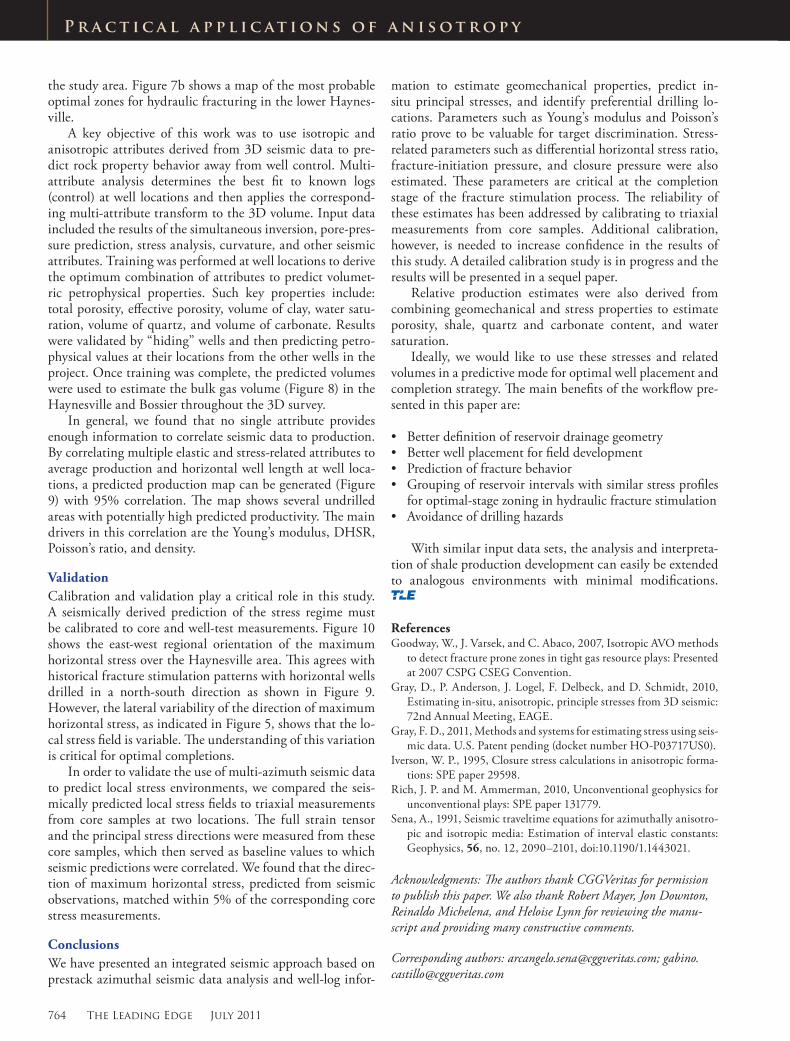
Figure 9. (a) Predicted average production calibrated to horizontal well length. (b) Potentially high-productivity area yet to be drilled. The main drivers in this correlation (95%) are Young’s modulus, DHSR, Poisson’s ratio, and density.
Figure 10. Regional Haynesville validation: orientation of the maximum horizontal stress across the entire study area. Most horizontal wells are in the north-south direction.
Figure 7. (a) Crossplot of calibrated static Young’s modulus against DHSR in the Haynesville shale. The green rectangle highlights the region where swarms of fractures will occur in a brittle environment. The yellow rectangle shows areas where aligned fractures will form and the red rectangle indicates the ductile areas. (b) Map showing the color overlay from the zones in Figure 7a on the lower Haynesville.
Figure 8. Haynesville bulk volume gas estimated from total porosity and water saturation.

July 2011 The Leading Edge 763
P r a c t i c a l a p p l i c at i o n s o f a n i s o t r o p y P r a c t i c a l a p p l i c at i o n s o f a n i s o t r o p y
• High-resolution dealiased Radon transform for multiple attenuation
• High-density azimuthal velocity analysis• Isotropic gather creation• Ray bending for offset-angle-gather conversion• Isotropic reservoir-oriented gather conditioning sequence
for prestack inversion
Seismic analysis and stress estimationAnalysis of the data suggests preferential development loca-tions are found in areas that have a combination of certain key rock properties. Specifically, optimal well placement should target areas of better porosity development, high si-liceous mineralogical content, and high values of TOC. In this study, the analysis shows a linear relationship between TOC and density, with density (Figure 4) being the key at-tribute to understand the TOC distribution in the Haynes-ville.
A detailed rock property analysis shows that properties such as Poisson’s ratio (Figure 4) and lambda-rho (incom-pressibility) bring valuable information in identifying these areas. Areas with low Poisson’s ratio are indicative of the more siliceous, low-carbonate content areas normally associated with better porosity development. Additionally, a bulk vol-ume of gas volume can be estimated by combining these elas-tic properties via multi-attribute analysis.
Well-calibrated Young’s modulus estimates from prestack seismic inversion are critical to isolate brittle areas within the shale. However, interpretation of Young’s modulus alone is insufficient to identify optimum targets for hydraulic frac-turing (Gray et al., 2010). It is also necessary to understand stress-field distribution characterized by DHSR. Areas that display both low values of DHSR and high values of Young’s modulus characterize ideal areas for hydraulic fracturing, as indicated in Figure 5. Hooke’s law provides the relationship between stress and strain which is controlled by the elastic properties of the rock. By combining this information into the linear slip theory (Gray et al.; Iverson, 1995), the three components of the stress vector can be obtained.
Predictive models of fracture initiation pressure and clo-sure stress add value in the development of well completion programs. Fracture-initiation pressure is interpreted to be pressure above which injection of fluids will cause the rock formation to fracture hydraulically. Similarly, the closure stress is the pressure at which fractures will effectively close without proppant in place (Iverson). These parameters were estimated via the stress formulation presented in the previous section. In Figure 6, we show a cross section of these stress-related properties for a horizontal well in the Haynesville. These properties must be calibrated to well measurements to increase their reliability. A calibration study is in progress and the corresponding results will be published in a sequel paper.
Multi-attribute analysis/integrationFractures will propagate without a preferential horizontal orientation in brittle areas with low DHSR. Figure 7a dis-plays a crossplot of these properties in the Haynesville within
NEOS-041_TLE.indd 2 6/3/11 5:11 PM
764 The Leading Edge July 2011
P r a c t i c a l a p p l i c at i o n s o f a n i s o t r o p y
the study area. Figure 7b shows a map of the most probable optimal zones for hydraulic fracturing in the lower Haynes-ville.
A key objective of this work was to use isotropic and anisotropic attributes derived from 3D seismic data to pre-dict rock property behavior away from well control. Multi-attribute analysis determines the best fit to known logs (control) at well locations and then applies the correspond-ing multi-attribute transform to the 3D volume. Input data included the results of the simultaneous inversion, pore-pres-sure prediction, stress analysis, curvature, and other seismic attributes. Training was performed at well locations to derive the optimum combination of attributes to predict volumet-ric petrophysical properties. Such key properties include: total porosity, effective porosity, volume of clay, water satu-ration, volume of quartz, and volume of carbonate. Results were validated by “hiding” wells and then predicting petro-physical values at their locations from the other wells in the project. Once training was complete, the predicted volumes were used to estimate the bulk gas volume (Figure 8) in the Haynesville and Bossier throughout the 3D survey.
In general, we found that no single attribute provides enough information to correlate seismic data to production. By correlating multiple elastic and stress-related attributes to average production and horizontal well length at well loca-tions, a predicted production map can be generated (Figure 9) with 95% correlation. The map shows several undrilled areas with potentially high predicted productivity. The main drivers in this correlation are the Young’s modulus, DHSR, Poisson’s ratio, and density.
ValidationCalibration and validation play a critical role in this study. A seismically derived prediction of the stress regime must be calibrated to core and well-test measurements. Figure 10 shows the east-west regional orientation of the maximum horizontal stress over the Haynesville area. This agrees with historical fracture stimulation patterns with horizontal wells drilled in a north-south direction as shown in Figure 9. However, the lateral variability of the direction of maximum horizontal stress, as indicated in Figure 5, shows that the lo-cal stress field is variable. The understanding of this variation is critical for optimal completions.
In order to validate the use of multi-azimuth seismic data to predict local stress environments, we compared the seis-mically predicted local stress fields to triaxial measurements from core samples at two locations. The full strain tensor and the principal stress directions were measured from these core samples, which then served as baseline values to which seismic predictions were correlated. We found that the direc-tion of maximum horizontal stress, predicted from seismic observations, matched within 5% of the corresponding core stress measurements.
ConclusionsWe have presented an integrated seismic approach based on prestack azimuthal seismic data analysis and well-log infor-
mation to estimate geomechanical properties, predict in-situ principal stresses, and identify preferential drilling lo-cations. Parameters such as Young’s modulus and Poisson’s ratio prove to be valuable for target discrimination. Stress-related parameters such as differential horizontal stress ratio, fracture-initiation pressure, and closure pressure were also estimated. These parameters are critical at the completion stage of the fracture stimulation process. The reliability of these estimates has been addressed by calibrating to triaxial measurements from core samples. Additional calibration, however, is needed to increase confidence in the results of this study. A detailed calibration study is in progress and the results will be presented in a sequel paper.
Relative production estimates were also derived from combining geomechanical and stress properties to estimate porosity, shale, quartz and carbonate content, and water saturation.
Ideally, we would like to use these stresses and related volumes in a predictive mode for optimal well placement and completion strategy. The main benefits of the workflow pre-sented in this paper are:
• Better definition of reservoir drainage geometry• Better well placement for field development• Prediction of fracture behavior• Grouping of reservoir intervals with similar stress profiles
for optimal-stage zoning in hydraulic fracture stimulation• Avoidance of drilling hazards
With similar input data sets, the analysis and interpreta-tion of shale production development can easily be extended to analogous environments with minimal modifications.
ReferencesGoodway, W., J. Varsek, and C. Abaco, 2007, Isotropic AVO methods
to detect fracture prone zones in tight gas resource plays: Presented at 2007 CSPG CSEG Convention.
Gray, D., P. Anderson, J. Logel, F. Delbeck, and D. Schmidt, 2010, Estimating in-situ, anisotropic, principle stresses from 3D seismic: 72nd Annual Meeting, EAGE.
Gray, F. D., 2011, Methods and systems for estimating stress using seis-mic data. U.S. Patent pending (docket number HO-P03717US0).
Iverson, W. P., 1995, Closure stress calculations in anisotropic forma-tions: SPE paper 29598.
Rich, J. P. and M. Ammerman, 2010, Unconventional geophysics for unconventional plays: SPE paper 131779.
Sena, A., 1991, Seismic traveltime equations for azimuthally anisotro-pic and isotropic media: Estimation of interval elastic constants: Geophysics, 56, no. 12, 2090–2101, doi:10.1190/1.1443021.
Acknowledgments: The authors thank CGGVeritas for per mission to publish this paper. We also thank Robert Mayer, Jon Downton, Reinaldo Michelena, and Heloise Lynn for reviewing the manu-script and providing many constructive comments.
Corresponding authors: [email protected]; [email protected]

P r a c t i c a l a p p l i c at i o n s o f a n i s o t r o p y
1) blank for ad