3q 2018 earnings release
TRANSCRIPT

3Q 2018
Earnings Release Oct 2018

DISCLAIMER
Financial results for 3Q 2018 are provisional and subject to change according to
the outside independent auditors’ review.
This presentation contains forward-looking statements that are based on our
current expectation, assumptions, estimates and projections about S-OIL and the
refinery industry. We caution you not to place undue reliance on any forward-
looking statement which may involve various risks and uncertainties.
Please also note that although we believe that the assumptions on which our
forward-looking statements are based are reasonable, any of those assumptions
could prove to be inaccurate, and, as a result, the forward-looking statements
based on those assumptions could be incorrect. Except as required by law, we
do not undertake to release the results of any revisions of these forward-looking
statements to reflect future events or circumstances.
2
Contents
3Q 2018 Performance
3Q 2018 Financial Result ∙ ∙ ∙ ∙ ∙ ∙ ∙ ∙ ∙ ∙ ∙ ∙ ∙ ∙ ∙ ∙ ∙ ∙ ∙ ∙ ∙ ∙ ∙ ∙ ∙ ∙ ∙ ∙ ∙ ∙ ∙ ∙ ∙ ∙ ∙ ∙ ∙ ∙ ∙ ∙ ∙ ∙ ∙ ∙ ∙ ∙ ∙ ∙ ∙ 4
Financial Status ∙ ∙ ∙ ∙ ∙ ∙ ∙ ∙ ∙ ∙ ∙ ∙ ∙ ∙ ∙ ∙ ∙ ∙ ∙ ∙ ∙ ∙ ∙ ∙ ∙ ∙ ∙ ∙ ∙ ∙ ∙ ∙ ∙ ∙ ∙ ∙ ∙ ∙ ∙ ∙ ∙ ∙ ∙ ∙ ∙ ∙ ∙ ∙ ∙ ∙ ∙ ∙ ∙ ∙ ∙ ∙ 5
Capital Expenditure ∙ ∙ ∙ ∙ ∙ ∙ ∙ ∙ ∙ ∙ ∙ ∙ ∙ ∙ ∙ ∙ ∙ ∙ ∙ ∙ ∙ ∙ ∙ ∙ ∙ ∙ ∙ ∙ ∙ ∙ ∙ ∙ ∙ ∙ ∙ ∙ ∙ ∙ ∙ ∙ ∙ ∙ ∙ ∙ ∙ ∙ ∙ ∙ ∙ ∙ ∙ ∙ ∙ 6
Operation ∙ ∙ ∙ ∙ ∙ ∙ ∙ ∙ ∙ ∙ ∙ ∙ ∙ ∙ ∙ ∙ ∙ ∙ ∙ ∙ ∙ ∙ ∙ ∙ ∙ ∙ ∙ ∙ ∙ ∙ ∙ ∙ ∙ ∙ ∙ ∙ ∙ ∙ ∙ ∙ ∙ ∙ ∙ ∙ ∙ ∙ ∙ ∙ ∙ ∙ ∙ ∙ ∙ ∙ ∙ ∙ ∙ ∙ ∙ ∙ ∙ ∙ 7
Performance by Business Segment
Financial Result by Business Segment ∙ ∙ ∙ ∙ ∙ ∙ ∙ ∙ ∙ ∙ ∙ ∙ ∙ ∙ ∙ ∙ ∙ ∙ ∙ ∙ ∙ ∙ ∙ ∙ ∙ ∙ ∙ ∙ ∙ ∙ ∙ ∙ ∙ ∙ ∙ ∙ ∙ 8
Market Environment in 3Q 2018 ∙ ∙ ∙ ∙ ∙ ∙ ∙ ∙ ∙ ∙ ∙ ∙ ∙ ∙ ∙ ∙ ∙ ∙ ∙ ∙ ∙ ∙ ∙ ∙ ∙ ∙ ∙ ∙ ∙ ∙ ∙ ∙ ∙ ∙ ∙ ∙ ∙ ∙ ∙ ∙ ∙ ∙ ∙ 9
Appendices
Summarized Income Statement ∙ ∙ ∙ ∙ ∙ ∙ ∙ ∙ ∙ ∙ ∙ ∙ ∙ ∙ ∙ ∙ ∙ ∙ ∙ ∙ ∙ ∙ ∙ ∙ ∙ ∙ ∙ ∙ ∙ ∙ ∙ ∙ ∙ ∙ ∙ ∙ ∙ ∙ ∙ ∙ ∙ ∙ ∙ 13
Sales Breakdown ∙ ∙ ∙ ∙ ∙ ∙ ∙ ∙ ∙ ∙ ∙ ∙ ∙ ∙ ∙ ∙ ∙ ∙ ∙ ∙ ∙ ∙ ∙ ∙ ∙ ∙ ∙ ∙ ∙ ∙ ∙ ∙ ∙ ∙ ∙ ∙ ∙ ∙ ∙ ∙ ∙ ∙ ∙ ∙ ∙ ∙ ∙ ∙ ∙ ∙ ∙ ∙ ∙ ∙ 14
RUC/ODC Project Overview ∙ ∙ ∙ ∙ ∙ ∙ ∙ ∙ ∙ ∙ ∙ ∙ ∙ ∙ ∙ ∙ ∙ ∙ ∙ ∙ ∙ ∙ ∙ ∙ ∙ ∙ ∙ ∙ ∙ ∙ ∙ ∙ ∙ ∙ ∙ ∙ ∙ ∙ ∙ ∙ ∙ ∙ ∙ ∙ ∙ 15
PP&PO Value Chain/Spread trend∙ ∙ ∙ ∙ ∙ ∙ ∙ ∙ ∙ ∙ ∙ ∙ ∙ ∙ ∙ ∙ ∙ ∙ ∙ ∙ ∙ ∙ ∙ ∙ ∙ ∙ ∙ ∙ ∙ ∙ ∙ ∙ ∙ ∙ ∙ ∙ ∙ ∙ ∙ 16
Long-term Margin Trend ∙ ∙ ∙ ∙ ∙ ∙ ∙ ∙ ∙ ∙ ∙ ∙ ∙ ∙ ∙ ∙ ∙ ∙ ∙ ∙ ∙ ∙ ∙ ∙ ∙ ∙ ∙ ∙ ∙ ∙ ∙ ∙ ∙ ∙ ∙ ∙ ∙ ∙ ∙ ∙ ∙ ∙ ∙ ∙ ∙ ∙ ∙ ∙ ∙ 17
Industry Outlook
4Q 2018 Outlook – Refining ∙ ∙ ∙ ∙ ∙ ∙ ∙ ∙ ∙ ∙ ∙ ∙ ∙ ∙ ∙ ∙ ∙ ∙ ∙ ∙ ∙ ∙ ∙ ∙ ∙ ∙ ∙ ∙ ∙ ∙ ∙ ∙ ∙ ∙ ∙ ∙ ∙ ∙ ∙ ∙ ∙ ∙ ∙ ∙ ∙ ∙ 10
4Q 2018 Outlook – Petrochemical & Lube Base Oil ∙ ∙ ∙ ∙ ∙ ∙ ∙ ∙ ∙ ∙ ∙ ∙ ∙ ∙ ∙ ∙ ∙ ∙ ∙ ∙ ∙ ∙ ∙ ∙ ∙ ∙ 11
Progress of RUC/ODC Project
Progress of RUC/ODC Project ∙ ∙ ∙ ∙ ∙ ∙ ∙ ∙ ∙ ∙ ∙ ∙ ∙ ∙ ∙ ∙ ∙ ∙ ∙ ∙ ∙ ∙ ∙ ∙ ∙ ∙ ∙ ∙ ∙ ∙ ∙ ∙ ∙ ∙ ∙ ∙ ∙ ∙ ∙ ∙ ∙ ∙ ∙ ∙ 12

5,211.8
5,814.4 5,410.9
6,003.1
7,187.9
69.1 68.7
61.5 62.5
70.2
3Q '17 4Q '17 1Q '18 2Q '18 3Q '18
Revenue
Revenue Sales Volume (mil. bbl)
3Q 2018 Financial Result
553.2
369.3
254.5
402.6
315.7
10.6% 6.4%
4.7%
6.7%
4.4%
3Q '17 4Q '17 1Q '18 2Q '18 3Q '18
Operating Income
Operating Income OP Margin
527.0 526.9
258.2 214.5
315.5
3Q '17 4Q '17 1Q '18 2Q '18 3Q '18
Income before Tax
4
(Unit: bil. Won) (Unit: bil. Won)
Increased 101.0 bil. Won QoQ
amid stable movement of
KRW/dollar exchange rate
- Inventory related gain: 35 bil. Won
(2Q ’18: 170 bil. Won)
- Singapore complex margin($/bbl):
3Q 3.3 (0.6↑,QoQ)
- F/X gain: 24.7 bil. Won
(2Q ’18 F/X loss: 179.2 bil. Won)
- \/$ rate: 3Q-end 1,112.7
(9.0↓, QoQ)
(Unit: bil. Won)
Increased 19.7% QoQ
on uplift in sales volume
and oil price rise
- Quarterly average selling price:
6.6%↑, QoQ
- Sales volume: 12.4%↑, QoQ
Declined due to contraction of
inventory related gain despite
refining margin recovery
Income before Tax

Financial Status
2,699 4,201 2,191 1,710 1,249
4,731 5,711
7,969 8,950 9,230
2,630
3,578 4,330 5,476 5,757
736
469 598
732 815
2015-end 2016-end 2017-end 1H '18-end 3Q '18-end
Assets
Cash Tangible asset A/R & inventory Others
17,051
5,391 6,392 6,843 6,649 6,809
1,588 2,146 1,370 2,593 2,804 2,007 2,564 3,475
3,457 3,590 1,810
2,858 3,401
4,169 3,847
2015-end 2016-end 2017-end 1H '18-end 3Q '18-end
Liabilities & Equities
Equity S-T borrowing L-T borrowing Other liabilities
Financial Status
Financial Ratios
5
(Unit: bil. Won) (Unit: bil. Won)
12.3%
20.5% 18.8%
10.4% 11.4%
9.3%
15.7% 14.5%
7.8% 8.6%
2015 2016 2017 1H '18 1~3Q'18
Return on equity
Return on capital employed
896 508
2,653
4,339
5,145
16.6% 7.9%
38.8%
65.3%
75.6%
'15-end '16-end 17-end 1H-end 3Q-end
Net debt (bil. Won) Net debt to equity
-0.9 -1.8 -5.9
-2.8
-15.0
2.0% 2.2% 2.3% 2.6% 2.7%
2015 2016 2017 1H '18 1~3Q'18
Net interest gain(bil. Won)
Average interest rate at the end of term
10,796
13,959 15,087
16,868
10,796
13,959 15,087
16,868 17,051

Capital Expenditure
CAPEX
Depreciation
(Unit: bil. Won) FY ’15 FY ’16 FY ’17 FY ’18 Plan 1~3Q ’18
RUC/ODC Project* 290.4 682.2 2,157.3 1,568.0 1,152.8
Land acquisition** - - - 239.5 21.7
Upgrade & Maintenance 343.9 328.0 300.0 233.2 151.0
Others 91.7 69.2 48.1 107.4 28.0
Total 726.0 1,079.4 2,505.4 2,148.1 1,353.6
(Unit: bil. Won) FY ’15 FY ’16 FY ’17 *2018 Plan 1~3Q ’18
Depreciation (Including catalyst amortization cost) 273.2 286.7 293.6 299.8 224.2
*Residue Upgrading Complex and Olefin Downstream Complex project
**Purchased from Hyundai Heavy Industries in Ulsan for future project
6
* The RUC/ODC portion will be added after its commercial operation
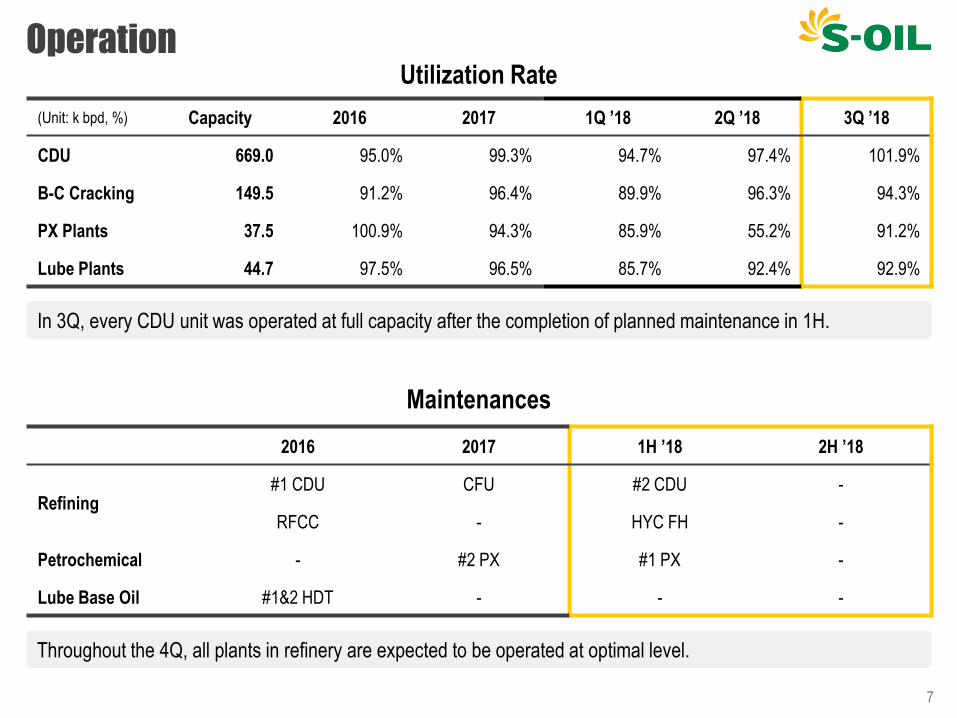
Operation
7
(Unit: k bpd, %) Capacity 2016 2017 1Q ’18 2Q ’18 3Q ’18
CDU 669.0 95.0% 99.3% 94.7% 97.4% 101.9%
B-C Cracking 149.5 91.2% 96.4% 89.9% 96.3% 94.3%
PX Plants 37.5 100.9% 94.3% 85.9% 55.2% 91.2%
Lube Plants 44.7 97.5% 96.5% 85.7% 92.4% 92.9%
Utilization Rate
Maintenances
2016 2017 1H ’18 2H ’18
Refining #1 CDU CFU #2 CDU -
RFCC - HYC FH -
Petrochemical - #2 PX #1 PX -
Lube Base Oil #1&2 HDT - - -
Throughout the 4Q, all plants in refinery are expected to be operated at optimal level.
In 3Q, every CDU unit was operated at full capacity after the completion of planned maintenance in 1H.

Financial Result by Business Segment
8
(Unit: bil. Won) 3Q ’17 YoY 2Q ’18 QoQ 3Q ’18
Revenue 4,107.4 39.5%↑ 4,754.1 20.5%↑ 5,728.1
Operating Income 336.4 49.3%↓ 305.2 44.2%↓ 170.4
(Margin) (8.2%) - (6.4%) - (3.0%)
Refining
Lube Base Oil
Petrochemical
(Unit: bil. Won) 3Q ’17 YoY 2Q ’18 QoQ 3Q ’18
Revenue 699.5 50.2%↑ 829.3 26.7%↑ 1,050.4
Operating Income 90.5 12.8%↑ 16.5 518.4%↑ 102.1
(Margin) (12.9%) - (2.0%) - (9.7%)
(Unit: bil. Won) 3Q ’17 YoY 2Q ’18 QoQ 3Q ’18
Revenue 405.0 1.1%↑ 419.7 2.5%↓ 409.4
Operating Income 126.3 65.8%↓ 80.9 46.6%↓ 43.2
(Margin) (31.2%) - (19.3%) - (10.6%)
80%
14%
6%
3Q ’18 Revenue
54% 32%
14%
3Q ’18 Operating Income
Refining Petrochemical Lube

283
254
271
251
239
3Q '17 4Q '17 1Q '18 2Q '18 3Q '18
Product Spread
Group I (150N)-HSFO380
338 298
362
324
493
293 269
309
201 189
413
348
445
415 417
3Q '17 4Q '17 1Q '18 2Q '18 3Q '18
Product Spread
P-Xylene Benzene Propylene
Market Environment in 3Q 2018
9
5.5 4.9
4.4
2.7 3.3
3Q '17 4Q '17 1Q '18 2Q '18 3Q '18
Singapore Margin
Singapore Complex Refining Margin
[ GRM – Variable Cost ]
Refining
Source: IHS, ICIS, the Company
(Unit: $/bbl)
Petrochemical Lube Base Oil
(Unit: $/ton)
LBO spread decreased due to time
lagging effect and low seasonality.
(Unit: $/ton)
PX spread strongly hiked due to
delays in ramp-up of new facilities and
strong demand. However, benzene
spread was weakened by increased
supply.
Refining margin improved on the back
of solid demand, coupled with limited
new capacity additions and regular
maintenances in the region.

0.90
2.03
1.34 1.48 1.36
1.49
2014 2015 2016 2017 2018(E) 2019(E)Capacity Addition Capacity Closure Net Capacity Increase Demand Growth
Refining margin to increase driven by tight demand-supply balance
The seasonal demand growth and limited capacity expansions in Asia Pacific will further boost the refining margin.
4Q ’18 demand growth forecast
4Q ’18 Outlook – Refining
10
(Unit: mil. bpd) Asia Pacific Global
IEA OPEC EIA IEA OPEC EIA
YoY +1.08 +0.78 +0.82 +1.66 +1.70 +1.56
Global Net Capacity Increase vs. Demand Growth
Source: IEA, OPEC, EIA, FACTS Global Energy, Wood Mackenzie, The Company
1.51
0.13
0.60 0.46
0.86 0.92
(Unit: million bpd)

4Q ’18 Outlook – Petrochemical & Lube Base Oil
11
Petrochemical
Lube Base Oil
Source: PCI, IHS, Argus, The Company
(Unit: k tpa)
Aromatic Spread (vs. Naphtha)
• PP : Spread is expected to be flattish due to limited supply
from seasonal maintenance despite weak buying interest
sentiment.
• PO : Despite concerns about supply increase, spread is
expected to rebound on recovering economics of PO
downstream product.
Olefin Spread (vs. Propylene)
3,476 2,303 2,966 2,955 3,288 3,099
2017 2018 2019
PP Capacity Expansion PP Demand Growth
PP capacity expansion and
demand growth (Asia & ME)
(Unit: k tpa)
2,300 2,235
0
2,140 3,455
1,273
2017 2018 2019
PX Capacity Expansion PX Demand Growth
PX capacity expansion and
demand growth (Asia & ME)
Spread to be maintained
The spread is likely to move at around 3Q level due to seasonal demand weakness in spite of continued solid
demand for high-quality products.
• Para-Xylene : Spread would remain at a strong level on
the solid downstream demand despite the gradual
expansion of supply from new facilities in the region.
• Benzene : Spread will be maintained at a weak level due
to slowdown of downstream demand in 4Q.
(Unit: k tpa)

Progress of RUC/ODC Project
12
Project 2Q ’18 3Q ’18 4Q ’18
RUC
ODC
Mechanical Completion
Commissioning
Feed in & Start-up
On-spec Production & Ramp-up
Mechanical Completion
Commissioning
Feed in & Start-up
On-spec Production & Ramp-up
Commercial
Operation
Commercial operation is expected to start in November
During the 3Q, the Project has been successfully through the stage of ramp-up and stable operation.
At the moment, most of major plants are fully ramped up and operated at maximum design capacity.

Appendix 1
13
(Unit: bil. Won) 3Q ’17 YoY 2Q ’18 QoQ 3Q ’18
Revenue 5,211.8 37.9%↑ 6,003.1 19.7%↑ 7,187.9
Operating Income 553.2 42.9%↓ 402.6 21.6%↓ 315.7
(Margin) (10.6%) - (6.7%) - (4.4%)
Finance & Other Income -27.2 - -189.3 - -0.6
- Net Interest Gain -1.6 - -3.1 - -12.2
- Net F/X Gain* -15.4 - -179.2 - 24.7
- Others -10.1 - -7.0 - -13.1
Equity Method Gain 0.9 63.1%↓ 1.1 70.3%↓ 0.3
Income before Tax 527.0 40.1%↓ 214.5 47.1%↑ 315.5
Net Income 398.7 42.3%↓ 163.2 40.8%↑ 229.9
* Including gain/loss from F/X derivatives for hedging
Summarized Income Statement

Appendix 2
14
Sales Breakdown
(Unit: k bpd, %) 3Q ’17 4Q ’17 1Q ’18 2Q ’18 3Q ’18
Sales Total 751 747 684 693 765
Domestic 353 362 346 333 320
Export 398 385 338 361 445
(% in Total) (52.9%) (51.5%) (49.4%) (52.0%) (58.2%)
China 20.2% 26.0% 29.3% 24.6% 23.7%
Australia 16.4% 19.9% 11.7% 16.1% 14.5%
Japan 11.6% 12.2% 20.0% 13.5% 13.1%
USA 8.8% 10.5% 4.1% 8.5% 11.1%
South East Asia 11.0% 7.6% 10.8% 10.8% 8.4%
Taiwan 3.3% 1.0% 1.5% 5.8% 6.2%
Singapore 8.6% 6.8% 2.6% 4.2% 4.8%

Appendix 3
15
RUC/ODC Project Overview (Residue Upgrading Complex & Olefin Downstream Complex)
#3 RHDS
(63 k bpd)
HS-FCC
(76 k bpd)
ODC
(705 k tpa) Gasoline (21 k bpd)
Alkylate (14 k bpd)
MTBE (370 k tpa)
Polypropylene (405 k tpa)
Propylene Oxide (300 k tpa)
Major Process Major Product
Residue
CAPEX (E)
Profitability (E) IRR:18.3%, Payback period: 6 years (Estimated in 2H 2015)
Total ~2015 2016 2017 2018
4.8 tri. Won 0.4 tri. Won 0.7 tri. Won 2.2 tri. Won 1.5 tri. Won
12%
77%
74%
6%
6%
13%
8%
After
Before
Company total product portfolio
Heavy oil Light oil Lube base oil Petrochemical
46%
71%
17%
21%
37%
8%
Petrochemical business product portfolio
PX Benzene Olefin
15

Appendix 4
16
PP(Poly Propylene) / PO (Propylene Oxide) Value Chain
The Company’s
end product Applications
PO
Polyol
Propylene
Glycol
Glycol Ether
Others
Polyurethane
(Rigid)
Polyurethane
(Flexible)
Reagents for industrial use
Insulation material for buildings, Synthetic wood
Cosmetics, Additives for beverage, Textile
Solvent, Detergent, Ink
Home appliances, Car interior, Furniture
Homo PP
Impact PP Automobile (Trunk hood, Fender, Bumper, etc), Electronic materials
Film for packaging, Tape, Clothing, Home appliances, Food containers
794 728 731
844
1,131
907 993
1,209
2015 2016 2017 1~3Q18
PP - HSFO 380 CST PO - HSFO 380 CST
*PP: Homo CFR CHN , PO: CFR CHN / Source: ICIS, Platts, the Company
PP and PO Spread Trend (vs. HSFO)

Appendix 5
17
Long-term Margin Trend
6.4 7.3
0.5 1.5
3.4 3.1 2.4 2.0
5.3
3.9 4.6
3.5
2007 2008 2009 2010 2011 2012 2013 2014 2015 2016 2017 1~3Q 2018
Singapore Complex Refining Margin (GRM - Variable cost) (Unit: $/bbl)
386
550
246 351
517
369 308
416
281 228 257 254
2007 2008 2009 2010 2011 2012 2013 2014 2015 2016 2017 1~3Q 2018
Group I (150N) lube base oil - HSFO (Unit: $/ton)
405
296 359
312
604 554 552
338 332 378 339
394
2007 2008 2009 2010 2011 2012 2013 2014 2015 2016 2017 1~3Q 2018
Para xylene - Naphtha (Unit: $/ton)

Thank You
S-OIL IR Team
S-OIL, the only company named to DJSI World for the 9th consecutive year
among Asia Pacific refiners