3q 2021 presentation
TRANSCRIPT

2021 © Aker Solutions
3Q 2021Fornebu, October 27, 2021Kjetel Digre and Idar Eikrem #PowerTheChange
November 4, 2021: Updated Backlog by Execution Year on slide 15
2021 © Aker Solutions
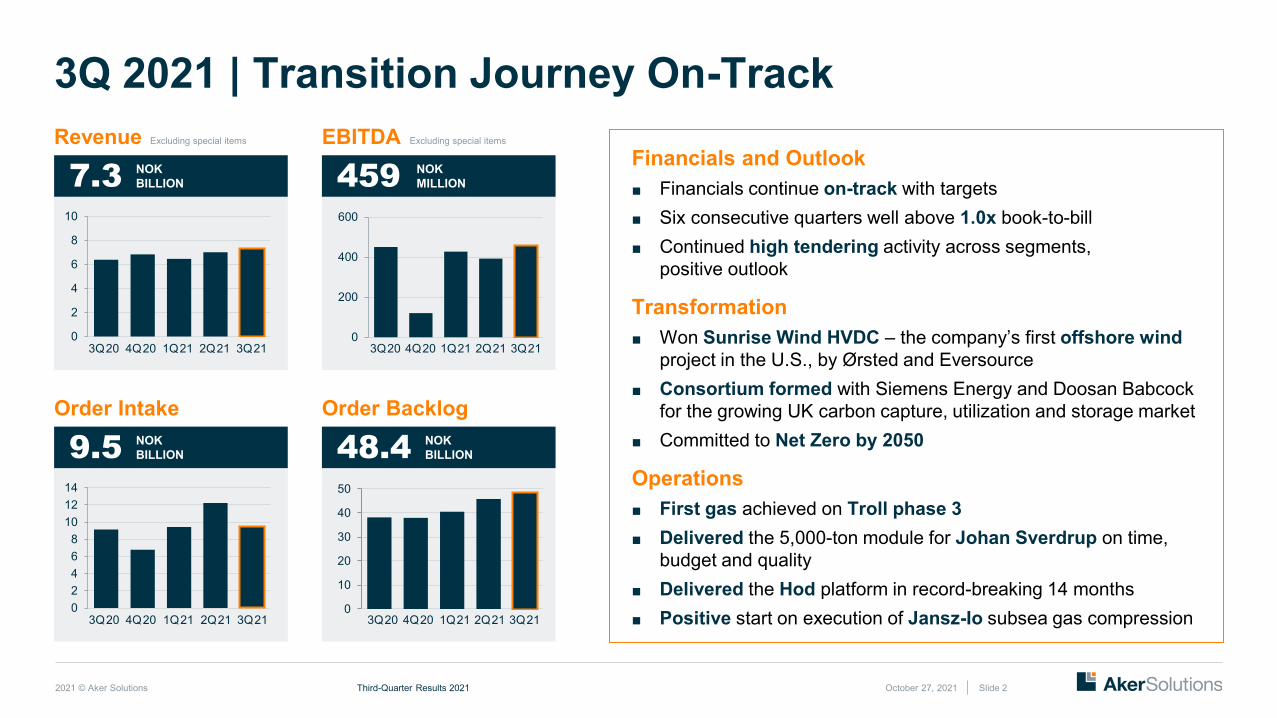
3Q 2021 | Transition Journey On-Track
October 27, 2021Third-Quarter Results 2021 Slide 2
7.3 NOK BILLION
0
2
4
6
8
10
3Q20 4Q20 1Q21 2Q21 3Q21
Revenue EBITDAExcluding special items
459 NOK MILLION
9.5 NOK BILLION
02468
101214
3Q20 4Q20 1Q21 2Q21 3Q21
Order Intake Order Backlog
48.4 NOK BILLION
3Q20 4Q20 1Q21 2Q21 3Q210
10
20
30
40
50
0
200
400
600
3Q20 4Q20 1Q21 2Q21 3Q21
Excluding special items
Financials and Outlook■ Financials continue on-track with targets■ Six consecutive quarters well above 1.0x book-to-bill■ Continued high tendering activity across segments,
positive outlook
Transformation■ Won Sunrise Wind HVDC – the company’s first offshore wind
project in the U.S., by Ørsted and Eversource■ Consortium formed with Siemens Energy and Doosan Babcock
for the growing UK carbon capture, utilization and storage market■ Committed to Net Zero by 2050
Operations■ First gas achieved on Troll phase 3■ Delivered the 5,000-ton module for Johan Sverdrup on time,
budget and quality■ Delivered the Hod platform in record-breaking 14 months■ Positive start on execution of Jansz-Io subsea gas compression

2021 © Aker Solutions
3Q 2021 | Six Consecutive Quarters of >1.0x Book-to-Bill
October 27, 2021Third-Quarter Results 2021 Slide 3
■ Sunrise offshore wind, HVDC platform for Ørsted in the U.S.
■ NOA Fulla FEEDs, two platforms for Aker BP on the NCS
■ Kakinada FEED, LNG terminal for Crown LNG in India
■ Growth in scope on existing contracts
■ Tommeliten, topside modification for tie-back to Ekofisk field for ConocoPhillips on the NCS
■ NOA Fulla Electrification FEED, for Aker BP on the NCS
■ Growth in scope on existing contracts
■ Kobra East & Gekko, subsea production system for Aker BP on the NCS
■ Zohr North, 160 km umbilicals for Saipem in Egypt
■ Tommeliten, 30 km umbilicals for ConocoPhillips on the NCS
■ Frosk, subsea equipment for Aker BP on the NCS
Renewables and
Field Development
NOK 5.0 billion NOK 2.2 billion NOK 2.5 billion
SubseaElectrification,
Maintenance and
Modifications

2021 © Aker Solutions
1Electrification, Maintenance and Modifications
4817 NOK BILLION
33 NOK BILLION
15 NOK BILLION
6 NOK BILLION
9 NOK BILLION
About 25% Related to Energy Transition
Renewables and Field Development
Subsea 28
4EMM1
NOK 80 Billion of Tendering
Tendering by Reporting Segment NOK Billion

2021 © Aker Solutions
Selected Large Areas to be Developed on the NCS
October 27, 2021Third-Quarter Results 2021 Slide 5
NOAKA (Greenfield)■ FEEDs for Noa Fulla awarded, potentially representing a
value of around NOK 12 billion to Aker Solutions1
■ Topsides and subsea production systems■ Electrification from shore planned■ Significant use of digitalization■ Alliances with shared incentives
Valhall (Further Development)■ Development of existing fields and infrastructure■ Topsides, jackets and subsea tie-backs■ Decommissioning and recycling of old assets■ Significant use of digitalization■ Electrified from shore since 2013■ Alliances with shared incentives
Wisting (Greenfield)■ FEED for the FPSO awarded, potentially representing
a value in the range of NOK 8 to 12 billion to Aker Solutions1
■ Topsides and subsea productions systems■ Electrification from shore planned1Subject to FID and regulatory approvals, expected in the second half of 2022
Norway
NOAKA
Wisting
Valhall
Significant Activity Growth Expected on the NCS2
4
107
41 2
9 105
2 2
22
32
05
101520253035 Sanctioned Rystad estimate
2010
2011
2012
2017
2016
2013
2014
2015
2018
2019
2020
2021
e
2022
e
2023
e
0
2Source: Rystad Energy, June 2021 (by year the PDO was approved, not submitted)
Barents Sea
North Sea

2021 © Aker Solutions
Sunrise Wind
HVDC platform
October 27, 2021Third-Quarter Results 2021 Slide 6
Transition Journey Well Underway
1 See the Appendix for definition of Energy Transition
Hywind Tampen
Offshore wind
Photo: Aker Carbon Capture
Jansz
Subsea gas compression
Norcem CCS
Carbon capture facility
Arctic Offshore Farming
Offshore fish farming
Heimdal and Veslefrikk
and recycling
Northern Lights
Storage of captured CO2
Troll West
Electrification from shore
Photo: Equinor
Our solutions reduce CO2 emissions equivalent to 800,000 fossil-fuel cars every yearPhoto: Equinor
Photo: Equinor
Decommissioning
2021 © Aker Solutions October 27, 2021Third-Quarter Results 2021 Slide 7
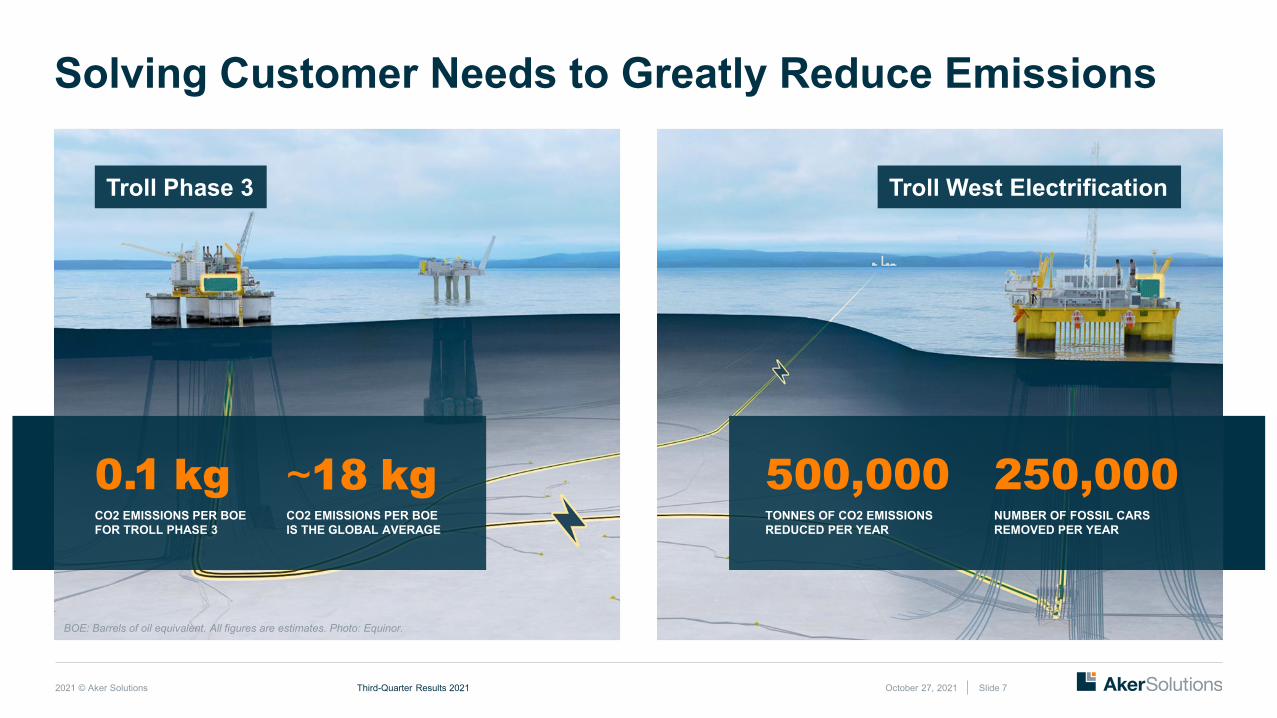
Solving Customer Needs to Greatly Reduce Emissions
0.1 kgCO2 EMISSIONS PER BOEFOR TROLL PHASE 3
~18 kgCO2 EMISSIONS PER BOEIS THE GLOBAL AVERAGE
500,000TONNES OF CO2 EMISSIONSREDUCED PER YEAR
250,000NUMBER OF FOSSIL CARSREMOVED PER YEAR
Troll Phase 3 Troll West Electrification
BOE: Barrels of oil equivalent. All figures are estimates. Photo: Equinor.

2021 © Aker Solutions
Building a Stronger Foundation■ Health, safety and quality■ Maintain strong position in global oil & gas
market■ High front-end and tendering activity■ Continue delivering solid project execution,
driving improved margins, cost position and cash generation
On-Track With Targets – Positive Outlook
Repositioning and Transforming■ Leverage increased NCS activity■ Growth in renewables and transitional
solutions for oil & gas■ New alliances and partnerships■ Further improve margins and
cash generation
Short-Term Medium-Term
October 27, 2021Third-Quarter Results 2021 Slide 8

2021 © Aker Solutions
Financial PerformanceIdar Eikrem, CFO
2021 © Aker Solutions
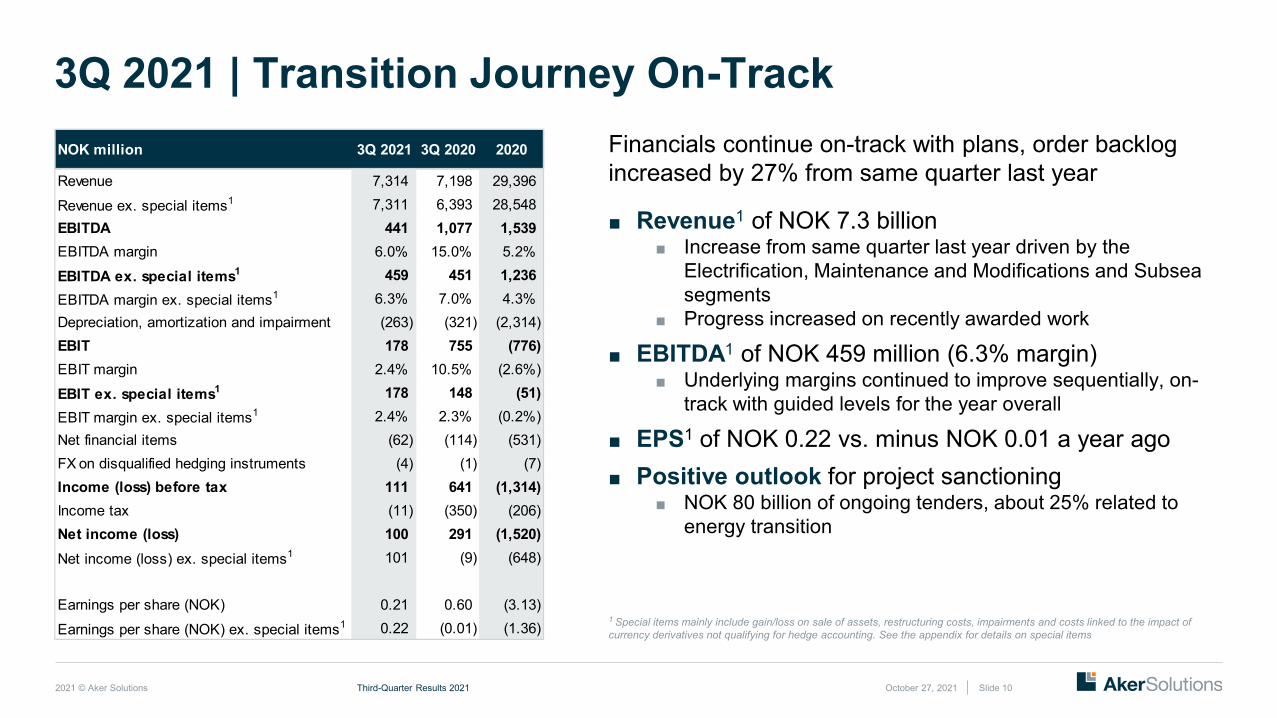
3Q 2021 | Transition Journey On-Track
October 27, 2021Third-Quarter Results 2021 Slide 10
1 Special items mainly include gain/loss on sale of assets, restructuring costs, impairments and costs linked to the impact of currency derivatives not qualifying for hedge accounting. See the appendix for details on special items
Financials continue on-track with plans, order backlog increased by 27% from same quarter last year
■ Revenue1 of NOK 7.3 billion■ Increase from same quarter last year driven by the
Electrification, Maintenance and Modifications and Subsea segments
■ Progress increased on recently awarded work
■ EBITDA1 of NOK 459 million (6.3% margin)■ Underlying margins continued to improve sequentially, on-
track with guided levels for the year overall
■ EPS1 of NOK 0.22 vs. minus NOK 0.01 a year ago■ Positive outlook for project sanctioning
■ NOK 80 billion of ongoing tenders, about 25% related to energy transition
NOK million 3Q 2021 3Q 2020 2020
Revenue 7,314 7,198 29,396 Revenue ex. special items1 7,311 6,393 28,548 EBITDA 441 1,077 1,539 EBITDA margin 6.0% 15.0% 5.2%EBITDA ex. special items1 459 451 1,236 EBITDA margin ex. special items1 6.3% 7.0% 4.3%Depreciation, amortization and impairment (263) (321) (2,314) EBIT 178 755 (776) EBIT margin 2.4% 10.5% (2.6%)EBIT ex. special items1 178 148 (51) EBIT margin ex. special items1 2.4% 2.3% (0.2%)Net financial items (62) (114) (531) FX on disqualified hedging instruments (4) (1) (7) Income (loss) before tax 111 641 (1,314) Income tax (11) (350) (206) Net income (loss) 100 291 (1,520) Net income (loss) ex. special items1 101 (9) (648)
Earnings per share (NOK) 0.21 0.60 (3.13) Earnings per share (NOK) ex. special items1 0.22 (0.01) (1.36)
2021 © Aker Solutions
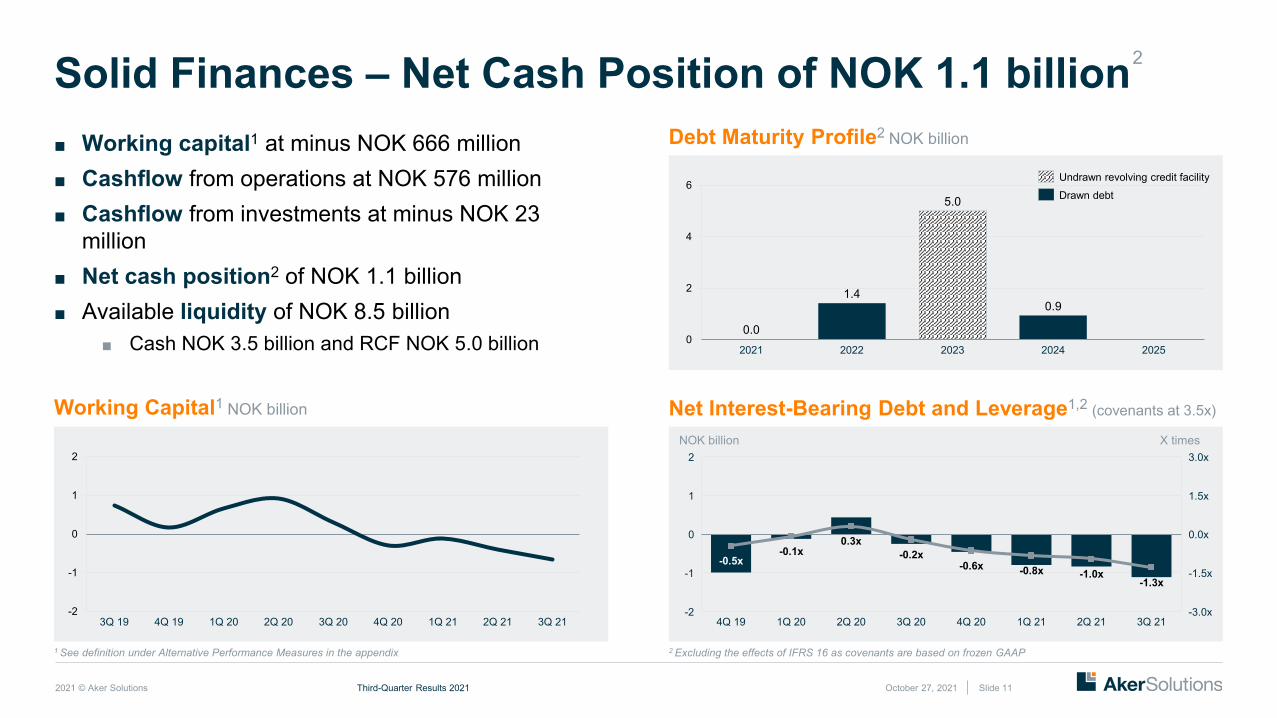
■ Working capital1 at minus NOK 666 million■ Cashflow from operations at NOK 576 million■ Cashflow from investments at minus NOK 23
million■ Net cash position2 of NOK 1.1 billion■ Available liquidity of NOK 8.5 billion
■ Cash NOK 3.5 billion and RCF NOK 5.0 billion
Net Interest-Bearing Debt and Leverage1,2 (covenants at 3.5x)
October 27, 2021Third-Quarter Results 2021 Slide 11
Solid Finances – Net Cash Position of NOK 1.1 billion
2 Excluding the effects of IFRS 16 as covenants are based on frozen GAAP 1 See definition under Alternative Performance Measures in the appendix
Debt Maturity Profile2 NOK billion
NOK billion X times
Working Capital1 NOK billion
-2
1
-1
0.0x0
2
-3.0x
1.5x
-1.5x
3.0x
4Q 19
-0.8x
2Q 20 2Q 21
-0.5x
4Q 20
-0.1x
1Q 20
0.3x-0.2x
3Q 20
-0.6x
1Q 21
-1.0x-1.3x
3Q 21-2
-1
0
1
2
3Q 19 3Q 212Q 212Q 201Q 204Q 19 3Q 20 4Q 20 1Q 21
0
2
4
6
20242021 20232022 2025
0.0
1.4
5.0
0.9
Undrawn revolving credit facilityDrawn debt
2

2021 © Aker Solutions
Renewables and Field Development■ Revenue of NOK 2.5 billion
■ Recently awarded projects in early phases of execution
■ EBITDA1 of NOK 89 million (3.6% margin)■ Several projects in early phases of execution■ Comparable quarter last year positively impacted by one-off
effects■ As a reminder, the margin was 4.5% in 1Q 2021 excl. the
positive effect of NOK 125 million from an arbitration ruling
■ Very strong order intake of NOK 5.0 billion (2.0x book-to-bill)■ Important Sunrise Wind contract in the U.S.■ NOA Fulla Topside FEEDs from Aker BP, with potential to
convert to NOK 10 billion order intake in 2H 2022
■ Healthy order backlog of NOK 11.6 billion■ Activity expected to increase somewhat moving
forward■ Progress increasing on recently awarded work■ High tendering activity
October 27, 2021Third-Quarter Results 2021 Slide 12
2.5 NOK BILLION
Revenue EBITDA and Margin1
89 NOK MILLION
5.0 NOK BILLION
Order Intake Order Backlog
11.6 NOK BILLION
9% 9%
4%
300
100
12%
3%
0
200
400
0%
6%
9%
4%
3Q 21
8%
3Q 20 4Q 20 1Q 21 2Q 21
3
0
2
1
5
4
3Q 20 4Q 20 1Q 21 2Q 21 3Q 21
10
4
2
0
6
8
12
1Q 213Q 20 4Q 20 2Q 21 3Q 21
1
0
2
4
3
3Q 20 4Q 20 1Q 21 2Q 21 3Q 21
1 Excluding special items

2021 © Aker Solutions
Electrification, Maintenance and Modifications (EMM)■ Revenue of NOK 2.4 billion
■ Slight increase year-on-year driven by good progress on ongoing projects
■ EBITDA1 of NOK 126 million (5.2% margin)■ Increase from comparable quarter last year
■ Solid order intake of NOK 2.2 billion (0.9x book-to-bill)■ Tommeliten topside modification contract from
ConocoPhillips■ NOA Fulla Electrification FEED from Aker BP
■ Strong order backlog of NOK 18.6 billion■ Excluding potential growth on existing frame agreements,
and value of extension options
■ Activity expected to increase slightly moving forward■ Stable revenue profile in the segment driven by several
multi-year frame agreements for operations and maintenance of offshore topside infrastructure
October 27, 2021Third-Quarter Results 2021 Slide 13
2.4 NOK BILLION
Revenue EBITDA and Margin1
126 NOK MILLION
2.2 NOK BILLION
Order Intake Order Backlog
18.6 NOK BILLION
-6%
4%5% 5%
-200
200
-100
0
100
-10%
-5%
0%
5%
10%
2Q 21
4%
3Q 20 4Q 20 1Q 21 3Q 21
0
3
1
2
4
5
3Q 20 4Q 20 2Q 211Q 21 3Q 210
5
10
15
20
4Q 203Q 20 1Q 21 2Q 21 3Q 21
1
0
2
4
3
4Q 20 2Q 213Q 20 1Q 21 3Q 21
1 Excluding special items

2021 © Aker Solutions
Subsea■ Revenue of NOK 2.4 billion
■ Starting to progress on recently awarded projects
■ EBITDA1 of NOK 336 million (14.1% margin)■ Driven by solid performance on ongoing projects in the
period
■ Solid order intake of NOK 2.5 billion (1.0x book-to-bill)■ Kobra East & Gekko Subsea Production System for Aker BP ■ Umbilical awards from Saipem and ConocoPhillips■ NOA Fulla Subsea FEED from Aker BP, with potential to
convert to NOK 2-3 billion order intake in the second half of 2022
■ Strong order backlog of NOK 18.5 billion■ Excluding short-cycled or book-and-turn service work
■ Activity-level expected to increase somewhat moving forward■ Progress increasing on recently awarded work■ High tendering activity
October 27, 2021Third-Quarter Results 2021 Slide 14
2.4 NOK BILLION
Revenue EBITDA and Margin1
336 NOK MILLION
2.5 NOK BILLION
Order Intake Order Backlog
18.5 NOK BILLION
12%
9%11%
200
0
100
400
300
500
0%
5%
10%
15%
20%
4Q 203Q 20
1%
1Q 21 2Q 21
14%
3Q 21
1.5
1.0
2.0
2.5
9.0
4Q 203Q 20 1Q 21 2Q 21 3Q 21
20
0
15
5
10
3Q 20 4Q 20 1Q 21 2Q 21 3Q 21
3
0
2
1
4
1Q 213Q 20 4Q 20 2Q 21 3Q 21
1 Excluding special items

2021 © Aker Solutions October 27, 2021Third-Quarter Results 2021 Slide 15
2 Book-to-bill is based on ‘revenue from customer contracts’, see APM in the Appendix for details (page 26)
Solid Order Backlog and VisibilityOrder Backlog by Execution Year NOK billion
Six Consecutive Quarters of >1.0x Book-to-Bill2 NOK billion
Order intake
Renewables and Energy Transition share1 NOK billion, %
Order Backlog3Q 20213Q 2020
Renewables & Energy Transition share1 Other
27% Increase in Order Backlog Last 12 months NOK billion
Order backlog
6,67,7 8,0
10,39,1
6,8
9,4
12,2
9,510
0
15
5
2Q 20 3Q 203Q 19 4Q 19 1Q 20 3Q 214Q 20 2Q 211Q 21
1.5x1.4x
1.0x
1.8x
1.5x0.9x0.8x
0.7x
1.3x
35
40
45
50
04Q 19
40.5
33.135.6
3Q 19 1Q 20 2Q 20 3Q 20
45.8
4Q 20
35.433.3
38.1 38.0
48.4
1Q 21 2Q 21 3Q 21
+27%
1 See the Appendix for definition of Energy TransitionRenewables and Field DevelopmentSubsea Electrification, Maintenance and Modifications
2,68,1
3,8 4,12,5
6,6
1,9 0,73,1
8,1
3,3 3,9
0
5
10
15
20
25
2021 2022 2023 2024 -->
8.2
22.7
9.0 8.634% 8%
November 4, 2021: Updated backlog phasing per year

2021 © Aker Solutions
■ 2021 overall revenue now seen at around NOK 29 billion■ 2021 overall underlying EBITDA continues to be seen up
from 2020 to around the 6.0% level■ Based on secured backlog and market activity, 2022
overall revenue is at this stage seen up 15% from 2021■ Working Capital fluctuates with large project work but is
now expected to trend in the range around NOK -700 to 0 million
■ Capex and R&D was reduced about 50% in 2020, and is expected to be further reduced by more than 30% in 2021
Forward-looking statements involve significant risks, uncertainties and assumptions that could cause actual results to differ materially from historical experience and present expectations or projections.
On-track with targets High secured backlog High tendering activity and positive outlook for
project sanctioning Within both Oil & Gas and Energy Transition Well-positioned for NCS activity
Leading Front-end and engineering capabilities Solid balance sheet Reduced cost base and Capex needs
Summary Outlook

2021 © Aker Solutions
Q&A

2021 © Aker Solutions
Additional Information
October 27, 2021Third-Quarter Results 2021 Slide 18

2021 © Aker Solutions
Guidance – Additional Items
October 27, 2021Third-Quarter Results 2021 Slide 19
Forward-looking statements involve significant risks, uncertainties and assumptions that could cause actual results to differ materially from historical experience and present expectations or projections.
■ Net financial items1 about minus NOK 80 million, per quarter■ D&A2 about NOK 1.1 to 1.2 billion, per year■ ‘Other’ EBITDA3 about minus NOK 100 million, per quarter■ Working capital in the range around NOK -700 to 0 million
1 Excluding the effects of currency and non-qualifying hedges2 Depreciation and Amortization (includes the effects of IFRS 16)3 Unallocated costs and idle IT & office costs
2021 © Aker Solutions
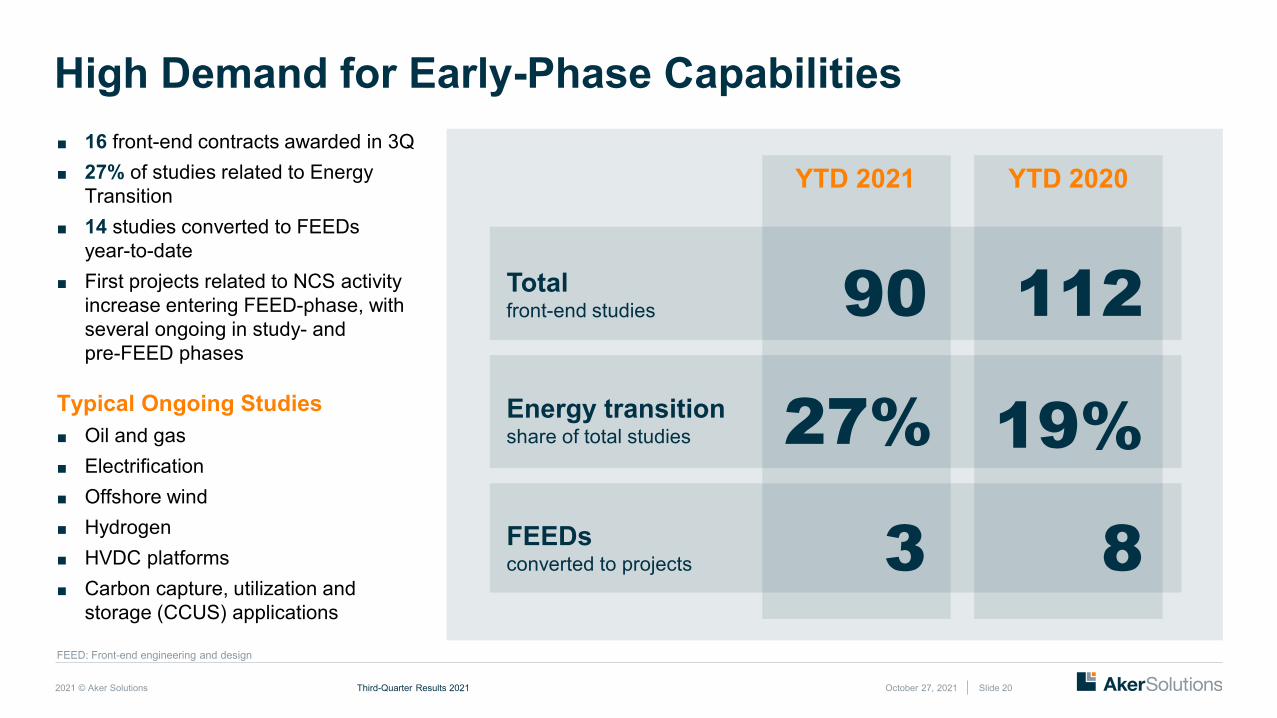
High Demand for Early-Phase Capabilities■ 16 front-end contracts awarded in 3Q■ 27% of studies related to Energy
Transition■ 14 studies converted to FEEDs
year-to-date■ First projects related to NCS activity
increase entering FEED-phase, with several ongoing in study- and pre-FEED phases
Typical Ongoing Studies■ Oil and gas■ Electrification■ Offshore wind■ Hydrogen■ HVDC platforms■ Carbon capture, utilization and
storage (CCUS) applications
October 27, 2021
YTD 2021 YTD 2020
Totalfront-end studies 90 112Energy transitionshare of total studies 27% 19%FEEDsconverted to projects 83
Third-Quarter Results 2021 Slide 20
FEED: Front-end engineering and design

2021 © Aker Solutions
Transition Journey – Our Targets
October 27, 2021Third-Quarter Results 2021 Slide 21
All numbers in NOK billion
1 See Appendix for definition of Energy Transition
Renewables & Energy Transition1
1/3 of revenues by 2025 2/3 of revenues by 2030
Scope 1 & 2 Emissions3
50% reduction in own emissions by 2030
Net Zero by 2050
3 With 2019 as baseline
1 See Appendix for definition of Energy Transition
Forward-looking statements involve significant risks, uncertainties and assumptions that could cause actual results to differ materially from historical experience and present expectations or projections.
NOK 1 billion+ annual free cash flow2
NOK 1.5 billion pre-tax overhead cost savings already implemented
Capex expected to decline >60% from 2019 to 2023
OverheadFY19
Target overheadcosts FY21
Cost improvements
2020-21
-30%
0.4
2019 2020 2025ambition
2021est.
2023target
0.6
1.2
0.4-30%
2.4Net cashposition
Gross debt Cash & cash equivalents
Ambition cash
generation2024-25
Target cashgeneration
3Q’20-YE’23
3.5
1.13.0
3.0
2 On average per year towards 2025 (excl. dividend, and IFRS 16)
Cash generationambition
Net cash position(per 3Q 2021)
Grow revenue about 10% annually towards 2025 Renewables &
Energy Transition share1
0
10
20
30
40
50
2019 2020 2021est.
2023target
2025ambition
38
2934
>43
~29

2021 © Aker Solutions
Renewables and Energy Transition
October 27, 2021Third-Quarter Results 2021 Slide 22
DefinitionRevenue from work related to renewables and transitional solutions incl. advanced and cleaner fossil-fuel solutions (ref. UN SDG 7.a).
These solutions and technologies include offshore wind, carbon capture, utilization and storage (CCUS), electrification of offshore and onshore facilities, hydrogen facilities, decommissioning & recycling and subsea gas compression.
This figure is compiled from a bottom-up approach of ongoing front-end and project work Aker Solutions is executing in the relevant period. The figures related to the definition are unaudited and subject to change.

2021 © Aker Solutions October 27, 2021Third-Quarter Results 2021 Slide 23
Alternative Performance Measures
Basis for PreparationThis presentation provides financial highlights for the quarter for Aker Solutions, a Norwegian limited company listed on the Oslo Stock Exchange.
Aker Solutions ASA merged with Kvaerner ASA in November 2020. The consolidated financial statements in this report include financial performance and position of both companies and its subsidiaries from the earliest period presented (January 1, 2019) based on the book-value approach.
The same measurement principles as presented in the Annual Report 2020 have been used when preparing this report. The report does not meet all disclosure requirements in IAS 34 (Interim Financial Reporting) and the figures are not audited.
Alternative Performance MeasuresAker Solutions discloses alternative performance measures in addition to those normally required by IFRS as such performance measures are frequently used by securities analysts, investors and other interested parties.
Alternative performance measures are meant to provide an enhanced insight into the operations, financing and future prospects of the company.

2021 © Aker Solutions October 27, 2021Third-Quarter Results 2021 Slide 24
Alternative Performance MeasuresProfit MeasuresEBITDA and EBIT terms are presented as they are used by financial analysts and investors. Special items are excluded from EBITDA and EBIT as alternative measures to provide enhanced insight into the financial development of the business operations and to improve comparability between different periods.
EBITDA is short for earnings before interest, taxes, depreciation and amortization. EBITDA corresponds to the “operating income before depreciation, amortization and impairment” in the consolidated income statement in the annual report.
EBIT is short for earnings before interest and taxes. EBIT corresponds to “operating income” in the consolidated income statement in the annual report.
Margins such as EBITDA margin and EBIT margin are used to compare relative profit between periods. EBITDA margin and EBIT margin are calculated as EBITDA or EBIT divided by revenue.
Special items may not be indicative of the ongoing operating result of cash flows of the company. Profit measures excluding special items are presented as alternative measures to improve comparability of the underlying business performance between the periods.
1) Earnings per share is calculated using Net income, adjusted for non-controlling interests, divided by average number of shares2) Earnings per share ex. special items is calculated using Net income ex. Special items, adjusted for non-controlling interests, divided by average number of shares
NOK million3Q 2021 3Q 2020 3Q 2021 3Q 2020 3Q 2021 3Q 2020 3Q 2021 3Q 2020 3Q 2021 3Q 2020
Revenue 2,499 2,538 2,406 1,877 2,385 2,091 25 692 7,314 7,198 Non-qualifying hedges - - - - - - (3) 3 (3) 3 Gain on dividend distribution of ACC and AOW shares - - - - - - - (804) - (804) (Gain) loss on sale of PPE - - - - - - - (3) - (3) Sum of special items excluded from revenue - - - - - - (3) (805) (3) (805) Revenue ex. special items 2,499 2,538 2,406 1,877 2,385 2,091 21 (113) 7,311 6,393
- - EBITDA 89 123 113 64 330 238 (91) 652 441 1,077 Gain on dividend distribution of ACC and AOW shares - - - - - - - (804) - (804) (Gain) loss sale of PPE - - - - - - - (3) - (3) Restructuring cost 0 70 13 2 5 4 0 107 19 183 Non-qualifying hedges - - - - - - (1) (1) (1) (1) Other special items - - - - - - 1 (1) 1 (1) Sum of special items excluded from EBITDA 0 70 13 2 5 4 (0) (702) 18 (626) EBITDA ex. special items 89 193 126 66 336 242 (92) (50) 459 451
EBITDA margin 3.6 % 4.9 % 4.7 % 3.4 % 13.8 % 11.4 % 6.0 % 15.0 %EBITDA margin ex. special items 3.6 % 7.6 % 5.2 % 3.5 % 14.1 % 11.6 % 6.3 % 7.0 %
EBIT 19 88 84 23 169 34 (94) 610 178 755 Sum of special items excluded from EBITDA 0 70 13 2 5 4 (0) (702) 18 (626) Impairments - (5) 0 (5) 2 23 (20) 7 (19) 19 Sum of special items excluded from EBIT 0 65 13 (3) 7 26 (21) (695) (0) (607) EBIT ex. special items 19 153 97 20 176 61 (115) (86) 178 148
EBIT margin 0.8 % 3.5 % 3.5 % 1.2 % 7.1 % 1.6 % 2.4 % 10.5 %EBIT margin ex. special items 0.8 % 6.0 % 4.0 % 1.1 % 7.4 % 2.9 % 2.4 % 2.3 %
Net income 100 291 Sum of special items excluded from EBIT (0) (607) Other financial items (special items) - (1) Non-qualifying hedges 4 1 Tax effects on special items (3) 309 Net income ex. special items 101 (9) Net income to non-controlling interests 5 6 Net income ex. non-controlling interests 106 (3)
Average number of shares (in '000) 489,740 492,065 Earnings per share1) 0.21 0.60 Earnings per share ex. special items2) 0.22 (0.01)
Renewables &Field Development Subsea Other/eliminations Aker Solutions
Electrification, Maintenance & Modifications
2021 © Aker Solutions October 27, 2021Third-Quarter Results 2021 Slide 25
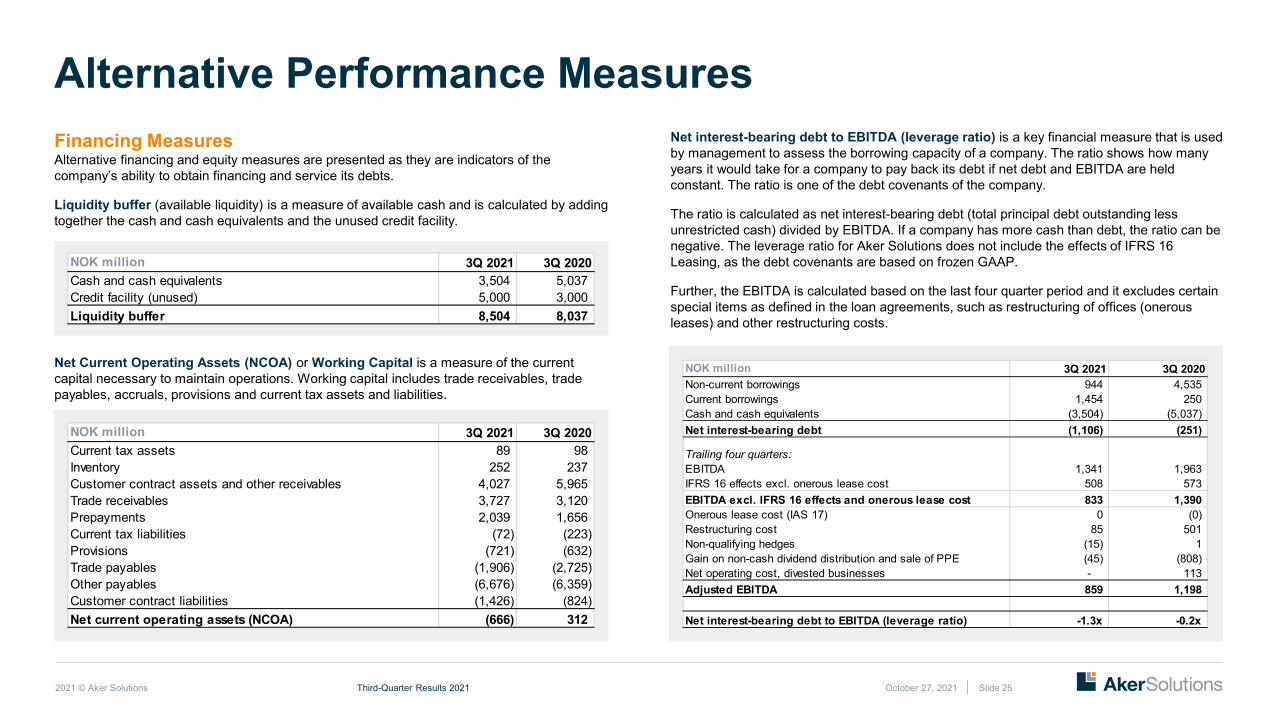
Alternative Performance MeasuresFinancing MeasuresAlternative financing and equity measures are presented as they are indicators of the company’s ability to obtain financing and service its debts.
Liquidity buffer (available liquidity) is a measure of available cash and is calculated by adding together the cash and cash equivalents and the unused credit facility.
Net Current Operating Assets (NCOA) or Working Capital is a measure of the current capital necessary to maintain operations. Working capital includes trade receivables, trade payables, accruals, provisions and current tax assets and liabilities.
Net interest-bearing debt to EBITDA (leverage ratio) is a key financial measure that is used by management to assess the borrowing capacity of a company. The ratio shows how many years it would take for a company to pay back its debt if net debt and EBITDA are held constant. The ratio is one of the debt covenants of the company.
The ratio is calculated as net interest-bearing debt (total principal debt outstanding less unrestricted cash) divided by EBITDA. If a company has more cash than debt, the ratio can be negative. The leverage ratio for Aker Solutions does not include the effects of IFRS 16 Leasing, as the debt covenants are based on frozen GAAP.
Further, the EBITDA is calculated based on the last four quarter period and it excludes certain special items as defined in the loan agreements, such as restructuring of offices (onerous leases) and other restructuring costs.
NOK million 3Q 2021 3Q 2020Cash and cash equivalents 3,504 5,037 Credit facility (unused) 5,000 3,000 Liquidity buffer 8,504 8,037
NOK million 3Q 2021 3Q 2020Current tax assets 89 98 Inventory 252 237 Customer contract assets and other receivables 4,027 5,965 Trade receivables 3,727 3,120 Prepayments 2,039 1,656 Current tax liabilities (72) (223) Provisions (721) (632) Trade payables (1,906) (2,725) Other payables (6,676) (6,359) Customer contract liabilities (1,426) (824) Net current operating assets (NCOA) (666) 312
NOK million 3Q 2021 3Q 2020Non-current borrowings 944 4,535 Current borrowings 1,454 250 Cash and cash equivalents (3,504) (5,037) Net interest-bearing debt (1,106) (251)
Trailing four quarters:EBITDA 1,341 1,963 IFRS 16 effects excl. onerous lease cost 508 573 EBITDA excl. IFRS 16 effects and onerous lease cost 833 1,390 Onerous lease cost (IAS 17) 0 (0) Restructuring cost 85 501 Non-qualifying hedges (15) 1 Gain on non-cash dividend distribution and sale of PPE (45) (808) Net operating cost, divested businesses - 113 Adjusted EBITDA 859 1,198
Net interest-bearing debt to EBITDA (leverage ratio) -1.3x -0.2x

2021 © Aker Solutions
Alternative Performance MeasuresOrder Intake MeasuresOrder intake, order backlog and book-to-bill ratios are presented as alternative performance measures, as they are indicators of the company’s revenues and operations in the future.Order intake includes new agreed customer contracts in the period in addition to expansion of existing contracts. For construction contracts, the order intake includes the value of agreed contracts and options, and value of agreed change orders and options. It does not include potential options and change orders. For service contracts, the order intake is based on estimated customer revenue in periods that are firm in the contracts.Order backlog represents the estimated value of remaining work on agreed customer contracts. The order backlog does not include parts of the services contracts, which is short-cycled or book-and-turn in nature. The order backlog does also not include potential growth or value of options in existing contracts.Book-to-bill ratio is calculated as order intake divided by revenue in the period. A book-to-bill ratio higher than 1 means that the company has secured more contracts in the period than what has been executed in the same period.
October 27, 2021Third-Quarter Results 2021 Slide 26
NOK million, x times
Order intakeRevenue from
customer contracts
Book-to-bill Order intakeRevenue from
customer contracts
Book-to-bill
Renewables & Field Development 4,952 2,498 2.0x 2,304 2,503 0.9xElectrification, Maintenance & Modifications 2,180 2,408 0.9x 4,353 1,874 2.3xSubsea 2,481 2,383 1.0x 2,331 2,086 1.1xOther/eliminations (81) (39) 147 (129) Aker Solutions 9,532 7,250 1.3x 9,135 6,334 1.4x
3Q 2021 3Q 2020
2021 © Aker Solutions
Special Items
October 27, 2021Third-Quarter Results 2021 Slide 27
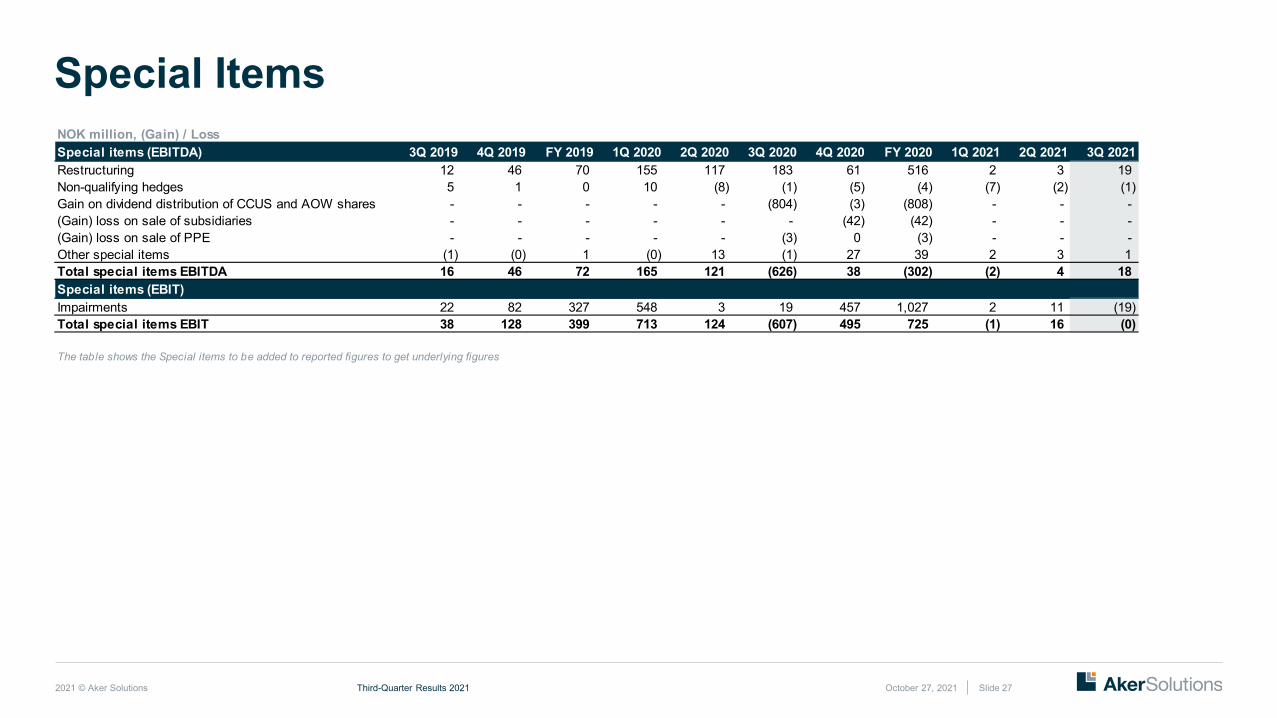
NOK million, (Gain) / LossSpecial items (EBITDA) 3Q 2019 4Q 2019 FY 2019 1Q 2020 2Q 2020 3Q 2020 4Q 2020 FY 2020 1Q 2021 2Q 2021 3Q 2021Restructuring 12 46 70 155 117 183 61 516 2 3 19 Non-qualifying hedges 5 1 0 10 (8) (1) (5) (4) (7) (2) (1) Gain on dividend distribution of CCUS and AOW shares - - - - - (804) (3) (808) - - - (Gain) loss on sale of subsidiaries - - - - - - (42) (42) - - - (Gain) loss on sale of PPE - - - - - (3) 0 (3) - - - Other special items (1) (0) 1 (0) 13 (1) 27 39 2 3 1 Total special items EBITDA 16 46 72 165 121 (626) 38 (302) (2) 4 18 Special items (EBIT)Impairments 22 82 327 548 3 19 457 1,027 2 11 (19) Total special items EBIT 38 128 399 713 124 (607) 495 725 (1) 16 (0)
The table shows the Special items to be added to reported figures to get underlying figures
2021 © Aker Solutions
Income Statement
October 27, 2021Third-Quarter Results 2021 Slide 28
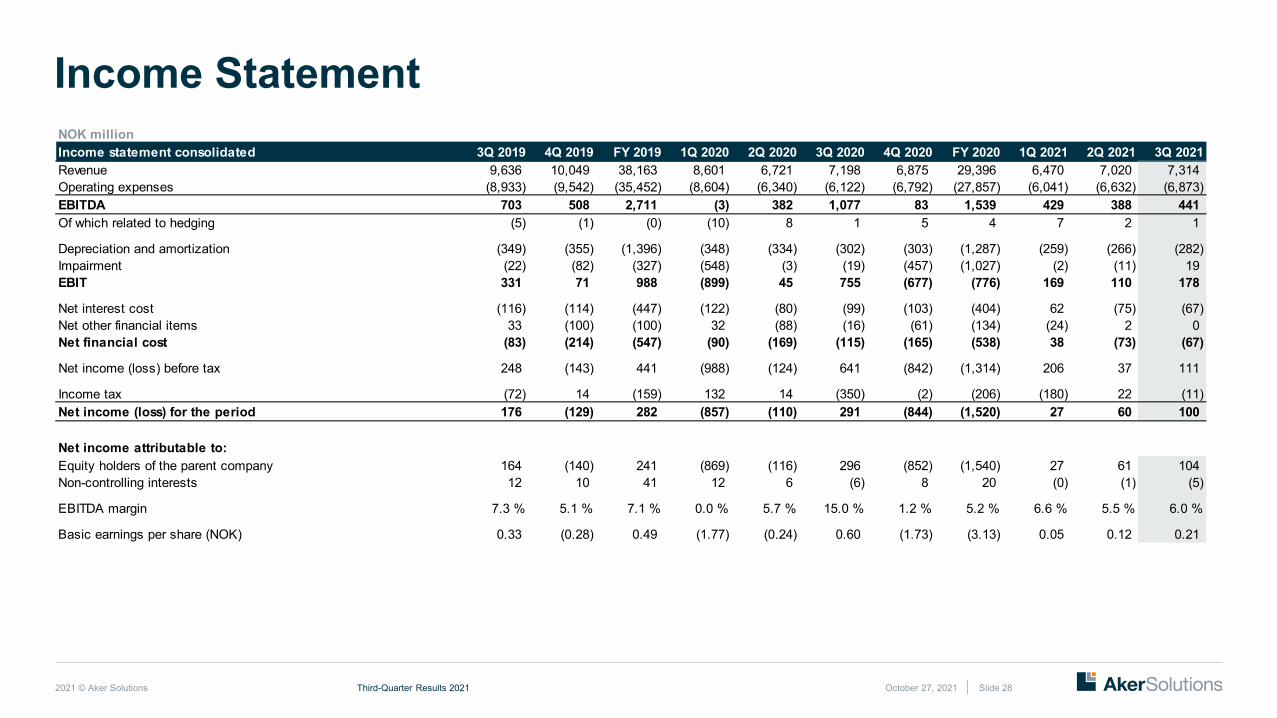
NOK millionIncome statement consolidated 3Q 2019 4Q 2019 FY 2019 1Q 2020 2Q 2020 3Q 2020 4Q 2020 FY 2020 1Q 2021 2Q 2021 3Q 2021Revenue 9,636 10,049 38,163 8,601 6,721 7,198 6,875 29,396 6,470 7,020 7,314 Operating expenses (8,933) (9,542) (35,452) (8,604) (6,340) (6,122) (6,792) (27,857) (6,041) (6,632) (6,873) EBITDA 703 508 2,711 (3) 382 1,077 83 1,539 429 388 441 Of which related to hedging (5) (1) (0) (10) 8 1 5 4 7 2 1
Depreciation and amortization (349) (355) (1,396) (348) (334) (302) (303) (1,287) (259) (266) (282) Impairment (22) (82) (327) (548) (3) (19) (457) (1,027) (2) (11) 19 EBIT 331 71 988 (899) 45 755 (677) (776) 169 110 178
Net interest cost (116) (114) (447) (122) (80) (99) (103) (404) 62 (75) (67) Net other financial items 33 (100) (100) 32 (88) (16) (61) (134) (24) 2 0 Net financial cost (83) (214) (547) (90) (169) (115) (165) (538) 38 (73) (67)
Net income (loss) before tax 248 (143) 441 (988) (124) 641 (842) (1,314) 206 37 111
Income tax (72) 14 (159) 132 14 (350) (2) (206) (180) 22 (11) Net income (loss) for the period 176 (129) 282 (857) (110) 291 (844) (1,520) 27 60 100
Net income attributable to:Equity holders of the parent company 164 (140) 241 (869) (116) 296 (852) (1,540) 27 61 104 Non-controlling interests 12 10 41 12 6 (6) 8 20 (0) (1) (5)
EBITDA margin 7.3 % 5.1 % 7.1 % 0.0 % 5.7 % 15.0 % 1.2 % 5.2 % 6.6 % 5.5 % 6.0 %
Basic earnings per share (NOK) 0.33 (0.28) 0.49 (1.77) (0.24) 0.60 (1.73) (3.13) 0.05 0.12 0.21
2021 © Aker Solutions
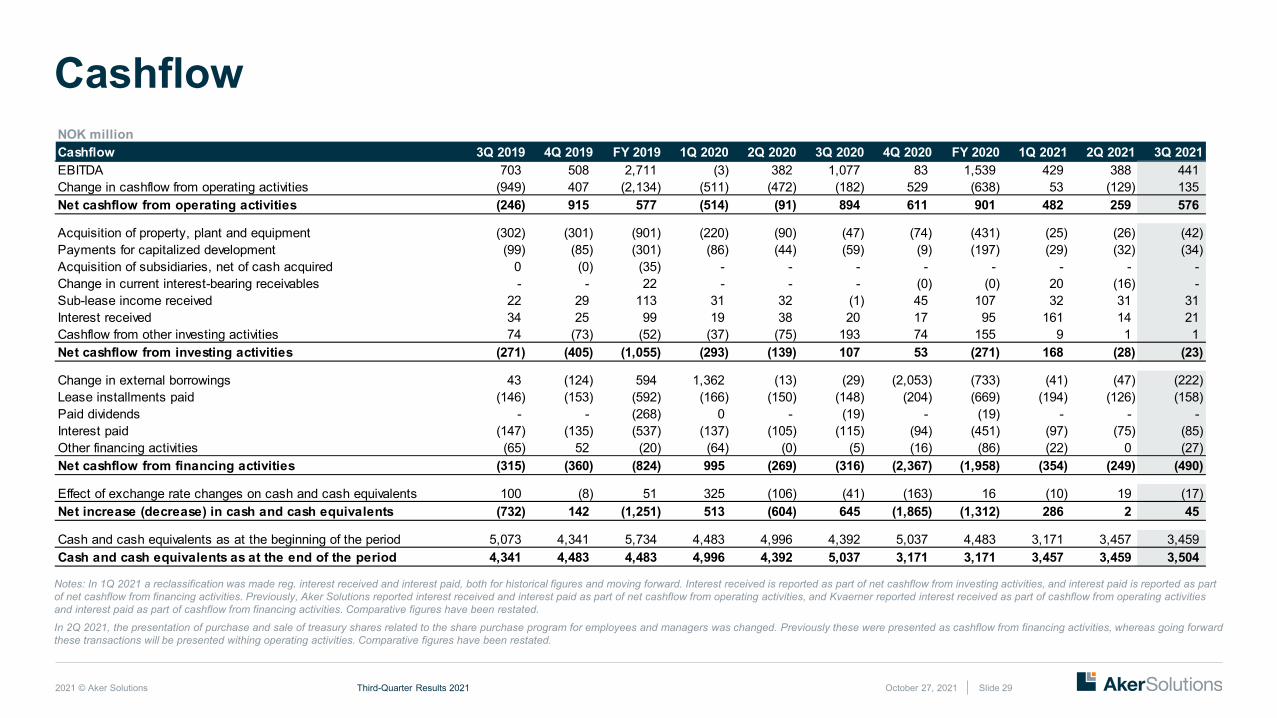
Cashflow
October 27, 2021Third-Quarter Results 2021 Slide 29
Notes: In 1Q 2021 a reclassification was made reg. interest received and interest paid, both for historical figures and moving forward. Interest received is reported as part of net cashflow from investing activities, and interest paid is reported as part of net cashflow from financing activities. Previously, Aker Solutions reported interest received and interest paid as part of net cashflow from operating activities, and Kvaerner reported interest received as part of cashflow from operating activities and interest paid as part of cashflow from financing activities. Comparative figures have been restated.
In 2Q 2021, the presentation of purchase and sale of treasury shares related to the share purchase program for employees and managers was changed. Previously these were presented as cashflow from financing activities, whereas going forward these transactions will be presented withing operating activities. Comparative figures have been restated.
NOK millionCashflow 3Q 2019 4Q 2019 FY 2019 1Q 2020 2Q 2020 3Q 2020 4Q 2020 FY 2020 1Q 2021 2Q 2021 3Q 2021EBITDA 703 508 2,711 (3) 382 1,077 83 1,539 429 388 441 Change in cashflow from operating activities (949) 407 (2,134) (511) (472) (182) 529 (638) 53 (129) 135 Net cashflow from operating activities (246) 915 577 (514) (91) 894 611 901 482 259 576
Acquisition of property, plant and equipment (302) (301) (901) (220) (90) (47) (74) (431) (25) (26) (42) Payments for capitalized development (99) (85) (301) (86) (44) (59) (9) (197) (29) (32) (34) Acquisition of subsidiaries, net of cash acquired 0 (0) (35) - - - - - - - - Change in current interest-bearing receivables - - 22 - - - (0) (0) 20 (16) - Sub-lease income received 22 29 113 31 32 (1) 45 107 32 31 31 Interest received 34 25 99 19 38 20 17 95 161 14 21 Cashflow from other investing activities 74 (73) (52) (37) (75) 193 74 155 9 1 1 Net cashflow from investing activities (271) (405) (1,055) (293) (139) 107 53 (271) 168 (28) (23)
Change in external borrowings 43 (124) 594 1,362 (13) (29) (2,053) (733) (41) (47) (222) Lease installments paid (146) (153) (592) (166) (150) (148) (204) (669) (194) (126) (158) Paid dividends - - (268) 0 - (19) - (19) - - - Interest paid (147) (135) (537) (137) (105) (115) (94) (451) (97) (75) (85) Other financing activities (65) 52 (20) (64) (0) (5) (16) (86) (22) 0 (27) Net cashflow from financing activities (315) (360) (824) 995 (269) (316) (2,367) (1,958) (354) (249) (490)
Effect of exchange rate changes on cash and cash equivalents 100 (8) 51 325 (106) (41) (163) 16 (10) 19 (17) Net increase (decrease) in cash and cash equivalents (732) 142 (1,251) 513 (604) 645 (1,865) (1,312) 286 2 45
Cash and cash equivalents as at the beginning of the period 5,073 4,341 5,734 4,483 4,996 4,392 5,037 4,483 3,171 3,457 3,459 Cash and cash equivalents as at the end of the period 4,341 4,483 4,483 4,996 4,392 5,037 3,171 3,171 3,457 3,459 3,504
2021 © Aker Solutions
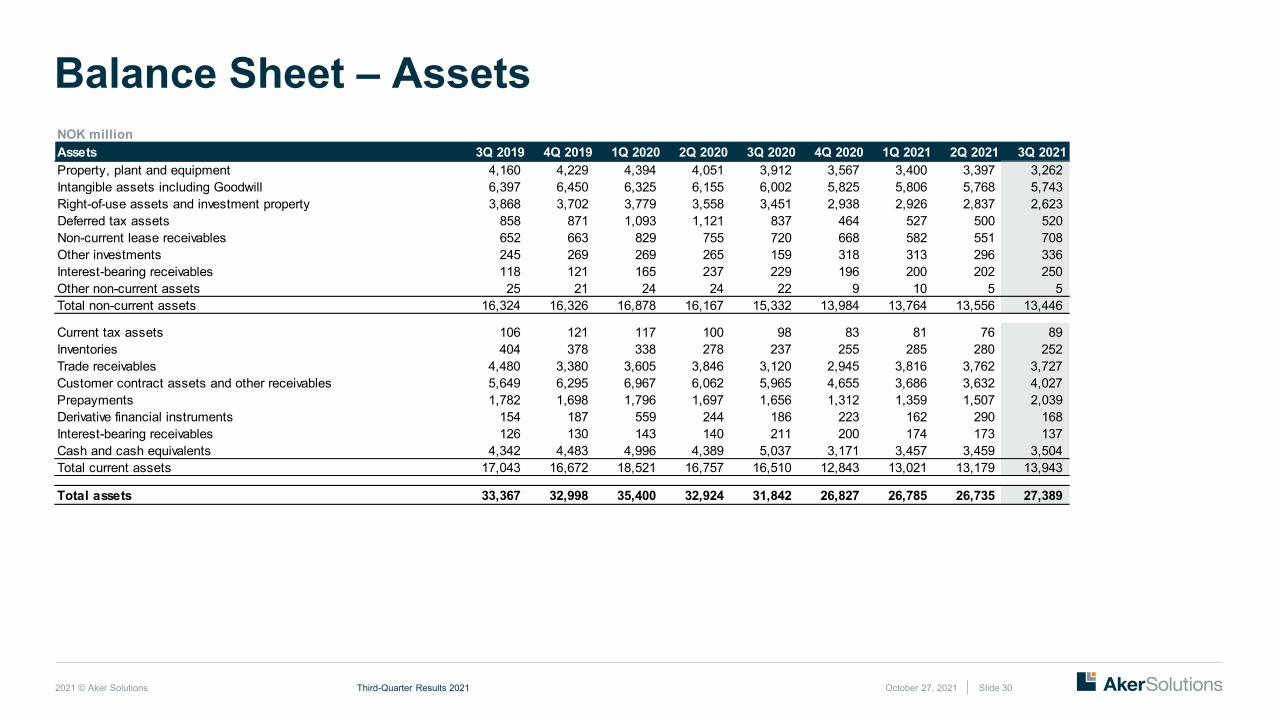
Balance Sheet – Assets
October 27, 2021Third-Quarter Results 2021 Slide 30
NOK millionAssets 3Q 2019 4Q 2019 1Q 2020 2Q 2020 3Q 2020 4Q 2020 1Q 2021 2Q 2021 3Q 2021Property, plant and equipment 4,160 4,229 4,394 4,051 3,912 3,567 3,400 3,397 3,262 Intangible assets including Goodwill 6,397 6,450 6,325 6,155 6,002 5,825 5,806 5,768 5,743 Right-of-use assets and investment property 3,868 3,702 3,779 3,558 3,451 2,938 2,926 2,837 2,623 Deferred tax assets 858 871 1,093 1,121 837 464 527 500 520 Non-current lease receivables 652 663 829 755 720 668 582 551 708 Other investments 245 269 269 265 159 318 313 296 336 Interest-bearing receivables 118 121 165 237 229 196 200 202 250 Other non-current assets 25 21 24 24 22 9 10 5 5 Total non-current assets 16,324 16,326 16,878 16,167 15,332 13,984 13,764 13,556 13,446
Current tax assets 106 121 117 100 98 83 81 76 89 Inventories 404 378 338 278 237 255 285 280 252 Trade receivables 4,480 3,380 3,605 3,846 3,120 2,945 3,816 3,762 3,727 Customer contract assets and other receivables 5,649 6,295 6,967 6,062 5,965 4,655 3,686 3,632 4,027 Prepayments 1,782 1,698 1,796 1,697 1,656 1,312 1,359 1,507 2,039 Derivative financial instruments 154 187 559 244 186 223 162 290 168 Interest-bearing receivables 126 130 143 140 211 200 174 173 137 Cash and cash equivalents 4,342 4,483 4,996 4,389 5,037 3,171 3,457 3,459 3,504 Total current assets 17,043 16,672 18,521 16,757 16,510 12,843 13,021 13,179 13,943
Total assets 33,367 32,998 35,400 32,924 31,842 26,827 26,785 26,735 27,389

2021 © Aker Solutions
Balance Sheet – Liabilities and Equity
October 27, 2021Third-Quarter Results 2021 Slide 31
NOK millionLiabilities and equity 3Q 2019 4Q 2019 1Q 2020 2Q 2020 3Q 2020 4Q 2020 1Q 2021 2Q 2021 3Q 2021Total equity attributable to the parent 10,729 10,526 10,675 9,879 9,141 7,870 7,784 7,903 7,870 Non-controlling interests 110 97 78 78 58 38 38 37 35 Total equity 10,839 10,622 10,753 9,957 9,199 7,908 7,822 7,940 7,904
Non-current borrowings 2,720 3,280 4,643 4,580 4,535 2,513 2,503 2,498 944 Non-current lease liabilities 5,043 4,946 5,160 4,846 4,757 4,468 4,339 4,183 4,048 Pension obligations 778 898 894 887 974 1,082 1,049 1,025 1,002 Deferred tax liabilities 650 594 518 548 553 223 405 336 296 Other non-current liabilities 27 29 9 3 3 5 6 2 2 Total non-current liabilities 9,218 9,747 11,223 10,864 10,822 8,291 8,304 8,043 6,292
Current tax liabilities 51 81 174 222 223 108 61 59 72 Current borrowings 907 217 230 242 250 202 160 125 1,454 Current lease liabilities 584 590 647 628 627 643 617 649 679 Provisions 560 691 733 678 632 590 627 720 721 Trade payables 2,382 2,525 3,127 3,315 2,725 2,125 2,137 1,338 1,906 Other payables 8,206 7,660 7,317 6,016 6,359 5,696 5,320 6,206 6,676 Customer contract liabilities 480 737 812 824 824 1,010 1,201 1,332 1,426 Derivative financial instruments 141 126 382 177 180 254 535 323 260 Total current liabilities 13,310 12,629 13,423 12,102 11,821 10,628 10,658 10,752 13,193
Total liabilities and equity 33,367 32,998 35,400 32,924 31,842 26,827 26,785 26,735 27,389
2021 © Aker Solutions
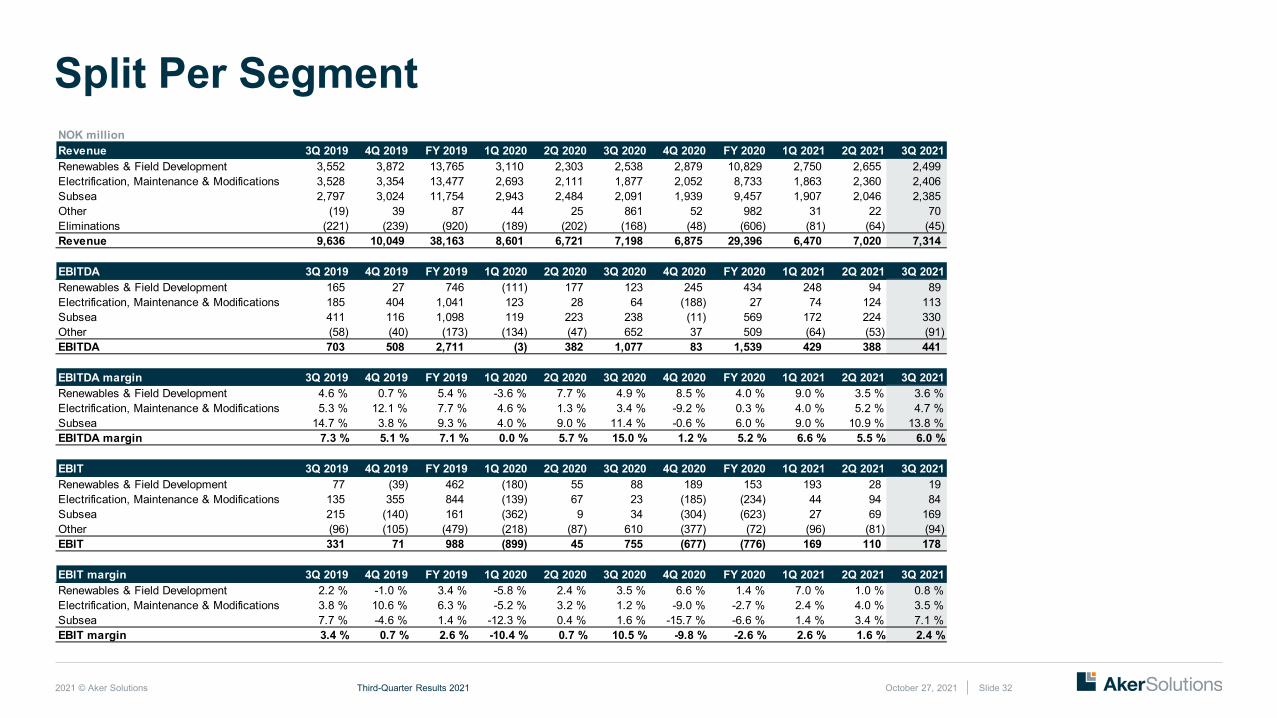
Split Per Segment
October 27, 2021Third-Quarter Results 2021 Slide 32
NOK millionRevenue 3Q 2019 4Q 2019 FY 2019 1Q 2020 2Q 2020 3Q 2020 4Q 2020 FY 2020 1Q 2021 2Q 2021 3Q 2021Renewables & Field Development 3,552 3,872 13,765 3,110 2,303 2,538 2,879 10,829 2,750 2,655 2,499 Electrification, Maintenance & Modifications 3,528 3,354 13,477 2,693 2,111 1,877 2,052 8,733 1,863 2,360 2,406 Subsea 2,797 3,024 11,754 2,943 2,484 2,091 1,939 9,457 1,907 2,046 2,385 Other (19) 39 87 44 25 861 52 982 31 22 70 Eliminations (221) (239) (920) (189) (202) (168) (48) (606) (81) (64) (45) Revenue 9,636 10,049 38,163 8,601 6,721 7,198 6,875 29,396 6,470 7,020 7,314
EBITDA 3Q 2019 4Q 2019 FY 2019 1Q 2020 2Q 2020 3Q 2020 4Q 2020 FY 2020 1Q 2021 2Q 2021 3Q 2021Renewables & Field Development 165 27 746 (111) 177 123 245 434 248 94 89 Electrification, Maintenance & Modifications 185 404 1,041 123 28 64 (188) 27 74 124 113 Subsea 411 116 1,098 119 223 238 (11) 569 172 224 330 Other (58) (40) (173) (134) (47) 652 37 509 (64) (53) (91) EBITDA 703 508 2,711 (3) 382 1,077 83 1,539 429 388 441
EBITDA margin 3Q 2019 4Q 2019 FY 2019 1Q 2020 2Q 2020 3Q 2020 4Q 2020 FY 2020 1Q 2021 2Q 2021 3Q 2021Renewables & Field Development 4.6 % 0.7 % 5.4 % -3.6 % 7.7 % 4.9 % 8.5 % 4.0 % 9.0 % 3.5 % 3.6 %Electrification, Maintenance & Modifications 5.3 % 12.1 % 7.7 % 4.6 % 1.3 % 3.4 % -9.2 % 0.3 % 4.0 % 5.2 % 4.7 %Subsea 14.7 % 3.8 % 9.3 % 4.0 % 9.0 % 11.4 % -0.6 % 6.0 % 9.0 % 10.9 % 13.8 %EBITDA margin 7.3 % 5.1 % 7.1 % 0.0 % 5.7 % 15.0 % 1.2 % 5.2 % 6.6 % 5.5 % 6.0 %
EBIT 3Q 2019 4Q 2019 FY 2019 1Q 2020 2Q 2020 3Q 2020 4Q 2020 FY 2020 1Q 2021 2Q 2021 3Q 2021Renewables & Field Development 77 (39) 462 (180) 55 88 189 153 193 28 19 Electrification, Maintenance & Modifications 135 355 844 (139) 67 23 (185) (234) 44 94 84 Subsea 215 (140) 161 (362) 9 34 (304) (623) 27 69 169 Other (96) (105) (479) (218) (87) 610 (377) (72) (96) (81) (94) EBIT 331 71 988 (899) 45 755 (677) (776) 169 110 178
EBIT margin 3Q 2019 4Q 2019 FY 2019 1Q 2020 2Q 2020 3Q 2020 4Q 2020 FY 2020 1Q 2021 2Q 2021 3Q 2021Renewables & Field Development 2.2 % -1.0 % 3.4 % -5.8 % 2.4 % 3.5 % 6.6 % 1.4 % 7.0 % 1.0 % 0.8 %Electrification, Maintenance & Modifications 3.8 % 10.6 % 6.3 % -5.2 % 3.2 % 1.2 % -9.0 % -2.7 % 2.4 % 4.0 % 3.5 %Subsea 7.7 % -4.6 % 1.4 % -12.3 % 0.4 % 1.6 % -15.7 % -6.6 % 1.4 % 3.4 % 7.1 %EBIT margin 3.4 % 0.7 % 2.6 % -10.4 % 0.7 % 10.5 % -9.8 % -2.6 % 2.6 % 1.6 % 2.4 %

2021 © Aker Solutions
Split Per Segment
October 27, 2021Third-Quarter Results 2021 Slide 33
NOK millionNet Current Operating Assets (NCOA) 3Q 2019 4Q 2019 1Q 2020 2Q 2020 3Q 2020 4Q 2020 1Q 2021 2Q 2021 3Q 2021NCOA 743 177 660 929 312 (280) (118) (398) (666)
Order intake 3Q 2019 4Q 2019 FY 2019 1Q 2020 2Q 2020 3Q 2020 4Q 2020 FY 2020 1Q 2021 2Q 2021 3Q 2021Renewables & Field Development 2,413 3,147 8,870 1,896 3,834 2,304 3,368 11,402 2,630 1,231 4,952 Electrification, Maintenance & Modifications 2,533 3,108 9,334 4,298 3,231 4,353 1,910 13,792 4,068 2,202 2,180 Subsea 1,615 1,889 8,205 1,651 3,145 2,331 1,948 9,076 2,788 8,829 2,481 Other and eliminations 58 (404) (254) 120 79 147 (453) (107) (43) (29) (81) Order intake 6,618 7,740 26,155 7,965 10,289 9,135 6,774 34,163 9,444 12,232 9,532
Order backlog 3Q 2019 4Q 2019 1Q 2020 2Q 2020 3Q 2020 4Q 2020 1Q 2021 2Q 2021 3Q 2021Renewables & Field Development 8,383 7,843 6,768 8,129 8,001 10,632 10,063 8,818 11,599 Electrification, Maintenance & Modifications 14,252 13,992 15,651 16,228 18,760 16,527 18,954 18,769 18,576 Subsea 12,629 11,376 10,839 11,037 11,198 10,912 11,675 18,365 18,470 Other and eliminations 143 (128) 77 197 182 (91) (185) (167) (209) Order backlog 35,407 33,083 33,334 35,591 38,142 37,979 40,507 45,786 48,436
Own employees 3Q 2019 4Q 2019 1Q 2020 2Q 2020 3Q 2020 4Q 2020 1Q 2021 2Q 2021 3Q 2021Renewables & Field Development 4,196 4,225 4,194 4,131 4,002 4,675 4,535 4,550 4,452 Electrification, Maintenance & Modifications 8,225 8,036 7,748 6,033 5,624 5,694 5,925 6,200 6,216 Subsea 3,988 3,874 3,827 3,461 3,169 3,500 3,431 3,428 3,465 Other 2,849 2,654 2,647 2,285 2,024 625 600 611 755 Own employees 19,258 18,789 18,416 15,910 14,819 14,494 14,491 14,789 14,888

2021 © Aker Solutions
Split Per Segment – Excluding Special Items
October 27, 2021Third-Quarter Results 2021 Slide 34
NOK millionEBITDA (excl. special items) 3Q 2019 4Q 2019 FY 2019 1Q 2020 2Q 2020 3Q 2020 4Q 2020 FY 2020 1Q 2021 2Q 2021 3Q 2021Renewables & Field Development 165 34 753 (107) 204 193 259 549 248 95 89 Electrification, Maintenance & Modifications 186 414 1,051 136 84 66 (124) 161 76 126 126 Subsea 422 139 1,145 204 286 242 16 748 172 224 336 Other (54) (34) (166) (71) (71) (50) (30) (222) (69) (53) (92) EBITDA (excl. special items) 719 554 2,782 163 503 451 121 1,236 427 392 459
EBITDA margin (excl. special items) 3Q 2019 4Q 2019 FY 2019 1Q 2020 2Q 2020 3Q 2020 4Q 2020 FY 2020 1Q 2021 2Q 2021 3Q 2021Renewables & Field Development 4.6 % 0.9 % 5.5 % -3.4 % 8.9 % 7.6 % 9.0 % 5.1 % 9.0 % 3.6 % 3.6 %Electrification, Maintenance & Modifications 5.3 % 12.4 % 7.8 % 5.1 % 4.0 % 3.5 % -6.1 % 1.8 % 4.1 % 5.3 % 5.2 %Subsea 15.1 % 4.6 % 9.7 % 6.9 % 11.5 % 11.6 % 0.8 % 7.9 % 9.0 % 11.0 % 14.1 %EBITDA margin (excl. special items) 7.5 % 5.5 % 7.3 % 1.9 % 7.5 % 7.0 % 1.8 % 4.3 % 6.6 % 5.6 % 6.3 %
EBIT (excl. special items) 3Q 2019 4Q 2019 FY 2019 1Q 2020 2Q 2020 3Q 2020 4Q 2020 FY 2020 1Q 2021 2Q 2021 3Q 2021Renewables & Field Development 99 (31) 493 (175) 140 153 206 324 193 29 19 Electrification, Maintenance & Modifications 136 365 854 86 38 20 (123) 22 46 96 97 Subsea 227 (63) 362 7 96 61 (208) (45) 22 72 176 Other (93) (71) (322) (103) (105) (86) (57) (351) (93) (71) (115) EBIT (excl. special items) 369 199 1,387 (185) 169 148 (182) (51) 168 126 178
EBIT margin (excl. special items) 3Q 2019 4Q 2019 FY 2019 1Q 2020 2Q 2020 3Q 2020 4Q 2020 FY 2020 1Q 2021 2Q 2021 3Q 2021Renewables & Field Development 2.8 % -0.8 % 3.6 % -5.6 % 6.1 % 6.0 % 7.1 % 3.0 % 7.0 % 1.1 % 0.8 %Electrification, Maintenance & Modifications 3.8 % 10.9 % 6.3 % 3.2 % 1.8 % 1.1 % -6.0 % 0.3 % 2.5 % 4.1 % 4.0 %Subsea 8.1 % -2.1 % 3.1 % 0.2 % 3.8 % 2.9 % -10.7 % -0.5 % 1.2 % 3.5 % 7.4 %EBIT margin (excl. special items) 3.8 % 2.0 % 3.6 % -2.2 % 2.5 % 2.3 % -2.7 % -0.2 % 2.6 % 1.8 % 2.4 %
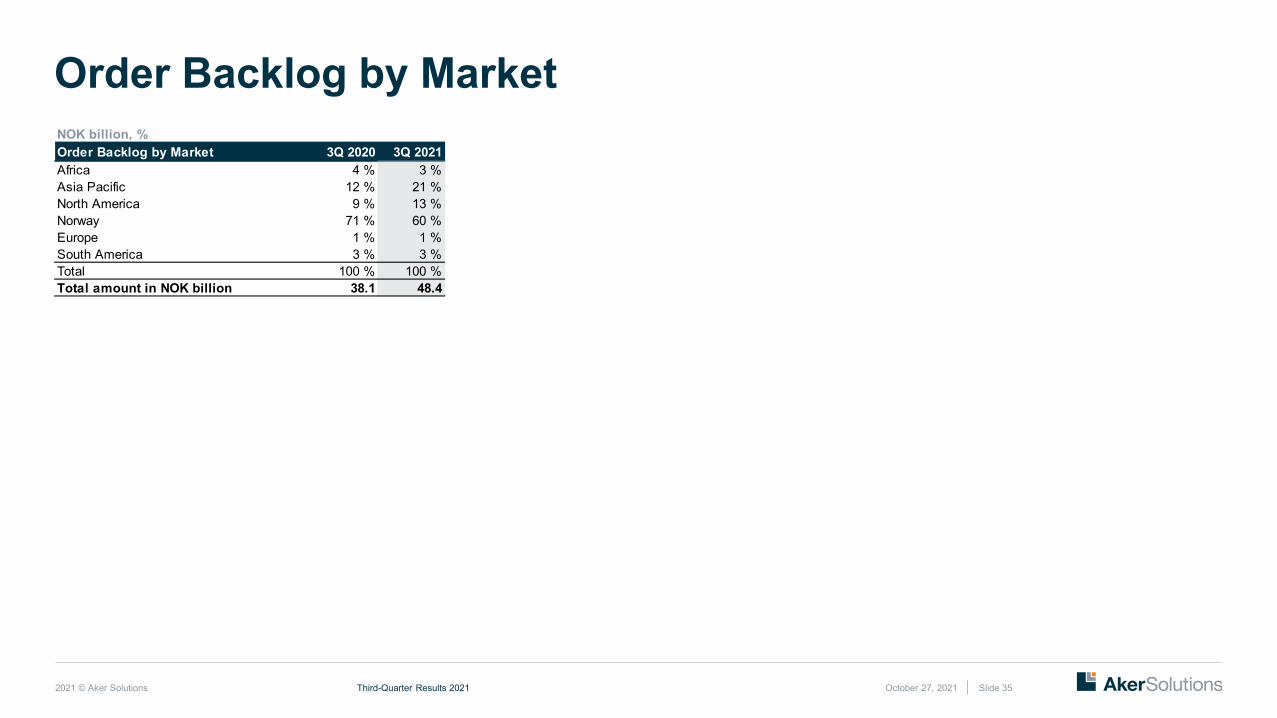
2021 © Aker Solutions October 27, 2021Third-Quarter Results 2021 Slide 35
Order Backlog by MarketNOK billion, %Order Backlog by Market 3Q 2020 3Q 2021Africa 4 % 3 %Asia Pacific 12 % 21 %North America 9 % 13 %Norway 71 % 60 %Europe 1 % 1 %South America 3 % 3 %Total 100 % 100 %Total amount in NOK billion 38.1 48.4
2021 © Aker Solutions
CopyrightCopyright of all published material including photographs, drawings and images in this document remains vested in Aker Solutions and third party contributors as appropriate. Accordingly, neither the whole nor any part of this document shall be reproduced in any form nor used in any manner without express prior permission and applicable acknowledgements. No trademark, copyright or other notice shall be altered or removed from any reproduction.
DisclaimerThis Presentation includes and is based, inter alia, on forward-looking information and statements that are subject to risks and uncertainties that could cause actual results to differ. These statements and this Presentation are based on current expectations, estimates and projections about global economic conditions, the economic conditions of the regions and industries that are major markets for Aker Solutions ASA and Aker Solutions ASA’s (including subsidiaries and affiliates) lines of business. These expectations, estimates and projections are generally identifiable by statements containing words such as “expects”, “believes”, “estimates” or similar expressions. Important factors that could cause actual results to differ materially from those expectations include, among others, economic and market conditions in the geographic areas and industries that are or will be major markets for Aker Solutions’ businesses, oil prices, market acceptance of new products and services, changes in governmental regulations, interest rates, fluctuations in currency exchange rates and such other factors as may be discussed from time to time in the Presentation. Although Aker Solutions ASA believes that its expectations and the Presentation are based upon reasonable assumptions, it can give no assurance that those expectations will be achieved or that the actual results will be as set out in the Presentation. Aker Solutions ASA is making no representation or warranty, expressed or implied, as to the accuracy, reliability or completeness of the Presentation, and neither Aker Solutions ASA nor any of its directors, officers or employees will have any liability to you or any other persons resulting from your use.
Aker Solutions consists of many legally independent entities, constituting their own separate identities. Aker Solutions is used as the common brand or trade mark for most of these entities. In this presentation we may sometimes use “Aker Solutions”, “we” or “us” when we refer to Aker Solutions companies in general or where no useful purpose is served by identifying any particular Aker Solutions company.
October 27, 2021Third-Quarter Results 2021 Slide 36
Copyright and Disclaimer

2021 © Aker Solutions