3q14 results
TRANSCRIPT

Earnings Call 3Q14
November 14th, 2014
The consolidated financial statements presented here are consistent with the criteria of international accounting standards - IFRS issued by the
International Accounting Standards Board – IASB, based on audited financial information. Non-financial information contained herein, as well
as other operational information, were not audited by independent auditors and may include forward-looking statements and reflects the
current views and perspectives of the management on the evolution of macro-economic environment, conditions of the mining and
refractories industries, company performance and financial results. Any statements, projections, expectations, estimates and plans contained
in this document that do not describe historical facts, and the factors or trends affecting financial condition, liquidity or results of operations,
are forward-looking statements and involve several risks and uncertainties.
This presentation should not be construed as legal, tax, investment or other advice. This presentation does not constitute an offer, or invitation,
or solicitation of an offer, to subscribe for or purchase any securities, and neither any part of this presentation nor any information or
statement contained herein shall form the basis of or be relied upon in connection with any contract or commitment whatsoever. Under no
circumstances, neither the Company nor its subsidiaries, directors, officers, agents or employees be liable to third parties (including investors)
for any investment decision based on information and statements in this presentation, or for any damages resulting therefrom, corresponding
or specific.
The information presented or contained in this presentation is current as of the date hereof and is subject to change without notice. Magnesita
has no obligation to update it or revise it in light of new information and / or in face of future events, safeguard the current regulations which
we are submitted to. This presentation and its contents are proprietary information of the Company and may not be reproduced or circulated,
partially or completely, without the prior written consent of the Company.
Changes in historical numbers For comparison purposes, 2013 figures have been adjusted to reflect accounting changes implemented by the Company in late 2013.
Disclosure
A g
lob
al o
rgan
izat
ion
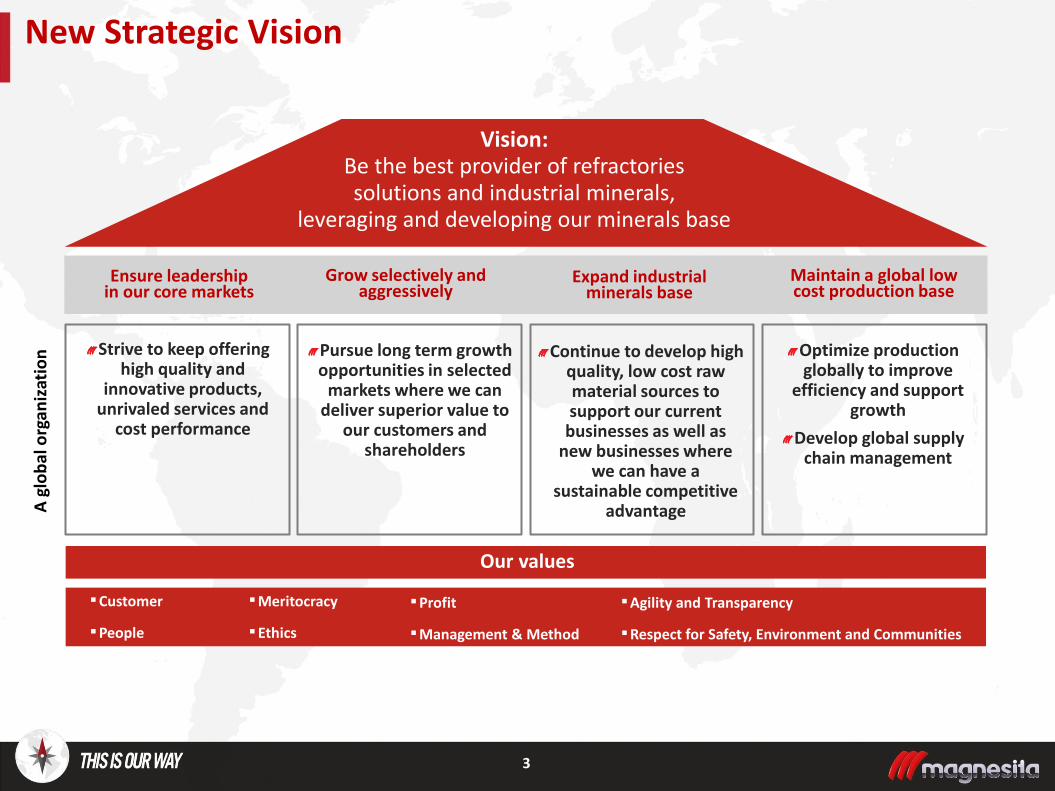
New Strategic Vision
Vision: Be the best provider of refractories solutions and industrial minerals,
leveraging and developing our minerals base
Expand industrial minerals base
Ensure leadership in our core markets
Maintain a global low cost production base
Grow selectively and aggressively
Continue to develop high quality, low cost raw material sources to support our current
businesses as well as new businesses where
we can have a sustainable competitive
advantage
Strive to keep offering high quality and
innovative products, unrivaled services and
cost performance
Optimize production globally to improve
efficiency and support growth
Develop global supply chain management
Pursue long term growth opportunities in selected
markets where we can deliver superior value to
our customers and shareholders
▪Meritocracy ▪Ethics
▪Profit ▪Management & Method
▪Agility and Transparency ▪Respect for Safety, Environment and Communities
▪Customer ▪People
Our values
3
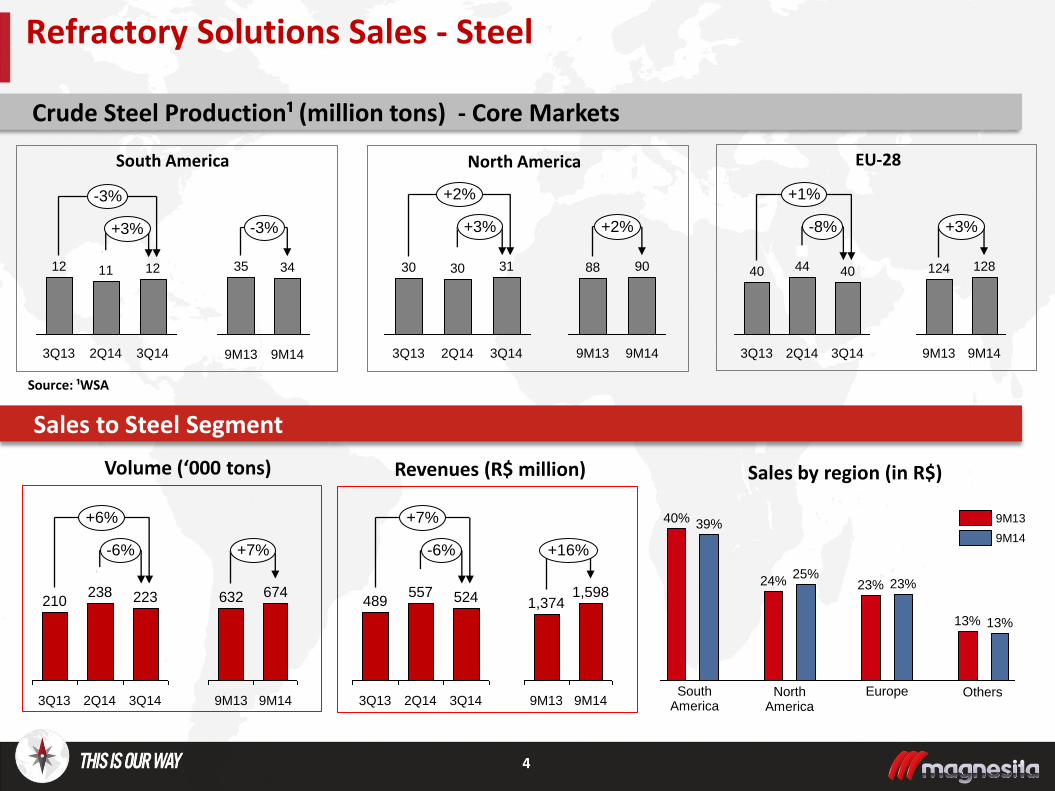
South America
4
Source: ¹WSA
Crude Steel Production¹ (million tons) - Core Markets
Volume (‘000 tons)
North America EU-28
Sales to Steel Segment
Revenues (R$ million)
238
3Q13
210
-6%
+6%
3Q14
223
2Q14
-6%
+7%
3Q14
524
2Q14
557
3Q13
489
Refractory Solutions Sales - Steel
+3%
-3%
3Q14
12
2Q14
11
3Q13
12
+3%
+2%
3Q14
31
2Q14
30
3Q13
30
-8%
+1%
3Q14
40
2Q14
44
3Q13
40
13% 13%
23% 23% 25%
24%
39% 40%
Sales by region (in R$)
South America
North America
Europe Others
9M13
9M14
-3%
34 35
9M14 9M13
+2%
9M14
90
9M13
88
+3%
9M14
128
9M13
124
+7%
9M14
674
9M13
632
+16%
9M13
1,598
9M14
1,374
5
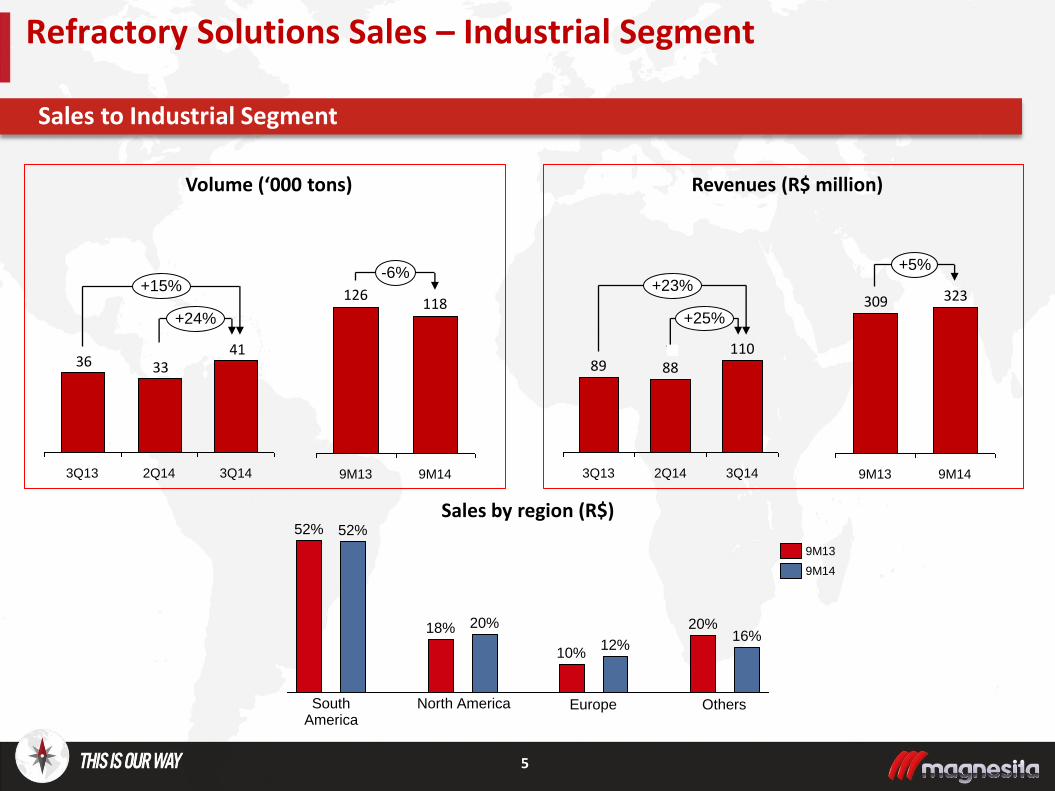
Sales to Industrial Segment
Refractory Solutions Sales – Industrial Segment
Volume (‘000 tons) Revenues (R$ million)
413336
+24%
+15%
3Q14 2Q14 3Q13 3Q13
89
+25%
+23%
3Q14
110
2Q14
88
Sales by region (R$)
-6%
9M14
118
9M13
126 323309
+5%
9M14 9M13
20% 16%
12% 10%
20% 18%
52% 52%
9M13
9M14
South America
North America Europe Others
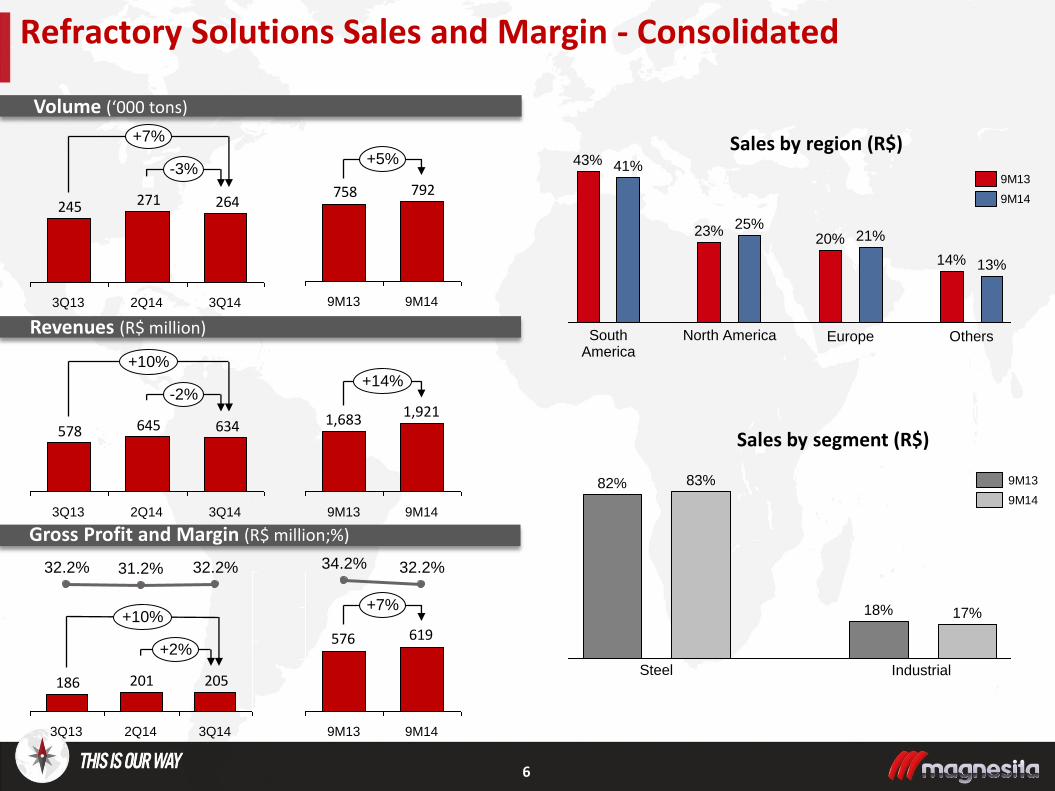
Refractory Solutions Sales and Margin - Consolidated
6
Volume (‘000 tons)
Revenues (R$ million)
Gross Profit and Margin (R$ million;%)
245 264271
-3%
+7%
3Q14 2Q14 3Q13
205201186
+2%
+10%
3Q14
32.2%
2Q14
31.2%
3Q13
32.2%
634645578
-2%
+10%
3Q14 2Q14 3Q13
Sales by region (R$) 43%
13% 14%
21% 20% 25%
23%
41%
South America
North America Europe Others
9M13
9M14
17% 18%
83% 82%
Steel Industrial
9M13
9M14
Sales by segment (R$)
758 792
+5%
9M14 9M13
+14%
9M14
1,921
9M13
1,683
619576
+7%
9M14
32.2%
9M13
34.2%
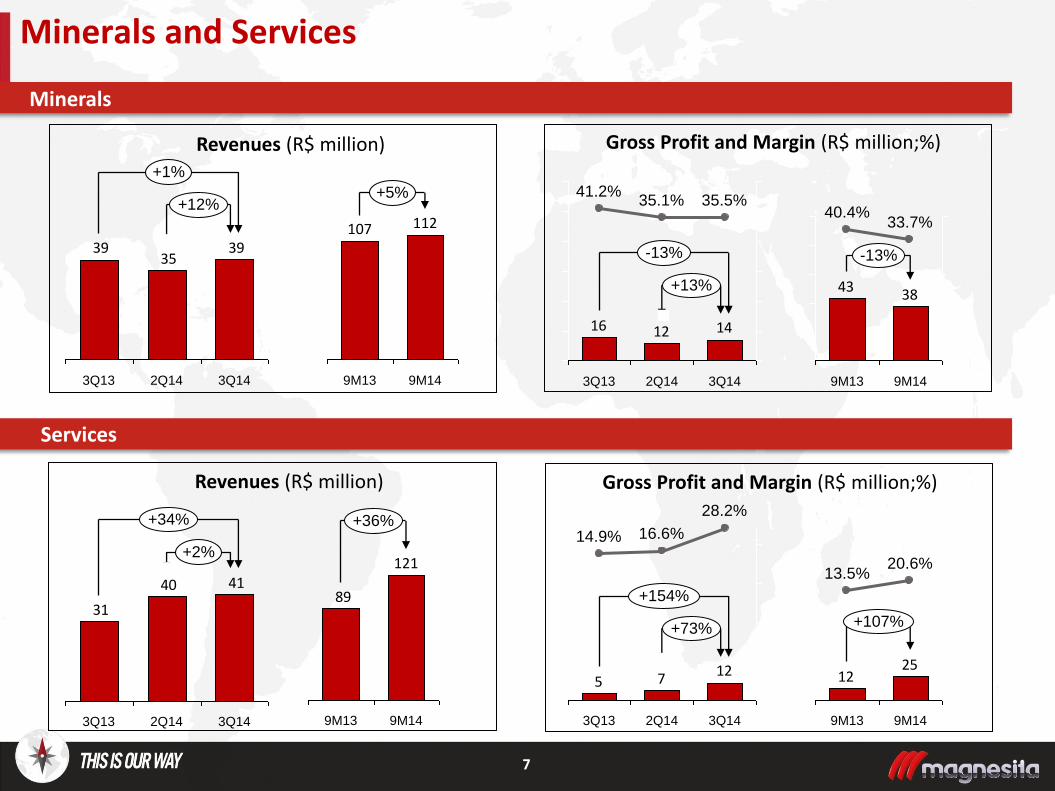
7
Revenues (R$ million) Gross Profit and Margin (R$ million;%)
Revenues (R$ million) Gross Profit and Margin (R$ million;%)
Minerals and Services
3935
39
+12%
+1%
3Q14 2Q14 3Q13
4140
31
+2%
+34%
3Q14 2Q14 3Q13
141216
+13%
-13%
3Q14
35.5%
2Q14
35.1%
3Q13
41.2%
1275
+73%
+154%
3Q14
28.2%
2Q14
16.6%
3Q13
14.9%
Minerals
Services
112
9M13
107
+5%
9M14
3843
-13%
9M14
33.7%
9M13
40.4%
89
+36%
9M14
121
9M13
2512
+107%
9M13 9M14
20.6% 13.5%
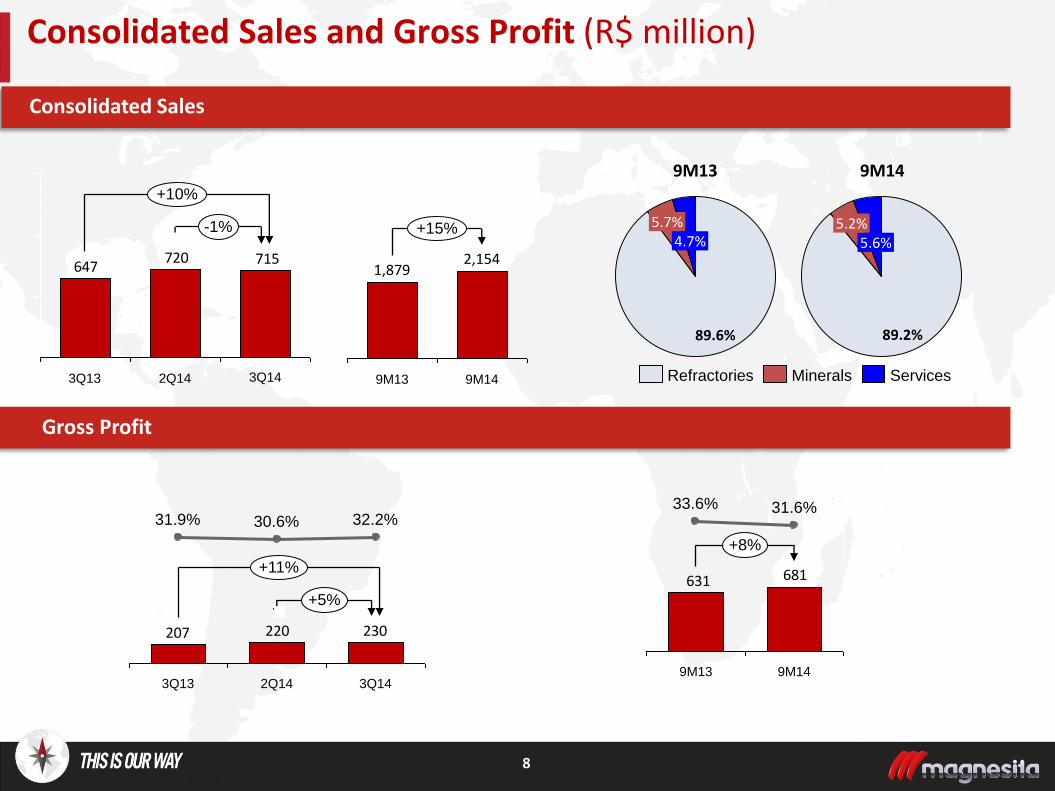
8
Consolidated Sales and Gross Profit (R$ million)
Por Segmento
715720647
3Q14 2Q14 3Q13
-1%
+10%
5.6% 5.2%
89.2%
5.7%
89.6%
4.7%
Services Minerals Refractories
9M13 9M14
Gross Profit
Consolidated Sales
+15%
9M14
2,154
9M13
1,879
230220207
30.6%
3Q13
31.9%
+5%
+11%
3Q14
32.2%
2Q14
681631
9M13
33.6%
9M14
+8%
31.6%
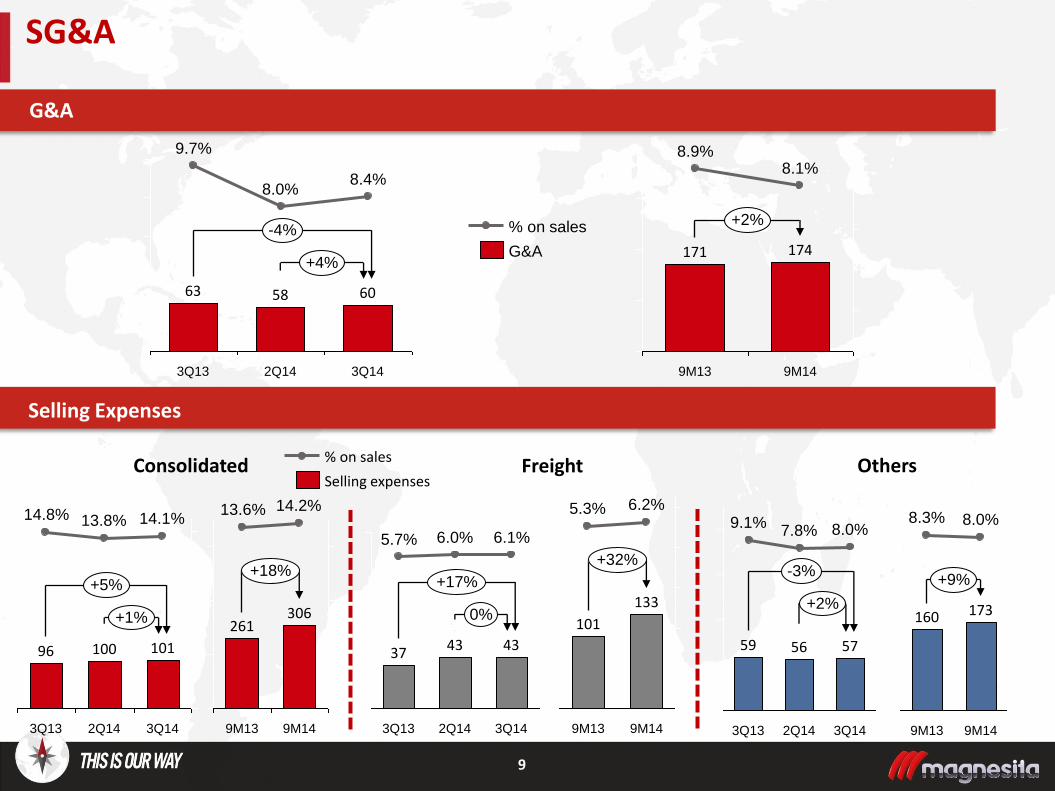
9
SG&A
Selling Expenses
G&A
2Q14
58
8.0%
3Q13
63
9.7%
+4%
-4%
3Q14
60
8.4%
+1%
+5%
3Q14
101
14.1%
2Q14
100
13.8%
3Q13
96
14.8%
Selling expenses
% on sales
0%
+17%
3Q14 3Q13
37
5.7%
43
6.1%
2Q14
43
6.0%
Consolidated Freight
G&A
% on sales
Others
56
7.8%
3Q13
59
9.1%
+2%
-3%
3Q14
57
8.0%
2Q14
8.1%
9M13
171
8.9%
+2%
9M14
174
+18%
9M14
306
14.2%
9M13
261
13.6%
133
6.2%
9M13
101
5.3%
+32%
9M14
8.0%
+9%
9M14
173
9M13
160
8.3%
10
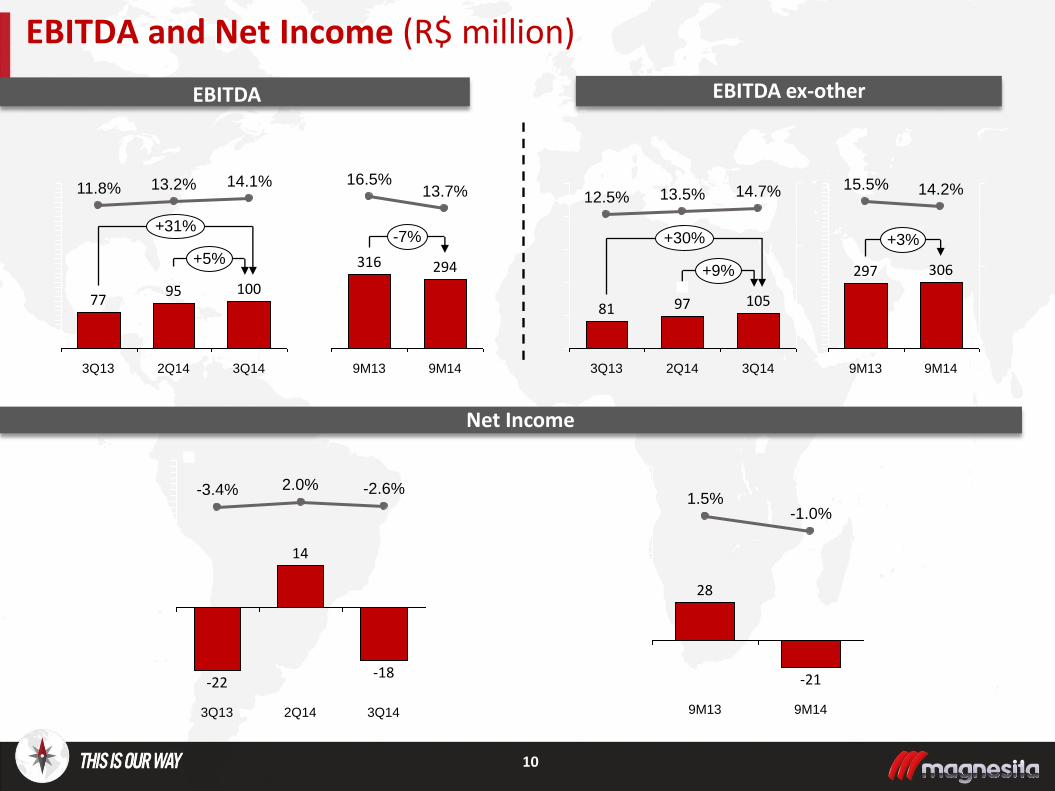
EBITDA and Net Income (R$ million)
EBITDA
Net Income
11.8%
3Q13
77
+5%
+31%
3Q14
100
14.1%
2Q14
95
13.2%
-22
-3.4%
3Q14
-18
-2.6%
2Q14
14
2.0%
3Q13
+9%
+30%
3Q14
105
14.7%
2Q14
97
13.5%
3Q13
81
12.5%
9M13
297
15.5%
+3%
9M14
306
14.2%
9M14 9M13
-21
-1.0%
28
1.5%
-7%
316
16.5%
9M13
294
9M14
13.7%
EBITDA ex-other
11
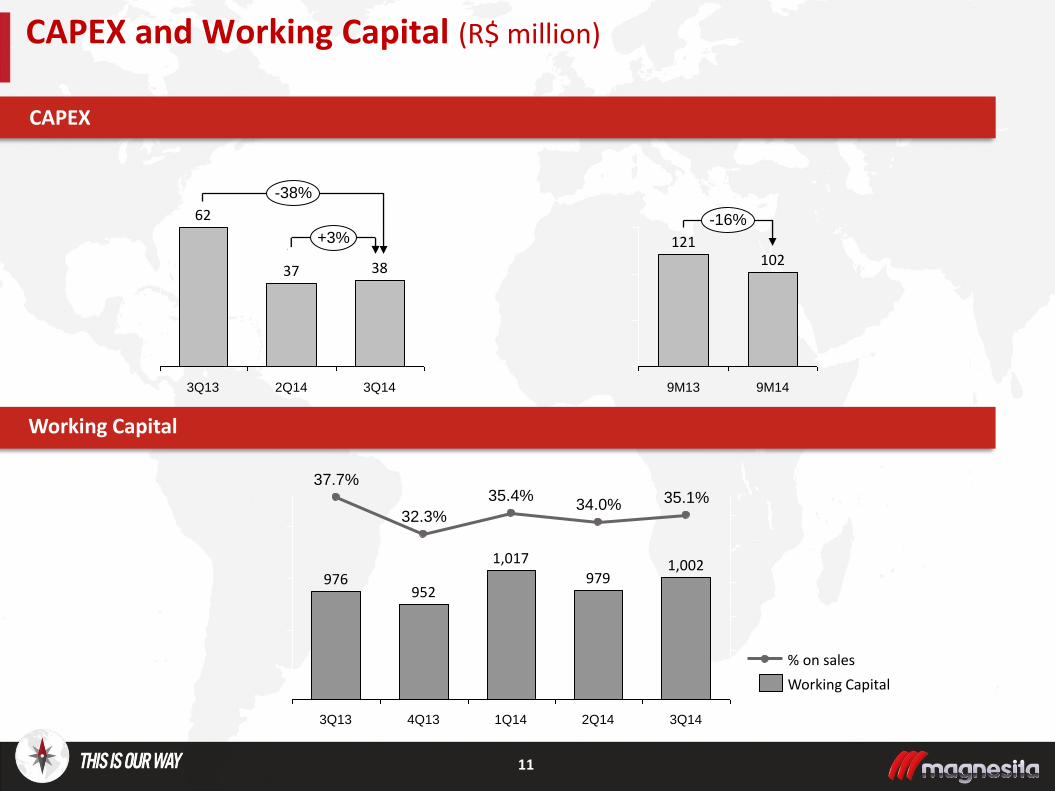
CAPEX and Working Capital (R$ million)
Working Capital
CAPEX
+3%
-38%
3Q14
38
2Q14
37
3Q13
62
34.0%
1Q14
1,017
35.4%
4Q13
952
32.3%
3Q13
976
37.7%
3Q14
979
2Q14
1,002
35.1%
Working Capital
% on sales
-16%
9M14
102
9M13
121
12
*EBITDA excluding other revenues / expenses
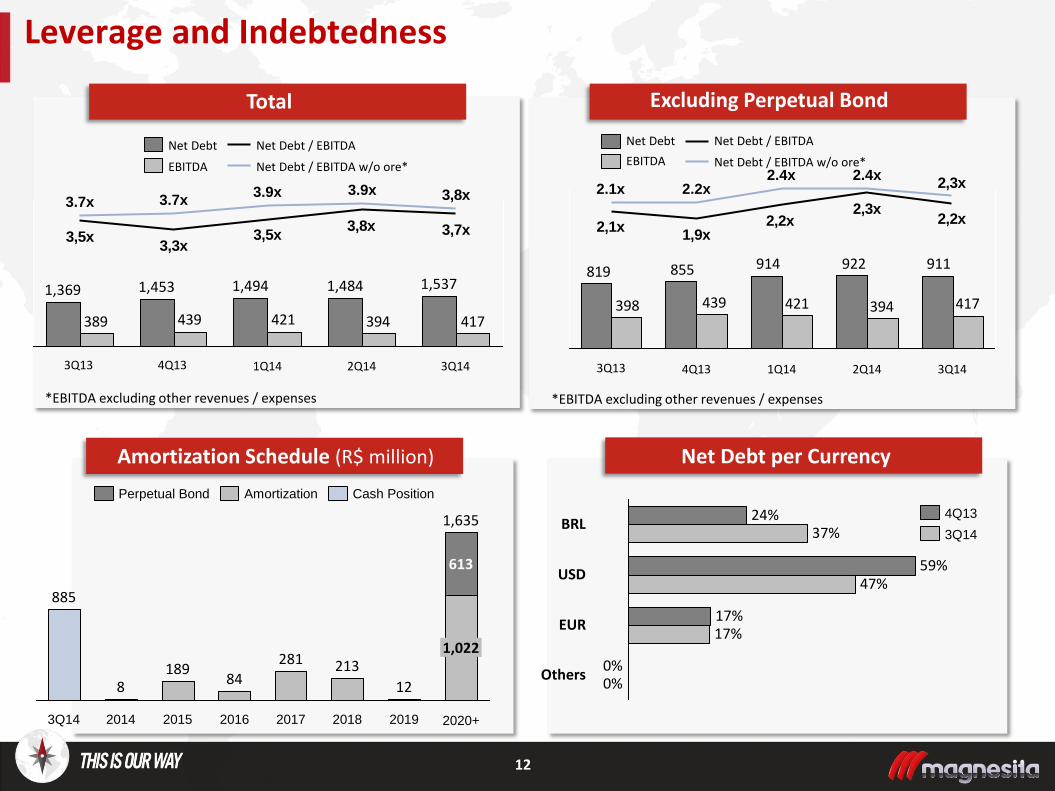
Leverage and Indebtedness
Total
Amortization Schedule (R$ million) Net Debt per Currency
Excluding Perpetual Bond
Others 0% 0%
EUR 17% 17%
USD 47%
59%
BRL 37%
24%
911922914855819
417394421439398
2,2x2,3x
2,2x1,9x
2,1x
2,3x
3Q14 2Q14
2.4x
1Q14
2.4x
4Q13
2.2x
3Q13
2.1x
Net Debt / EBITDA w/o ore*
Net Debt / EBITDA
EBITDA
Net Debt
2020+
1,635
1,022
613
2019
12
2018
213
2017
281
2016
84
2015
189
2014
8
3Q14
885
Cash Position Amortization Perpetual Bond
3Q14
4Q13
417394421439389
3,7x3,8x3,5x
3,3x3,5x
3,8x
3Q14
1,537
2Q14
1,484
3.9x
1Q14
1,494
3.9x
4Q13
1,453
3.7x
3Q13
1,369
3.7x
Net Debt / EBITDA w/o ore*
Net Debt / EBITDA
EBITDA
Net Debt
*EBITDA excluding other revenues / expenses
Octavio Pereira Lopes CEO
Eduardo Gotilla CFO and IRO
Daniel Domiciano Silva Investor Relations Manager
Lucas Veiga Investor Relations Analyst
Phone: +55 11 3152-3237/3241/3202 [email protected]
www.magnesita.com/ri
13
Investor Relations Contacts