3q15 analysts’ briefing -...
TRANSCRIPT
3Q15 Analysts’ Briefing
26 November 2015 ICON OFFSHORE BERHAD
Level 12A, East Wing, The Icon
No. 1, Jalan 1/86F, Off Jalan Tun Razak
55000 Kuala Lumpur, Malaysia
www.iconoffshore.com.my
Disclosure Statement
2
The information contained in this presentation is for information purposes only and does not constitute an offer or invitation to sell
or the solicitation of an offer or invitation to purchase any securities (“Securities”) of Icon Offshore Berhad (“ICON”) in Malaysia,
the United States or any other jurisdiction. This presentation should not, nor should anything contained in it, form the basis of, or
be relied upon in any connection with any contract or commitment whatsoever. This presentation is confidential and is intended
only for the exclusive use of the recipients thereof and may not be reproduced (in whole or in part), retransmitted, summarized or
distributed by them to any other persons without ICON's prior written permission
This presentation contains forward-looking statements that involve risks and uncertainties. Forward-looking statements are based
on certain assumptions and expectations of future events. The future events referred to in these forward-looking statements
involve known and unknown risks, uncertainties and other factors, many of which are beyond ICON's control, which may cause the
actual results to be materially different from those expressed or implied by the forward-looking statements. These forward-looking
statements are based on numerous assumptions regarding ICON's present and future business strategies and the environment in
which ICON operates and are not a guarantee of future performance. Any reference to past performance should not be taken as an
indication of future performance. ICON makes no representation, warranty or prediction that the results anticipated by such
forward-looking statements will be achieved, and such forward-looking statements represent, in each case, only one of many
possible scenarios and should not be viewed as the most likely or standard scenario. You are cautioned not to place undue
reliance on these forward looking statements, which are based on current view of Icon's management on future events.
This presentation has been prepared by ICON. No representation, warranty, express or implied, is made as to, and no reliance
should be placed on, the fairness, accuracy, completeness or correctness of the information and opinions in this presentation.
Certain data in this presentation was obtained from various external data sources, and ICON has not verified such data with
independent sources. None of ICON or any of its directors, officers, employees, agents or advisers, or any of their respective
affiliates, advisers or representatives, undertake to update, revise or re-affirm the presentation including any forward-looking
statements, whether as a result of new information, future events or otherwise and none of them shall have any liability (in
negligence or otherwise) for any loss howsoever arising from any use of this presentation or its contents or otherwise arising in
connection with this presentation and any liability therefore (including liability for any direct or indirect consequential loss or
damage) is hereby expressly disclaimed and none of them accept any responsibility for any loss or damages howsoever arising,
whether directly or indirectly from any use, reliance or distribution of the presentation, its contents or otherwise arising in
connection with the prospectus.

Icon Offshore at a glance
3
Key Takeaways 33 Vessels - as at 30 Sept 2015
Largest pure-play OSV
provider in Malaysia and one
of the largest in Southeast
Asia in terms of number of
vessels
Diversified and young fleet of
33 vessels with low average
age of 5.5 years for the year
ending 31 December 2015
(FY2015)
Four vessels currently under
construction with targeted
delivery by Q1 2017
Focused on shallow waters
with focus on optimising
utilisation rates, strategic
fleet diversification and fleet
renewal programme
AHT/AHTS 24 vessels
SSV 4 vessels
UV 1 vessel
PSV 2 vessels
AWB 2 vessels
YTD Sept 2015 Revenue
RM201.2 mil
(YTD Sept 2014 Revenue:
RM241.8 mil)
YTD Sept 2015 Average
fleet utilisation
61%
(YTD Sept 2014 Average fleet
utilisation: 79%)
YTD Sept 2015 Adjusted
PAT
RM14.6 mil
(YTD Sept 2014 Adjusted
PAT: RM71.4 mil)
YTD Sept 2015 Adjusted
PAT Margin
7.2%
(YTD Sept 2014 Adjusted PAT
Margin: 29.5%)
3Q15 Highlights
As at 30 September 2015, the Group’s order book stood
at RM714.6 mil
Secure a short-term contract with ExxonMobil Exploration
& Production Malaysia Inc. for the provision of two (2)
AHTSs, namely Icon Zara and Icon Ikhlas
Leveraging on PETRONAS’ initiatives to support MOSVA
members

• According to International Energy Agency, higher oil
output from OPEC and a slowdown in world economic
growth means the crude oil glut will persist through 2016
• A slowdown in oil demand growth stemming from lower
prices faded as economic activity weakened in countries
dependent on commodity revenues
• World oil supply held steady near 99.6 mil barrels/day in
September as a drop in output from the US, and other
producers outside of OPEC, was offset by increased
supply from the cartel itself
• Saudi Arabia is working with OPEC members and
producers from outside the group to stabilise the market
via continued exploration and producing oil and investing
in spare capacity
Industry Trends and Leading Indicators
4
Global outlook remains bearish…
Source: International Energy Agency 2015, Thomson Reuters, Bloomberg article
…with some bright spots in the domestic market
• PETRONAS is striving to support local owner
operators through a review of its licensing
requirements
• A directive was issued, effective from September
2015, eliminating the use of agents for tender
submissions. Preference will be given to members of
the Malaysian OSV Owners Association for the
charter of vessels
• This will help support local owners and stem the
outflow of funds to foreign boat owners, which is
largely in line with CORAL 2.0 program to reduce
costs
Strategic roadmap
5
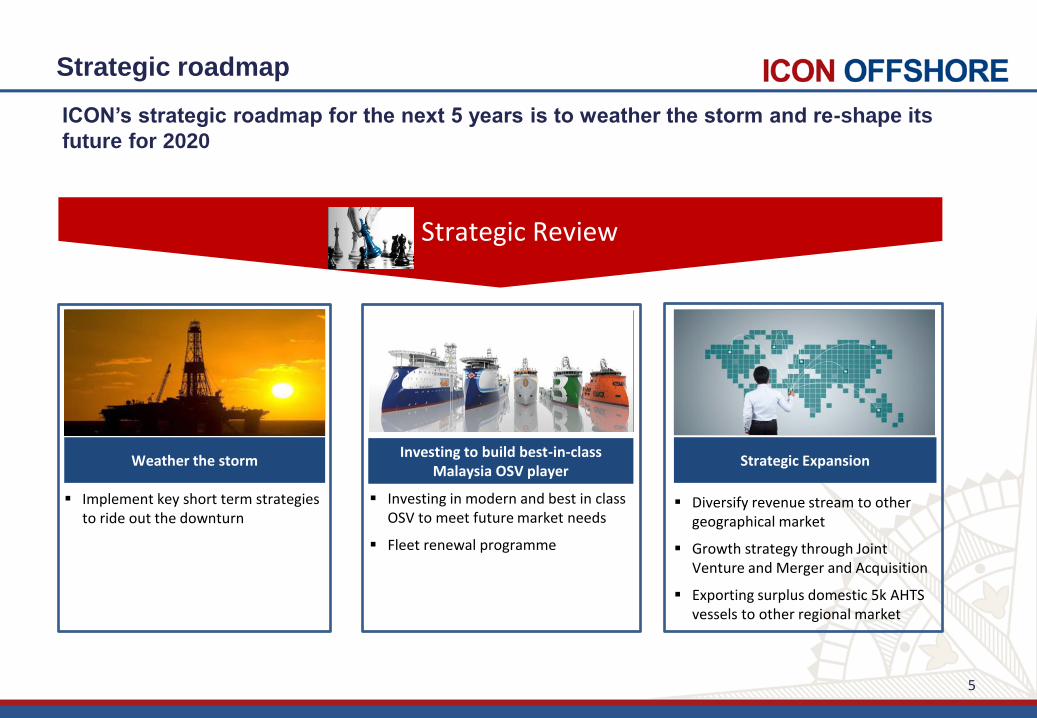
Strategic Review
Weather the storm
Implement key short term strategies to ride out the downturn
Investing to build best-in-class Malaysia OSV player
Investing in modern and best in class OSV to meet future market needs
Fleet renewal programme
Strategic Expansion
Diversify revenue stream to other geographical market
Growth strategy through Joint Venture and Merger and Acquisition
Exporting surplus domestic 5k AHTS vessels to other regional market
ICON’s strategic roadmap for the next 5 years is to weather the storm and re-shape its
future for 2020
Business Strategies
6
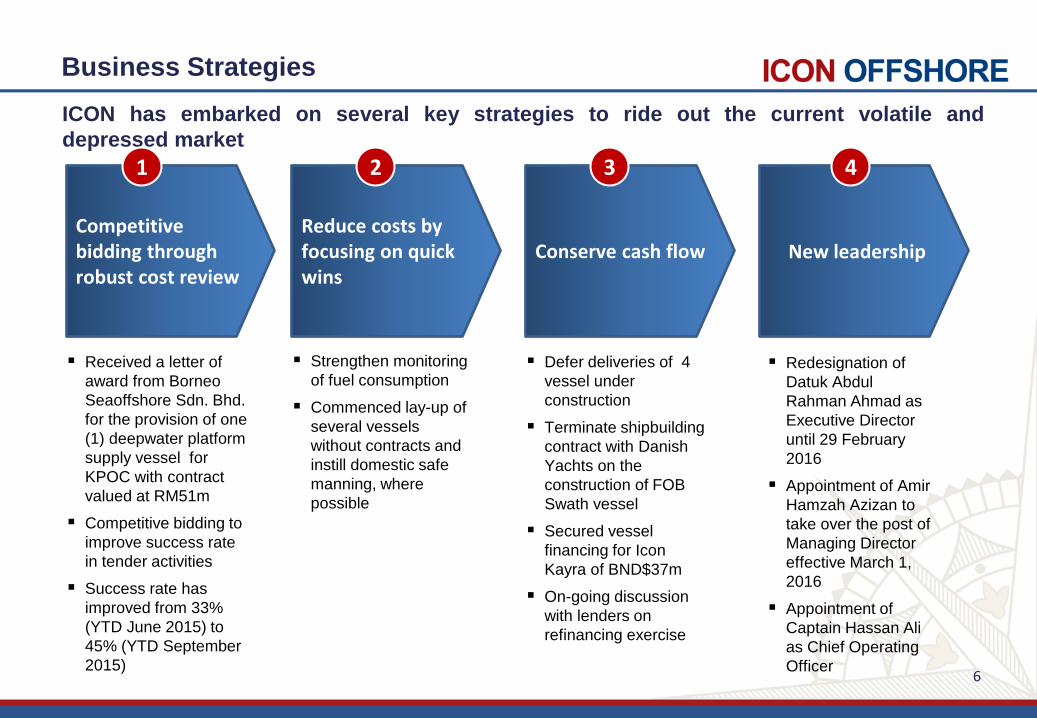
ICON has embarked on several key strategies to ride out the current volatile and
depressed market
Received a letter of
award from Borneo
Seaoffshore Sdn. Bhd.
for the provision of one
(1) deepwater platform
supply vessel for
KPOC with contract
valued at RM51m
Competitive bidding to
improve success rate
in tender activities
Success rate has
improved from 33%
(YTD June 2015) to
45% (YTD September
2015)
Strengthen monitoring
of fuel consumption
Commenced lay-up of
several vessels
without contracts and
instill domestic safe
manning, where
possible
Defer deliveries of 4
vessel under
construction
Terminate shipbuilding
contract with Danish
Yachts on the
construction of FOB
Swath vessel
Secured vessel
financing for Icon
Kayra of BND$37m
On-going discussion
with lenders on
refinancing exercise
Redesignation of
Datuk Abdul
Rahman Ahmad as
Executive Director
until 29 February
2016
Appointment of Amir
Hamzah Azizan to
take over the post of
Managing Director
effective March 1,
2016
Appointment of
Captain Hassan Ali
as Chief Operating
Officer
Competitive bidding through robust cost review
1
Reduce costs by focusing on quick wins
Conserve cash flow New leadership
2 3 4

Operational Highlights
7

Operational Highlights (1/5) – Utilisation
8
Fleet utilisation rate Contracts status
No. of vessels
15
Type of contract
Long-term
18 Spot/available
for charter
%
45%
55%
Utilisation rate trend
0%
10%
20%
30%
40%
50%
60%
70%
80%
90%
YTD Q32014 YTD Q42014 YTD Q12015 YTD Q22015 YTD Q32015
Utilisation Rate
Competitive tenders have arrested the decline in utilisation Backed by significant number of vessels with long-term contracts
15 vessels (45%) out of the Group’s total fleet have
remaining tenure on its long-term contracts, of which
constitutes ~91% of the Group’s order book of
RM714.6 mil as at 30 September 2015
AHTS
AHT
SSV
PSV
AWB
Others
YTD Sept 2014 YTD Sept 2015
88%
41%
73%
88%
100%
62%
65%
40%
51%
9%
91%
100%
79% 61%

Operational Highlights (2/5) – Order book
9
Increased bidding activity with focus on the South East Asia region, as well as maintaining
earnings visibility
Charter Contract Tender Success Rate YTD Sept 2015
Healthy order book with several tenders still awaiting results
Total order book stood at RM714.6 mil, of which
RM455.8 mil (63.8%) are firm, RM249.4 mil (34.9%) are
extension options and RM9.4 mil (1.3%) are spot
charters.
Continuous participation in tenders
The Group has average success rate of 45% (2Q 2015:
33%) in our tendering activities.
PETRONAS Carigali
Contracts with reputable oil majors limits credit risks
Order Book
RM' mil 2015 2016 2017 >2017 Total
Firm Charter 54.3 207.3 144.2 50.0 455.8
Option Charter 0.0 7.1 62.5 179.7 249.4
Spot Charter 8.6 0.9 0.0 0.0 9.4
Contract Value 62.9 215.3 206.8 229.7 714.6
Order Book Summary as at 30-Sept 2015
Successful Unsuccessful Total Success Rate Awaiting Results
AHTS 6 5 11 55% 5
AHT 2 4 6 33% 2
SSV 1 0 1 100% 4
PSV 0 3 3 0% 5
UV 0 0 0 0% 1
AWB 1 0 1 0% 0
Total 10 12 22 45% 17

Operational Highlights (3/5) – Contract awards
10
Egypt
Saudi Arabia
Malaysia
India U.A.E
Iraq
Myanmar
Thailand
Vietnam
Brunei
ICON Experience ICON Vessel(s) currently deployed
14 Jul 2015
Received two letters of award from PCSB for the provision of two
anchor handling tug/supply vessels (“Long-term Contracts”), namely
Icon Samudera and Icon Sophia for a period of 2+1 years
The Long-term Contracts is effective from 5 July 2015
The total value of the Long Term Contracts is approximately RM55
mil inclusive of extension period
27 May 2015
Secured second long-term contract through Brunei
JV partner with Brunei Shell Petroleum for the
provision of one (1) Accommodation Work Boat for
a period of 2+1 years, namely Icon Valiant
The contract is valued at approximately RM99 mil
Business Development – Key Significant Contracts YTD September 2015
23 Oct 2015
Received Letter of Award from ExxonMobil Exploration &
Production Malaysia Inc. for the provision two (2) Anchor Handling
Tug/Supply vessels (“Short-term Contract”), namely Icon Zara and
Icon Ikhlas
Icon Zara has commenced its service on 30 Sept 2015 and shall
continue for a period of six (6) months with an option for one (1)
month extension period
Icon Ikhlas has commenced its service on 1 Oct 2015 for a period
of three (3) months
The Short-term Contract is valued at approximately RM7.7 mil
24 Nov 2015
Received a letter of award from Borneo Seaoffshore Sdn. Bhd. for
the provision of one (1) deepwater platform supply vessel for
KPOC
The contract is valued at approximately RM51 million
Contracts awarded after 3Q15
Operational Highlights (4/5) - Shipbuilding
11
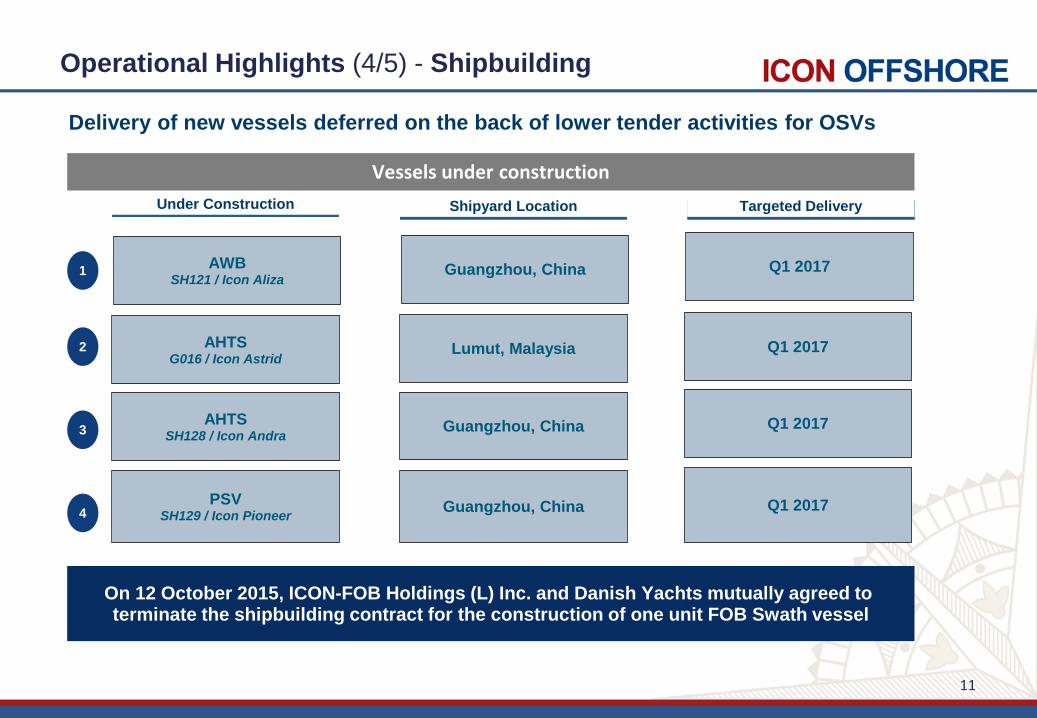
Delivery of new vessels deferred on the back of lower tender activities for OSVs
Vessels under construction
AHTS G016 / Icon Astrid
AHTS SH128 / Icon Andra
AWB SH121 / Icon Aliza
PSV SH129 / Icon Pioneer
Lumut, Malaysia
Guangzhou, China
Guangzhou, China
Guangzhou, China
Q1 2017
Q1 2017
Q1 2017
Q1 2017
Under Construction Shipyard Location Targeted Delivery
3
1
2
4
On 12 October 2015, ICON-FOB Holdings (L) Inc. and Danish Yachts mutually agreed to terminate the shipbuilding contract for the construction of one unit FOB Swath vessel
Operational Highlights (5/5) - HSE
12
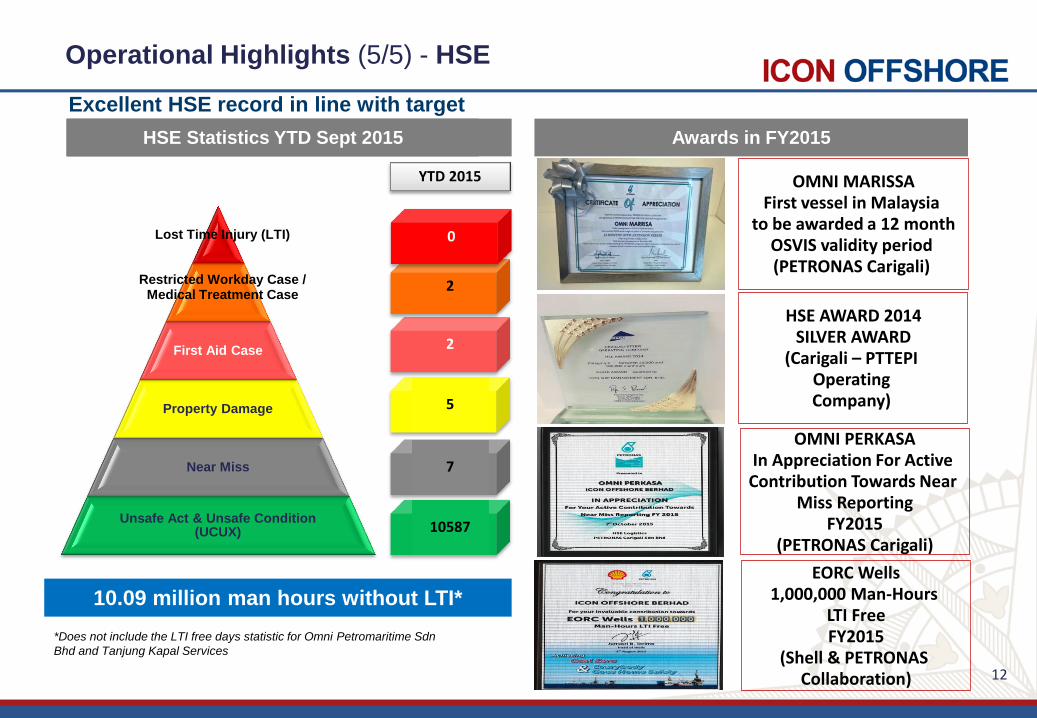
Excellent HSE record in line with target
Awards in FY2015 HSE Statistics YTD Sept 2015
OMNI MARISSA First vessel in Malaysia
to be awarded a 12 month OSVIS validity period (PETRONAS Carigali)
HSE AWARD 2014 SILVER AWARD
(Carigali – PTTEPI Operating Company)
HSE Statistics YTD Sept 2015
First Aid Case
Property Damage
Near Miss
Unsafe Act & Unsafe Condition (UCUX)
Restricted Workday Case / Medical Treatment Case
Lost Time Injury (LTI)
10587
7
5
2
2
0
YTD 2015
10.09 million man hours without LTI*
*Does not include the LTI free days statistic for Omni Petromaritime Sdn
Bhd and Tanjung Kapal Services
OMNI PERKASA In Appreciation For Active Contribution Towards Near
Miss Reporting FY2015
(PETRONAS Carigali) EORC Wells
1,000,000 Man-Hours LTI Free FY2015
(Shell & PETRONAS Collaboration)

Group Financial Overview
13
241.8201.2
YTD Sept 2014 YTD Sept 2015
Utilisation rates
-16.8%
61%79%
147.8
90.8
YTD Sept 2014 YTD Sept 2015Margin
61.6%
-38.6%
45.1%
71.4
14.6
YTD Sept 2014 YTD Sept 2015Margin
7.2%29.5%
-79.6%
Group Financial Overview – Cumulative Period
14
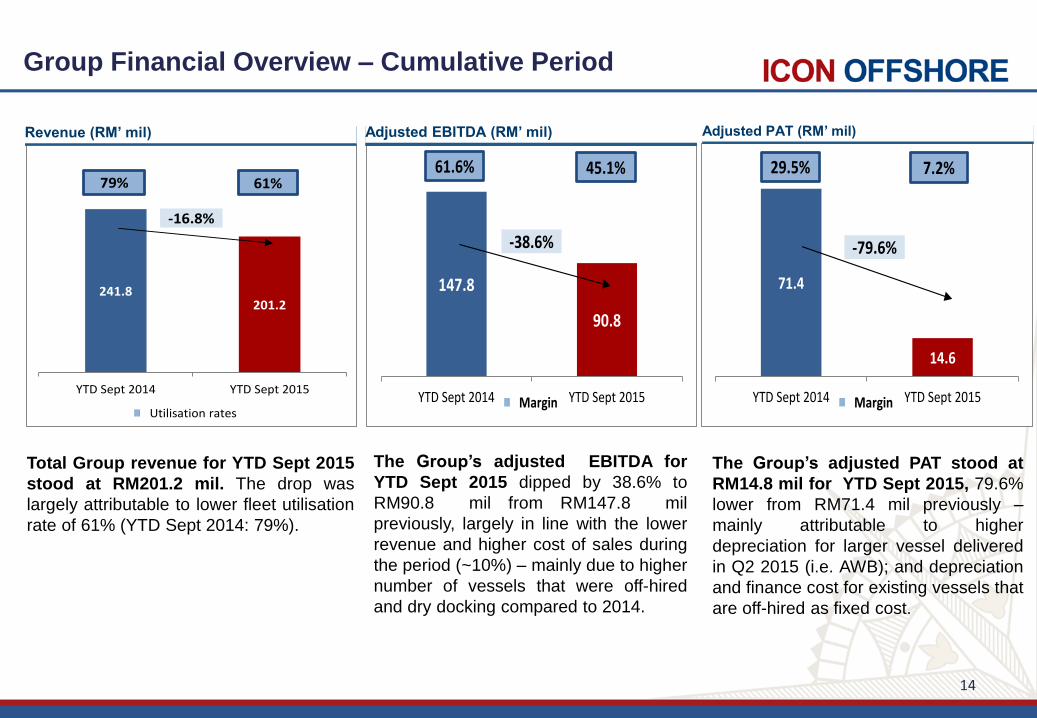
Revenue (RM’ mil) Adjusted EBITDA (RM’ mil) Adjusted PAT (RM’ mil)
Total Group revenue for YTD Sept 2015
stood at RM201.2 mil. The drop was
largely attributable to lower fleet utilisation
rate of 61% (YTD Sept 2014: 79%).
The Group’s adjusted EBITDA for
YTD Sept 2015 dipped by 38.6% to
RM90.8 mil from RM147.8 mil
previously, largely in line with the lower
revenue and higher cost of sales during
the period (~10%) – mainly due to higher
number of vessels that were off-hired
and dry docking compared to 2014.
The Group’s adjusted PAT stood at
RM14.8 mil for YTD Sept 2015, 79.6%
lower from RM71.4 mil previously –
mainly attributable to higher
depreciation for larger vessel delivered
in Q2 2015 (i.e. AWB); and depreciation
and finance cost for existing vessels that
are off-hired as fixed cost.

79.7
69.1
3Q14 3Q15
-13.4%
20.7
6.1
3Q14 3Q15
-70.5%
8.9%26.0%
Margin
45.1
32.4
3Q14 3Q15
56.5% 46.9%
Margin
-28.2%
Group Financial Overview – Quarter on Quarter
(3Q14 vs 3Q15)
15
3Q15 Group revenue stood at RM69.1
mil versus RM79.7 mil in 3Q14. The
decrease by RM10.6m was primarily
due to lower vessel utilisation rate
during the quarter under review 3Q15.
This is a decrease of 14.2% from 3Q14
of 76.1%
The decrease were mainly due to 4
vessels on scheduled drydock, vessels
that have completed contracts and
vessels on repair/maintenance program
3Q15 adjusted EBITDA recorded at
RM32.4m, mainly lower by RM12.7m
due to the lower revenue as a result
from lower oil and gas activities during
the quarter.
3Q15 adjusted PAT showed a dip which
is mainly attributable to higher
depreciation for larger vessel (i.e. AWB
and PSV) delivered in Q2 2015; as well
as depreciation and finance cost
incurred for existing vessels that are off-
hired as fixed cost.
Revenue (RM’ mil) Adjusted EBITDA (RM’ mil) Adjusted PAT (RM’ mil)
3.3
5.26.1
1Q15 2Q15 3Q15
18.6%
8.9%7.5%
Margin
56.4%
5.2%
27.0
31.5 32.4
1Q15 2Q15 3Q15
Margin
42.5% 46.9%45.9%
2.8%16.7%
63.6 68.6 69.1
1Q15 2Q15 3Q15
0.7%7.8%
Group Financial Overview – Quarter by Quarter
(Trailing quarters)
16
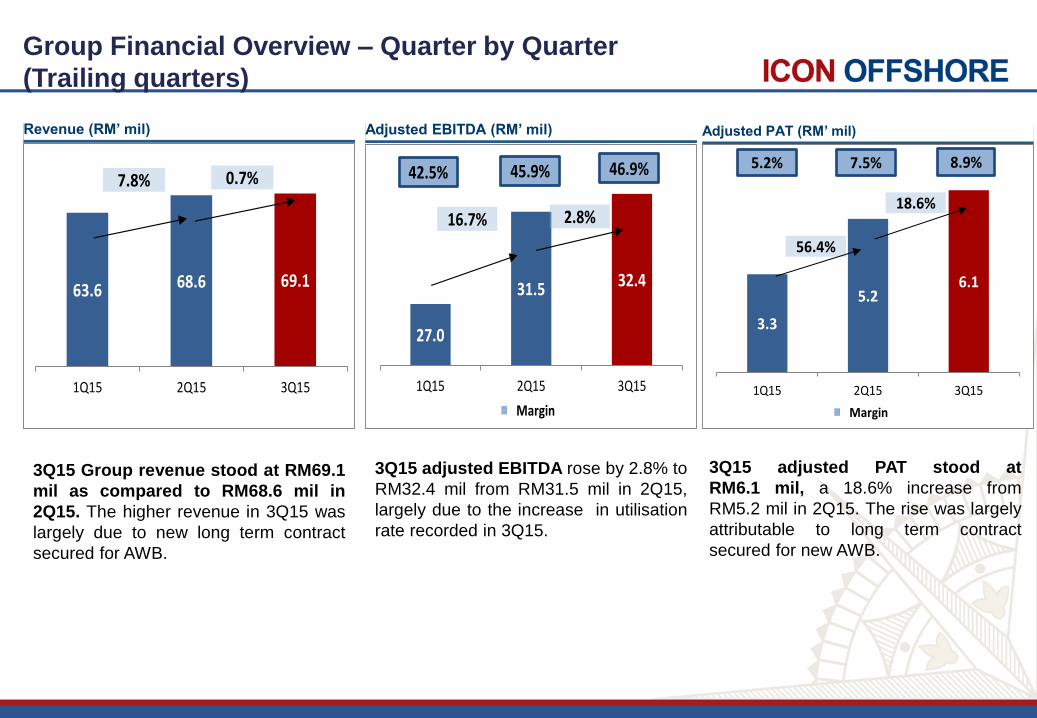
3Q15 Group revenue stood at RM69.1
mil as compared to RM68.6 mil in
2Q15. The higher revenue in 3Q15 was
largely due to new long term contract
secured for AWB.
3Q15 adjusted EBITDA rose by 2.8% to
RM32.4 mil from RM31.5 mil in 2Q15,
largely due to the increase in utilisation
rate recorded in 3Q15.
3Q15 adjusted PAT stood at
RM6.1 mil, a 18.6% increase from
RM5.2 mil in 2Q15. The rise was largely
attributable to long term contract
secured for new AWB.
Revenue (RM’ mil) Adjusted EBITDA (RM’ mil) Adjusted PAT (RM’ mil)
RM85.5 mil72%
RM33.2 mil28%
75%
25%
RM152.7 mil96%
RM7.1 mil4%
90%
10%
166
924 18
7 6
121
816
3
45
7
0.0
20.0
40.0
60.0
80.0
100.0
120.0
140.0
160.0
180.0
AHTS AHT SSV PSV AWB Others
YTD Sept 2014 YTD Sept 2015
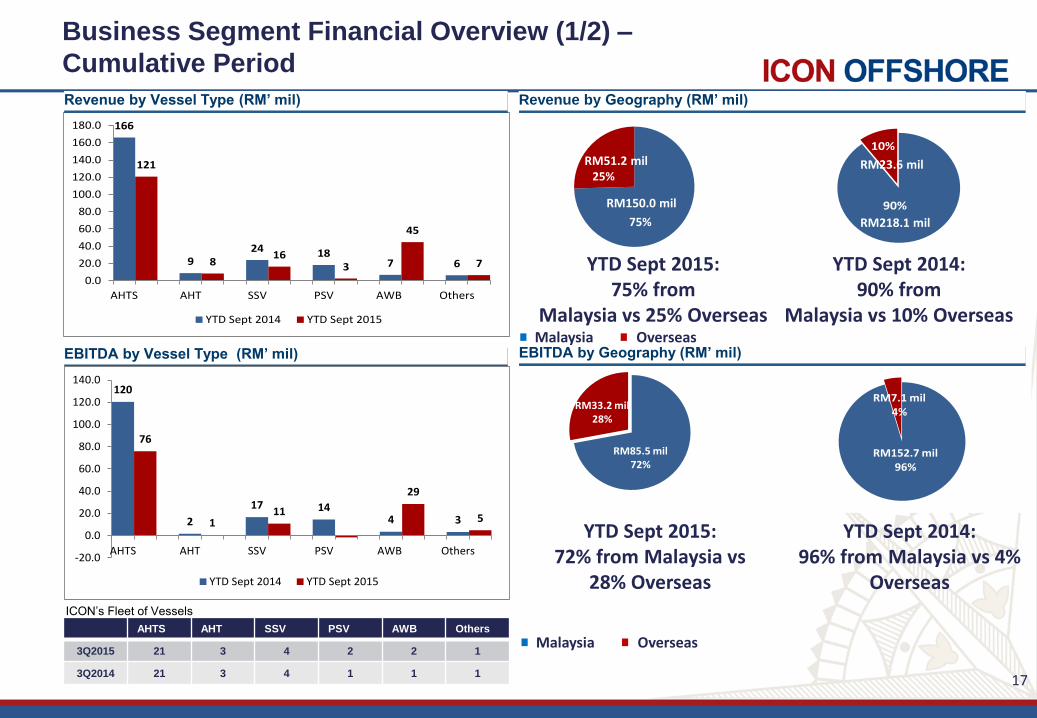
Business Segment Financial Overview (1/2) –
Cumulative Period
17
Revenue by Vessel Type (RM’ mil) Revenue by Geography (RM’ mil)
EBITDA by Geography (RM’ mil) EBITDA by Vessel Type (RM’ mil)
YTD Sept 2015: 72% from Malaysia vs
28% Overseas
YTD Sept 2014: 96% from Malaysia vs 4%
Overseas
RM150.0 mil
RM218.1 mil
RM51.2 mil
YTD Sept 2015: 75% from
Malaysia vs 25% Overseas
YTD Sept 2014: 90% from
Malaysia vs 10% Overseas
RM23.6 mil
120
2
17 144 3
76
111
29
5
-20.0
0.0
20.0
40.0
60.0
80.0
100.0
120.0
140.0
AHTS AHT SSV PSV AWB Others
YTD Sept 2014 YTD Sept 2015
ICON’s Fleet of Vessels
AHTS AHT SSV PSV AWB Others
3Q2015 21 3 4 2 2 1
3Q2014 21 3 4 1 1 1
Malaysia Overseas
Malaysia Overseas

38
1 25
41
25
14
14
2
-5.0
0.0
5.0
10.0
15.0
20.0
25.0
30.0
35.0
40.0
AHTS AHT SSV PSV AWB Others
Q32014 Q32015
65%
35%
3Q14: 84% from Malaysia vs 16% Overseas
54
4 47 7
4
38
4 6
0
20
2
0.0
10.0
20.0
30.0
40.0
50.0
60.0
AHTS AHT SSV PSV AWB Others
Q32014 Q32015
16%
84%
Business Segment Financial Overview (2/2) –
Quarter on Quarter
18
Revenue by Vessel Type (RM’ mil) Revenue by Geography (RM’ mil)
EBITDA by Vessel Type (RM’ mil) EBITDA by Geography (RM’ mil)
3Q15: 64% from Malaysia vs 36%
Overseas
Malaysia Overseas
3Q14: 90% from Malaysia vs 10%
Overseas
RM67.3 mil RM44.6 mil
3Q15: 65% from Malaysia vs 35% Overseas
RM21.9 mil RM12.5 mil
AHTS AHT SSV PSV AWB Others
3Q2015 21 3 4 2 2 1
3Q2014 21 3 4 1 1 1
ICON’s Fleet of Vessels
RM27.9 mil64%
RM15.6 mil36%
Malaysia Overseas
RM45.2 mil90%
RM5.1 mil10%
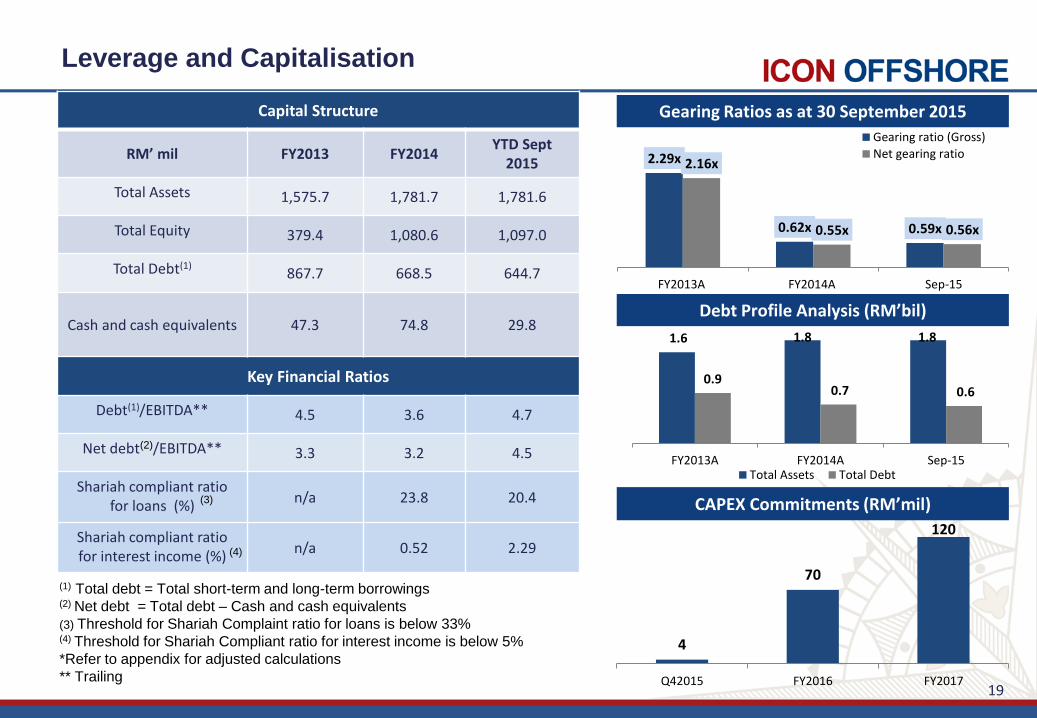
Leverage and Capitalisation
19
Capital Structure
RM’ mil FY2013 FY2014 YTD Sept
2015
Total Assets 1,575.7 1,781.7 1,781.6
Total Equity 379.4 1,080.6 1,097.0
Total Debt(1) 867.7 668.5 644.7
Cash and cash equivalents 47.3 74.8 29.8
Key Financial Ratios
Debt(1)/EBITDA** 4.5 3.6 4.7
Net debt(2)/EBITDA** 3.3 3.2 4.5
Shariah compliant ratio for loans (%)
n/a 23.8 20.4
Shariah compliant ratio for interest income (%)
n/a 0.52 2.29
(1) Total debt = Total short-term and long-term borrowings (2) Net debt = Total debt – Cash and cash equivalents
(3) Threshold for Shariah Complaint ratio for loans is below 33% (4) Threshold for Shariah Compliant ratio for interest income is below 5%
*Refer to appendix for adjusted calculations
** Trailing
Gearing Ratios as at 30 September 2015
Debt Profile Analysis (RM’bil)
CAPEX Commitments (RM’mil) (3)
(4)
2.29x
0.62x 0.59x
2.16x
0.55x 0.56x
FY2013A FY2014A Sep-15
Gearing ratio (Gross)
Net gearing ratio
1.6 1.8 1.8
0.9 0.7 0.6
FY2013A FY2014A Sep-15Total Assets Total Debt
4
70
120
Q42015 FY2016 FY2017

Key takeaways
1 Icon has been taking positive steps to navigate the current
challenging market conditions
We are controlling costs, ensuring operational efficiency, and expanding into new
markets
We have a strong business that is continuing to win contracts
Our team blends decades of domestic, international and industry experience
2 Icon’s positive steps are starting to show results and have an impact
Our adjusted net profit and revenue have all improved on a quarter-by-quarter
basis since the start of the financial year
There is a higher vessel utilisation arising from expansion into the Brunei market
We have a higher tender success rate through a targeted bidding strategy
Our vessels running costs are lower through enhanced operational efficiency –
improved margins
20
1
2
Thank you
21

Appendices
22
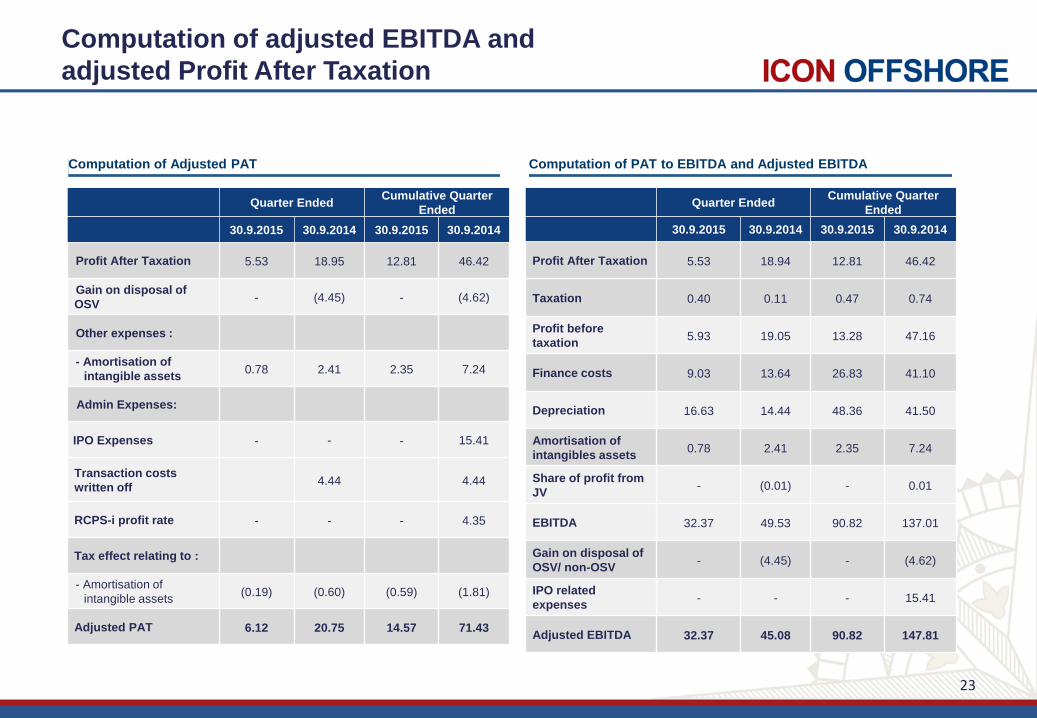
Computation of adjusted EBITDA and
adjusted Profit After Taxation
23
Computation of PAT to EBITDA and Adjusted EBITDA Computation of Adjusted PAT
Quarter Ended
Cumulative Quarter
Ended
30.9.2015 30.9.2014 30.9.2015 30.9.2014
Profit After Taxation 5.53 18.95 12.81 46.42
Gain on disposal of
OSV - (4.45) - (4.62)
Other expenses :
- Amortisation of
intangible assets 0.78 2.41 2.35 7.24
Admin Expenses:
IPO Expenses - - - 15.41
Transaction costs
written off
4.44
4.44
RCPS-i profit rate - - - 4.35
Tax effect relating to :
- Amortisation of
intangible assets (0.19) (0.60) (0.59) (1.81)
Adjusted PAT 6.12 20.75 14.57 71.43
Quarter Ended Cumulative Quarter
Ended
30.9.2015 30.9.2014 30.9.2015 30.9.2014
Profit After Taxation 5.53 18.94 12.81 46.42
Taxation 0.40 0.11 0.47 0.74
Profit before
taxation 5.93 19.05 13.28 47.16
Finance costs 9.03 13.64 26.83 41.10
Depreciation 16.63 14.44 48.36 41.50
Amortisation of
intangibles assets 0.78 2.41 2.35 7.24
Share of profit from
JV - (0.01) - 0.01
EBITDA 32.37 49.53 90.82 137.01
Gain on disposal of
OSV/ non-OSV - (4.45) - (4.62)
IPO related
expenses - - - 15.41
Adjusted EBITDA 32.37 45.08 90.82 147.81