4 july 2013 fhhr · 4 july 2013 fhhr morning ... fishbone diagram ... (tlr, part, hh, kb &...
TRANSCRIPT

4 July 2013
FHHR

Morning ◦ Incident Analysis: introduce tools to assist with the
review of events (near miss or actual) and determine system changes
◦ Start on Daily Visual Management
Lunch
Afternoon ◦ Daily Visual Management: understand and develop
some visuals and skills in using daily visual management in your area


Occurrence:
◦ noun something that happens; event; incident
Alert:
◦ adjective fully aware and attentive; wide-awake; keen
◦ noun: an attitude of vigilance, readiness, or caution; a
warning or alarm of an impending military attack, a storm, etc.; the period during which such a warning or alarm is in
effect.

Read over the Safety Alert or Incident Form
Volunteer for leader for the activity

Used to move past symptoms and help find root cause of a problem
Asking “WHY” 5 or more times helps to delve deep enough to get to the root cause & understand it

provided as examples
different than the interview questions
ask how it impacted the incident
(Taken from the Canadian Incident Analysis Framework, pg 89)

Group Activity – 15 minutes ◦ determine what questions you as a
manager/director will need to ask
◦ Can you answer the 5 Whys?

Code 1 Code 2 Code 3 Code 4
No known injury. No clinical significance. No damage to equipment or facility.
Minor injury requiring basic first aid or short term monitoring. Action to rectify
Adverse outcome or significant potential for adverse outcome. Insurance claim anticipated. Root cause analysis of system failure is expected. Serious incident where the potential for litigation is thought to be prevalent.
Tragic incidents where the potential is that litigation could be initiated at anytime An unanticipated death or potential major loss of function or major injury, including, but not limited to:


Critical Incident vs
Multidisciplinary Event Review vs
Informal Review vs
Medical Review vs
Staff Discussion


The Provincial QCC reviews all critical incidents and when system change is possible , they send the alert out to all the RHA which tells the story and recommends actions to take

Table Activity – 5 minutes ◦ Determine
Code
Response required
Timeline for reporting

Chronological listing of information pertaining to event.
Include: ◦ Date
◦ Day of Week
◦ Time
◦ Information
◦ Source of Information
This can be shown in a table or timeline
Table Activity – 20 minutes ◦ In your table group, write out the sequence of events

Cause and Effect Diagrams are used when you have a focused problem to identify all potential causes to that problem.
A Cause and Effect Diagram will provide: ◦ An easy, structured way to identify all possible causes
◦ An organized view of all possible causes
◦ Understanding of the relationships among the possible causes
◦ Differentiation of „root cause‟ from perceived cause
Fishbone Diagram
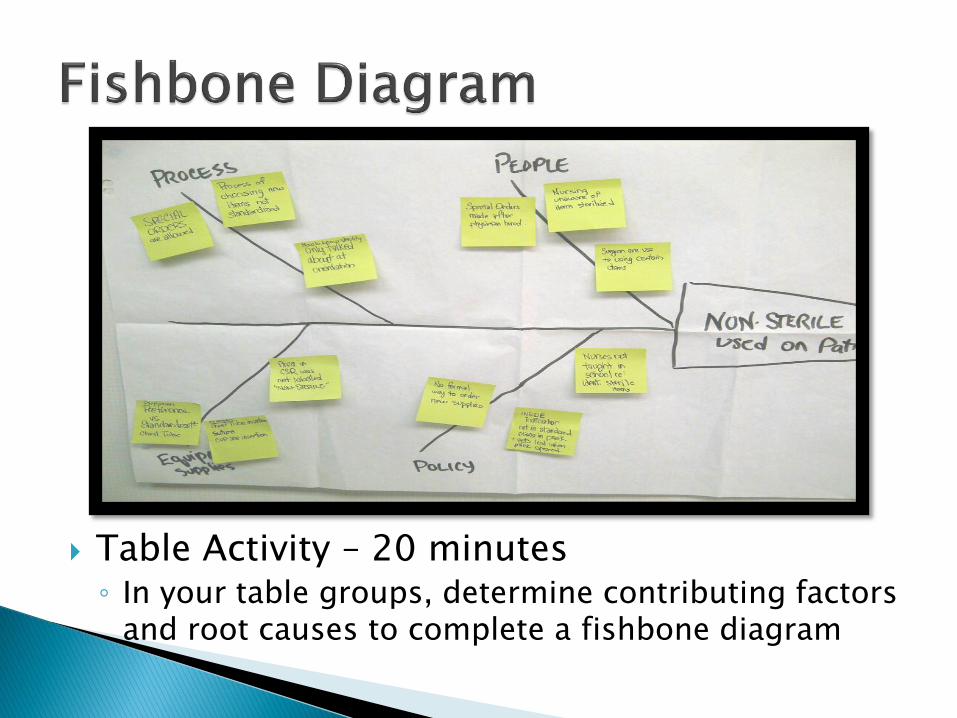
Table Activity – 20 minutes ◦ In your table groups, determine contributing factors
and root causes to complete a fishbone diagram
Mike

Mistake-prone situations ◦ People Issues: multi-tasking, inexperienced, use of
workarounds, misunderstandings, infrequent task
◦ Product Issues: new product, poor design, changes to existing products
◦ System or process Issues: new process, unreliable process, work instructions not immediately available
◦ Environmental Issues: inadequately maintained equipment, same information in multiple places, disorganized and unsafe work spaces
Inability to envision defect-free work
Failure to recognize defects
Acceptance of defects as part of every day life
Lack of management presence or response to defects
Fatigue and apathy

Inspection
Standard Work
Visual Control
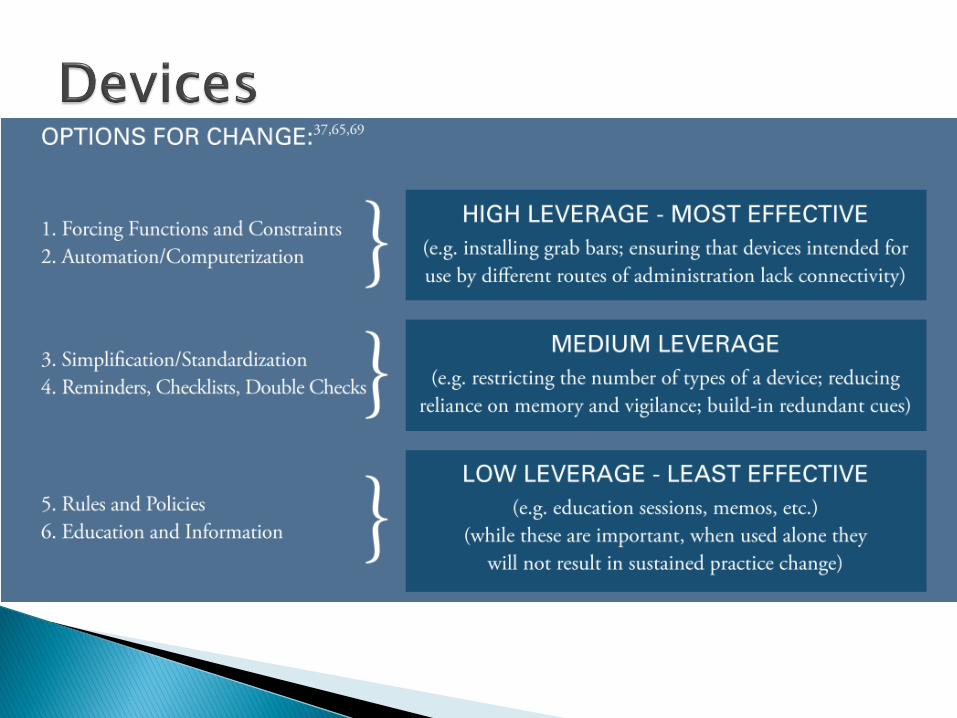
Devices

Standard Work is a set of specific instructions that allow processes to be completed in a consistent, timely, and repeatable manner.
Purpose: ◦ To ensure work and expectations are safe and
reasonable.
◦ To define and standardize normal conditions in order to see abnormal conditions as soon as they occur.

Allow work to be done in the best way, every time
Allows us to see waste
It is the foundation for improvements
Ensure improvements are held
Assists with training
Specifies responsibility and expected time for completion

Learn to distinguish promptly between what is normal and what is not with visual controls.
Visual Control leads to management by everyone since problems and actions are made visible and team-based. Everyone knows when there is a problem and what to do about it


Clear guidelines for use
Management leadership during implementation and use
Prompt response
Standardized and clear responses
Address the risks
Utilize the most effective solution
Long term solution
Write in „SMART‟ format
Right level of system
Responsibility at the right level
Greater positive impact
Based on evidence
Provide enough context
Table Activity ◦ Develop Action Plan
◦ Action Plan „must haves‟:
System or process change
Describe what action is to take place
Lead person responsible to ensure action is taken
Date for action to be completed

Daily Management enables us to understand current day-to-day activities.

Kyle


A Visual Workplace where abnormalities are seen.
An environment where staff test their own ideas.
Transparency of objectives and metrics.
Managing by measures that change regularly.
What you cannot see, you cannot manage!

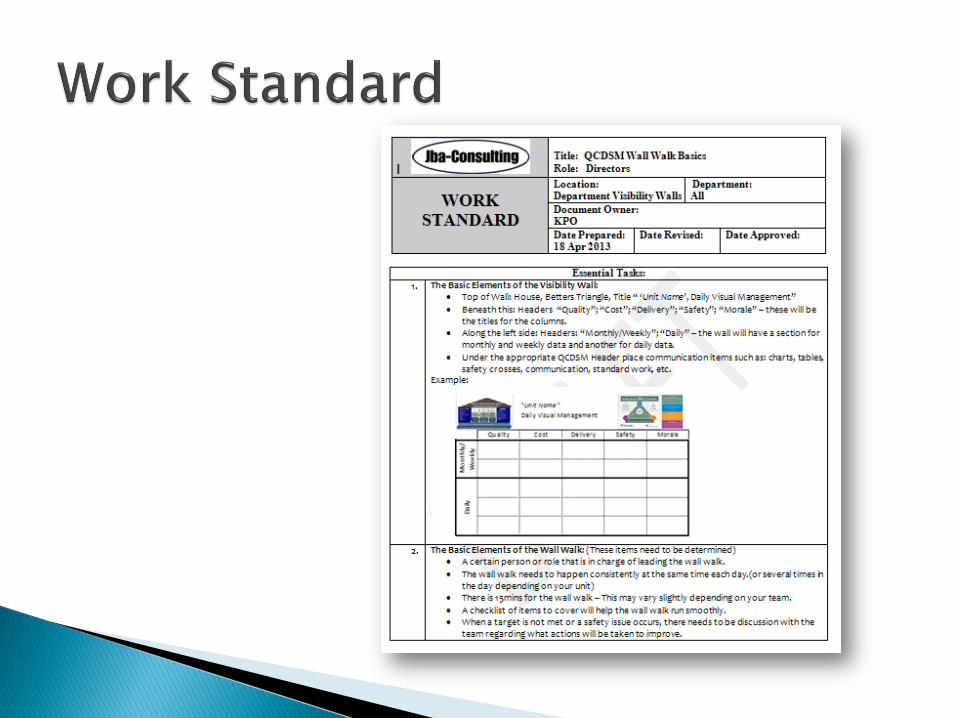


Set-up
Wall Walk
Content of Wall
Corrective Actions


QCDSM Better Care Better Teams Better Value Better Health
• Quality
• Cost
• Delivery
• Safety
• Morale
Stuart
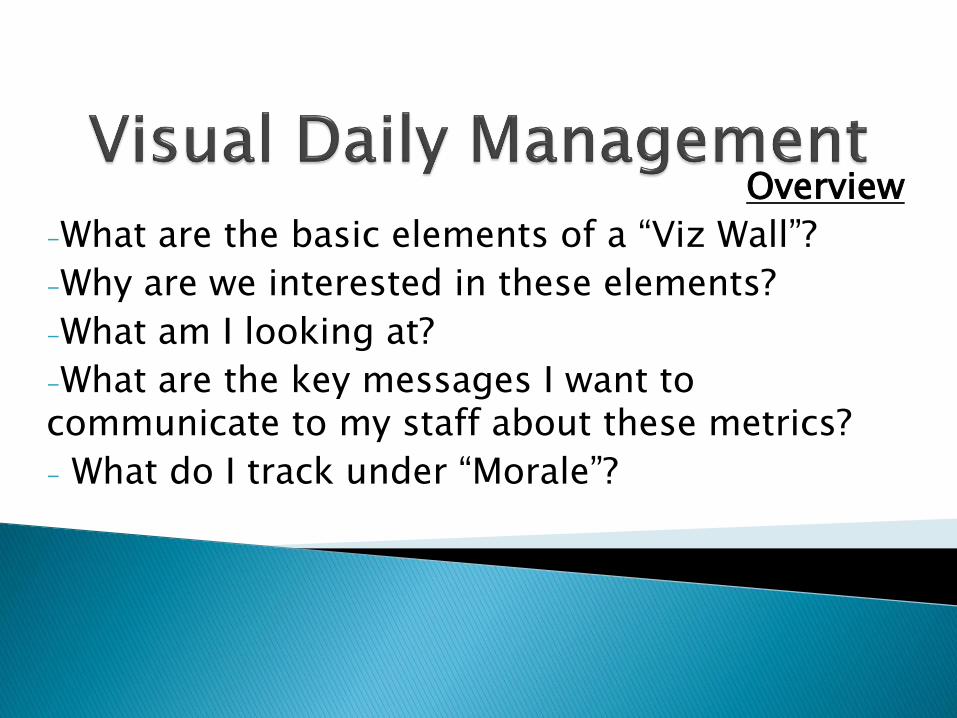
Overview
-What are the basic elements of a “Viz Wall”?
-Why are we interested in these elements?
-What am I looking at?
-What are the key messages I want to communicate to my staff about these metrics?
- What do I track under “Morale”?

Sick Time 2 methods for visualising and managing sick
time in your department
1. Sick Leave Cross
2. Weekly Departmental Averaging Report (from HR)
These tools are usually displayed under the
“COST” heading in the Q-C-D-S-M model. Now lets look at these visuals a little closer...

It is a daily management tool to be updated every day during the daily huddle.
This tool allows the manager to plan for the day and may help to predict any potential workload or safety issues and action plan accordingly.

Is a weekly management tool. Should be discussed generally with teams weekly as updated. Shows how the department is trending over a period of time. Communicate the following...
◦ Above/below regional target ◦ If below or trending downward, don‟t be afraid to celebrate
this and congratulate the team on good performance. ◦ If significantly above or regularly trending upwards,
highlight the impact that this has on operations. Highlight the cost to the department in sick time costs or
potential costs like OT replacement. Please contact the Attendance Support Consultant (Donna
Watson) for assistance with creating an attendance support strategy for your work area.

Wage Driven Premium (WDP) ◦ Overtime
◦ Call Back
Currently HR is providing one tool to assist teams in managing and identifying trends in their WDP usage. ◦ Weekly Departmental Averaging Report
This tool is also usually displayed under the “COST” heading in the Q-C-D-S-M model.


Is a weekly management tool
Should be discussed generally with teams weekly as updated.
Shows the manager how the department is trending over a period of time.
The biggest contributors to WDP are:
1. Vacation replacement
2. Sick Leave
3. General Leaves of Absence
You want to communicate to your team the following main points/concepts.
◦ We are above/below regional target
◦ If below or trending downward, don‟t be afraid to celebrate this and congratulate the team on good performance.
◦ If significantly above or regularly trending upwards, highlight the impact that this has on operations.
◦ If your department has a high instance of OT use, consider performing a regular review and evaluation of your Overtime approval criteria with your senior leader as well as ensuring that your departmental vacation is managed in such a way that the department is not placed in a potential OT liability situation.
To assist with management of OT, Labour Relations and Attendance Support are working on an Overtime Approval protocol which will be rolled out to Managers by early Fall.
Tracking incidents & occurrences related to staff safety. ◦ Patient safety occurrences should also be tracked in
appropriate areas, typically using the safety cross.
Departments should be currently using 2 tools to track and discuss workplace safety. 1. Staff Safety Cross 2. Weekly Regional Report
Staff Safety reporting should be displayed under the “SAFETY” heading of the Q-C-D-S-M model

It is a daily management tool to be updated every day during the daily huddle.
This tool allows the manager to plan for the day and may help to predict any potential workload or safety issues and action plan accordingly.
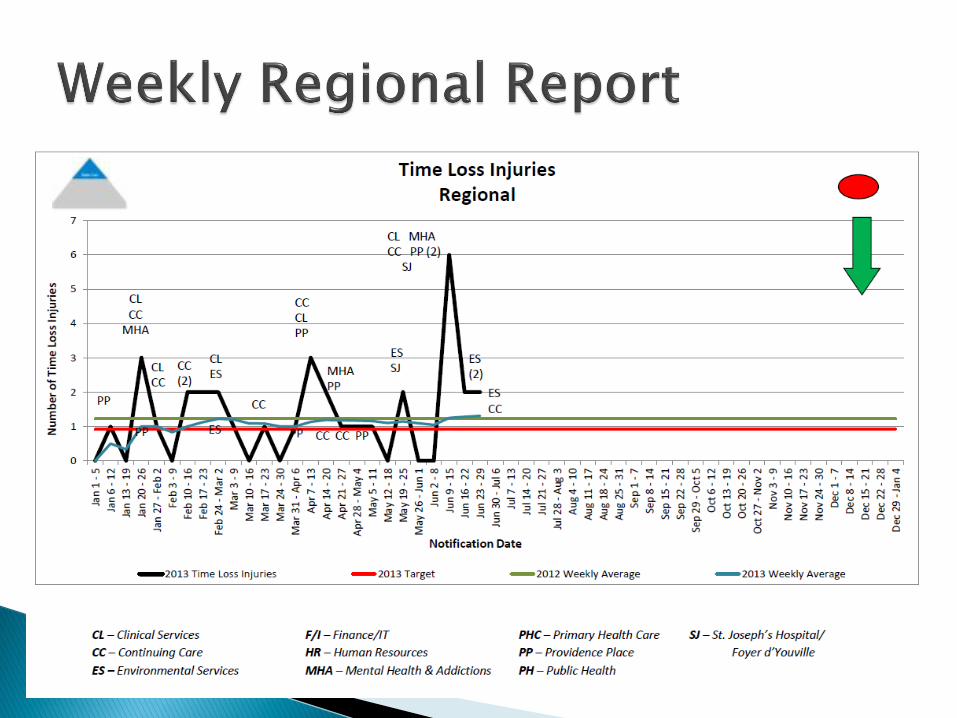

Regional staff safety metrics are provided to all departments for information purposes.
Service Line metrics will be made available shortly.
Data includes any incident for which there was a time loss. It does not take into account any subsequent WCB adjudication for or against the submitted claim.
HR is looking for ways to share learnings and action plans across the organization (“yokoten”) to enable departments with potential for similar occurrences to mitigate their risk.

This is something that a lot of departments and organizations struggle at defining and tracking.
HR is working on providing some standard data for departmental “Viz Walls” ◦ Certification completion rates (TLR, PART, HH, KB &
more) – easy to measure and to impact performance.
◦ Engagement Survey (scores and ongoing measurement)
We would recommend that most areas would also include the following concepts under Morale...

“Safety Nods” – recognition of staff who identify a potential staff or patient safety issue and potential resolution to the issue. Recognition may include a photo and brief description of the issue.
Birthday Wall – a quick and easy way to ensure that peoples birthdays are recognized and celebrated.
Customer Satisfaction scores – scores available on www.qualityinsight.ca
“Safety Talk” – start each huddle with a discussion on safety. Although managers should lead this for the most part, this responsibility can also be rotated through your staff. Staff members can include examples of staff safety observations, patient safety and even everyday observations. This is another step on the path to safety as a culture, Stop the Line and getting people used to talking about safety issues in a “don't blame/don‟t judge” atmosphere.

Staff Innovation
◦ Create a tool for receiving and evaluating staff kaizen/improvement ideas.
Thedacare uses the “PICK” matrix which focuses on categorizing staff ideas based on a “return on investment” philosophy. If something is low cost/high return then it should be pursued. High cost/low return are eliminated and anything in between requires further conversation. (see further slides)
Virginia Mason uses “ELI” (Everyday Lean Ideas) which follows a similar process of prioritization and implementation.
◦ While KPO finalizes the tool/process for managers and staff of Five Hills, please do not wait to implement your own system for capturing staff ideas and regularly discussing their value at the team huddles. Ideas should be implemented to encourage more ideas. However prior to implementing any ideas, conversations should occur with your Senior Leader.
◦ For a metric on Morale you can always start by tracking the number of improvement ideas received. The number of ideas received indicates (at a high level) an engaged, happy workforce.
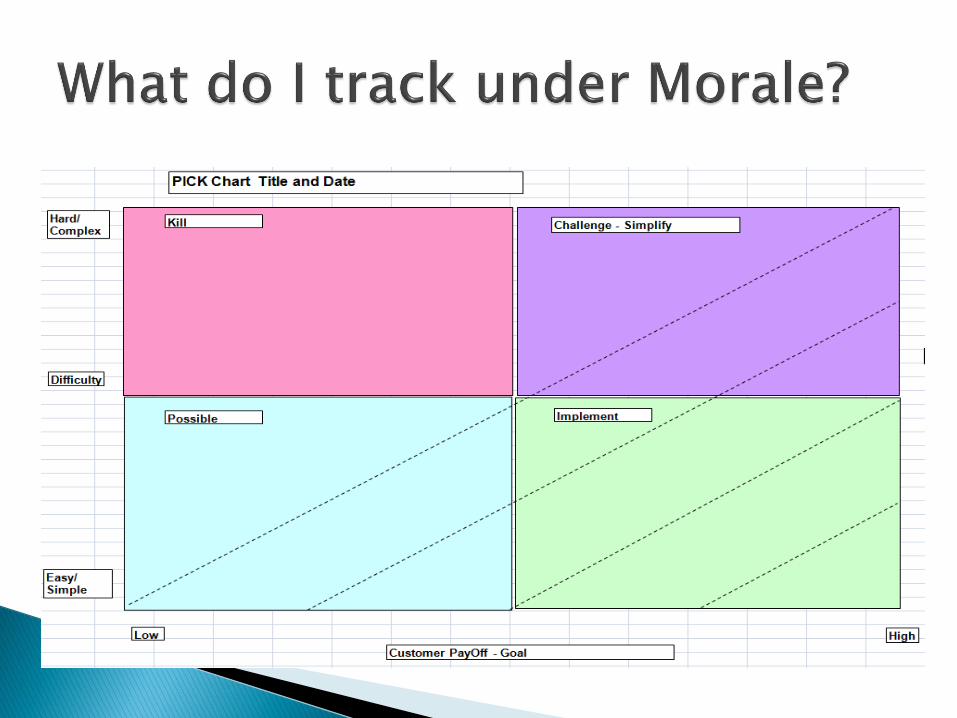

This tool, developed by Lockheed Martin, is to assist with organizing process improvement ideas and categorizing them. It is also a powerful and simple decision support tool.
It helps you quickly decide what is the most beneficial option in terms of Highest Payoff for Least Effort.
When faced with multiple improvement ideas or options it may be used to determine the most useful. There are four categories on a 2 by 2 matrix; horizontal is scale of payoff (or benefits), vertical is ease of implementation. By deciding where an idea or decision option falls on the chart four proposed project actions or decisions are provided; Possible, Implement, Challenge and Kill (thus the name PICK). ◦ Possible - Low Payoff, Easy to do (low cost) ◦ Implement - High Payoff, Easy to do (low cost) ◦ Challenge - High Payoff, Hard to do so challenge it to see if there is an easier way
e.g. break down the solution into smaller components (high cost) ◦ Kill Low Payoff, Hard to do (high cost)
The vertical axis, representing ease of implementation would typically include some assessment of cost to implement as well.
Talk to your Senior Leader about implementing this tool in your work area today.

Activity - May work in table group or as
individuals depending on your area
◦ This is your opportunity to decide on metrics for your wall.
◦ Complete the graph for the metric
◦ Complete the Checklist (in handout)


Kyle
Stuart

Standard Operations Module 11, JBA
Visual Control Module 10, JBA
Mistake Proofing Workshop, Virginia Mason Medical Center
Canadian Incident Analysis Framework, CPSI
World Class Management System Module 21, JBA