4. reactor ap1000 design control document · 2012-12-04 · 4. reactor ap1000 design control...
TRANSCRIPT

4. Reactor AP1000 Design Control Document
*NRC Staff approval is required prior to implementing a change in this information; see DCD Introduction Section 3.5. Tier 2 Material 4.3-1 Revision 19
4.3 Nuclear Design
4.3.1 Design Basis
This section describes the design bases and functional requirements used in the nuclear design of the fuel and reactivity control system and relates these design bases to the General Design Criteria (GDC). The design bases are the fundamental criteria that must be met using approved analytical techniques. [Enhancements to these techniques may be made provided that the changes are founded by NRC approved methodologies as discussed in]* WCAP-9272-P-A (Reference 1) and [WCAP-12488-P-A (Reference 2).]*
The plant conditions for design are divided into four categories:
• Condition I - Normal operation and operational transients • Condition II - Events of moderate frequency • Condition III - Infrequent incidents • Condition IV - Limiting faults
The reactor is designed so that its components meet the following performance and safety criteria:
• In general, Condition I occurrences are accommodated with margin between any plant parameter and the value of that parameter which would require either automatic or manual protective action.
• Condition II occurrences are accommodated with, at most, a shutdown of the reactor with the plant capable of returning to operation after corrective action.
• Fuel damage, that is, breach of fuel rod clad pressure boundary, is not expected during Condition I and Condition II occurrences. A very small amount of fuel damage may occur. This is within the capability of the chemical and volume control system (CVS) and is consistent with the plant design basis.
• Condition III occurrences do not cause more than a small fraction of the fuel elements in the reactor to be damaged, although sufficient fuel element damage might occur to preclude immediate resumption of operation.
• The release of radioactive material due to Condition III occurrences is not sufficient to interrupt or restrict public use of those areas beyond the exclusion area boundary.
• A Condition III occurrence does not by itself generate a Condition IV occurrence or result in a consequential loss of function of the reactor coolant or reactor containment barriers.
• Condition IV faults do not cause a release of radioactive material that results in exceeding the dose limits identified in Chapter 15. Condition IV occurrences are faults that are not expected to occur but are defined as limiting faults which are included in the design.

4. Reactor AP1000 Design Control Document
*NRC Staff approval is required prior to implementing a change in this information; see DCD Introduction Section 3.5. Tier 2 Material 4.3-2 Revision 19
The core design power distribution limits related to fuel integrity are met for Condition I occurrences through conservative design and are maintained by the action of the control system.
The requirements for Condition II occurrences are met by providing an adequate protection system which monitors reactor parameters.
The control and protection systems are described in Chapter 7.
The consequences of Condition II, III, and IV occurrences are described in Chapter 15.
4.3.1.1 Fuel Burnup
4.3.1.1.1 Basis
A limitation on initial installed excess reactivity or average discharge burnup is not required other than as is quantified in terms of other design bases, such as overall negative power reactivity feedback discussed below. [The NRC has approved, in WCAP-12488-P-A (Reference 2), maximum fuel rod average burnup of 60,000 MWD/MTU. Extended burnup to 62,000 MWD/MTU has been established in Reference 61.]*
4.3.1.1.2 Discussion
Fuel burnup is a measure of fuel depletion which represents the integrated energy output of the fuel in megawatt-days per metric ton of uranium (MWD/MTU) and is a useful means for quantifying fuel exposure criteria.
The core design lifetime, or design discharge burnup, is achieved by installing sufficient initial excess reactivity in each fuel region and by following a fuel replacement program (such as that described in subsection 4.3.2) that meets the safety-related criteria in each cycle of operation.
Initial excess reactivity installed in the fuel, although not a design basis, must be sufficient to maintain core criticality at full-power operating conditions throughout cycle life with equilibrium xenon, samarium, and other fission products present. Burnable absorbers, control rod insertion, and/or chemical shim are used to compensate for the excess reactivity. The end of design cycle life is defined to occur when the chemical shim concentration is essentially zero with control rods present to the degree necessary for operational requirements. In terms of soluble boron concentration, this corresponds to approximately 10 ppm with the control and gray rods essentially withdrawn.
4.3.1.2 Negative Reactivity Feedbacks (Reactivity Coefficients)
4.3.1.2.1 Basis
For the initial fuel cycle, the fuel temperature coefficient will be negative, and the moderator temperature coefficient of reactivity will be negative for power operating conditions, thereby providing negative reactivity feedback characteristics. The design basis meets General Design Criterion 11.

4. Reactor AP1000 Design Control Document
Tier 2 Material 4.3-3 Revision 19
4.3.1.2.2 Discussion
When compensation for a rapid increase in reactivity is considered, there are two major effects. These are the resonance absorption (Doppler) effects associated with changing fuel temperature and the neutron spectrum and reactor composition change effects resulting from changing moderator density. These basic physics characteristics are often identified by reactivity coefficients. The use of slightly enriched uranium results in a Doppler coefficient of reactivity that is negative. This coefficient provides the most rapid reactivity compensation. The initial core is also designed to have an overall negative moderator temperature coefficient of reactivity during power operation so that average coolant temperature changes or void content provides another, slower compensatory effect. For some core designs, if the compensation for excess reactivity is provided only by chemical shim, the moderator temperature coefficient could become positive. Nominal power operation is permitted only in a range of overall negative moderator temperature coefficient. The negative moderator temperature coefficient can be achieved through the use of discrete burnable absorbers (BAs) and/or integral fuel burnable absorbers and/or control rods by limiting the reactivity controlled by soluble boron.
Burnable absorber content (quantity and distribution) is not stated as a design basis. However, for some reloads, the use of burnable absorbers may be necessary for power distribution control and/or to achieve an acceptable moderator temperature coefficient throughout core life. The required burnable absorber loading is that which is required to meet design criteria.
4.3.1.3 Control of Power Distribution
4.3.1.3.1 Basis
The nuclear design basis is that, with at least a 95 percent confidence level:
• The fuel will not operate with a power distribution that would result in exceeding the departure from nucleate boiling (DNB) design basis (i.e., the departure from nucleate boiling ratio (DNBR) shall be greater than the design limit departure from nucleate boiling ratio as discussed in subsection 4.4.1) under Condition I and II occurrences, including the maximum overpower condition.
• Under abnormal conditions, including the maximum overpower condition, the peak linear heat rate (PLHR) will not cause fuel melting, as defined in subsection 4.4.1.2.
• Fuel management will be such as to produce values of fuel rod power and burnup consistent with the assumptions in the fuel rod mechanical integrity analysis of Section 4.2.
• The fuel will not be operated at Peak Linear Heat Rate (PLHR) values greater than those found to be acceptable within the body of the safety analysis under normal operating conditions, including an allowance of one percent for calorimetric error (calorimetric uncertainty calculation will be provided per subsection 15.0.15.1).
The above basis meets General Design Criterion 10.

4. Reactor AP1000 Design Control Document
Tier 2 Material 4.3-4 Revision 19
4.3.1.3.2 Discussion
Calculation of extreme power shapes which affect fuel design limits are performed with proven methods. The conditions under which limiting power shapes are assumed to occur are chosen conservatively with regard to any permissible operating state. Even though there is close agreement between calculated peak power and measurements, a nuclear uncertainty is applied (subsection 4.3.2.2.1) to calculated power distribution. Such margins are provided both for the analysis for normal operating states and for anticipated transients.
4.3.1.4 Maximum Controlled Reactivity Insertion Rate
4.3.1.4.1 Basis
The maximum reactivity insertion rate due to withdrawal of rod cluster control assemblies (RCCAs) or gray rod cluster assemblies (GRCAs) or by boron dilution is limited by plant design, hardware, and basic physics. During normal power operation, the maximum controlled reactivity insertion rate is limited. The maximum reactivity change rate for accidental withdrawal of two control banks is set such that PLHR and the departure from nucleate boiling ratio limitations are not challenged. This satisfies General Design Criterion 25.
The maximum reactivity worth of control rods and the maximum rates of reactivity insertion employing control rods are limited to preclude rupture of the coolant pressure boundary or disruption of the core internals to a degree which would impair core cooling capacity due to a rod withdrawal or an ejection accident. (See Chapter 15).
Following any Condition IV occurrence, such as rod ejection or steam line break, the reactor can be brought to the shutdown condition, and the core maintains acceptable heat transfer geometry. This satisfies General Design Criterion 28.
4.3.1.4.2 Discussion
Reactivity addition associated with an accidental withdrawal of a control bank (or banks) is limited by the maximum rod speed (or travel rate) and by the worth of the bank(s). For this reactor, the maximum control and gray rod speed is 45 inches per minute.
The reactivity change rates are conservatively calculated, assuming unfavorable axial power and xenon distributions. The typical peak xenon burnout rate is significantly lower than the maximum reactivity addition rate for normal operation and for accidental withdrawal of two banks.
4.3.1.5 Shutdown Margins
4.3.1.5.1 Basis
Minimum shutdown margin as specified in the technical specifications is required in all operating modes.

4. Reactor AP1000 Design Control Document
Tier 2 Material 4.3-5 Revision 19
In analyses involving reactor trip, the single, highest worth rod cluster control assembly is postulated to remain untripped in its full-out position (stuck rod criterion). This satisfies General Design Criterion 26.
4.3.1.5.2 Discussion
Two independent reactivity control systems are provided: control rods and soluble boron in the coolant. The control rods provide reactivity changes which compensate for the reactivity effects of the fuel and water density changes accompanying power level changes over the range from full load to no load. The control rods provide the minimum shutdown margin under Condition I occurrences and are capable of making the core subcritical rapidly enough to prevent exceeding acceptable fuel damage limits (very small number of rod failures), assuming that the highest worth control rod is stuck out upon trip.
The boron system can compensate for xenon burnout reactivity changes and maintain the reactor in the cold shutdown condition. Thus, backup and emergency shutdown provisions are provided by mechanical and chemical shim control systems which satisfy General Design Criterion 26. Reactivity changes due to fuel depletion are accommodated with the boron system.
4.3.1.5.3 Basis
When fuel assemblies are in the pressure vessel and the vessel head is not in place, keff will be maintained at or below 0.95 with control rods and soluble boron. Further, the fuel will be maintained sufficiently subcritical that removal of the rod cluster control assemblies will not result in criticality.
4.3.1.5.4 Discussion
ANSI N18.2 (Reference 3) specifies a keff not to exceed 0.95 in spent fuel storage racks and transfer equipment flooded with pure water and a keff not to exceed 0.98 in normally dry new fuel storage racks, assuming optimum moderation. No criterion is given for the refueling operation. However, a five percent margin, which is consistent with spent fuel storage and transfer and the new fuel storage, is adequate for the controlled and continuously monitored operations involved.
The boron concentration required to meet the refueling shutdown criteria is specified in the Core Operating Limits Report (COLR). Verification that these shutdown criteria are met, including uncertainties, is achieved using standard design methods. The subcriticality of the core is continuously monitored as described in the technical specifications.
4.3.1.6 Stability
4.3.1.6.1 Basis
The core will be inherently stable to power oscillations at the fundamental mode. This satisfies General Design Criterion 12.

4. Reactor AP1000 Design Control Document
Tier 2 Material 4.3-6 Revision 19
Spatial power oscillations within the core with a constant core power output, should they occur, can be reliably and readily detected and suppressed.
4.3.1.6.2 Discussion
Oscillations of the total power output of the core, from whatever cause, are readily detected by the loop temperature sensors and by the nuclear instrumentation. The core is protected by these systems; a reactor trip occurs if power increases unacceptably, thereby preserving the design margins to fuel design limits. The combined stability of the turbine, steam generator and the reactor power control systems are such that total core power oscillations are not normally possible. The redundancy of the protection circuits results in a low probability of exceeding design power levels.
The core is designed so that diametral and azimuthal oscillations due to spatial xenon effects are self-damping; no operator action or control action is required to suppress them. The stability to diametral oscillations is so great that this excitation is highly improbable. Convergent azimuthal oscillations can be excited by prohibited motion of individual control rods.
Indications of power distribution anomalies are continuously available from an online core monitoring system. The online monitoring system processes information provided by the fixed in-core detectors, in-core thermocouples, and loop temperature measurements. Radial power distributions are therefore continuously monitored, thus power oscillations are readily observable and alarmed. The ex-core long ion chambers also provide surveillance and alarms of anomalous power distributions. In proposed core designs, these horizontal plane oscillations are self-damping by virtue of reactivity feedback effects inherent to the basic core physics.
Axial xenon spatial power oscillations may occur during core life, especially late in the cycle. The online core monitoring system provides continuous surveillance of the axial power distributions. The control rod system provides both manual and automatic control systems for controlling the axial power distributions.
Confidence that fuel design limits are not exceeded is provided by reactor protection system overpower ΔT (OPΔT) and overtemperature ΔT (OTΔT) trip functions, which use the loop temperature sensors, pressurizer pressure indication, and measured axial offset as an input. Detection and suppression of xenon oscillations are discussed in subsection 4.3.2.7.
4.3.1.7 Anticipated Transients Without Scram (ATWS)
The AP1000 diverse reactor trip actuation system is independent of the reactor trip breakers used by the protection monitoring system. The diverse reactor trip reduces the probability and consequences of a postulated ATWS. The effects of anticipated transients with failure to trip are not considered in the design bases of the plant. Analysis has shown that the likelihood of such a hypothetical event is negligibly small. Furthermore, analysis of the consequences of a hypothetical failure to trip following anticipated transients has shown that no significant core damage would result, system peak pressures should be limited to acceptable values, and no failure of the reactor coolant system would result. (See WCAP-8330, Reference 5). The process used to evaluate the ATWS risk in compliance with 10 CFR 50.62 is described in Section 15.8 of this DCD.

4. Reactor AP1000 Design Control Document
Tier 2 Material 4.3-7 Revision 19
4.3.2 Description
4.3.2.1 Nuclear Design Description
The reactor core consists of a specified number of fuel rods held in bundles by spacer grids and top and bottom fittings. The fuel rods are fabricated from cylindrical tubes made of zirconium based alloy(s) containing uranium dioxide fuel pellets. The bundles, known as fuel assemblies, are arranged in a pattern which approximates a right circular cylinder.
Each fuel assembly contains a 17 x 17 rod array composed nominally of 264 fuel rods, 24 rod cluster control thimbles, and an in-core instrumentation thimble. Figure 4.2-1 shows a cross-sectional view of a 17 x 17 fuel assembly and the related rod cluster control guide thimble locations. Detailed descriptions of the AP1000 fuel assembly design features are given in Section 4.2.
For initial core loading, the fuel rods within a given assembly have the same uranium enrichment in both the radial and axial planes. Fuel assemblies of three different enrichments are used in the initial core loading to establish a favorable radial power distribution. Figure 4.3-1 shows the fuel loading pattern used in the initial cycle. Two regions consisting of the two lower enrichments are interspersed to form a checkerboard pattern in the central portion of the core. The third region is arranged around the periphery of the core and contains the highest enrichment. The enrichments for the initial cycle are shown in Table 4.3-1. Axial blankets consisting of fuel pellets of reduced enrichment placed at the ends of the enriched pellet stack have been considered and may be used in reload cycles. Axial blankets are included in the design basis to reduce neutron leakage and to improve fuel utilization.
Reload core loading patterns can employ various fuel management techniques including “low-leakage” designs where the feed fuel is interspersed checkerboard-style in the core interior and depleted fuel is placed on the periphery. Reload core designs, as well as the initial cycle design, are anticipated to operate approximately 18 months between refueling, accumulating a cycle burnup of approximately 21,000 MWD/MTU. The exact reloading pattern, the initial and final positions of assemblies, and the number of fresh assemblies and their placement are dependent on the energy requirement for the reload cycle and burnup and power histories of the previous cycles.
The core average enrichment is determined by the amount of fissionable material required to provide the desired energy requirements. The physics of the burnout process is such that operation of the reactor depletes the amount of fuel available due to the absorption of neutrons by the U-235 atoms and their subsequent fission. In addition, the fission process results in the formation of fission products, some of which readily absorb neutrons. These effects, the depletion and the buildup of fission products, are partially offset by the buildup of plutonium shown in Figure 4.3-2 for a typical 17 x 17 fuel assembly, which occurs due to the parasitic absorption of neutrons in U-238. Therefore, at the beginning of any cycle a reactivity reserve equal to the depletion of the fissionable fuel and the buildup of fission product poisons less the buildup of fissile fuel over the specified cycle life is built into the reactor. This excess reactivity is controlled by removable neutron-absorbing material in the form of boron dissolved in the primary coolant, control rod insertion, burnable absorber rods, and/or integral fuel burnable absorbers (IFBA). The stack length

4. Reactor AP1000 Design Control Document
Tier 2 Material 4.3-8 Revision 19
of the burnable absorber rods and/or integral absorber bearing fuel may vary for different core designs, with the optimum length determined on a design specific basis. Figure 4.3-3 is a plot of the initial core soluble boron concentration versus core depletion.
The concentration of the soluble neutron absorber is varied to compensate for reactivity changes due to fuel burnup, fission product poisoning including xenon and samarium, burnable absorber depletion, and the cold-to-operating moderator temperature change. Throughout the operating range, the CVS is designed to provide changes in reactor coolant system (RCS) boron concentration to compensate for the reactivity effects of fuel depletion, peak xenon burnout and decay, and cold shutdown boration requirements.
Burnable absorbers are strategically located to provide a favorable radial power distribution and provide for negative reactivity feedback. Figures 4.3-4a and 4.3-4b show the burnable absorber distributions within a fuel assembly for the several patterns used in a 17 x 17 array. The initial core burnable absorber loading pattern is shown in Figure 4.3-5.
Tables 4.3-1 through 4.3-3 contain summaries of reactor core design parameters including reactivity coefficients, delayed neutron fraction, and neutron lifetimes. Sufficient information is included to permit an independent calculation of the nuclear performance characteristics of the core.
4.3.2.2 Power Distribution
The accuracy of power distribution calculations has been confirmed through approximately 1000 flux maps under conditions very similar to those expected. Details of this confirmation are given in WCAP-7308-L-P-A (Reference 7) and in subsection 4.3.2.2.7.
4.3.2.2.1 Definitions
Relative power distributions within the reactor are quantified in terms of hot channel factors. These hot channel factors are normalized ratios of maximal absolute power generation rates and are a measure of the peak pellet power within the reactor core relative to the average pellet (FQ) and the energy produced in a coolant channel relative to the core average channel (FΔH). Absolute power generation rates are expressed in terms of quantities related to the nuclear or thermal design; more specifically, volumetric power density (qvol) is the thermal power produced per unit volume of the core (kW/liter).
Linear heat rate (LHR) is the thermal power produced per unit length of active fuel (kW/ft). Since fuel assembly geometry is standardized, LHR is the unit of absolute power density most commonly used. For practical purposes, LHR differs from qvol by a constant factor which includes geometry effects and the heat flux deposition fraction. The peak linear heat rate (PLHR) is defined as the maximum linear heat rate occurring throughout the reactor. PLHR directly impacts fuel temperatures and decay power levels thus being a significant safety analysis parameter.
Average linear heat rate (ALHR) is the total thermal power produced in the fuel rods expressed as heat flux divided by the total active fuel length of the rods in the core.

4. Reactor AP1000 Design Control Document
Tier 2 Material 4.3-9 Revision 19
Local heat flux is the heat flux at the surface of the cladding (Btu/hr-ft2). For nominal rod parameters, this differs from linear heat rate by a constant factor.
Rod power is the total power generated in one rod (kW).
Average rod power is the total thermal power produced in the fuel rods divided by the number of fuel rods (assuming the rods have equal length).
The hot channel factors used in the discussion of power distributions in this section are defined as follows:
FQ , heat flux hot channel factor, is defined as the maximum local heat flux on the surface of a
fuel rod divided by the average fuel rod heat flux, allowing for manufacturing tolerances on fuel pellets and rods.
FNQ , nuclear heat flux hot channel factor, is defined as the maximum local fuel rod linear heat
rate divided by the average fuel rod linear heat rate, assuming nominal fuel pellet and rod parameters.
FEQ , engineering heat flux hot channel factor, is the allowance on heat flux required for
manufacturing tolerances. The engineering factor allows for local variations in enrichment, pellet density and diameter, burnable absorber content, surface area of the fuel rod, and eccentricity of the gap between pellet and clad. Combined statistically, the net effect is a factor of 1.03 to be applied to the fuel rod surface heat flux.
FNH Δ , nuclear enthalpy rise hot channel factor, is defined as the ratio of the maximum
integrated rod power within the core to the average rod power.
Manufacturing tolerances, hot channel power distribution, and surrounding channel power distributions are treated explicitly in the calculation of the departure from nucleate boiling ratio described in Section 4.4.
It is convenient for the purposes of discussion to define subfactors of FQ . However, design limits
are set in terms of the total peaking factor.
FQ = total peaking factor or heat flux hot channel factor = ALHR
PLHR
Without densification effects:
F x F x F x F = F x F = F EQ
NU
NZ
NXY
EQ
NQQ

4. Reactor AP1000 Design Control Document
Tier 2 Material 4.3-10 Revision 19
where FNQ and FE
Q are defined above and:
FN U = factor for calculational uncertainty, assumed to be 1.05.
FNXY = ratio of peak power density to average power density in the horizontal plane of peak
local power.
FN Z = ratio of the power per unit core height in the horizontal plane of peak local power to the
average value of power per unit core height. If the plane of peak local power coincides with the plane of maximum power per unit core height, then FN
Z is the core average axial peaking factor.
4.3.2.2.2 Radial Power Distributions
The power shape in horizontal sections of the core at full power is a function of the fuel assembly and burnable absorber loading patterns, the control rod pattern, and the fuel burnup distribution. Thus, at any time in the cycle, a horizontal section of the core can be characterized as unrodded or with control rods. These two situations combined with burnup effects determine the radial power shapes which can exist in the core at full power. Typical first cycle values of FN
HΔ , the nuclear enthalpy rise hot channel factors from beginning of life (BOL) to end of life (EOL) are given in Table 4.3-2. The effects on radial power shapes of power level, xenon, samarium, and moderator density effects are also considered, but these are quite small. The effect of nonuniform flow distribution is negligible. While radial power distributions in various planes of the core are often illustrated, since the moderator density is directly proportional to enthalpy, the core radial enthalpy rise distribution, as determined by the integral of power up each channel, is of greater interest. Figures 4.3-6 through 4.3-11 show typical normalized power density distributions for one-eighth of the core for representative operating conditions. These conditions are as follows:
• Hot full power (HFP) near beginning of life, unrodded, no xenon • Hot full power near beginning of life, unrodded, equilibrium xenon • Hot full power near beginning of life, gray bank MA+MB in, equilibrium xenon • Hot full power near middle of life (MOL), unrodded equilibrium xenon • Hot full power near end of life, unrodded, equilibrium xenon • Hot full power near end of life, gray bank MA+MB in, equilibrium xenon
Since the position of the hot channel varies from time to time, a single-reference radial design power distribution is selected for departure from nucleate boiling calculations. This reference power distribution is chosen conservatively to concentrate power in one area of the core, minimizing the benefits of flow redistribution. Assembly powers are normalized to core average power. The radial power distribution within a fuel rod and its variation with burnup as utilized in thermal calculations and fuel rod design are discussed in Section 4.4.

4. Reactor AP1000 Design Control Document
Tier 2 Material 4.3-11 Revision 19
4.3.2.2.3 Assembly Power Distributions
For the purpose of illustration, typical rodwise power distributions from the beginning of life and end of life conditions corresponding to Figures 4.3-7 and 4.3-10, respectively, are given for the same assembly in Figures 4.3-12 and 4.3-13, respectively.
Since the detailed power distribution surrounding the hot channel varies from time to time, a conservatively flat radial assembly power distribution is assumed in the departure from nucleate boiling analysis, described in Section 4.4, with the rod of maximum integrated power artificially raised to the design value of FN
HΔ . Care is taken in the nuclear design of the fuel cycles and operating conditions to confirm that a flatter assembly power distribution does not occur with limiting values of FN
HΔ .
4.3.2.2.4 Axial Power Distributions
The distribution of power in the axial or vertical direction is largely under the control of the operator through either the manual operation of the control rods or the automatic motion of control rods in conjunction with manual operation of the chemical and volume control system. The automated mode of operation is referred to as mechanical shim (MSHIM) and is discussed in subsection 4.3.2.4.16. The rod control system automatically modulates the insertion of the axial offset (AO) control bank controlling the axial power distribution simultaneous with the MSHIM gray and control rod banks to maintain programmed coolant temperature. Operation of the chemical and volume control system is initiated manually by the operator to compensate for fuel burnup and maintain the desired MSHIM bank insertion. Nuclear effects which cause variations in the axial power shape include moderator density, Doppler effect on resonance absorption, spatial distribution of xenon, burnup, and axial distribution of fuel enrichment and burnable absorber. Automatically controlled variations in total power output and rod motion are also important in determining the axial power shape at any time.
The online core monitoring system provides the operator with detailed power distribution information in both the radial and axial sense continuously using signals from the fixed in-core detectors. Signals are also available to the operator from the ex-core ion chambers, which are long ion chambers outside the reactor vessel running parallel to the axis of the core. Separate signals are taken from the each ion chamber. The ion chamber signals are processed and calibrated against in-core measurements such that an indication of the power in the top of the core less the power in the bottom of the core is derived. The calibrated difference in power between the core top and bottom halves, called the flux difference ( )IΔ , is derived for each of the four channels of ex-core detectors and is displayed on the control panel. The principal use of the flux difference is to provide the shape penalty function to the OTΔT DNB protection and the OPΔT overpower protection.
4.3.2.2.5 Local Power Peaking
Fuel densification occurred early in the evolution of pressurized water reactor fuel manufacture under irradiation in several operating reactors. This caused the fuel pellets to shrink both axially and radially. The pellet shrinkage combined with random hang-up of fuel pellets can result in gaps in the fuel column when the pellets below the hung-up pellet settle in the fuel rod. The gaps vary
4. Reactor AP1000 Design Control Document
Tier 2 Material 4.3-12 Revision 19
in length and location in the fuel rod. Because of decreased neutron absorption in the vicinity of the gap, power peaking occurs in the adjacent fuel rods, resulting in an increased power peaking factor. A quantitative measure of this local peaking is given by the power spike factor S(Z), where Z is the axial location in the core. The power spike factor S(z) is discussed in References 8, 9, and 10.
Modern PWR fuel manufacturing practices have essentially eliminated significant fuel densification impacts on reactor design and operation. It has since been concluded and accepted that a densification power spike factor of 1.0 is appropriate for Westinghouse fuel as described in WCAP-13589-A (Reference 59).
4.3.2.2.6 Limiting Power Distributions
According to the ANSI classification of plant conditions (Chapter 15), Condition I occurrences are those expected frequently or regularly in the course of power operation, maintenance, or maneuvering of the plant. As such, Condition I occurrences are accommodated with margin between any plant parameter and the value of that parameter which would require either automatic or manual protective action. Condition I occurrences are considered from the point of view of affecting the consequences of fault conditions (Conditions II, III, and IV). Analysis of each fault condition described is based on a conservative set of corresponding initial conditions.
The list of steady-state and shutdown conditions, permissible deviations, and operational transients is given in Chapter 15. Implicit in the definition of normal operation is proper and timely action by the reactor operator; that is, the operator follows recommended operating procedures for maintaining appropriate power distributions and takes any necessary remedial actions when alerted to do so by the plant instrumentation.
The online monitoring system evaluates the consequences of limiting power distributions based upon the conditions prevalent in the reactor at the current time. Operating space evaluations performed by the online monitoring system include the most limiting power distributions that can be generated by inappropriate operator or control system actions given the current core power level, xenon distribution, MSHIM or AO bank insertion and core burnup. Thus, as stated, the worst or limiting power distribution which can occur during normal operation is considered as the starting point for analysis of Conditions II, III, and IV occurrences.
Improper procedural actions or errors by the operator are assumed in the design as occurrences of moderate frequency (Condition II). Some of the consequences which might result are discussed in Chapter 15. Therefore, the limiting power shapes which result from such Condition II occurrences are those power distributions which deviate from the normal operating condition within the allowable operating space as defined in the core operating limits; e.g., due to lack of proper action by the operator during a xenon transient following a change in power level brought about by control rod motion. Power distributions which fall in this category are used for determination of the reactor protection system setpoints to maintain margin to overpower or departure from nucleate boiling limits.
The means for maintaining power distributions within the required absolute power generation limits are described in the technical specifications. The online core monitoring system provides

4. Reactor AP1000 Design Control Document
Tier 2 Material 4.3-13 Revision 19
the operator with the current allowable operating space, detailed current power distribution information, thermal margin assessment and operational recommendations to manage and maintain required thermal margins. As such, the online monitoring system provides the primary means of managing and maintaining required operating thermal margins during normal operation.
In the unlikely event that the online monitoring system is out of service, power distribution controls based on bounding, precalculated analysis are also provided to the operator such that the online monitoring system is not a required element for short term reactor operation. Limits are placed on the axial flux difference so that the heat flux hot channel factor FQ is maintained within acceptable limits. A discussion of precalculated power distribution control in Westinghouse pressurized water reactors (PWRs) is included in WCAP-7811 (Reference 11). Detailed background information on the design constraints on local power density in a Westinghouse PWR, on the defined operating procedures, and on the measures taken to preclude exceeding design limits is presented in the Westinghouse topical report on power distribution control and load following procedures WCAP-8385 (Reference 12). The following paragraphs summarize these reports and describe the calculations used to establish the upper bound on peaking factors.
The calculations used to establish the upper bound on peaking factors, FQ and FNHΔ , include the
nuclear effects which influence the radial and axial power distributions throughout core life for various modes of operation, including load follow, reduced power operation, and axial xenon transients.
Power distributions are calculated for the full-power condition. Fuel and moderator temperature feedback effects are included within these calculations in each spatial dimension. The steady-state nuclear design calculations are done for normal flow with the same mass flow in each channel and flow redistribution effects neglected. The effect of flow redistribution is calculated explicitly where it is important in the departure from nucleate boiling analysis of accidents. The effect of xenon on radial power distribution is small (compare Figures 4.3-6 and 4.3-7) but is included as part of the normal design process.
The core axial profile can experience significant changes, which can occur rapidly as a result of rod motion and load changes and more slowly due to xenon distribution. For the study of points of closest approach to thermal margin limits, several thousand cases are examined. Since the properties of the nuclear design dictate what axial shapes can occur, boundaries on the limits of interest can be set in terms of the parameters which are readily observed on the plant. Specifically, the nuclear design parameters significant to the axial power distribution analysis are as follows:
• Core power level • Core height • Coolant temperature and flow • Coolant temperature program as a function of reactor power • Fuel cycle lifetimes • Rod bank worth • Rod bank overlaps

4. Reactor AP1000 Design Control Document
Tier 2 Material 4.3-14 Revision 19
Normal operation of the plant assumes compliance with the following conditions:
• Control rods in a single bank move together with no individual rod insertion differing from the bank demand position by more than the number of steps identified in the technical specifications.
• Control banks are sequenced with overlapping banks.
• The control bank insertion limits are not violated.
• Axial power distribution control procedures, which are given in terms of flux difference control and control bank position, are observed.
The axial power distribution procedures referred to above are part of the required operating procedures followed in normal operation with the online monitoring system out of service. In service, the online core monitoring system provides continuous indication of power distribution, shutdown margin, and margin to design limits.
The relaxed axial offset control (RAOC) procedures described in WCAP-10216-P-A (Reference 13) were developed to provide wide control band widths and consequently, more operating flexibility. These wide operating limits, particularly at lower power levels, increase plant availability by allowing quicker plant startup and increased maneuvering flexibility without trip. This procedure has been modified to accommodate AP1000 MSHIM operation. It is applied to analysis of axial power distributions under MSHIM control for the purpose of defining the allowed normal operating space such that Condition I thermal margin limits are maintained and Condition II occurrences are adequately protected by the reactor protection system when the online monitoring system is out of service.
The purpose of this analysis is to find the widest permissible ΔI versus power operating space by analyzing a wide range of achievable xenon distributions, MSHIM/AO bank insertion, and power level.
The bounding analyses performed off line in anticipation of the online monitoring system being out of service is similar to that based on the relaxed axial offset control analysis, which uses a xenon reconstruction model described in WCAP-10216-P-A (Reference 13). This is a practical method which is used to define the power operating space allowed with AP1000 MSHIM operation. Each resulting power shape is analyzed to determine if loss-of-coolant accident constraints are met or exceeded.
The online monitoring system evaluates the effects of radial xenon distribution changes due to operational parameter changes continuously and therefore eliminates the need for overly conservative bounding evaluations when the online monitoring system is available. A detailed discussion of this effect may be found in WCAP-8385 (Reference 12). The calculated values have been increased by a factor of 1.05 for method uncertainty and a factor of 1.03 for the engineering factor FE
Q .

4. Reactor AP1000 Design Control Document
Tier 2 Material 4.3-15 Revision 19
The envelope drawn in Figure 4.3-14 represents an upper bound envelope on local power density versus elevation in the core. This envelope is a conservative representation of the bounding values of local power density.
The online monitoring system measures the core condition continuously and evaluates the thermal margin condition directly in terms of peak linear heat rate and margin to departure from nucleate boiling limitations directly.
Allowing for fuel densification effects, the average linear power at 3400 MW is 5.72 kW/ft. From Figure 4.3-14, the conservative upper bound value of normalized local power density, including uncertainty allowances, is 2.60 corresponding to a peak linear heat rate of 15.0 kW/ft at each core elevation at 101 percent power.
To determine reactor protection system setpoints with respect to power distributions, three categories of events are considered: rod control equipment malfunctions and operator errors of commission or omission. In evaluating these three categories of events, the core is assumed to be operating within the four constraints described above.
The first category comprises uncontrolled rod withdrawal (with rods moving in the normal bank sequence) for both AO and MSHIM banks. Also included are motions of the AO and MSHIM banks below their insertion limits, which could be caused, for example, by uncontrolled dilution or primary coolant cooldown. Power distributions are calculated throughout these occurrences, assuming short-term corrective action; that is, no transient xenon effects are considered to result from the malfunction. The event is assumed to occur from typical normal operating situations, which include normal xenon transients. It is further assumed in determining the power distributions that total core power level would be limited by reactor trip to below the overpower protection setpoint of nominally 118 percent rated thermal power. Since the study is to determine protection limits with respect to power and axial offset, no credit is taken for OTΔT or OPΔT trip setpoint reduction due to flux difference. The peak power density which can occur in such events, assuming reactor trip at or below 118 percent, is less than that required for fuel centerline melt, including uncertainties and densification effects.
The second category assumes that the operator mispositions the AO and/or MSHIM rod banks in violation of the insertion limits and creates short-term conditions not included in normal operating conditions.
The third category assumes that the operator fails to take action to correct a power distribution limit violation (such as boration/dilution transient) assuming automatic operation of the rod control system which will maintain constant reactor power.
For each of the above categories, the trip setpoints are designed so as not to exceed fuel centerline melt criteria as well as fuel mechanical design criteria.
The appropriate hot channel factors QF and NHFΔ for peak local power density and for DNB
analysis at full power are based on analyses of possible operating power shapes and are addressed in the technical specifications.

4. Reactor AP1000 Design Control Document
Tier 2 Material 4.3-16 Revision 19
The maximum allowable QF can be increased with decreasing power, as shown in the technical
specifications. Increasing NHFΔ with decreasing power is permitted by the DNB protection
setpoints and allows radial power shape changes with rod insertion to the insertion limits, as
described in subsection 4.4.4.3. The allowance for increased NHFΔ permitted is addressed in the
technical specifications.
This becomes a design basis criterion which is used for establishing acceptable control rod patterns and control bank sequencing. Likewise, fuel loading patterns for each cycle are selected with consideration of this design criterion. The worst values of FN
HΔ for possible rod configurations occurring in normal operation are used in verifying that this criterion is met. The worst values generally occur when the rods are assumed to be at their insertion limits. Operation with rod positions above the allowed rod insertion limits provides increased margin to the FN
HΔ criterion. As discussed in Section 3.2 of WCAP-7912-P-A (Reference 14), it has been determined that the technical specifications limits are met, provided the above conditions are observed. These limits are taken as input to the thermal-hydraulic design basis, as described in subsection 4.4.4.3.1.
When a situation is possible in normal operation which could result in local power densities in excess of those assumed as the precondition for a subsequent hypothetical accident, but which would not itself cause fuel failure, administrative controls and alarms are provided for returning the core to a safe condition. These alarms are described in Chapter 7.
The independence of the various individual uncertainties constituting the uncertainty factor on FQ
enables the uncertainty ( FUQ ) to be calculated by statistically combining the individual
uncertainties on the limiting rod. The standard deviation of the resultant distribution of
FUQ is determined by taking the square root of the sum of the variances of each of the contributing
distributions WCAP-7308-L-P-A (Reference 7). The values for FEQ and FN
U are 1.03 and 1.05,
respectively. The value for the rod bow factor, FBQ , is 1.056, which accounts for the maximum FQ
penalty as a function of burnup due to rod bow effects.
4.3.2.2.7 Experimental Verification of Power Distribution Analysis
This subject is discussed in WCAP-7308-L-P-A (Reference 7) and WCAP-12472-P-A (Reference 4). A summary of these reports and the extension to include the fixed in-core instrumentation system is given below. Power distribution related measurements are incorporated into the evaluation of calculated power distribution information using the in-core instrumentation processing algorithms contained within the online monitoring system. The processing algorithms contained within the online monitoring system are functionally identical to those historically used for the evaluation of power distribution measurements in Westinghouse PWRs. Advances in technology allow a complete functional integration of reaction rate measurement algorithms and the expected reaction rate predictive capability within the same software package. The predictive software integrated within the online monitoring system supplies accurate, detailed information of

4. Reactor AP1000 Design Control Document
Tier 2 Material 4.3-17 Revision 19
current reactor conditions. The historical algorithms are described in detail in WCAP-12472-P-A (Reference 4).
The measured versus calculational comparison is performed continuously by the online monitoring system throughout the core life. The online monitoring system operability requirements are specified in the technical specifications.
In a measurement of the reactor power distribution and the associated thermal margin limiting parameters, with the in-core instrumentation system described in subsections 7.7.1 and 4.4.6, the following uncertainties must be considered:
A. Reproducibility of the measured signal
B. Errors in the calculated relationship between detector current and local power generation within the fuel bundle
C. Errors in the detector current associated with the depletion of the emitter material, manufacturing tolerances and measured detector depletion
D. Errors due to the inference of power generation some distance from the measurement thimble
The appropriate allowance for category A has been accounted for through the imposition of strict manufacturing tolerances for the individual detectors. This approach is accepted industry practice and has been used in PWRs with fixed in-core instrumentation worldwide. Errors in category B above are quantified by calculation and evaluation of critical experiment data on arrays of rods with simulated guide thimbles, control rods, burnable absorbers, etc. These critical experiments provide the quantification of errors of categories A and D above. Errors in category C have been quantified through direct experimental measurement of the depletion characteristics of the detectors being used including the precision of the in-core instrumentation systems measurement of the current detector depletion. The description of the experimental measurement of detector depletion can be found in EPRI-NP-3814 (Reference 16).
WCAP-7308-L-P-A (Reference 7) describes critical experiments performed at the Westinghouse Reactor Evaluation Center and measurements taken on two Westinghouse plants with movable fission chamber in-core instrumentation systems. The measurement aspects of the movable fission chamber share the previous uncertainty categories less category C which is independent of the other sources of uncertainty. WCAP-7308-L-P-A (Reference 7) concludes that the uncertainty associated with peak linear heat rate (FQ*P) is less than five percent at the 95 percent confidence level with only five percent of the measurements greater than the inferred value.
In comparing measured power distributions (or detector currents) with calculations for the same operating conditions, it is not possible to isolate the detector reproducibility. Thus, a comparison between measured and predicted power distributions includes some measurement error. Such a comparison is given in Figure 4.3-15 for one of the maps used in WCAP-7308-L-P-A (Reference 7). Since the first publication of WCAP-7308-L-P-A, hundreds of measurements have been taken on reactors all over the world. These results confirm the adequacy of the five percent uncertainty allowance on the calculated peak linear heat rate (ALHR*FQ*P).
4. Reactor AP1000 Design Control Document
Tier 2 Material 4.3-18 Revision 19
A similar analysis for the uncertainty in hot rod integrated power FΔH*P measurements results in an allowance of four percent at the equivalent of a 95 percent confidence level.
A measurement in the fourth cycle of a 157-assembly, 12-foot core is compared with a simplified one-dimensional core average axial calculation in Figure 4.3-16. This calculation does not give explicit representation to the fuel grids.
The accumulated data on power distributions in actual operation are basically of three types:
• Much of the data is obtained in steady-state operation at constant power in the normal operating configuration.
• Data with unusual values of axial offset are obtained as part of the ex-core detector calibration exercise performed monthly.
• Special tests have been performed in load follow and other transient xenon conditions which have yielded useful information on power distributions.
These data are presented in detail in WCAP-7912-P-A (Reference 14). Figure 4.3-17 contains a summary of measured values of FQ as a function of axial offset for five plants from that report.
4.3.2.2.8 Testing
A series of physics tests are planned to be performed on the first core. These tests and the criteria for satisfactory results are described in Chapter 14. Since not all limiting situations can be created at beginning of life, the main purpose of the tests is to provide a check on the calculational methods used in the predictions for the conditions of the test. Tests performed at the beginning of each reload cycle are limited to verification of the selected safety-related parameters of the reload design.
4.3.2.2.9 Monitoring Instrumentation
The adequacy of instrument numbers, spatial deployment, required correlations between readings and peaking factors, calibration, and errors are described in WCAP-12472-P (Reference 4). The relevant conclusions are summarized in subsection 4.3.2.2.7 and subsection 4.4.6.
Provided the limitations given in subsection 4.3.2.2.6 on rod insertion and flux difference are observed, the in-core and ex-core detector systems provide adequate monitoring of power distributions when the online monitoring system is out of service. Further details of specific limits on the observed rod positions and flux difference are given in the technical specifications, together with a discussion of their bases.
Limits for alarms and reactor trip are given in the technical specifications. Descriptions of the systems provided are given in Section 7.7.

4. Reactor AP1000 Design Control Document
Tier 2 Material 4.3-19 Revision 19
4.3.2.3 Reactivity Coefficients
The kinetic characteristics of the reactor core determine the response of the core to changing plant conditions or to operator adjustments made during normal operation, as well as the core response during abnormal or accidental transients. These kinetic characteristics are quantified in reactivity coefficients. The reactivity coefficients reflect the changes in the neutron multiplication due to varying plant conditions, such as thermal power, moderator and fuel temperatures, coolant pressure, or void conditions, although the latter are relatively unimportant. Since reactivity coefficients change during the life of the core, ranges of coefficients are employed in transient analysis to determine the response of the plant throughout life. The results of such simulations and the reactivity coefficients used are presented in Chapter 15.
The reactivity coefficients are calculated with approved nuclear methods. The effect of radial and axial power distribution on core average reactivity coefficients is implicit in those calculations and is not significant under normal operating conditions. For example, a skewed xenon distribution which results in changing axial offset by five percent typically changes the moderator and Doppler temperature coefficients by less than 0.01 pcm/°F. An artificially skewed xenon distribution which results in changing the radial FN
HΔ by three percent typically changes the moderator and Doppler temperature coefficients by less than 0.03 pcm/°F and 0.001 pcm/°F, respectively. The spatial effects are accentuated in some transient conditions, for example, in postulated rupture of the main steam line and rupture of a rod cluster control assembly mechanism housing described in subsections 15.1.5 and 15.4.8, and are included in these analyses.
The analytical methods and calculational models used in calculating the reactivity coefficients are given in subsection 4.3.3. These models have been confirmed through extensive qualification efforts performed for core and lattice designs.
Quantitative information for calculated reactivity coefficients including fuel-Doppler coefficient, moderator coefficients (density, temperature, pressure, and void), and power coefficient, is given in the following sections.
4.3.2.3.1 Fuel Temperature (Doppler) Coefficient
The fuel temperature (Doppler) coefficient is defined as the change in reactivity per degree change in effective fuel temperature and is primarily a measure of the Doppler broadening of U-238 and Pu-240 resonance absorption peaks. Doppler broadening of other isotopes is also considered, but their contribution to the Doppler effect is small. An increase in fuel temperature increases the effective resonance absorption cross sections of the fuel and produces a corresponding reduction in reactivity.
The fuel temperature coefficient is calculated using approved nuclear methods. Moderator temperature is held constant, and the power level is varied. Spatial variation of fuel temperature is taken into account by calculating the effective fuel temperature as a function of power density, as discussed in subsection 4.3.3.1.
A typical Doppler temperature coefficient is shown in Figure 4.3-18 as a function of the effective fuel temperature (at beginning of life and end of life conditions). The effective fuel temperature is

4. Reactor AP1000 Design Control Document
Tier 2 Material 4.3-20 Revision 19
lower than the volume-averaged fuel temperature, since the neutron flux distribution is non-uniform through the pellet and gives preferential weight to the surface temperature. A typical Doppler-only contribution to the power coefficient, defined later, is shown in Figure 4.3-19 as a function of relative core power. The integral of the differential curve in Figure 4.3-19 is the Doppler contribution to the power defect and is shown in Figure 4.3-20 as a function of relative power. The Doppler temperature coefficient becomes more negative as a function of life as the Pu-240 content increases, thus increasing the Pu-240 resonance absorption. The upper and lower limits of Doppler coefficient used in accident analyses are given in Chapter 15.
4.3.2.3.2 Moderator Coefficients
The moderator coefficient is a measure of the change in reactivity due to a change in specific coolant parameters, such as density/temperature, pressure, or void. The coefficients obtained are moderator density/temperature, pressure, and void coefficients.
4.3.2.3.2.1 Moderator Density and Temperature Coefficients
The moderator temperature (density) coefficient is defined as the change in reactivity per degree change in the moderator temperature. Generally, the effects of the changes in moderator density and the temperature are considered together.
The soluble boron used in the reactor as a means of reactivity control also has an effect on the moderator density coefficient, since the soluble boron density and the water density are decreased when the coolant temperature rises. A decrease in the soluble boron density introduces a positive component in the moderator coefficient. If the concentration of soluble boron is large enough, the net value of the coefficient may be positive.
The initial core hot boron concentration is sufficiently low that the moderator temperature coefficient is negative at operating temperatures with the burnable absorber loading specified. Discrete or integral fuel burnable absorbers can be used in reload cores to confirm the moderator temperature coefficient is negative over the range of power operation. The effect of control rods is to make the moderator coefficient more negative, since the thermal neutron mean free path, and hence the volume affected by the control rods, increase with an increase in temperature.
With burnup, the moderator coefficient becomes more negative, primarily as a result of boric acid dilution, but also to a significant extent from the effects of the buildup of plutonium and fission products.
The moderator coefficient is calculated for a range of plant conditions by performing two group two- or three-dimensional calculations, in which the moderator temperature is varied by about ±5°F about each of the mean temperatures, resulting in density changes consistent with the temperature change. The moderator temperature coefficient is shown as a function of core temperature and boron concentration for the core in Figures 4.3-21 through 4.3-23. The temperature range covered is from cold, about 70°F, to about 550°F. The contribution due to Doppler coefficient (because of change in moderator temperature) has been subtracted from these results. Figure 4.3-24 shows the unrodded hot, full-power moderator temperature coefficient plotted as a function of burnup for the initial cycle. The temperature coefficient corresponds to the unrodded critical boron concentration present at hot full power operating conditions.

4. Reactor AP1000 Design Control Document
Tier 2 Material 4.3-21 Revision 19
The moderator coefficients presented here are calculated to describe the core behavior in normal and accident situations when the moderator temperature changes can be considered to affect the entire core.
4.3.2.3.2.2 Moderator Pressure Coefficient
The moderator pressure coefficient relates the change in moderator density, resulting from a reactor coolant pressure change, to the corresponding effect on neutron production. This coefficient is of much less significance than the moderator temperature coefficient. A change of 50 psi in pressure has approximately the same effect on reactivity as a one half degree change in moderator temperature. This coefficient can be determined from the moderator temperature coefficient by relating change in pressure to the corresponding change in density. The typical moderator pressure coefficient may be negative over a portion of the moderator temperature range at beginning of life (BOL) (-0.004 pcm/psi) but is always positive at operating conditions and becomes more positive during life (+0.3 pcm/psi, at end of life).
4.3.2.3.2 Moderator Void Coefficient
The moderator void coefficient relates the change in neutron multiplication to the presence of voids in the moderator. In a PWR, this coefficient is not very significant because of the low void content in the coolant. The core void content is less than one-half of one percent and is due to local or statistical boiling. The typical void coefficient varies from 50 pcm/percent void at BOL and at low temperatures to minus 250 pcm/percent void at EOL and at operating temperatures. The void coefficient at operating temperature becomes more negative with fuel burnup.
4.3.2.3.3 Power Coefficient
The combined effect of moderator temperature and fuel temperature change as the core power level changes is called the total power coefficient and is expressed in terms of reactivity change per percent power change. Since a three-dimensional calculation is performed in determining total power coefficients and total power defects, the axial redistribution reactivity component described in subsection 4.3.2.4.3 is implicitly included. A typical power coefficient at beginning of life (BOL) and end of life (EOL) conditions is given in Figure 4.3-25.
The total power coefficient becomes more negative with burnup, reflecting the combined effect of moderator and fuel temperature coefficients with burnup. The power defect (integral reactivity effect) at BOL and EOL is given in Figure 4.3-26.
4.3.2.3.4 Comparison of Calculated and Experimental Reactivity Coefficients
Subsection 4.3.3 describes the comparison of calculated and experimental reactivity coefficients in detail.
Experimental evaluation of the reactivity coefficients will be performed during the physics startup tests described in Chapter 14.

4. Reactor AP1000 Design Control Document
Tier 2 Material 4.3-22 Revision 19
4.3.2.3.5 Reactivity Coefficients Used in Transient Analysis
Table 4.3-2 gives the limiting values as well as the best-estimate values for the reactivity coefficients for the initial cycle. The limiting values are used as design limits in the transient analysis. The exact values of the coefficient used in the analysis depend on whether the transient of interest is examined at the BOL or EOL, whether the most negative or the most positive (least negative) coefficients are appropriate, and whether spatial non-uniformity must be considered in the analysis. Conservative values of coefficients, considering various aspects of analysis, are used in the transient analysis. This is described in Chapter 15.
The reactivity coefficients shown in Figures 4.3-18 through 4.3-26 are typical best-estimate values calculated for the initial cycle. Limiting values are chosen to encompass the best-estimate reactivity coefficients, including the uncertainties given in subsection 4.3.3.3 over appropriate operating conditions. The most positive, as well as the most negative, values are selected to form the design basis range used in the transient analysis. A direct comparison of the best-estimate and design limit values for the initial cycle is shown in Table 4.3-2. In many instances the most conservative combination of reactivity coefficients is used in the transient analysis even though the extreme coefficients assumed may not simultaneously occur at the conditions assumed in the analysis. The need for a reevaluation of any accident in a subsequent cycle is contingent upon whether the coefficients for that cycle fall within the identified range used in the analysis presented in Chapter 15 with due allowance for the calculational uncertainties given in subsection 4.3.3.3. Control rod requirements are given in Table 4.3-3 for the initial cycle and for a hypothetical equilibrium cycle, since these are markedly different. These latter numbers are provided for information only.
4.3.2.4 Control Requirements
To establish the required shutdown margin stated in the COLR under conditions where a cooldown to ambient temperature is required, concentrated soluble boron is added to the coolant. Boron concentrations for several core conditions are listed in Table 4.3-2 for the initial cycle. For core conditions including refueling, the boron concentration is well below the solubility limit. The rod cluster control assemblies are employed to bring the reactor to the shutdown condition. The minimum required shutdown margin is given in the COLR.
The ability to accomplish the shutdown for hot conditions is demonstrated in Table 4.3-3 by comparing the difference between the rod cluster control assembly reactivity available with an allowance for the worst stuck rod with that required for control and protection purposes. The shutdown margin includes an allowance of seven percent for analytic uncertainties which assumes the use of silver-indium-cadmium rod cluster control assemblies. Use of a seven percent uncertainty allowance on rod cluster control assembly worth is discussed and shown to be acceptable in WCAP-9217 (Reference 17). The largest reactivity control requirement appears at the EOL when the moderator temperature coefficient reaches its peak negative value as reflected in the larger power defect.
The control rods are required to provide sufficient reactivity to account for the power defect from full power to zero power and to provide the required shutdown margin. The reactivity addition

4. Reactor AP1000 Design Control Document
Tier 2 Material 4.3-23 Revision 19
resulting from power reduction consists of contributions from Doppler effect, moderator temperature, flux redistribution, and reduction in void content as discussed below.
4.3.2.4.1 Doppler Effect
The Doppler effect arises from the broadening of U-238 and Pu-240 resonance cross-sections with an increase in effective pellet temperature. This effect is most noticeable over the range of zero power to full power due to the large pellet temperature increase with power generation.
4.3.2.4.2 Variable Average Moderator Temperature
When the core is shut down to the hot zero-power condition, the average moderator temperature changes from the equilibrium full-load value determined by the steam generator and turbine characteristics (such as steam pressure, heat transfer, tube fouling) to the equilibrium no-load value, which is based on the steam generator shell side design pressure. The design change in temperature is conservatively increased to account for the control system dead band and measurement errors.
When the moderator coefficient is negative, there is a reactivity addition with power reduction. The moderator coefficient becomes more negative as the fuel depletes because the boron concentration is reduced. This effect is the major contributor to the increased requirement at EOL.
4.3.2.4.3 Redistribution
During full-power operation, the coolant density decreases with core height. This, together with partial insertion of control rods, results in less fuel depletion near the top of the core. Under steady-state conditions, the relative power distribution will be slightly asymmetric toward the bottom of the core. On the other hand, at hot zero-power conditions, the coolant density is uniform up the core, and there is no flattening due to Doppler effect. The result will be a flux distribution which at zero power can be skewed toward the top of the core. Since a three-dimensional calculation is performed in determining total power defect, flux redistribution is implicitly included in this calculation. An additional redistribution allowance for adversely skewed xenon distributions is included in the determination of the total control requirement specified in Table 4.3-3.
4.3.2.4.4 Void Content
A small void content in the core is due to nucleate boiling at full power. The void collapse coincident with power reduction makes a small positive reactivity contribution.
4.3.2.4.5 Rod Insertion Allowance
At full power, the MSHIM and AO banks are operated within a prescribed band of travel to compensate for small changes in boron concentration, changes in temperature, and very small changes in the xenon concentration not compensated for by a change in boron concentration. When the MSHIM banks reach a predetermined insertion or withdrawal, a change in boron concentration would be required to compensate for additional reactivity changes. Use of soluble boron is limited to fuel depletion and shutdown considerations. Since the insertion limit is set by

4. Reactor AP1000 Design Control Document
Tier 2 Material 4.3-24 Revision 19
rod travel limit, a conservatively high calculation of the inserted worth is made, which exceeds the normally inserted reactivity.
4.3.2.4.6 Installed Excess Reactivity for Depletion
Excess reactivity is installed at the beginning of each cycle to provide sufficient reactivity to compensate for fuel depletion and fission product buildup throughout the cycle. This reactivity is controlled by the addition of soluble boron to the coolant and by burnable absorbers when necessary. The soluble boron concentration for several core configurations and the unit boron worth are given in Tables 4.3-1 and 4.3-2 for the initial cycle. Since the excess reactivity for burnup is controlled by soluble boron and/or burnable absorbers, it is not included in control rod requirements.
4.3.2.4.7 Xenon and Samarium Poisoning
Changes in xenon and samarium concentrations in the core occur at a sufficiently slow rate, even following rapid power level changes, that the resulting reactivity change can be controlled by changing the gray and/or control rod insertion. (Also see subsection 4.3.2.4.16).
4.3.2.4.8 pH Effects
Changes in reactivity due to a change in coolant pH, if any, are sufficiently small in magnitude and occur slowly enough to be controlled by the boron system WCAP-3896-8 (Reference 18).
4.3.2.4.9 Experimental Confirmation
Following a normal shutdown, the total core reactivity change during cooldown with a stuck rod has been measured on a 121-assembly, 10-foot-high core and a 121-assembly, 12-foot-high core. In each case, the core was allowed to cool down until it reached criticality simulating the steam line break accident. For the 10-foot core, the total reactivity change associated with the cooldown is over predicted by about 0.3-percent ρΔ with respect to the measured result. This represents an error of about five percent in the total reactivity change and is about half the uncertainty allowance for this quantity. For the 12-foot core, the difference between the measured and predicted reactivity change is an even smaller 0.2 percent Δρ. These measurements and others demonstrate the capability of the methods described in subsection 4.3.3.
4.3.2.4.10 Control
Core reactivity is controlled by means of a chemical poison dissolved in the coolant, rod cluster control assemblies, gray rod cluster assemblies and burnable absorbers as described below.
4.3.2.4.11 Chemical Shim
Boron in solution as boric acid is used to control relatively slow reactivity changes associated with:
• The moderator temperature defect in going from cold shutdown at ambient temperature to the hot operating temperature at zero power

4. Reactor AP1000 Design Control Document
Tier 2 Material 4.3-25 Revision 19
• The transient xenon and samarium poisoning, such as that following power changes to levels below 30 percent rated thermal power
• The reactivity effects of fissile inventory depletion and buildup of long-life fission products
• The depletion of the burnable absorbers
The boron concentrations for various core conditions are presented in Table 4.3-2 for the initial cycle.
4.3.2.4.12 Rod Cluster Control Assemblies
The number of rod cluster control assemblies is shown in Table 4.3-1. The rod cluster control assemblies are used for shutdown and control purposes to offset fast reactivity changes associated with:
• The required shutdown margin in the hot zero power, stuck rod condition
• The reactivity compensation as a result of an increase in power above hot zero power (power defect, including Doppler and moderator reactivity changes)
• Unprogrammed fluctuations in boron concentration, coolant temperature, or xenon concentration (with rods not exceeding the allowable rod insertion limits)
• Reactivity changes resulting from load changes
The allowed control bank reactivity insertion is limited at full power to maintain shutdown capability. As the power level is reduced, control rod reactivity requirements are also reduced, and more rod insertion is allowed. The control bank position is monitored, and the operator is notified by an alarm if the limit is approached. The determination of the insertion limit uses conservative xenon distributions and axial power shapes. In addition, the rod cluster control assembly withdrawal pattern determined from the analyses is used in determining power distribution factors and in determining the maximum worth of an inserted rod cluster control assembly ejection accident. For further discussion, refer to the technical specifications on rod insertion limits.
Power distribution, rod ejection, and rod misalignment analyses are based on the arrangement of the shutdown and control groups of the rod cluster control assemblies shown in Figure 4.3-27. Shutdown rod cluster control assemblies are withdrawn before withdrawal of the control and AO banks is initiated. The approach to critical is initiated by using the chemical and volume control system to establish an appropriate boron concentration based upon the estimated critical condition then withdrawing the AO bank above the zero power insertion limit and finally withdrawing the control banks sequentially. The limits of rod insertion and further discussion on the basis for rod insertion limits are provided in the COLR and technical specifications.

4. Reactor AP1000 Design Control Document
Tier 2 Material 4.3-26 Revision 19
4.3.2.4.13 Gray Rod Cluster Assemblies
The rod cluster control assembly control banks include four gray rod banks consisting of gray rod cluster assemblies (GRCAs). Gray rod cluster assemblies consist of 24 rodlets fastened at the top end to a common hub or spider. Geometrically, it is the same as a rod cluster control assembly except that 12 of the 24 rodlets are comprised of stainless steel while the remaining 12 rodlets are reduced diameter silver-indium-cadmium clad with stainless steel. The term gray rod refers to the reduced reactivity worth relative to that of a rod cluster control assembly consisting of 24 silver-indium-cadmium rodlets. The gray rod cluster assemblies are used in load follow maneuvering and provide a mechanical shim reactivity mechanism to eliminate the need for changes to the concentration of soluble boron (that is, chemical shim).
4.3.2.4.14 Burnable Absorbers
Discrete burnable absorber rods or integral fuel burnable absorber rods or both may be used to provide partial control of the excess reactivity available during the fuel cycle. In doing so, the burnable absorber loading controls peaking factors and prevents the moderator temperature coefficient from being positive at normal operating conditions. The burnable absorbers perform this function by reducing the requirement for soluble boron in the moderator at the beginning of the fuel cycle, as described previously. For purposes of illustration, the initial cycle burnable absorber pattern is shown in Figure 4.3-5. Figures 4.3-4a and 4.3-4b show the burnable absorber distribution within a fuel assembly for several burnable absorber patterns used in the 17 x 17 array. The boron in the rods is depleted with burnup but at a slow rate so that the peaking factor limits are not exceeded and the resulting critical concentration of soluble boron is such that the moderator temperature coefficient remains within the limits stated above for power operating conditions.
4.3.2.4.15 Peak Xenon Startup
Compensation for the peak xenon buildup may be accomplished using the boron control system. Startup from the peak xenon condition is accomplished with a combination of rod motion and boron dilution. The boron dilution can be made at any time, including during the shutdown period, provided the shutdown margin is maintained.
4.3.2.4.16 Load Follow Control and Xenon Control
During load follow maneuvers, power changes are primarily accomplished using control rod motion alone, as required. Control rod motion is limited by the control rod insertion limits as provided in the COLR and discussed in subsections 4.3.2.4.12 and 4.3.2.4.13. The power distribution is maintained within acceptable limits through limitations on control rod insertion. Reactivity changes due to the changing xenon concentration are also controlled by rod motion.
Rapid power increases (five percent/min) from part power during load follow operation are accomplished with rod motion.
The rod control system is designed to automatically provide the power and temperature control described above 30 percent rated power for most of the cycle length without the need to change boron concentration as a result of the load maneuver. The automated mode of operation is referred

4. Reactor AP1000 Design Control Document
Tier 2 Material 4.3-27 Revision 19
to as mechanical shim (MSHIM) because of the usage of mechanical means to control reactivity and power distribution simultaneously. MSHIM operation allows load maneuvering without boron change because of the degree of allowed insertion of the control banks in conjunction with the independent power distribution control of the axial offset (AO) control bank. The worth and overlap of the MA, MB, MC, MD, M1, and M2 control banks are designed such that the AO control bank insertion will always result in a monotonically decreasing axial offset. MSHIM operation uses the MA, MB, MC, MD, M1, and M2 control banks to maintain the programmed coolant average temperature throughout the operating power range. The AO control bank is independently modulated by the rod control system to maintain a nearly constant axial offset throughout the operating power range. The degree of control rod insertion under MSHIM operation allows rapid return to power without the need to change boron concentration.
The target axial offset used during MSHIM load follow and base load operation is established at a more negative value than the axial offset associated with the all rods out of condition. The negative bias is necessary to maintain both positive and negative axial offset control effectiveness by the AO control bank. Extended base load operation is performed by controlling axial offset to the target value using the AO control bank, and by controlling the coolant average temperature to the programmed value with the M-banks. Boron concentration changes are made periodically as the fuel depletes to reposition the M-banks and allow for a periodic exchange of the gray rod bank insertion sequence. MSHIM load follow and base load operations (including the gray rod bank insertion sequence exchanges) are considered Condition I normal operations.
4.3.2.4.17 Burnup
Control of the excess reactivity for burnup is accomplished using soluble boron and/or burnable absorbers. The boron concentration is limited during operating conditions to maintain the moderator temperature coefficient within its specified limits. A sufficient burnable absorber loading is installed at the beginning of a cycle to give the desired cycle lifetime, without exceeding the boron concentration limit. The end of a fuel cycle is reached when the soluble boron concentration approaches the practical minimum boron concentration in the range of 0 to 10 ppm.
4.3.2.4.18 Rapid Power Reduction System
The reactor power control system is designed with the capability of responding to full load rejection without initiating a reactor trip using the normal rod control system, reactor control system, and the rapid power reduction system. Load rejections requiring greater than a fifty percent reduction of rated thermal power initiate the rapid power reduction system. The rapid power reduction system utilizes preselected control rod groups and/or banks which are intentionally tripped to rapidly reduce reactor power into a range where the rod control and reactor control systems are sufficient to maintain stable plant operation. The consequences of accidental or inappropriate actuation of the rapid power reduction system is included in the cycle specific safety analysis and licensing process.
4.3.2.5 Control Rod Patterns and Reactivity Worth
The rod cluster control assemblies are designated by function as the control groups and the shutdown groups. The terms group and bank are used synonymously to describe a particular

4. Reactor AP1000 Design Control Document
Tier 2 Material 4.3-28 Revision 19
grouping of control assemblies. The rod cluster control assembly patterns are displayed in Figure 4.3-27. The control banks are labeled MA, MB, MC, MD, M1, M2, and AO with the MA, MB, MC, and MD banks comprised of gray rod cluster assemblies; and the shutdown banks are labeled SD1, SD2, SD3, and SD4. Each bank of more than four rod cluster control assemblies, although operated and controlled as a unit, is composed of two or more subgroups. The axial position of the rod cluster control assemblies may be controlled manually or automatically. The rod cluster control assemblies are dropped into the core following actuation of reactor trip signals.
Two criteria have been employed for selection of the control groups. First, the total reactivity worth must be adequate to meet the requirements specified in Table 4.3-3. Second, in view of the fact that these rods may be partially inserted at power operation, the total power peaking factor should be low enough to meet the power capability requirements. Analyses indicate that the first requirement can be met either by a single group or by two or more banks whose total worth equals at least the required amount. The axial power shape is more peaked following movement of a single group of rods worth three to four percent ρΔ . Therefore, control bank rod cluster control assemblies have been separated into several bank groupings. Typical control bank worth for the initial cycle are shown in Table 4.3-2.
The position of control banks for criticality under any reactor condition is determined by the concentration of boron in the coolant. On an approach to criticality, boron is adjusted so that criticality will be achieved with control rods above the insertion limit set by shutdown and other considerations. (See the technical specifications and COLR). Early in the cycle, there may also be a withdrawal limit at low power to maintain the moderator temperature coefficient within the specified limits for that power level.
Ejected rod worths for several different conditions are given in subsection 15.4.8.
Allowable deviations due to misaligned control rods are discussed in the technical specifications.
A representative differential rod worth calculation for two banks of control rods withdrawn simultaneously (rod withdrawal accident) is given in Figure 4.3-28.
Calculation of control rod reactivity worth versus time following reactor trip involves both control rod velocity and differential reactivity worth. The rod position versus time of travel after rod release assumed is given in Figure 4.3-29. For nuclear design purposes, the reactivity worth versus rod position is calculated by a series of steady-state calculations at various control positions, assuming the rods out of the core as the initial position in order to minimize the initial reactivity insertion rate. Also, to be conservative, the rod of highest worth is assumed stuck out of the core, and the flux distribution (and thus reactivity importance) is assumed to be skewed to the bottom of the core. The result of these calculations is shown in Figure 4.3-30.
The shutdown groups provide additional negative reactivity to establish adequate shutdown margin. Shutdown margin is the amount by which the core would be subcritical at hot shutdown if the rod cluster control assemblies were tripped, but assuming that the highest worth assembly remained fully withdrawn and no changes in xenon or boron took place. The loss of control rod worth due to the depletion of the absorber material is negligible.

4. Reactor AP1000 Design Control Document
Tier 2 Material 4.3-29 Revision 19
The values given in Table 4.3-3 show that the available reactivity in withdrawn rod cluster control assemblies provides the design bases minimum shutdown margin, allowing for the highest worth cluster to be at its fully withdrawn position. An allowance for the uncertainty in the calculated worth of N-1 rods is made before determination of the shutdown margin.
4.3.2.6 Criticality of the Reactor During Refueling
The basis for maintaining the reactor subcritical during refueling is presented in subsection 4.3.1.5, and a discussion of how control requirements are met is given in subsections 4.3.2.4 and 4.3.2.5.
4.3.2.6.1 Criticality Design Method Outside the Reactor
Criticality of fuel assemblies outside the reactor is precluded by adequate design of fuel transfer, shipping, and storage facilities and by administrative control procedures. The two principal methods of preventing criticality are limiting the fuel assembly array size and limiting assembly interaction by fixing the minimum separation between assemblies and/or inserting neutron poisons between assemblies. The details of the methodology used for the new fuel rack and spent fuel rack criticality analysis are included in the Chapter 9.1 references. The design criteria are consistent with General Design Criterion (GDC) 62, Reference 19, and NRC guidance given in Reference 20. The applicable 10 CFR Part 50.68 requirements are as follows:
1. The maximum K-effective value, including all biases and uncertainties, must be less than 0.95 with soluble boron credit and less than 1.0 with full density unborated water. Note this design criterion is provided in 10 CFR Part 50.68, Item 4 of Paragraph b. Note that the specific terminology is:
“If no credit for soluble boron is taken, the k-effective of the spent fuel storage racks loaded with fuel of the maximum fuel assembly reactivity must not exceed 0.95, at a 95 percent probability, 95 percent confidence level, if flooded with unborated water. If credit is taken for soluble boron, the k-effective of the spent fuel storage racks loaded with fuel of the maximum fuel assembly reactivity must not exceed 0.95, at a 95 percent probability, 95 percent confidence level, if flooded with borated water, and the k-effective must remain below 1.0 (subcritical), at a 95 percent probability, 95 percent confidence level, if flooded with unborated water.”
2. The maximum enrichment of fresh fuel assemblies must be less than or equal to 5.0 weight-percent U-235. Note this design criterion is provided in 10 CFR Part 50.68, Item 7 of Paragraph b. Note that the specific terminology is:
“The maximum nominal U–235 enrichment of the fresh fuel assemblies is limited to five (5.0) percent by weight.”

4. Reactor AP1000 Design Control Document
Tier 2 Material 4.3-30 Revision 19
The following conditions are assumed in meeting this design bases:
• The fuel assembly contains the highest enrichment authorized without any control rods or non-integral burnable absorber(s) and is at its most reactive point in life.
• For flooded conditions, the moderator is pure water at the temperature within the design limits which yields the largest reactivity.
• The array is either infinite in lateral extent or is surrounded by a conservatively chosen reflector, whichever is appropriate for the design.
• Mechanical uncertainties are treated by combining both the worst-case bounding value and sensitivity study approaches.
• Credit is taken for the neutron absorption in structural materials and in solid materials added
specifically for neutron absorption.
Fuel depletion analyses during core operation were performed with CASMO-4 (using the 70-group cross-section library), a two-dimensional multigroup transport theory code based on capture probabilities (Reference 53). CASMO-4 is used to determine the isotopic composition of the spent fuel. In addition, the CASMO-4 calculations are restarted in the storage rack geometry, yielding the two-dimensional infinite multiplication factor (kinf) for the storage rack to determine the reactivity effect of fuel and rack tolerances, temperature variation, and to perform various studies. The design method which determines the criticality safety of fuel assemblies outside the reactor uses the MCNP4a code (Reference 21), with continuous energy cross-sections based on ENDF/B-V and ENDF/B-VI.
A set of 62 critical experiments has been analyzed using the above method to demonstrate its applicability to criticality analysis and to establish the method bias and uncertainty. The benchmark experiments cover a wide range of geometries, materials, and enrichments, all of them adequate for qualifying methods to analyze light water reactor lattices (References 22 to 28, and 65 to 68).
The analysis of the 62 critical experiments results in an average Keff of 0.9991. Comparison with the measured values results in a method bias of 0.0009. The standard deviation of the set of reactivities is 0.0011. The 95/95 tolerance factor is conservatively set to 2.0. The analytical methods employed herein conform with ANSI N18.2 (Reference 3), Section 5.7, Fuel Handling System; ANSI N16.9 (Reference 29), NRC Standard Review Plan, subsection 9.1.2, the NRC guidance, “OT Position for Review and Acceptance of Spent Fuel Storage and Handling Applications” (Reference 30).

4. Reactor AP1000 Design Control Document
Tier 2 Material 4.3-31 Revision 19
4.3.2.6.2 Soluble Boron Credit Methodology
The minimum soluble boron requirement under normal and accident conditions must be determined to show that the reactivity of the spent fuel racks remains below 0.95. This is achieved by crediting a discrete amount of soluble boron and then determining by linear interpolation the appropriate amount of soluble boron necessary to reduce the maximum Keff to 0.95 with all uncertainties and biases included.
4.3.2.7 Stability
4.3.2.7.1 Introduction
The stability of the PWR cores against xenon-induced spatial oscillations and the control of such transients are discussed extensively in References 11, 31, 32, and 33. A summary of these reports is given in the following discussion, and the design bases are given in subsection 4.3.1.6.
In a large reactor core, xenon-induced oscillations can take place with no corresponding change in the total power of the core. The oscillation may be caused by a power shift in the core which occurs rapidly by comparison with the xenon-iodine time constants. Such a power shift occurs in the axial direction when a plant load change is made by control rod motion and results in a change in the moderator density and fuel temperature distributions. Such a power shift could occur in the diametral plane of the core as a result of abnormal control action.
Due to the negative power coefficient of reactivity, PWR cores are inherently stable to oscillations in total power. Protection against total power instabilities is provided by the control and protection system, as described in Section 7.7. Hence, the discussion on the core stability will be limited to xenon-induced spatial oscillations.
4.3.2.7.2 Stability Index
Power distributions, either in the axial direction or in the X-Y plane, can undergo oscillations due to perturbations introduced in the equilibrium distributions without changing the total core power. The harmonics and the stability of the core against xenon-induced oscillations can be determined in terms of the eigenvalue of the first flux harmonics. Writing the eigenvalue ξ of the first flux harmonic as:
ic + b = ξ (1)
Then b is defined as the stability index and /c2=T π as the oscillation period of the first harmonic. The time dependence of the first harmonic φδ in the power distribution can now be represented as:
( ) ct cos ea = eA = t bttξδφ (2)
where A and a are constants. The stability index can also be obtained approximately by:

4. Reactor AP1000 Design Control Document
Tier 2 Material 4.3-32 Revision 19
A
Aln T
1 = b
n
1n+ (3)
where An and A 1n+ are the successive peak amplitudes of the oscillation and T is the time period between the successive peaks.
4.3.2.7.3 Prediction of the Core Stability
The core described in this report has an active fuel length that is 24 inches longer (nominal) than that for previous Westinghouse PWRs licensed in the U.S. with 157 fuel assemblies. For this reason, it is expected that this core will be as stable as the 12-foot designs with respect to radial and diametral xenon oscillations since the radial core dimensions have not changed. This core will be slightly less stable than the 12-foot, 157 assembly cores with respect to axial xenon oscillations because the active core height has been increased by 24 inches. The effect of this increase will be to decrease the burnup at which the axial stability index becomes zero (Section 4.3.2.7.4 below). The moderator temperature coefficients and the Doppler temperature coefficients of reactivity will be similar to those of previous designs. Control banks included in the core design are sufficient to dampen any xenon oscillations that may occur. Free axial xenon oscillations are not allowed to occur for a core of any height, except during special tests as described in Section 4.3.2.7.4.
4.3.2.7.4 Stability Measurements
4.3.2.7.4.1 Axial Measurements
Two axial xenon transient tests conducted in a PWR with a core height of 12 feet and 121 fuel assemblies are reported in WCAP-7964 (Reference 34) and are discussed here. The tests were performed at approximately 10 percent and 50 percent of cycle life.
Both a free-running oscillation test and a controlled test were performed during the first test. The second test at mid-cycle consisted of a free-running oscillation test only. In each of the free-running oscillation tests, a perturbation was introduced to the equilibrium power distribution through an impulse motion of the lead control bank and the subsequent oscillation period was monitored. In the controlled test conducted early in the cycle, the part-length rods were used to follow the oscillations to maintain an axial offset within the prescribed limits. The axial offset of power was obtained from the ex-core ion chamber readings (which had been calibrated against the in-core flux maps) as a function of time for both free-running tests, as shown in Figure 12 of WCAP-7964 (Reference 34)
The total core power was maintained constant during these spatial xenon tests, and the stability index and the oscillation period were obtained from a least-square fit of the axial offset data in the form of equation 2. The axial offset of power is the quantity that properly represents the axial stability in the sense that it essentially eliminates any contribution from even-order harmonics, including the fundamental mode. The conclusions of the tests follow:
• The core was stable against induced axial xenon transients, at the core average burnups of both 1550 MWD/MTU and 7700 MWD/MTU. The measured stability indices are -0.041 h-1
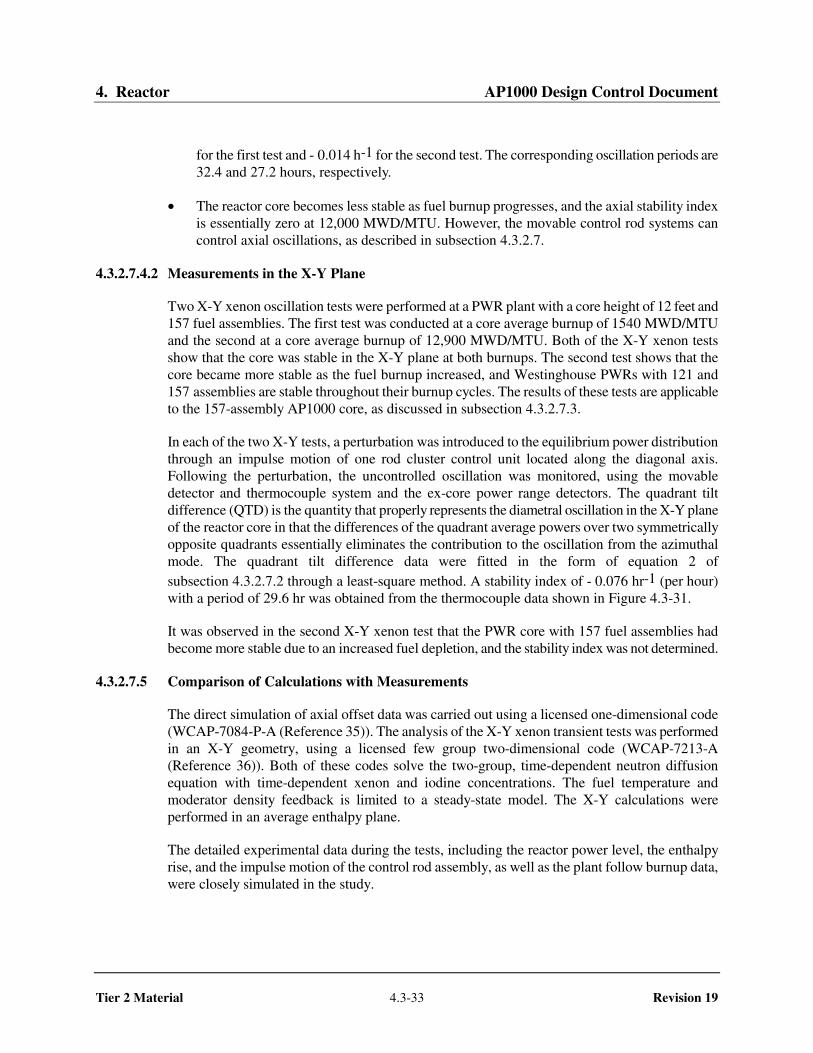
4. Reactor AP1000 Design Control Document
Tier 2 Material 4.3-33 Revision 19
for the first test and - 0.014 h-1 for the second test. The corresponding oscillation periods are 32.4 and 27.2 hours, respectively.
• The reactor core becomes less stable as fuel burnup progresses, and the axial stability index is essentially zero at 12,000 MWD/MTU. However, the movable control rod systems can control axial oscillations, as described in subsection 4.3.2.7.
4.3.2.7.4.2 Measurements in the X-Y Plane
Two X-Y xenon oscillation tests were performed at a PWR plant with a core height of 12 feet and 157 fuel assemblies. The first test was conducted at a core average burnup of 1540 MWD/MTU and the second at a core average burnup of 12,900 MWD/MTU. Both of the X-Y xenon tests show that the core was stable in the X-Y plane at both burnups. The second test shows that the core became more stable as the fuel burnup increased, and Westinghouse PWRs with 121 and 157 assemblies are stable throughout their burnup cycles. The results of these tests are applicable to the 157-assembly AP1000 core, as discussed in subsection 4.3.2.7.3.
In each of the two X-Y tests, a perturbation was introduced to the equilibrium power distribution through an impulse motion of one rod cluster control unit located along the diagonal axis. Following the perturbation, the uncontrolled oscillation was monitored, using the movable detector and thermocouple system and the ex-core power range detectors. The quadrant tilt difference (QTD) is the quantity that properly represents the diametral oscillation in the X-Y plane of the reactor core in that the differences of the quadrant average powers over two symmetrically opposite quadrants essentially eliminates the contribution to the oscillation from the azimuthal mode. The quadrant tilt difference data were fitted in the form of equation 2 of subsection 4.3.2.7.2 through a least-square method. A stability index of - 0.076 hr-1 (per hour) with a period of 29.6 hr was obtained from the thermocouple data shown in Figure 4.3-31.
It was observed in the second X-Y xenon test that the PWR core with 157 fuel assemblies had become more stable due to an increased fuel depletion, and the stability index was not determined.
4.3.2.7.5 Comparison of Calculations with Measurements
The direct simulation of axial offset data was carried out using a licensed one-dimensional code (WCAP-7084-P-A (Reference 35)). The analysis of the X-Y xenon transient tests was performed in an X-Y geometry, using a licensed few group two-dimensional code (WCAP-7213-A (Reference 36)). Both of these codes solve the two-group, time-dependent neutron diffusion equation with time-dependent xenon and iodine concentrations. The fuel temperature and moderator density feedback is limited to a steady-state model. The X-Y calculations were performed in an average enthalpy plane.
The detailed experimental data during the tests, including the reactor power level, the enthalpy rise, and the impulse motion of the control rod assembly, as well as the plant follow burnup data, were closely simulated in the study.

4. Reactor AP1000 Design Control Document
Tier 2 Material 4.3-34 Revision 19
The results of the stability calculation for the axial tests are compared with the experimental data in Table 4.3-5. The calculations show conservative results for both of the axial tests with a margin of approximately 0.01 hr-1 in the stability index.
An analytical simulation of the first X-Y xenon oscillation test shows a calculated stability index of - 0.081 hr-1, in good agreement with the measured value of - 0.076 hr-1. As indicated earlier, the second X-Y xenon test showed that the core had become more stable compared to the first test, and no evaluation of the stability index was attempted. This increase in the core stability in the X-Y plane due to increased fuel burnup is due mainly to the increased magnitude of the negative moderator temperature coefficient.
Previous studies of the physics of xenon oscillations, including three-dimensional analysis, are reported in a series of topical reports (References 31, 32, and 33). A more detailed description of the experimental results and analysis of the axial and X-Y xenon transient tests is presented in WCAP-7964 (Reference 34) and Section 1 of WCAP-8768 (Reference 37).
4.3.2.7.6 Stability Control and Protection
The online monitoring system provides continuous indication of current power distributions and provides guidance to the plant operator as to the timing and most appropriate action(s) to maintain stable axial power distributions. In the event the online monitoring system is out of service, the ex-core detector system is utilized to provide indications of xenon-induced spatial oscillations. The readings from the ex-core detectors are available to the operator and also form part of the protection system.
4.3.2.7.6.1 Axial Power Distribution
The rod control system automatically maintains axial power distribution within very tight axial offset bands as part of normal operation. The AO control bank is specifically designed with sufficient worth to be capable of maintaining essentially constant axial offset over the power operating range. The rod control system is also allowed to be operated in manual control in which case the operator is instructed to maintain an axial offset within a prescribed operating band, based on the ex-core detector readings. Should the axial offset be permitted to move far enough outside this band, the protection limit is encroached, and the turbine power is automatically reduced or a reactor trip signal generated, or both.
As fuel burnup progresses, PWR cores become less stable to axial xenon oscillations. However, free xenon oscillations are not allowed to occur, except for special tests. The AO control bank is sufficient to dampen and control any axial xenon oscillations present. Should the axial offset be inadvertently permitted to move far enough outside the allowed band due to an axial xenon oscillation or for any other reason, the OTΔT and/or OPΔT protection setpoint including the axial offset compensation is reached and the turbine power is automatically reduced and/or a reactor trip signal is generated.
4.3.2.7.6.2 Radial Power Distribution
The core described herein is calculated to be stable against X-Y xenon-induced oscillations during the core life.

4. Reactor AP1000 Design Control Document
Tier 2 Material 4.3-35 Revision 19
The X-Y stability of large PWRs has been further verified as part of the startup physics test program for PWR cores with 193 fuel assemblies. The measured X-Y stability of the cores with 157 and 193 assemblies was in close agreement with the calculated stability, as discussed in subsections 4.3.2.7.4 and 4.3.2.7.5. In the unlikely event that X-Y oscillations occur, backup actions are possible and would be implemented, if necessary, to increase the natural stability of the core. This is based on the fact that several actions could be taken to make the moderator temperature coefficient more negative, which would increase the stability of the core in the X-Y plane.
Provisions for protection against non-symmetric perturbations in the X-Y power distribution that could result from equipment malfunctions are made in the protection system design. This includes control rod drop, rod misalignment, and asymmetric loss of coolant flow.
A more detailed discussion of the power distribution control in PWR cores is presented in WCAP-7811 (Reference 11) and WCAP-8385 (Reference 12).
4.3.2.8 Vessel Irradiation
A review of the methods and analyses used in the determination of neutron and gamma ray flux attenuation between the core and the pressure vessel is provided below. A more complete discussion on the pressure vessel irradiation and surveillance program is given in Section 5.3.
The materials that serve to attenuate neutrons originating in the core and gamma rays from both the core and structural components consist of the core shroud, core barrel and associated water annuli. These are within the region between the core and the pressure vessel.
In general, few group neutron diffusion theory codes are used to determine fission power density distributions within the active core, and the accuracy of these analyses is verified by in-core measurements on operating reactors. Region and rodwise power-sharing information from the core calculations is then used as source information in two-dimensional transport calculations which compute the flux distributions throughout the reactor.
The neutron flux distribution and spectrum in the various structural components vary significantly from the core to the pressure vessel. Representative values of the neutron flux distribution and spectrum are presented in Table 4.3-6.
As discussed in Section 5.3, the irradiation surveillance program utilizes actual test samples to verify the accuracy of the calculated fluxes at the vessel.
4.3.3 Analytical Methods
Calculations required in nuclear design consist of three distinct types, which are performed in sequence:
1. Determination of effective fuel temperatures 2. Generation of microscopic few-group parameters 3. Space-dependent, few-group diffusion calculations

4. Reactor AP1000 Design Control Document
Tier 2 Material 4.3-36 Revision 19
These calculations are carried out by computer codes which can be executed individually. Most of the codes required have been linked to form an automated design sequence which minimizes design time, avoids errors in transcription of data, and standardizes the design methods.
4.3.3.1 Fuel Temperature (Doppler) Calculations
Temperatures vary radially within the fuel rod, depending on the heat generation rate in the pellet; the conductivity of the materials in the pellet, gap, and clad; and the temperature of the coolant.
The fuel temperatures for use in most nuclear design Doppler calculations are obtained from a simplified version of the Westinghouse fuel rod design model described in subsection 4.2.1.3, which considers the effect of radial variation of pellet conductivity, expansion coefficient and heat generation rate, elastic deflection of the clad, and a gap conductance which depends on the initial fill gas, the hot open gap dimension, and the fraction of the pellet over which the gap is closed. The fraction of the gap assumed closed represents an empirical adjustment used to produce close agreement with observed reactivity data at beginning of life. Further gap closure occurs with burnup and accounts for the decrease in Doppler defect with burnup which has been observed in operating plants. For detailed calculations of the Doppler coefficient, such as for use in xenon stability calculations, a more sophisticated temperature model is used, which accounts for the effects of fuel swelling, fission gas release, and plastic clad deformation.
Radial power distributions in the pellet as a function of burnup are obtained from LASER (WCAP-6073, Reference 38) calculations.
The effective U-238 temperature for resonance absorption is obtained from the radial temperature distribution by applying a radially dependent weighing function. The weighing function was determined from REPAD (WCAP-2048, Reference 39) Monte Carlo calculations of resonance escape probabilities in several steady-state and transient temperature distributions. In each case, a flat pellet temperature was determined which produced the same resonance escape probability as the actual distribution. The weighing function was empirically determined from these results.
The effective Pu-240 temperature for resonance absorption is determined by a convolution of the radial distribution of Pu-240 densities from LASER burnup calculations and the radial weighing function. The resulting temperature is burnup dependent, but the difference between U-238 and Pu-240 temperatures, in terms of reactivity effects, is small.
The effective pellet temperature for pellet dimensional change is that value which produces the same outer pellet radius in a virgin pellet as that obtained from the temperature model. The effective clad temperature for dimensional change is its average value.
The temperature calculational model has been validated by plant Doppler defect data, as shown in Table 4.3-7, and Doppler coefficient data, as shown in Figure 4.3-32. Stability index measurements also provide a sensitive measure of the Doppler coefficient near full power (subsection 4.3.2.7).

4. Reactor AP1000 Design Control Document
Tier 2 Material 4.3-37 Revision 19
4.3.3.2 Macroscopic Group Constants
PHOENIX-P (WCAP-11596-P-A, Reference 40) has been used for generating the macroscopic cross sections needed for the spatial few group codes. PHOENIX-P or other NRC approved lattice codes will be used for reload designs.
PHOENIX-P has been approved by the NRC as a lattice code for the generation of macroscopic and microscopic few group cross sections for PWR analysis. (See WCAP-11596-P-A, Reference 40). PHOENIX-P is a two-dimensional, multigroup, transport-based lattice code capable of providing necessary data for PWR analysis. Since it is a dimensional lattice code, PHOENIX-P does not rely on pre-determined spatial/spectral interaction assumptions for the heterogeneous fuel lattice and can provide a more accurate multigroup spatial flux solution than versions (ARK) of LEOPARD/CINDER.
The solution for the detailed spatial flux and energy distribution is divided into two major steps in PHOENIX-P (See References 40 and 41). First, a two-dimensional fine energy group nodal solution is obtained, coupling individual subcell regions (e.g., pellet, clad and moderator) as well as surrounding pins, using a method based on Carlvik’s collision probability approach and heterogeneous response fluxes which preserve the heterogeneous nature of the pin cells and their surroundings. The nodal solution provides an accurate and detailed local flux distribution, which is then used to homogenize the pin cells spatially to few groups.
Then, a standard S4 discrete ordinates calculation solves for the angular distribution, based on the group-collapsed and homogenized cross sections from the first step. These S4 fluxes normalize the detailed spatial and energy nodal fluxes, which are then used to compute reaction rates, power distributions and to deplete the fuel and burnable absorbers. A standard B1 calculation evaluates the fundamental mode critical spectrum, providing an improved fast diffusion coefficient for the core spatial codes.
PHOENIX-P employs either a 42 or 70 energy group library derived mainly from the ENDF/B-V files (Reference 21). This library was designed to capture the integral properties of the multigroup data properly during group collapse and to model important resonance parameters properly. It contains neutronics data necessary for modelling fuel, fission products, cladding and structural materials, coolant, and control and burnable absorber materials present in PWRs.
Group constants for burnable absorber cells, control rod cells, guide thimbles and instrumentation thimbles, or other non-fuel cells, can be obtained directly from PHOENIX-P without any adjustments such as those required in the cell or 1D lattice codes.
PHOENIX-P has been validated through an extensive qualification effort which includes calculation-measurement comparison of the Strawbridge-Barry critical experiments (See References 42 and 43), the KRITZ high temperature criticals (Reference 44), the AEC sponsored B&W criticals (References 45 through 47) and measured actinide isotopic data from fuel pins irradiated in the Saxton and Yankee Rowe cores (References 48 through 52). In addition, calculation-measurement comparisons have been made to operating reactor data measured during startup tests and during normal power operation.

4. Reactor AP1000 Design Control Document
Tier 2 Material 4.3-38 Revision 19
Validation of the cross section method is based on analysis of critical experiments, isotopic data, plant critical boron concentration data, and control rod worth measurement data such as that shown in Table 4.3-8.
Confirmatory critical experiments on burnable absorber rods are described in WCAP-7806 (Reference 42).
4.3.3.3 Spatial Few-Group Diffusion Calculations
The 3D ANC code (see WCAP-10965-P-A, Reference 57) permits the introduction of advanced fuel designs with axial heterogeneities, such as axial blankets and part-length burnable absorbers, and allows such features to be modeled explicitly. The three dimensional nature of this code provides both radial and axial power distribution. For some applications, the updated version APOLLO (see WCAP-13524 Reference 60) of the PANDA code (see WCAP-7084-P-A Reference 35) will continue to be used for axial calculations, and a two-dimensional collapse of 3D ANC that properly accounts for the three-dimensional features of the fuel is used for X-Y calculations.
Spatial few group calculations are carried out to determine the critical boron concentrations and power distributions. The moderator coefficient is evaluated by varying the inlet temperature in the same kind of calculations as those used for power distribution and reactivity predictions.
Validation of the reactivity calculations is associated with validation of the group constants themselves, as discussed in subsection 4.3.3.2. Validation of the Doppler calculations is associated with the fuel temperature validation discussed in subsection 4.3.3.1. Validation of the moderator coefficient calculations is obtained by comparison with plant measurements at hot zero power conditions, similar to that shown in Table 4.3-9.
Axial calculations are used to determine differential control rod worth curves (reactivity versus rod insertion) and to demonstrate load follow capability. Group constants are obtained from the three-dimensional nodal model by flux-volume weighing on an axial slicewise basis. Radial bucklings are determined by varying parameters in the buckling model while forcing the one-dimensional model to reproduce the axial characteristics (axial offset, midplane power) of the three-dimensional model.
Validation of the spatial codes for calculating power distributions involves the use of in-core and ex-core detectors and is discussed in subsection 4.3.2.2.7.
As discussed in subsection 4.3.3.2, calculation-measurement comparisons have been made to operating reactor data measured during startup tests and during normal power operation. These comparisons include a variety of core geometries and fuel loading patterns, and incorporate a reasonable extreme range of fuel enrichment, burnable absorber loading, and cycle burnup. Qualification data identified in Reference 40 indicate small mean and standard deviations relative to measurement which are equal to or less than those found in previous reviews of similar or parallel approved methodologies. For the reload designs the spatial codes described above, other NRC approved codes, or both are used.

4. Reactor AP1000 Design Control Document
*NRC Staff approval is required prior to implementing a change in this information; see DCD Introduction Section 3.5. Tier 2 Material 4.3-39 Revision 19
4.3.4 Combined License Information
The Combined License information requested in this subsection has been completely addressed in APP-GW-GLR-059 (Reference 64), and the applicable changes have been incorporated into the DCD. No additional work is required by the Combined License applicant to address the Combined License information requested in this subsection.
The following words represent the original Combined License Information Item commitment, which has been addressed as discussed above:
Combined License applicants referencing the AP1000 certified design will address changes to the reference design of the fuel, burnable absorber rods, rod cluster control assemblies, or initial core design from that presented in the DCD.
4.3.5 References
1. Bordelon, F. M, et al., “Westinghouse Reload Safety Evaluation Methodology,” WCAP-9272-P-A (Proprietary) and WCAP-9273-NP-A (Nonproprietary), July 1985.
2. [Davidson, S. L. (Ed.), “Fuel Criteria Evaluation Process,” WCAP-12488-P-A (Proprietary) and WCAP-14204-A - (Nonproprietary), October 1994.]*
3. ANSI N18.2-1973, “Nuclear Safety Criteria for the Design of Stationary Pressurized Water Reactor Plants.”
4. Beard, C. L. and Morita, T., “BEACON: Core Monitoring and Operations Support System,” WCAP-12472-P-A (Proprietary) and WCAP-12473-A (Nonproprietary), August 1994; Addendum 1, May 1996; and Addendum 2, March 2001.
5. Gangloff, W. C. and Loftus, W. D., “Westinghouse Anticipated Transients Without Reactor Trip Analysis,” WCAP-8330, August 1974.
6. Not used.
7. Spier, E. M., “Evaluation of Nuclear Hot Channel Factor Uncertainties,” WCAP-7308-L-P-A (Proprietary) and WCAP-7308-L-A, (Nonproprietary), June 1988.
8. Hellman, J. M., ed. “Fuel Densification Experimental Results and Model for Reactor Application,” WCAP-8218-P-A (Proprietary) and WCAP-8219-A (Nonproprietary), March 1975.
9. Meyer, R. O., “The Analysis of Fuel Densification,” Division of Systems Safety, U.S. Nuclear Regulatory Commission, NUREG-0085, July 1976.
10. Hellman, J. M., Olson, C. A., and Yang, J. W., “Effects of Fuel Densification Power Spikes on Clad Thermal Transients,” WCAP-8359; July 1974.

4. Reactor AP1000 Design Control Document
Tier 2 Material 4.3-40 Revision 19
11. Moore, J. S., “Power Distribution Control of Westinghouse Pressurized Water Reactors,” WCAP-7811, December 1971.
12. Morita, T., et al., “Power Distribution Control and Load Following Procedures,” WCAP-8385 (Proprietary) and WCAP-8403 (Nonproprietary), September 1974.
13. Miller, R. W., et al., “Relaxation of Constant Axial Offset Control, FQ Surveillance Technical Specification,” WCAP-10216-P-A, (Proprietary) and WCAP-10217-A, (Nonproprietary) Revision 1A, February 1994.
14. McFarlane, A. F., “Power Peaking Factors,” WCAP-7912-P-A (Proprietary) and WCAP-7912-A (Nonproprietary), January 1975.
15. Meyer, C. E., and Stover, R. L., “Incore Power Distribution Determination in Westinghouse Pressurized Water Reactors,” WCAP-8498, July 1975.
16. Warren, H. D., “Rhodium In-Core Detector Sensitivity Depletion, Cycles 2-6,” EPRI-NP-3814, December 1984.
17. Henderson, W. B., “Results of the Control Rod Worth Program,” WCAP-9217 (Proprietary) and WCAP-9218 (Nonproprietary), October 1977.
18. Cermak, J. O., et al., “Pressurized Water Reactor pH - Reactivity Effect Final Report,” WCAP-3696-8 (EURAEC-2074), October 1968.
19. USNRC Code of Federal Regulations, Title 10, Part 50, Appendix A, Criterion 62, “Prevention of Criticality in Fuel Storage and Handling.”
20. Kopp, L. (NRC), “Guidance on the Regulatory Requirements for Criticality Analysis of Fuel Storage at Light-Water Reactor Power Plants,” February 1998.
21. Briesmeister, J. F., Editor, “MCNP – A General Monte Carlo N-Particle Transport Code, Version 4A,” LA-12625, Los Alamos National Laboratory (1993).
22. Baldwin, M. N., et al., “Critical Experiments Supporting Close Proximity Water Storage of Power Reactor Fuel,” BAW-1484-7, Babcock & Wilcox Company, July 1979.
23. Hoovier, G. S., et al., “Critical Experiments Supporting Underwater Storage of Tightly Packed Configurations of Spent Fuel Pins,” BAW-1645-4, Babcock & Wilcox Company, November 1991.
24. Newman, L. W., et al., “Urania Gadolinia: Nuclear Model Development and Critical Experiment Benchmark,” BAW-1810, Babcock & Wilcox Company, April 1984.
25. Manaranche, J. C., et al., “Dissolution and Storage Experimental Program with 4.75 w/o Enriched Uranium-Oxide Rods,” Trnas. Am. Nucl. Soc. 33:362-364 (1979).

4. Reactor AP1000 Design Control Document
Tier 2 Material 4.3-41 Revision 19
26. Bierman, S. R. and Clayton, E. D., “Criticality Experiments with Subcritical Clusters of 2.35 w/o and 4.31 w/o 235U Enriched UO2 Rods in Water with Steel Reflecting Walls,” PNL-3602, Batelle Pacific Northwest Laboratory, April 1981.
27. Bierman, S. R., et al., “Criticality Experiments with Subcritical Clusters of 2.35 w/o and 4.31 w/o 235U Enriched UO2 Rods in Water with Uranium or Lead Reflecting Walls,” PNL-3926, Batelle Pacific Northwest Laboratory, December 1981.
28. Bierman, S. R., et al., “Criticality Experiments with Subcritical Clusters of 2.35 w/o and 4.31 w/o 235U Enriched UO2 Rods in Water with Fixed Neutron Poisons,” PNL-2615, Batelle Pacific Northwest Laboratory, October 1977.
29. ANSI N16.9-1975, “Validation of Calculational Methods for Nuclear Criticality Safety.”
30. NRC Letter “OT Position for Review and Acceptance of Spent Fuel Storage and Handling Applications,” from Grimes, B. K., to all power reactor licenses, April 14, 1978.
31. Poncelet, C. G., and Christie, A. M., “Xenon-Induced Spatial Instabilities in Large Pressurized Water Reactors,” WCAP-3680-20 (EURAEC-1974), March 1968.
32. Skogen, F. B., and McFarlane, A. F., “Control Procedures for Xenon-Induced X-Y Instabilities in Large Pressurized Water Reactors,” WCAP-3680-21 (EURAEC-2111), February 1969.
33. Skogen, F. B., and McFarlane, A. F., “Xenon-Induced Spatial Instabilities in Three Dimensions,” WCAP-3680-22 (EURAEC-2116), September 1969.
34. Lee, J. C., et al., “Axial Xenon Transient Tests at the Rochester Gas and Electric Reactor,” WCAP-7964, June 1971.
35. Barry, R. F., and Minton, G., “The PANDA Code,” WCAP-7048-P-A (Proprietary) and WCAP-7757-A (Nonproprietary), February 1975.
36. Barry, R. F., and Altomare, S., “The TURTLE 24.0 Diffusion Depletion Code,” WCAP-7213-A (Proprietary) and WCAP-7758-A (Non-Proprietary), February 1975.
37. Eggleston, F. T., “Safety-Related Research and Development for Westinghouse Pressurized Water Reactors, Program Summaries - Winter 1977 - Summer 1978,” WCAP-8768, Revision 2, October 1978.
38. Poncelet, C. G., “LASER - A Depletion Program for Lattice Calculations Based on MUFT and THERMOS,” WCAP-6073, April 1966.
39. Olhoeft, J. E., “The Doppler Effect for a Non-Uniform Temperature Distribution in Reactor Fuel Elements,” WCAP-2048, July 1962.

4. Reactor AP1000 Design Control Document
Tier 2 Material 4.3-42 Revision 19
40. Nguyen, T. Q., et al., “Qualification of the PHOENIX-P/ANC Nuclear Design System for Pressurized Water Reactor Cores,” WCAP-11596-P-A (Proprietary) and WCAP-11597-A (Nonproprietary), June 1988.
41. Mildrum, C. M., Mayhue, L. T., Baker, M. M., and Isaac, P. G., “Qualification of the PHOENIX/POLCA Nuclear Design and Analysis Program for Boiling Water Reactors,” WCAP-10841 (Proprietary), and WCAP-10842 (Nonproprietary), June 1985.
42. Barry, R. F., “Nuclear Design of Westinghouse Pressurized Water Reactors with Burnable Poison Rods,” WCAP-7806, December 1971.
43. Strawbridge, L. E., and Barry, R. F., “Criticality Calculation for Uniform Water-Moderated Lattices,” Nuclear Science and Engineering 23, p. 58, 1965.
44. Persson, R., Blomsjo, E., and Edenius, M., “High Temperature Critical Experiments with H2O Moderated Fuel Assemblies in KRITZ,” Technical Meeting No. 2/11, NUCLEX 72, 1972.
45. Baldwin, M. N., and Stern, M. E., “Physics Verification Program Part III, Task 4: Summary Report,” BAW-3647-20, March 1971.
46. Baldwin, M. N., “Physics Verification Program Part III, Task 11: Quarterly Technical Report January-March 1974,” BAW-3647-30, July 1974.
47. Baldwin, M. N., “Physics Verification Program Part III, Task 11: Quarterly Technical Report July-September 1974,” BAW-3647-31, February 1975.
48. Nodvik, R. J., “Saxton Core II Fuel Performance Evaluation Part II: Evaluation of Mass Spectrometric and Radiochemical Analyses of Irradiated Saxton Plutonium Fuel,” WCAP-3385-56 Part II, July 1970.
49. Smalley, W. R., “Saxton Core II - Fuel Performance Evaluation Part I: Materials,” WCAP-3386-56 Part I, September 1971.
50. Goodspeed, R. C., “Saxton Plutonium Project - Quarterly Progress Report for the Period Ending June 20, 1973,” WCAP-3385-36, July 1973.
51. Crain, H. H., “Saxton Plutonium Project - Quarterly Progress Report for the Period Ending September 30, 1973,” WCAP-3385-37, December 1973.
52. Melehan, J. B., “Yankee Core Evaluation Program Final Report,” WCAP-3017-6094, January 1971.
53. APP-GW-GLR-029P, Revision 3, “AP1000 Spent Fuel Storage Racks Criticality Analysis,” Westinghouse Electric Company LLC (Westinghouse Proprietary).
54. Not used.

4. Reactor AP1000 Design Control Document
Tier 2 Material 4.3-43 Revision 19
55. Not used.
56. Not used.
57. Davidson, S. L., (Ed.), et al., “ANC: A Westinghouse Advanced Nodal Computer Code,” WCAP-10965-P-A (Proprietary) and WCAP-10966-A (Nonproprietary), September 1986.
58. Leamer, R. D., et al., “PuO2-U O2 Fueled Critical Experiments,” WCAP-3726-1, July 1967.
59. Davidson, S. L., et al., “Assessment of Clad Flattening and Densification Power Spike Factor Elimination in Westinghouse Nuclear Fuel,” WCAP-13589-A (Proprietary) and WCAP-14297-A (Nonproprietary), March 1995.
60. Yarbrough, M. B., Liu, Y. S., Paterline, D. L., Hone, M. J., “APOLLO - A One Dimensional Neutron Theory Program,” WCAP-13524, Revision 1 (Proprietary), August 1994 and WCAP-14952-NP-A, Revision 1A (Nonproprietary), September 1977.
61. Letter, Peralta, J. D. (NRC) to Maurer, B. F. (Westinghouse), “Approval for Increase in Licensing Burnup Limit to 62,000 MWD/MTU (TAC No. MD1486),” May 25, 2006.
62. Not used.
63. Not used. 64. APP-GW-GLR-059/WCAP-16652-NP, “AP1000 Core & Fuel Design Technical Report,”
Revision 0.
65. Bierman, S. R., “Criticality Experiments with Neutron Flux Traps Containing Voids,” PNL-7167, Battelle Pacific Northwest Laboratory, April 1990.
66. Durst, B. M., et al., “Critical Experiments with 4.32 wt% 235U Enriched UO2 Rods in Highly Borated Water Lattices,” PNL-4267, Battelle Pacific Northwest Laboratory, August 1982.
67. Bierman, S. R., “Criticality Experiments with Fast Test Reactor Fuel Pins in Organic Moderator,” PNL-5803, Battelle Pacific Northwest Laboratory, December 1981.
68. Taylor, E. G., et al., “Saxton Plutonium Program Critical Experiments for the Saxton Partial Plutonium Core,” WCAP-3385-54, Westinghouse Electric Corp., Atomic Power Division, December 1965.

4. Reactor AP1000 Design Control Document
*NRC Staff approval is required prior to implementing a change in this information; see DCD Introduction Section 3.5. Tier 2 Material 4.3-44 Revision 19
Table 4.3-1 (Sheet 1 of 3)
[REACTOR CORE DESCRIPTION (FIRST CYCLE)]*
Active core
Equivalent diameter (in.) .............................................................................................................................. 119.7
Active fuel height first core (in.), cold ............................................................................................................ 168
Height-to-diameter ratio ............................................................................................................................... 1.40
Total cross section area (ft2) ........................................................................................................................ 78.14
H2O/U molecular ratio, cell, cold ................................................................................................................. 2.40
Reflector thickness and composition
Top - water plus steel (in.) .............................................................................................................................. ~10
Bottom - water plus steel (in.) ........................................................................................................................ ~10
Side - water plus steel (in.) ............................................................................................................................. ~15
Fuel assemblies
Number ........................................................................................................................................................... 157
Rod array .................................................................................................................................................. 17 x 17
Rods per assembly .......................................................................................................................................... 264
Rod pitch (in.) .............................................................................................................................................. 0.496
Overall transverse dimensions (in.) ................................................................................................. 8.426 x 8.426
Fuel weight, as UO2 (lb) ........................................................................................................................... 211,588
Zircaloy clad weight (lb) ........................................................................................................................... 43,105
Number of grids per assembly
Top and bottom - (Ni-Cr-Fe Alloy 718) .................................................................................................... 2(a)
Intermediate ................................................................................................................................ 8 ZIRLO™
Intermediate flow mixing (IFM) .................................................................................................. 4 ZIRLO™
Number of guide thimbles per assembly ........................................................................................................... 24
Composition of guide thimbles .............................................................................................................. ZIRLO™
Diameter of guide thimbles, upper part (in.) .............................................................................. 0.442 ID x 0.482 OD
Diameter of guide thimbles, lower part (in.) .............................................................................. 0.397 ID x 0.482 OD
Diameter of instrument guide thimbles (in.) ............................................................................... 0.442 ID x 0.482 OD
Note: (a) The top grid will be fabricated of nickel-chromium-iron Alloy 718.

4. Reactor AP1000 Design Control Document
*NRC Staff approval is required prior to implementing a change in this information; see DCD Introduction Section 3.5. Tier 2 Material 4.3-45 Revision 19
Table 4.3-1 (Sheet 2 of 3)
[REACTOR CORE DESCRIPTION (FIRST CYCLE)]*
Fuel rods
Number ...................................................................................................................................................... 41,448
Outside diameter (in.) .................................................................................................................................. 0.374
Diameter gap (in.) ..................................................................................................................................... 0.0065
Clad thickness (in.) .................................................................................................................................... 0.0225
Clad material ......................................................................................................................................... ZIRLO™
Fuel pellets
Material ............................................................................................................................................ UO2 sintered
Density (% of theoretical) (nominal) ............................................................................................................. 95.5
Fuel enrichments (weight %)
Region 1 ................................................................................................................................................. 2.35
Region 2 ................................................................................................................................................. 3.40
Region 3 ................................................................................................................................................. 4.45
Diameter (in.) ............................................................................................................................................ 0.3225
Length (in.) .................................................................................................................................................. 0.387
Mass of UO2 per ft of fuel rod (lb/ft) ........................................................................................................... 0.366
Rod Cluster Control Assemblies
Neutron absorber................................................................................................................................... Ag-In-Cd
Diameter (in.) ....................................................................................................................................... 0.341
Density (lb/in.3) .................................................................................................................... Ag-In-Cd 0.367
Cladding material ....................................................................................................... Type 304, cold-worked SS
Clad thickness (in.) .................................................................................................................................... 0.0185
Number of clusters, full-length ......................................................................................................................... 53
Number of absorber rods per cluster ................................................................................................................ 24
Gray Rod Cluster Assemblies
Neutron absorber........................................................................................................................ Ag-In-Cd/304SS
Diameter (in.) ....................................................................................................................................... 0.160
Density (lb/in.3) ............................................................................................. Ag-In-Cd 0.367 / 304SS 0.285
Cladding material ....................................................................................................... Type 304, cold-worked SS
Clad thickness (in.) .................................................................................................................................... 0.0185
Number of clusters, full-length ......................................................................................................................... 16
Number of absorber rods per cluster ..................................................................................... 12 Ag-In-Cd / 12 304SS

4. Reactor AP1000 Design Control Document
*NRC Staff approval is required prior to implementing a change in this information; see DCD Introduction Section 3.5. Tier 2 Material 4.3-46 Revision 19
Table 4.3-1 (Sheet 3 of 3)
[REACTOR CORE DESCRIPTION (FIRST CYCLE)]*
Discrete Burnable absorber rods (first core)
Number ......................................................................................................................................................... 1558
Material ................................................................................................................................... Borosilicate Glass
OD (in.) ....................................................................................................................................................... 0.381
Inner tube, OD (in.) ................................................................................................................................... 0.1815
Clad material .................................................................................................................................. Stainless Steel
Inner tube material ......................................................................................................................... Stainless Steel
B10 content (Mg/cm) ...................................................................................................................................... 6.24
Absorber length (in.) ...................................................................................................................................... 145
Integral Fuel Burnable Absorbers (first core)
Number ......................................................................................................................................................... 8832
Type .............................................................................................................................................................. IFBA
Material ........................................................................................................................................ Boride Coating
B10 Content (Mg/cm) .................................................................................................................................... 0.772
Absorber length (in.) ...................................................................................................................................... 152
Excess reactivity
Maximum fuel assembly K∞ (cold, clean, ................................................................................................... 1.328
unborated water)
Maximum core reactivity Keff (cold, zero power, .......................................................................................... 1.205
beginning of cycle, zero soluble boron)

4. Reactor AP1000 Design Control Document
*NRC Staff approval is required prior to implementing a change in this information; see DCD Introduction Section 3.5. Tier 2 Material 4.3-47 Revision 19
Table 4.3-2 (Sheet 1 of 2)
[NUCLEAR DESIGN PARAMETERS (FIRST CYCLE)]*
Core average linear power, including densification effects (kW/ft) ...................................................................... 5.72
Total heat flux hot channel factor, FQ ................................................................................................................... 2.60
Nuclear enthalpy rise hot channel factor, F NHΔ ................................................................................................. 1.65
Reactivity coefficients (a) Design Limits Best Estimate
Doppler-only power coefficients (see Figure 15.0.4-1) (pcm/% power)(b)
Upper curve .......................................................................................... -19.4 to -12.6 ............... -13.3 to -8.7
Lower curve .......................................................................................... -10.2 to -6.7 ................. -11.3 to -8.4
Doppler temperature coefficient (pcm/°F)(b) ............................................... -3.5 to -1.0 ..................... -2.1 to -1.3
Moderator temperature coefficient (pcm/°F)(b)............................................ 0 to -40 ................................ 0 to -35
Boron coefficient (pcm/ppm)(b) .................................................................... -13.5 to -5.0 ................. -10.5 to -6.9
Rodded moderator density (pcm/g/cm3)(b) ........................................................... ≤ 0.47x10⁵ ...................... ≤ 0.45x10⁵
Delayed neutron fraction and lifetime, β eff .................................................................................... 0.0075(0.0044)(c)
Prompt Neutron Lifetime, s ,* μ ........................................................................................................................ 19.8
Control rods
Rod requirements .......................................................................................................................... See Table 4.3-3
Maximum ejected rod worth ......................................................................................................... See Chapter 15
Bank worth HZP no overlap (pcm)(b) BOL, Xe Free EOL, Eq. Xe
MA Bank ...................................................................................................... 299 ............................................ 205
MB Bank ...................................................................................................... 195 ............................................ 250
MC Bank ...................................................................................................... 139 ............................................ 218
MD Bank ..................................................................................................... 312 ............................................ 198
M1 Bank ...................................................................................................... 856 ............................................ 632
M2 Bank ...................................................................................................... 933 .......................................... 1405
AO Bank ...................................................................................................... 2027 ........................................ 1571

4. Reactor AP1000 Design Control Document
*NRC Staff approval is required prior to implementing a change in this information; see DCD Introduction Section 3.5. Tier 2 Material 4.3-48 Revision 19
Table 4.3-2 (Sheet 2 of 2)
[NUCLEAR DESIGN PARAMETERS (FIRST CYCLE)]*
Typical Hot Channel Factors F NHΔ .................................................................................... BOL........................ EOL
Unrodded ....................................................................................................................... 1.40 ........................ 1.33
MA bank ........................................................................................................................ 1.46 ........................ 1.38
MA + MB banks ............................................................................................................ 1.46 ........................ 1.33
MA + MB + MC banks .................................................................................................. 1.50 ........................ 1.31
MA + MB + MC + MD banks ....................................................................................... 1.50 ........................ 1.37
MA + MB + MC + MD + M1 banks ............................................................................. 1.52 ........................ 1.45
AO bank ......................................................................................................................... 1.60 ........................ 1.52
Boron concentrations (ppm)
Zero power, keff = 0.99, cold(d) RCCAs out ................................................................................................... 1574
Zero power, keff = 0.99, hot(e) RCCAs out ..................................................................................................... 1502
Design basis refueling boron concentration ................................................................................................. 2700
Zero power, keff ≤ 0.95, cold(d) RCCAs in ....................................................................................................... 1179
Zero power, keff = 1.00, hot(e) RCCAs out ..................................................................................................... 1382
Full power, no xenon, keff = 1.0, hot RCCAs out ........................................................................................... 1184
Full power, equilibrium xenon, k = 1.0, hot RCCAs out ................................................................................ 827
Reduction with fuel burnup
First cycle (ppm/(GWD/MTU))(f) ......................................................................................... See Figure 4.3-3
Reload cycle (ppm/(GWD/MTU)) ............................................................................................................ ~40
Notes: (a) Uncertainties are given in subsection 4.3.3.3. (b) 1 pcm = 10-5 Δρ where Δρ is calculated form two statepoint values of keff by ln (k1/k2). (c) Bounding lower value used for safety analysis. (d) Cold means 68°F, 1 atm. (e) Hot means 557°F, 2250 psia. (f) 1 GWD = 1000 MWD. During the first cycle, a large complement of burnable absorbers is present which
significantly reduce the boron depletion rate compared to reload cycles.

4. Reactor AP1000 Design Control Document
*NRC Staff approval is required prior to implementing a change in this information; see DCD Introduction Section 3.5. Tier 2 Material 4.3-49 Revision 19
Table 4.3-3
[REACTIVITY REQUIREMENTS FOR ROD CLUSTER CONTROL ASSEMBLIES]*
Reactivity Effects (Percent)
BOL (First Cycle)
EOL (First Cycle)
EOL Representative
(Equilibrium Cycle)
1. Control requirements
Total power defect (%Δρ)(a)
Redistribution (adverse xenon only) (%Δρ)
Rod insertion allowance (%Δρ)
1.89
0.27
2.00
2.54
0.40
2.00
3.02
0.32
2.00
2. Total control (%Δρ) 4.16 4.94 5.34
3. Estimated RCCA worth (69 rods)
a. All full-length assemblies inserted (%Δρ)
b. All assemblies but one (highest worth inserted (%Δρ)
12.69
10.49
10.89
9.27
10.64
9.35
4. Estimated RCCA credit with 7 percent adjustment to accommodate uncertainties, item 3b minus 7 percent (%Δρ)
9.76 8.62 8.70
5. Shutdown margin available, item 4 minus item 2 (%Δρ)(b)
5.60 3.68 3.36
Notes: (a) Includes void effects. (b) The design basis minimum shutdown is 1.60 percent.

4. Reactor AP1000 Design Control Document
Tier 2 Material 4.3-50 Revision 19
Table 4.3-4 not used.

4. Reactor AP1000 Design Control Document
Tier 2 Material 4.3-51 Revision 19
Table 4.3-5
STABILITY INDEX FOR PRESSURIZED WATER REACTOR CORES WITH A 12-FOOT HEIGHT
Burnup (MWD/MTU) FZ
CB (ppm)
Axial Stability Index (h-1)
Experiment Calculated
1550 1.34 1065 -0.0410 -0.0320
7700 1.27 700 -0.0140 -0.0060
5090(a) -0.0325 -0.0255
Radial Stability Index (h-1)
Experiment Calculated
2250(b) -0.0680 -0.0700
Notes: (a) Four-loop plant, 12-foot core in cycle 1, axial stability test (b) Four-loop plant, 12-foot core in cycle 1, radial (X-Y) stability test

4. Reactor AP1000 Design Control Document
Tier 2 Material 4.3-52 Revision 19
Table 4.3-6
TYPICAL NEUTRON FLUX LEVELS (n/cm2/s) AT FULL POWER
E ≥ 1.0 MeV 1.00 MeV > E ≥5.53 KeV
5.53 KeV > E ≥0.625 eV E < 0.625 eV
Core center 1.12x10¹⁴ 1.76x10¹⁴ 1.28x10¹⁴ 5.47x10¹³
Core outer radius at midheight 3.86x10¹³ 6.08x10¹³ 4.42x10¹³ 1.83x10¹³
Core top, on axis 3.02x10¹³ 4.75x10¹³ 3.46x10¹³ 2.17x10¹³
Core bottom, on axis 2.92x10¹³ 4.59x10¹³ 3.34x10¹³ 2.40x10¹³
Pressure vessel ID azimuthal peak 4.71x10¹⁰ 8.4x10¹⁰ 5.56x10¹⁰ 5.32x10¹⁰

4. Reactor AP1000 Design Control Document
Tier 2 Material 4.3-53 Revision 19
Table 4.3-7
COMPARISON OF MEASURED AND CALCULATED DOPPLER DEFECTS
Plant Fuel Core Burnup (MWD/MTU)
Measured (pcm)(a)
Calculated (pcm)
1 Air filled 1800 1700 1710
2 Air filled 7700 1300 1440
3 Air and helium filled 8460 1200 1210
Note: (a) pcm = 105 x ln (k2/k1)

4. Reactor AP1000 Design Control Document
Tier 2 Material 4.3-54 Revision 19
Table 4.3-8
COMPARISON OF MEASURED AND CALCULATED AG-IN-CD ROD WORTH
2-Loop Plant, 121 Assemblies, 10-ft Core Measured (pcm) Calculated (pcm)
Group B 1885 1893
Group A 1530 1649
Shutdown group 3050 2917
ESADA critical, 0.69-in. pitch(a) 2 w/o PuO2, 8% Pu-240, 9 control rods
6.21-in. rod separation 2250 2250
2.07-in. rod separation 4220 4160
1.38-in. rod separation 4100 4019
Benchmark Critical Experiment Hafnium Control Rod Worth
Control Rod
Configuration
No. of Fuel Rods
Measured(b)
Worth (Δppm B-10)
Calculated(b)
Worth (Δppm B-10)
9 hafnium rods 1192 138.3 141.0
Notes: (a) Report in WCAP-3726-1 (Reference 58). (b) Calculated and measured worth are given in terms of an equivalent charge in B-10 concentration.

4. Reactor AP1000 Design Control Document
Tier 2 Material 4.3-55 Revision 19
Table 4.3-9
COMPARISON OF MEASURED AND CALCULATED MODERATOR COEFFICIENTS AT HZP, BOL
Plant Type/ Control Bank Configuration
Measured αiso(a)
(pcm/°F) Calculated αiso
(pcm/°F)
3-loop, 157-assembly, 12-ft core
D at 160 steps -0.50 -0.50
D in, C at 190 steps -3.01 -2.75
D in, C at 28 steps -7.67 -7.02
B, C, and D in -5.16 -4.45
2-loop, 121-assembly, 12-ft core
D at 180 steps +0.85 +1.02
D in, C at 180 steps -2.40 -1.90
C and D in, B at 165 steps -4.40 -5.58
B, C, and D in, A at 174 steps -8.70 -8.12
4-loop, 193-assembly, 12-ft core
ARO -0.52 -1.2
D in -4.35 -5.7
D and C in -8.59 -10.0
D, C, and B in -10.14 -10.55
D, C, B, and A in -14.63 -14.45
Note: (a) Isothermal coefficients, which include the Doppler effect in the fuel
F T/k
kln 10 = 1
25iso °Δα

4. Reactor AP1000 Design Control Document
Tier 2 Material 4.3-56 Revision 19
Region Enrichment 1 2.35 w/o 2 3.40 w/o 3 4.45 w/o
Figure 4.3-1
Fuel Loading Arrangement

4. Reactor AP1000 Design Control Document
Tier 2 Material 4.3-57 Revision 19
Figure 4.3-2
Typical Production and Consumption of Higher Isotopes

4. Reactor AP1000 Design Control Document
Tier 2 Material 4.3-58 Revision 19
0
200
400
600
800
1000
1200
1400
0 5000 10000 15000 20000 25000
CYCLE BURNUP (MWD/MTU)
Figure 4.3-3
Cycle 1 Soluble Boron Concentration Versus Burnup

4. Reactor AP1000 Design Control Document
Tier 2 Material 4.3-59 Revision 19
Figure 4.3-4a
Cycle 1 Assembly Burnable Absorber Patterns

4. Reactor AP1000 Design Control Document
Tier 2 Material 4.3-60 Revision 19
Figure 4.3-4b (Sheet 1 of 2)
Cycle 1 Assembly Burnable Absorber Patterns

4. Reactor AP1000 Design Control Document
Tier 2 Material 4.3-61 Revision 19
Figure 4.3-4b (Sheet 2 of 2)
Cycle 1 Assembly Burnable Absorber Patterns

4. Reactor AP1000 Design Control Document
Tier 2 Material 4.3-62 Revision 19
Figure 4.3-5
Burnable Absorber, Primary, and Secondary Source Assembly Locations

4. Reactor AP1000 Design Control Document
Tier 2 Material 4.3-63 Revision 19
1.279
1.154 1.273
1.268 1.142 1.250
1.137 1.250 1.111 1.193
1.254 1.113 1.203 1.033 0.859
1.161 1.168 1.026 1.041 0.630
0.957 0.913 0.815 0.561
0.541 0.436
CALCULATED F-DELTA-H = 1.406
KEY: VALUE REPRESENTS ASSEMBLY
RELATIVE POWER
Figure 4.3-6
Normalized Power Density Distribution Near Beginning of Life, Unrodded Core,
Hot Full Power, No Xenon

4. Reactor AP1000 Design Control Document
Tier 2 Material 4.3-64 Revision 19
1.291
1.159 1.285
1.279 1.147 1.260
1.140 1.259 1.114 1.200
1.258 1.112 1.206 1.028 0.868
1.153 1.167 1.015 1.030 0.632
0.959 0.903 0.806 0.558
0.542 0.436
CALCULATED F-DELTA-H = 1.403
KEY: VALUE REPRESENTS ASSEMBLY
RELATIVE POWER
Figure 4.3-7
Normalized Power Density Distribution Near Beginning of Life, Unrodded Core,
Hot Full Power, Equilibrium Xenon
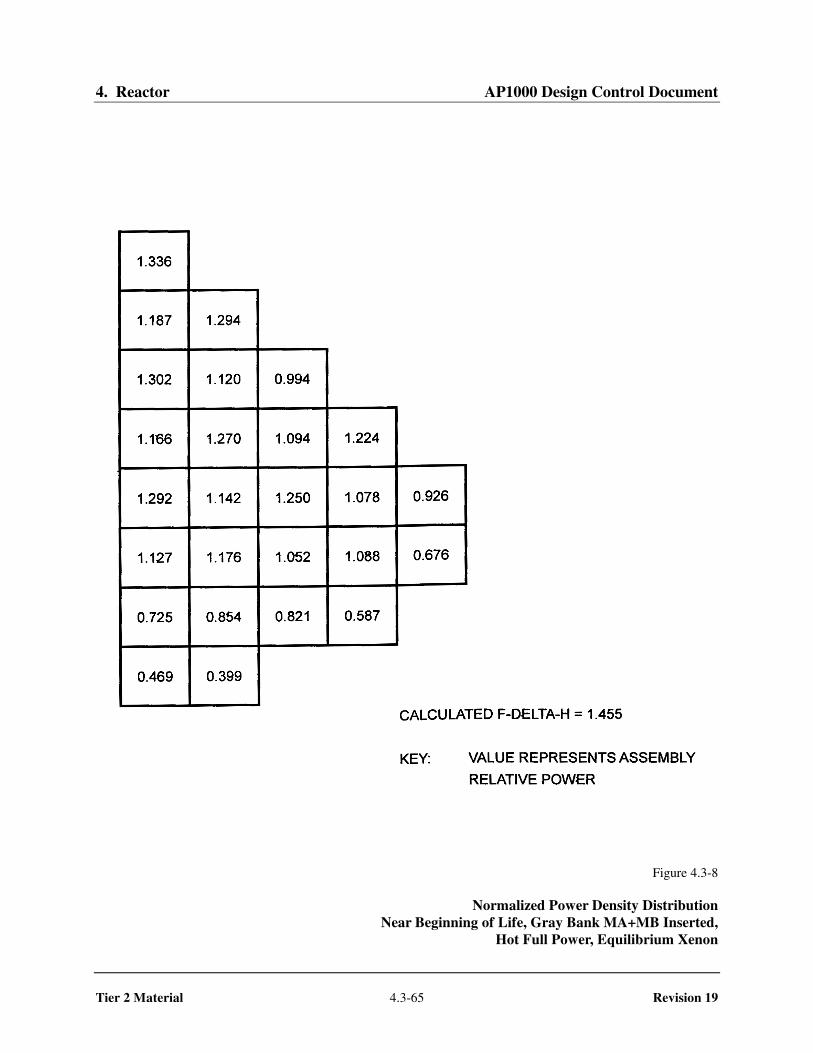
4. Reactor AP1000 Design Control Document
Tier 2 Material 4.3-65 Revision 19
Figure 4.3-8
Normalized Power Density Distribution Near Beginning of Life, Gray Bank MA+MB Inserted,
Hot Full Power, Equilibrium Xenon

4. Reactor AP1000 Design Control Document
Tier 2 Material 4.3-66 Revision 19
1.091
1.182 1.091
1.090 1.179 1.089
1.173 1.086 1.170 1.074
1.069 1.154 1.077 1.123 0.908
1.104 1.023 1.096 1.170 0.745
0.868 0.954 0.923 0.681
0.588 0.491
CALCULATED F-DELTA-H = 1.333
KEY: VALUE REPRESENTS ASSEMBLY
RELATIVE POWER
Figure 4.3-9
Normalized Power Density Distribution Near Middle of Life, Unrodded Core,
Hot Full Power, Equilibrium Xenon

4. Reactor AP1000 Design Control Document
Tier 2 Material 4.3-67 Revision 19
0.977
1.091 0.981
0.985 1.100 0.992
1.110 0.998 1.114 1.000
1.012 1.128 1.014 1.099 0.890
1.137 1.023 1.111 1.143 0.774
0.978 1.114 0.995 0.737
0.801 0.665
CALCULATED F-DELTA-H = 1.324
KEY: VALUE REPRESENTS ASSEMBLY
RELATIVE POWER
Figure 4.3-10
Normalized Power Density Distribution Near End of Life, Unrodded Core,
Hot Full Power, Equilibrium Xenon

4. Reactor AP1000 Design Control Document
Tier 2 Material 4.3-68 Revision 19
Figure 4.3-11
Normalized Power Density Distribution Near End of Life, Gray Bank MA+MB Inserted,
Hot Full Power, Equilibrium Xenon

4. Reactor AP1000 Design Control Document
Tier 2 Material 4.3-69 Revision 19
1.136
1.145 1.175
1.167 1.208 1.263
1.178 1.232 1.315
1.185 1.253 1.341 1.380 1.378
1.188 1.277 1.370 1.384
1.187 1.258 1.330 1.334 1.352 1.387 1.364
1.185 1.256 1.324 1.330 1.348 1.384 1.363 1.365
1.189 1.276 1.358 1.378 1.394 1.396
1.185 1.255 1.323 1.329 1.348 1.383 1.362 1.365 1.396 1.364
1.186 1.257 1.328 1.333 1.350 1.385 1.363 1.362 1.393 1.361 1.361
1.186 1.275 1.367 1.382 1.384 1.382 1.381 1.382
1.182 1.250 1.338 1.377 1.375 1.381 1.349 1.345 1.375 1.344 1.347 1.378 1.371
1.175 1.228 1.311 1.376 1.366 1.330 1.326 1.354 1.325 1.328 1.363 1.372
1.163 1.204 1.258 1.310 1.337 1.325 1.320 1.318 1.323 1.333 1.306 1.253
1.140 1.171 1.203 1.227 1.248 1.272 1.253 1.250 1.271 1.249 1.252 1.269 1.244 1.222 1.198 1.165
1.131 1.140 1.162 1.173 1.180 1.183 1.182 1.180 1.184 1.179 1.180 1.180 1.176 1.169 1.157 1.134 1.124
Figure 4.3-12
Rodwise Power Distribution in a Typical Assembly (G-9) Near Beginning of Life
Hot Full Power, Equilibrium Xenon, Unrodded Core

4. Reactor AP1000 Design Control Document
Tier 2 Material 4.3-70 Revision 19
0.935
0.930 0.935
0.930 0.944 0.969
0.931 0.951 1.000
0.932 0.958 1.008 1.024 1.010
0.935 0.979 1.019 1.022
0.935 0.960 1.003 0.992 0.996 1.019 0.997
0.935 0.962 1.002 0.990 0.995 1.019 0.997 0.998
0.949 0.991 1.020 1.024 1.028 1.029
0.936 0.963 1.003 0.990 0.995 1.019 0.998 0.998 1.029 0.999
0.936 0.961 1.004 0.993 0.997 1.020 0.998 0.998 1.028 0.998 0.999
0.937 0.981 1.020 1.024 1.021 1.020 1.021 1.022
0.934 0.960 1.010 1.026 1.012 1.024 0.998 0.997 1.026 0.997 0.999 1.025 1.014
0.933 0.953 1.002 1.026 1.021 0.994 0.992 1.022 0.993 0.995 1.022 1.028
0.933 0.946 0.972 1.002 1.011 1.006 1.005 1.006 1.007 1.013 1.005 0.975
0.933 0.938 0.947 0.954 0.961 0.982 0.963 0.965 0.994 0.966 0.964 0.984 0.963 0.956 0.949 0.941
0.939 0.933 0.933 0.934 0.936 0.939 0.938 0.939 0.952 0.939 0.939 0.940 0.937 0.936 0.936 0.936 0.942
Figure 4.3-13
Rodwise Power Distribution in a Typical Assembly (G-9) Near End of Life
Hot Full Power, Equilibrium Xenon, Unrodded Core

4. Reactor AP1000 Design Control Document
Tier 2 Material 4.3-71 Revision 19
Figure 4.3-14
Maximum FQ x Power Versus Axial Height During Normal Operation

4. Reactor AP1000 Design Control Document
Tier 2 Material 4.3-72 Revision 19
Figure 4.3-15
Typical Comparison Between Calculated and Measured Relative Fuel Assembly Power Distribution

4. Reactor AP1000 Design Control Document
Tier 2 Material 4.3-73 Revision 19
Figure 4.3-16
Typical Calculated Versus Measured Axial Power Distribution

4. Reactor AP1000 Design Control Document
Tier 2 Material 4.3-74 Revision 19
Figure 4.3-17
Measured FQ Values Versus Axial Offset for Full Power Rod Configurations
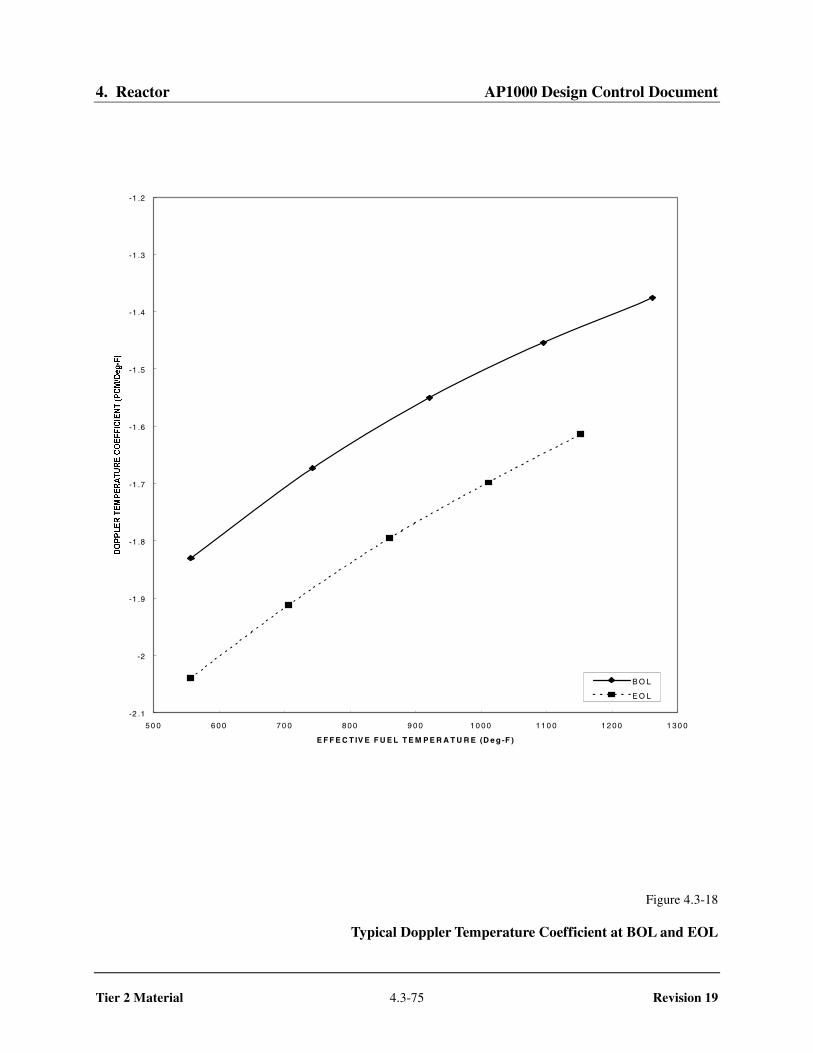
4. Reactor AP1000 Design Control Document
Tier 2 Material 4.3-75 Revision 19
-2 .1
-2
-1 .9
-1 .8
-1 .7
-1 .6
-1 .5
-1 .4
-1 .3
-1 .2
5 0 0 6 0 0 7 0 0 8 0 0 9 0 0 1 0 0 0 1 1 0 0 1 2 0 0 1 3 0 0
E F F E C T IV E F U E L T E M P E R A T U R E (D e g -F )
B O L
E O L
Figure 4.3-18
Typical Doppler Temperature Coefficient at BOL and EOL

4. Reactor AP1000 Design Control Document
Tier 2 Material 4.3-76 Revision 19
-1 4
-1 3
-1 2
-1 1
-1 0
-9
-8
-7
-6
0 1 0 2 0 3 0 4 0 5 0 6 0 7 0 8 0 9 0 1 0 0
P O W E R L E V E L (P E R C E N T )
B O L
E O L
Figure 4.3-19
Typical Doppler-Only Power Coefficient at BOL and EOL

4. Reactor AP1000 Design Control Document
Tier 2 Material 4.3-77 Revision 19
-1 2 0 0
-1 0 0 0
-8 0 0
-6 0 0
-4 0 0
-2 0 0
0
0 1 0 2 0 3 0 4 0 5 0 6 0 7 0 8 0 9 0 1 0 0
P O W E R L E V E L (P E R C E N T )
B O L
E O L
Figure 4.3-20
Typical Doppler-Only Power Defect at BOL and EOL

4. Reactor AP1000 Design Control Document
Tier 2 Material 4.3-78 Revision 19
-1 0
-5
0
5
0 1 0 0 2 0 0 3 0 0 4 0 0 5 0 0 6 0 0
M O D E R A T O R T E M P E R A T U R E (D E G R E E F )
1 0 0 0 P P M
1 5 0 0 P P M
2 0 0 0 P P M
2 5 0 0 P P M
Figure 4.3-21
Typical Moderator Temperature Coefficient at BOL, Unrodded

4. Reactor AP1000 Design Control Document
Tier 2 Material 4.3-79 Revision 19
-2 5
-2 0
-1 5
-1 0
- 5
0
5
0 1 0 0 2 0 0 3 0 0 4 0 0 5 0 0 6 0 0
M O D E R A T O R T E M P E R A T U R E (D E G R E E F )
0 P P M
5 0 0 P P M
1 0 0 0 P P M
Figure 4.3-22
Typical Moderator Temperature Coefficient at EOL

4. Reactor AP1000 Design Control Document
Tier 2 Material 4.3-80 Revision 19
-1 0
-5
0
5
1 0 0 0 1 5 0 0 2 0 0 0 2 5 0 0
S O L U B L E B O R O N C O N C E N T R A T IO N (P P M )
6 8 F
2 0 0 F
4 0 0 F
5 5 7 F
Figure 4.3-23
Typical Moderator Temperature Coefficient as a Function of Boron Concentration at BOL, Unrodded

4. Reactor AP1000 Design Control Document
Tier 2 Material 4.3-81 Revision 19
-35
-30
-25
-20
-15
-10
0 500 0 100 00 150 00 200 00 250 00
E xp os ure (M W D /TE M )
Figure 4.3-24
Typical Hot Full Power Temperature Coefficient Versus Cycle Burnup
Cycle Burnup

4. Reactor AP1000 Design Control Document
Tier 2 Material 4.3-82 Revision 19
- 3 5
- 3 0
- 2 5
- 2 0
- 1 5
- 1 0
0 1 0 2 0 3 0 4 0 5 0 6 0 7 0 8 0 9 0 1 0 0
P O W E R L E V E L( P E R C E N T )
B O L
E O L
Figure 4.3-25
Typical Total Power Coefficient at BOL and EOL
POWER

4. Reactor AP1000 Design Control Document
Tier 2 Material 4.3-83 Revision 19
-2 5 0 0
-2 0 0 0
-1 5 0 0
-1 0 0 0
-5 0 0
0
0 1 0 2 0 3 0 4 0 5 0 6 0 7 0 8 0 9 0 1 0 0
P O W E R L E V E L (P E R C E N T )
B O L
E O L
Figure 4.3-26
Typical Total Power Defect at BOL and EOL

4. Reactor AP1000 Design Control Document
Tier 2 Material 4.3-84 Revision 19
Figure 4.3-27
Rod Cluster Control Assembly Pattern

4. Reactor AP1000 Design Control Document
Tier 2 Material 4.3-85 Revision 19
0
10
20
30
40
0 50 100 150 200 250
STEP WITHDRAWN
DIFFENTIAL ROD WORTH ( PCM/STEP )
Figure 4.3-28
Typical Accidental Simultaneous Withdrawal of Two Control Banks at EOL, HZP,
Moving in the Same Plane
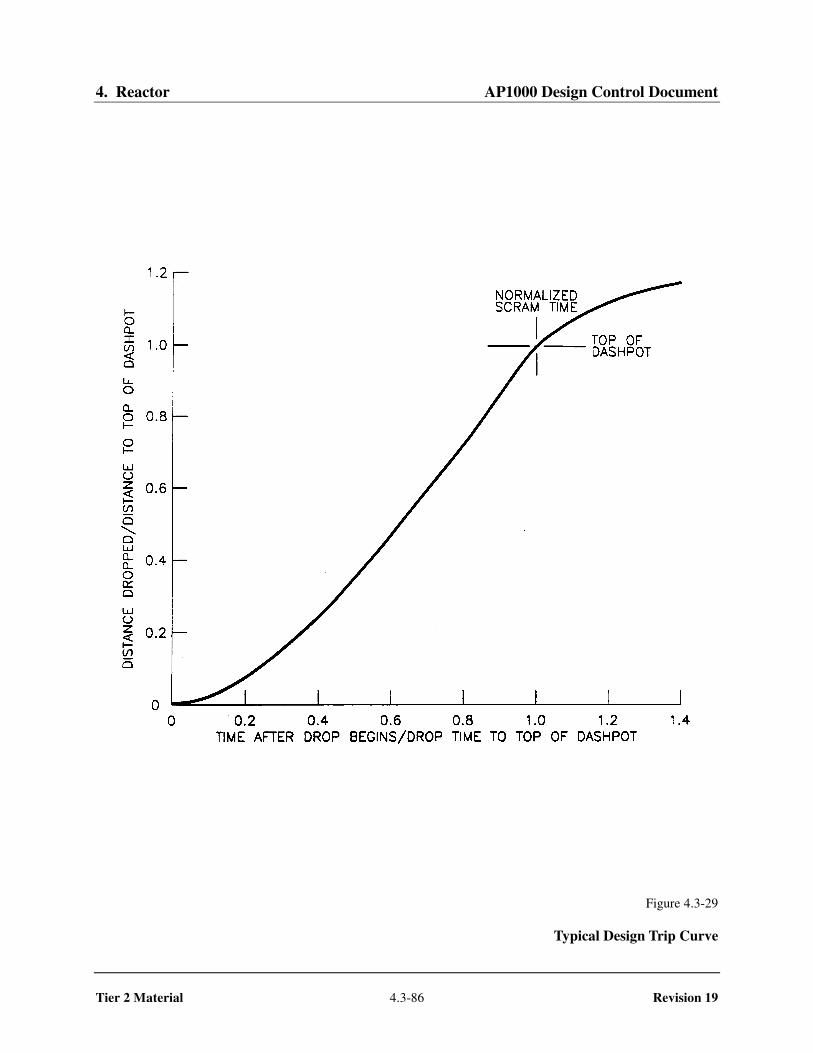
4. Reactor AP1000 Design Control Document
Tier 2 Material 4.3-86 Revision 19
Figure 4.3-29
Typical Design Trip Curve

4. Reactor AP1000 Design Control Document
Tier 2 Material 4.3-87 Revision 19
Figure 4.3-30
Typical Normalized Rod Worth Versus Percent Insertion All Rods Inserting Less Most Reactive Stuck Rod

4. Reactor AP1000 Design Control Document
Tier 2 Material 4.3-88 Revision 19
Figure 4.3-31
X-Y Xenon Test Thermocouple Response Quadrant Tilt Difference Versus Time

4. Reactor AP1000 Design Control Document
Tier 2 Material 4.3-89 Revision 19
Figure 4.3-32
Calculated and Measured Doppler Defect and Coefficients at BOL, 2-Loop Plant, 121 Assemblies, 12-foot Core