400 pigg presentation
TRANSCRIPT

1
Board Presentations: Tips & Tools for Presenting Financial Information EffectivelyJody PiggAssociate Vice PresidentFinance Practice

2
Day Before Board Meeting

3
Board Meeting Day

4
Presentation Objectives
Clear, Concise and Consistent Communication that…Creates a common impression of the following:
It’s more about what they hear than what you say!
Opportunity Performance PriorityUrgency
5
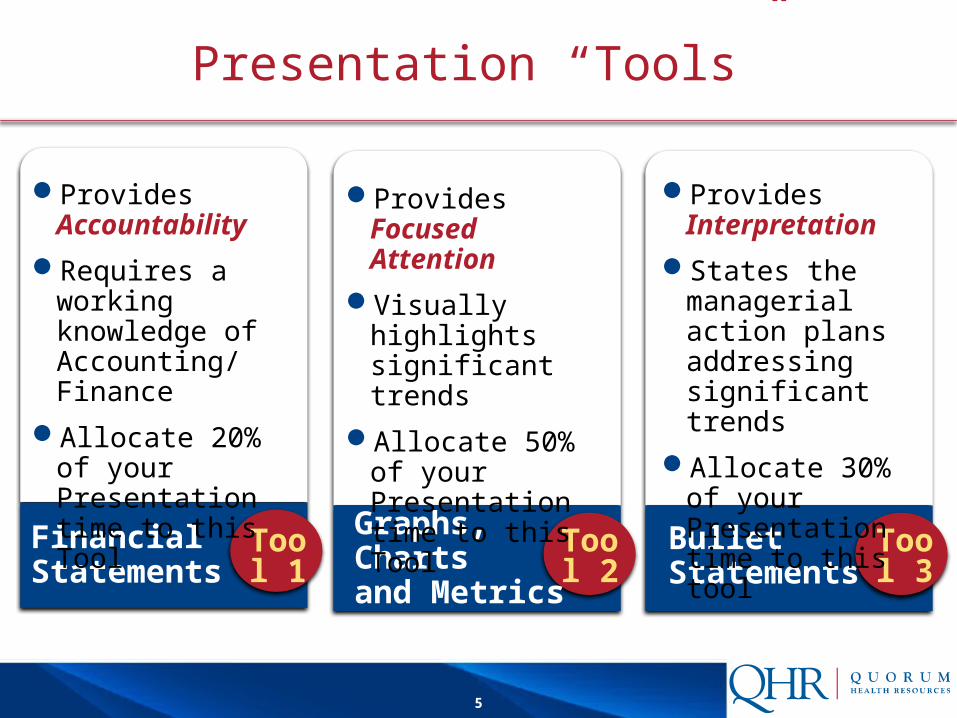
Presentation “Tools”
Tool 1
Financial Statements
Provides Accountability
Requires a working knowledge of Accounting/ Finance
Allocate 20% of your Presentation time to this Tool
Tool 3
Bullet Statements
Provides Interpretation
States the managerial action plans addressing significant trends
Allocate 30% of your Presentation time to this tool
Tool 2
Graphs, Charts and Metrics
Provides Focused Attention
Visually highlights significant trends
Allocate 50% of your Presentation time to this Tool
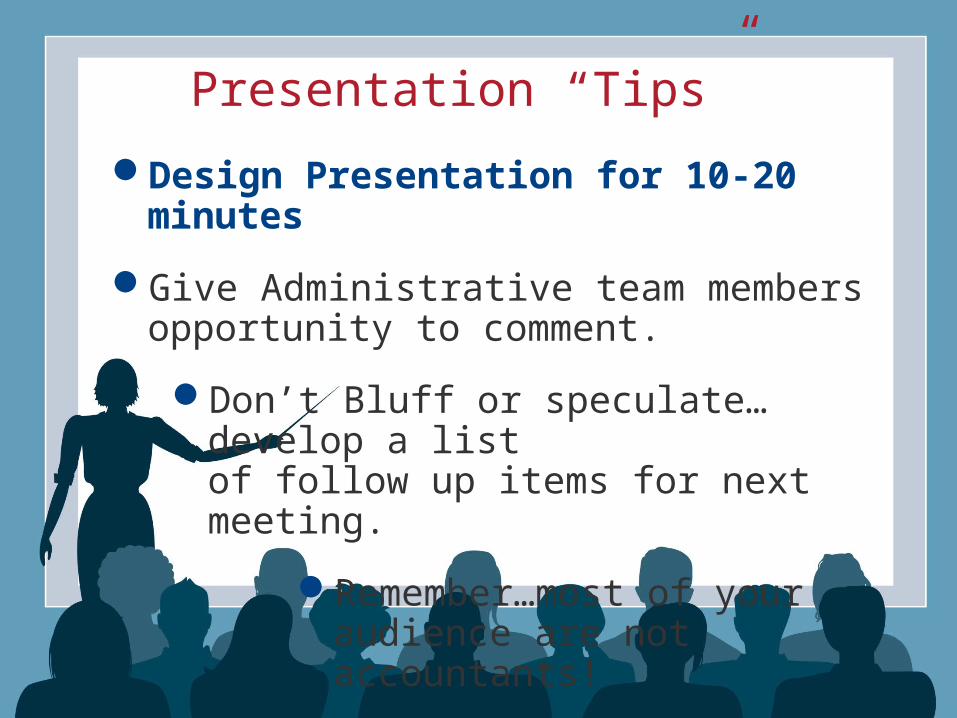
Presentation “Tips”
Design Presentation for 10-20 minutes
Give Administrative team members opportunity to comment.
Don’t Bluff or speculate…develop a list of follow up items for next meeting.
Remember…most of your audience are not accountants!

7
Presentation “Focus”EBITDA
I tell you what 'ibi dah‘ is. Tank you veddy much!

8
EBITDAThe Accountant’s Understanding
Earnings Before Interest, Taxes, Depreciation and Amortization…
So What?

9
EBITDAThe Board Trustee Understanding
That’s What!!!
Excess Earnings created from day to day operations available for the following:
Build Cash Reserves
Make Debt Service
Payments
Fund Building,
Equipment and related
Infrastructure needs

10
Financial Stability MetricsIt’s all about the BASE, ‘bout the BASE…
Stressed Stable Strong
Cash < 50 Days
50-150 days
> 150 Days
Average Age of Plant > 12 years
8-12 years
< 8 years
Long Term Debt as a %
Total Assets > 50% 25%-50% < 25%
Net Revenues >75% 50%-75% < 50%
Debt Service Coverage < 1.5 times
1.5-3 times
> 3 times
EBITDA <5% 5% - 15% >15%

11
Financial Stability MetricsFive Year AverageStressed Stable Strong
Cash 88
Average Age of Plant 10.2 years
Long Term Debt as a %
Total Assets 20%
Net Revenues 48%
Debt Service Coverage 2.4 times
EBITDA 8.6%

12
Financial Stability MetricsCurrent Fiscal Year
Stressed Stable Strong
Cash 55
Average Age of Plant 12.1 years
Long Term Debt as a %
Total Assets 32%
Net Revenues 60%
Debt Service Coverage 1.25
EBITDA 2%

13
EBITDABuild up the BASE!
EBITDA
Date: 12/15/2014 For
Month 11/30/2014
Hospital: Our Hospital RVP: John DOELocation:
Anywhere, USA AVP: Ricky ROE
RFA: Heidie HOETarget Annual EBITDA $2,000,000
Last Twelve Months EBITDA: $150,000Last Twelve Months EBITDA as of FYE: $190,000
Most significant Initiatives to Improve EBITDA:
Description of Initiative Annual Financial
Impact Current Month's Status update for Initiative
Amount Achieved to
date
% of Initiative Achieved to date
1 Geropsych $1,000,000 Target start date of July 1, 2015 $0 0%
2 100% Participation in Hospitalist Program $1,000,000 Target start date of March 31, 2015 $0 0%
Total of Initiatives $2,000,000 $0 0%
When is expected date for Facility to target EBITDA 12/31/15
What is frequency of oversight meetings/calls with this client Monthly

14
The Desired Effect…
Not to “ENCAGE” the Board

15
The Desired Effect…
Not to “ENRAGE” the
Board

16
The Desired Effect…
But to “ENGAGE” the Board


18
Intended for internal guidance only, and not as recommendations for specific situations. Readers should
consult a qualified attorney for specific legal guidance.