4e.4na -chapt 5 development and the quality of life
TRANSCRIPT

8/8/2019 4E.4NA -Chapt 5 Development and the Quality of Life
http://slidepdf.com/reader/full/4e4na-chapt-5-development-and-the-quality-of-life 1/63
Prepared by Mdm Roziah Ismail,edited by Mrs Sandra Tan
1
1. Definition of development1. Definition of development
2. Characteristics of development2. Characteristics of development
3. The types of development indicators3. The types of development indicators
4. The differences between the DCs and4. The differences between the DCs and
the LDCsthe LDCs
5. The Core5. The Core--Periphery Model & itsPeriphery Model & its
limitationslimitations6. Factors affecting development6. Factors affecting development
7. Strategies for development7. Strategies for development

8/8/2019 4E.4NA -Chapt 5 Development and the Quality of Life
http://slidepdf.com/reader/full/4e4na-chapt-5-development-and-the-quality-of-life 2/63
Prepared by Mdm Roziah Ismail,edited by Mrs Sandra Tan
2
What is development?What is development?
It is the progressive process which aimsIt is the progressive process which aimsto achieve economic growth and createto achieve economic growth and create
an environment for individuals to enjoy aan environment for individuals to enjoy adecent standard of living and quality ofdecent standard of living and quality oflife.life.
8/8/2019 4E.4NA -Chapt 5 Development and the Quality of Life
http://slidepdf.com/reader/full/4e4na-chapt-5-development-and-the-quality-of-life 3/63
Prepared by Mdm Roziah Ismail,edited by Mrs Sandra Tan
3
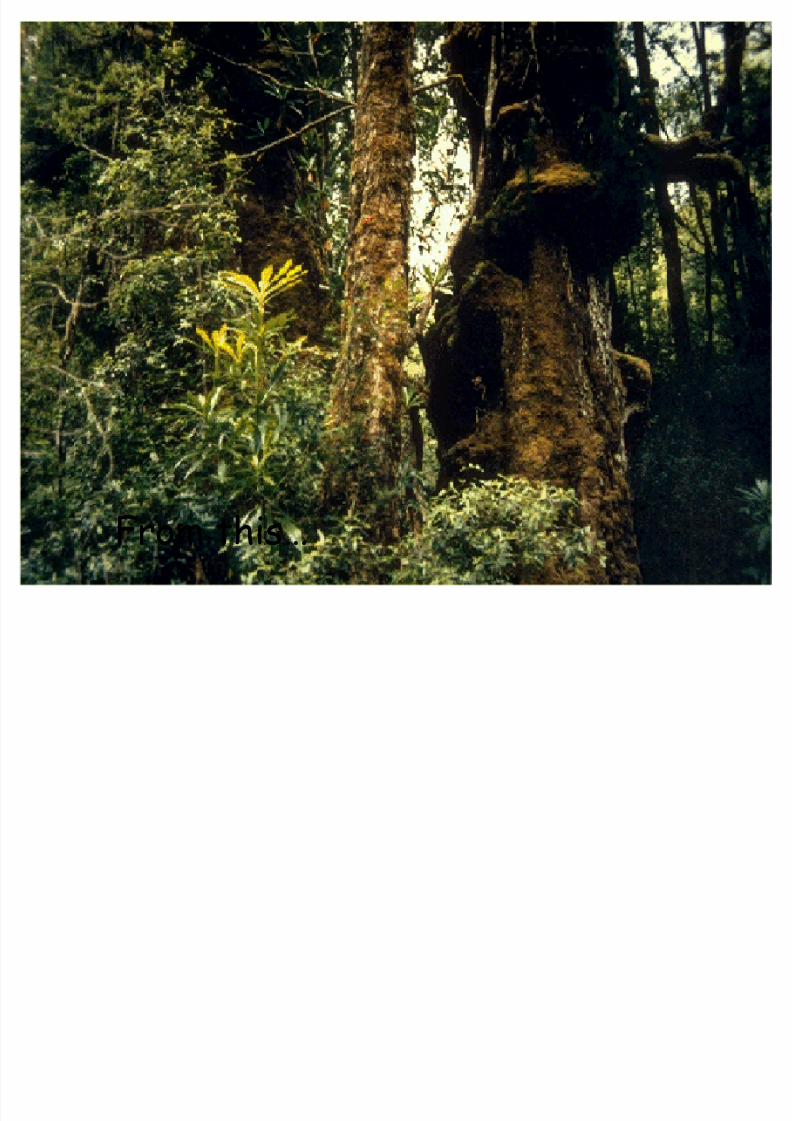
From this«

8/8/2019 4E.4NA -Chapt 5 Development and the Quality of Life
http://slidepdf.com/reader/full/4e4na-chapt-5-development-and-the-quality-of-life 4/63
Prepared by Mdm Roziah Ismail,edited by Mrs Sandra Tan
4
Development is a process of change thatDevelopment is a process of change that
improves theimproves the wellbeingwellbeing of a society.of a society.-- material wealthmaterial wealth
-- quality of lifequality of life
TransTrans--Amazon HighwayAmazon Highway
T o this«

8/8/2019 4E.4NA -Chapt 5 Development and the Quality of Life
http://slidepdf.com/reader/full/4e4na-chapt-5-development-and-the-quality-of-life 5/63
Prepared by Mdm Roziah Ismail,edited by Mrs Sandra Tan
5
Building of a Dam and a ReservoirBuilding of a Dam and a Reservoir

8/8/2019 4E.4NA -Chapt 5 Development and the Quality of Life
http://slidepdf.com/reader/full/4e4na-chapt-5-development-and-the-quality-of-life 6/63
Prepared by Mdm Roziah Ismail,edited by Mrs Sandra Tan
6
Development is a process of change thatDevelopment is a process of change that
improves theimproves the wellbeingwellbeing of a society.of a society.-- material wealthmaterial wealth
-- quality of lifequality of life

8/8/2019 4E.4NA -Chapt 5 Development and the Quality of Life
http://slidepdf.com/reader/full/4e4na-chapt-5-development-and-the-quality-of-life 7/63
Prepared by Mdm Roziah Ismail,edited by Mrs Sandra Tan
7

8/8/2019 4E.4NA -Chapt 5 Development and the Quality of Life
http://slidepdf.com/reader/full/4e4na-chapt-5-development-and-the-quality-of-life 8/63
Prepared by Mdm Roziah Ismail,edited by Mrs Sandra Tan 8

8/8/2019 4E.4NA -Chapt 5 Development and the Quality of Life
http://slidepdf.com/reader/full/4e4na-chapt-5-development-and-the-quality-of-life 9/63
Prepared by Mdm Roziah Ismail,edited by Mrs Sandra Tan 9

8/8/2019 4E.4NA -Chapt 5 Development and the Quality of Life
http://slidepdf.com/reader/full/4e4na-chapt-5-development-and-the-quality-of-life 10/63
Prepared by Mdm Roziah Ismail,edited by Mrs Sandra Tan 10

8/8/2019 4E.4NA -Chapt 5 Development and the Quality of Life
http://slidepdf.com/reader/full/4e4na-chapt-5-development-and-the-quality-of-life 11/63
Prepared by Mdm Roziah Ismail,edited by Mrs Sandra Tan 11
8/8/2019 4E.4NA -Chapt 5 Development and the Quality of Life
http://slidepdf.com/reader/full/4e4na-chapt-5-development-and-the-quality-of-life 12/63
Prepared by Mdm Roziah Ismail,edited by Mrs Sandra Tan 12
Other Examples of Development
Green Revolution in India ( the use of modern
technology and improved rice grains resulted
in an increase in crop yields and farmers¶income and more comfortable lives.
The building of beach resorts in Bintan
Indonesia helped to increase theincome and living conditions of the local
people.

8/8/2019 4E.4NA -Chapt 5 Development and the Quality of Life
http://slidepdf.com/reader/full/4e4na-chapt-5-development-and-the-quality-of-life 13/63
Prepared by Mdm Roziah Ismail,edited by Mrs Sandra Tan 13
So how do we define that a country is
developed or not developed?
What are the indicators that we look at?
Worksheet

8/8/2019 4E.4NA -Chapt 5 Development and the Quality of Life
http://slidepdf.com/reader/full/4e4na-chapt-5-development-and-the-quality-of-life 14/63
Prepared by Mdm Roziah Ismail,edited by Mrs Sandra Tan 14
What is development?What is development?
It is the progressive process which aimsIt is the progressive process which aimsto achieve economic growth and createto achieve economic growth and create
an environment for individuals to enjoy aan environment for individuals to enjoy adecent standard of living and quality ofdecent standard of living and quality oflife.life.

8/8/2019 4E.4NA -Chapt 5 Development and the Quality of Life
http://slidepdf.com/reader/full/4e4na-chapt-5-development-and-the-quality-of-life 15/63
Prepared by Mdm Roziah Ismail,edited by Mrs Sandra Tan 15
Development
Economic growth
Standard of Living Quality of Life
People¶s level of wealth
Goods and services in
the living environment People¶s well-being

8/8/2019 4E.4NA -Chapt 5 Development and the Quality of Life
http://slidepdf.com/reader/full/4e4na-chapt-5-development-and-the-quality-of-life 16/63
Prepared by Mdm Roziah Ismail,edited by Mrs Sandra Tan 16
Economic growth Standard of Living Quality of Life
Employment
Wages
Types of industries
Access to :
Electricity supplyClean water
Healthcare services
& facilities
Efficient &
affordable public& private transport
Political &
religious freedom
Environmental health
Happiness

8/8/2019 4E.4NA -Chapt 5 Development and the Quality of Life
http://slidepdf.com/reader/full/4e4na-chapt-5-development-and-the-quality-of-life 17/63
Prepared by Mdm Roziah Ismail,edited by Mrs Sandra Tan 17
There are THREE basic goals:There are THREE basic goals:
1. To improve the economy.1. To improve the economy.2. To raise the standard of living2. To raise the standard of living
3. To improve the quality of life.3. To improve the quality of life.

8/8/2019 4E.4NA -Chapt 5 Development and the Quality of Life
http://slidepdf.com/reader/full/4e4na-chapt-5-development-and-the-quality-of-life 18/63
Prepared by Mdm Roziah Ismail,edited by Mrs Sandra Tan 18
EconomicGrowth
Increase in wealth of the country.
Production of goodsand services.
More employment iscreated.
Standard of Living
living conditions of the people.
Basic needs are met.
Desire for things thatmake life morecomfortable, like carsand TVs.
These aims are related because when more wealth is created, more money
can be spent on improving the standard of living.
Thus development is on -going process because people continue to seek a
better quality of life and countries continue to grow and improve.
Quality of Life
Good sense of well-being
Happiness
Religious & politicalFreedom

8/8/2019 4E.4NA -Chapt 5 Development and the Quality of Life
http://slidepdf.com/reader/full/4e4na-chapt-5-development-and-the-quality-of-life 19/63
Prepared by Mdm Roziah Ismail,edited by Mrs Sandra Tan 19
a. Develop manufacturing industry.a. Develop manufacturing industry.
b. Improve agriculture.b. Improve agriculture.c. Increase export.c. Increase export.

8/8/2019 4E.4NA -Chapt 5 Development and the Quality of Life
http://slidepdf.com/reader/full/4e4na-chapt-5-development-and-the-quality-of-life 20/63
Prepared by Mdm Roziah Ismail,edited by Mrs Sandra Tan 20
Development is a process of change thatDevelopment is a process of change that
improves theimproves the wellbeingwellbeing of a society.of a society.-- material wealthmaterial wealth
-- quality of lifequality of lifeTraditional method of harvesting

8/8/2019 4E.4NA -Chapt 5 Development and the Quality of Life
http://slidepdf.com/reader/full/4e4na-chapt-5-development-and-the-quality-of-life 21/63
Prepared by Mdm Roziah Ismail,edited by Mrs Sandra Tan 21
Improve agriculture

8/8/2019 4E.4NA -Chapt 5 Development and the Quality of Life
http://slidepdf.com/reader/full/4e4na-chapt-5-development-and-the-quality-of-life 22/63
Prepared by Mdm Roziah Ismail,edited by Mrs Sandra Tan 22
Develop manufacturing industries

8/8/2019 4E.4NA -Chapt 5 Development and the Quality of Life
http://slidepdf.com/reader/full/4e4na-chapt-5-development-and-the-quality-of-life 23/63
Prepared by Mdm Roziah Ismail,edited by Mrs Sandra Tan 23
Increase export

8/8/2019 4E.4NA -Chapt 5 Development and the Quality of Life
http://slidepdf.com/reader/full/4e4na-chapt-5-development-and-the-quality-of-life 24/63
Prepared by Mdm Roziah Ismail,edited by Mrs Sandra Tan 24
a. Basic Needs (food, shelter, water,a. Basic Needs (food, shelter, water,
sanitation, health care and education)sanitation, health care and education)are met.are met.

8/8/2019 4E.4NA -Chapt 5 Development and the Quality of Life
http://slidepdf.com/reader/full/4e4na-chapt-5-development-and-the-quality-of-life 25/63
Prepared by Mdm Roziah Ismail,edited by Mrs Sandra Tan 25
Different viewpoints of development:
- economist
- sociologist- geographer
Development is a continuous process-
short-term & long-term

8/8/2019 4E.4NA -Chapt 5 Development and the Quality of Life
http://slidepdf.com/reader/full/4e4na-chapt-5-development-and-the-quality-of-life 26/63
Prepared by Mdm Roziah Ismail,
edited by Mrs Sandra Tan
26
ongoing
The rate of development depends onseveral factors
Development is measured by a wide-range of indicators
Positive & negative impact of
development Development is an emotional issue

8/8/2019 4E.4NA -Chapt 5 Development and the Quality of Life
http://slidepdf.com/reader/full/4e4na-chapt-5-development-and-the-quality-of-life 27/63
Prepared by Mdm Roziah Ismail,
edited by Mrs Sandra Tan
27
Why is development a complexconcept and difficult to define?
Due to different
viewpoints
Development is acontinuous process
Several Factors
influencing development
Wide range of
measurements
Positive &
negative impact
Emotional issue

8/8/2019 4E.4NA -Chapt 5 Development and the Quality of Life
http://slidepdf.com/reader/full/4e4na-chapt-5-development-and-the-quality-of-life 28/63
Prepared by Mdm Roziah Ismail,
edited by Mrs Sandra Tan
28
DIFFERENCES I N DEVELOPMENT
Development is a continuing process.
Thus not all countries are at the same
level of development.
There are also differences in
development between countries andwithin a country.

8/8/2019 4E.4NA -Chapt 5 Development and the Quality of Life
http://slidepdf.com/reader/full/4e4na-chapt-5-development-and-the-quality-of-life 29/63
Prepared by Mdm Roziah Ismail,
edited by Mrs Sandra Tan
29
Classification of countries
In the1950s«
First World ± democratic countries in N. America,Western Europe, Japan Australia & New Zealand
2nd World-non-democratic countries ± former Soviet Union & Peoples¶ Republic of China
3rd World ± the rest of the countries which areconsidered poor.

8/8/2019 4E.4NA -Chapt 5 Development and the Quality of Life
http://slidepdf.com/reader/full/4e4na-chapt-5-development-and-the-quality-of-life 30/63
Prepared by Mdm Roziah Ismail,
edited by Mrs Sandra Tan
30
Classification of Countries
At Present:
Developed Countries ± USA, Japan,
Switzerland, Italy
Less Developed Countries ± Cambodia,
Peru, Ethiopia [ early stages of devt, lower standards of living, lower quality of life]
YouTube - Poor Country Uganda :((...

8/8/2019 4E.4NA -Chapt 5 Development and the Quality of Life
http://slidepdf.com/reader/full/4e4na-chapt-5-development-and-the-quality-of-life 31/63
Prepared by Mdm Roziah Ismail,
edited by Mrs Sandra Tan
31
Uk
Germany
France
T he OldIndustrialised
Countries
T he NewlyIndustrialised
Countries
Singapore
South KoreaTaiwan
T he Oil-richcountries
BruneiSaudi
Arabia
T he CentrallyPlanned
Economies
NorthKorea
FormerSoviet
Union

8/8/2019 4E.4NA -Chapt 5 Development and the Quality of Life
http://slidepdf.com/reader/full/4e4na-chapt-5-development-and-the-quality-of-life 32/63
Prepared by Mdm Roziah Ismail,
edited by Mrs Sandra Tan
32
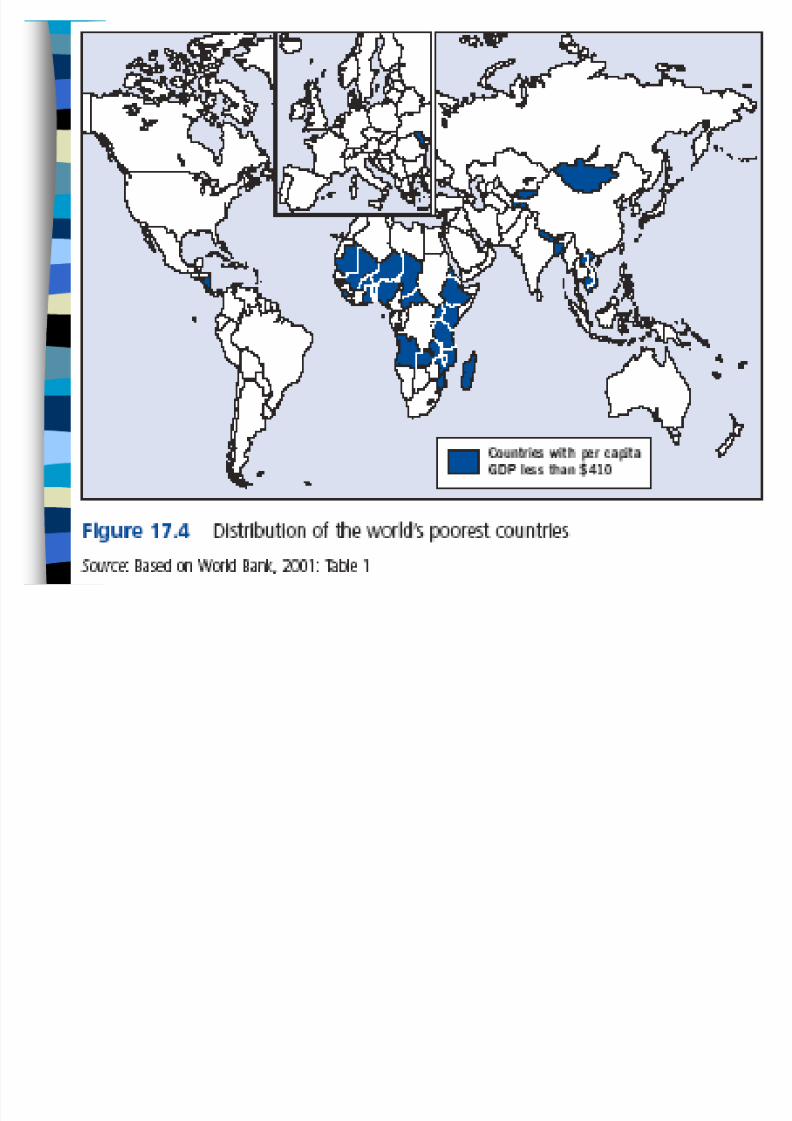
The World of Uneven Development
The pace of development varies among
different countries.
The difference in pace often leads to a
wide gap in development between the
DCs and the LDCs.
There are several indicators todetermine the pace of development.

8/8/2019 4E.4NA -Chapt 5 Development and the Quality of Life
http://slidepdf.com/reader/full/4e4na-chapt-5-development-and-the-quality-of-life 33/63
Prepared by Mdm Roziah Ismail,
edited by Mrs Sandra Tan
33
Uneven economic development
8/8/2019 4E.4NA -Chapt 5 Development and the Quality of Life
http://slidepdf.com/reader/full/4e4na-chapt-5-development-and-the-quality-of-life 34/63
Prepared by Mdm Roziah Ismail,
edited by Mrs Sandra Tan
34
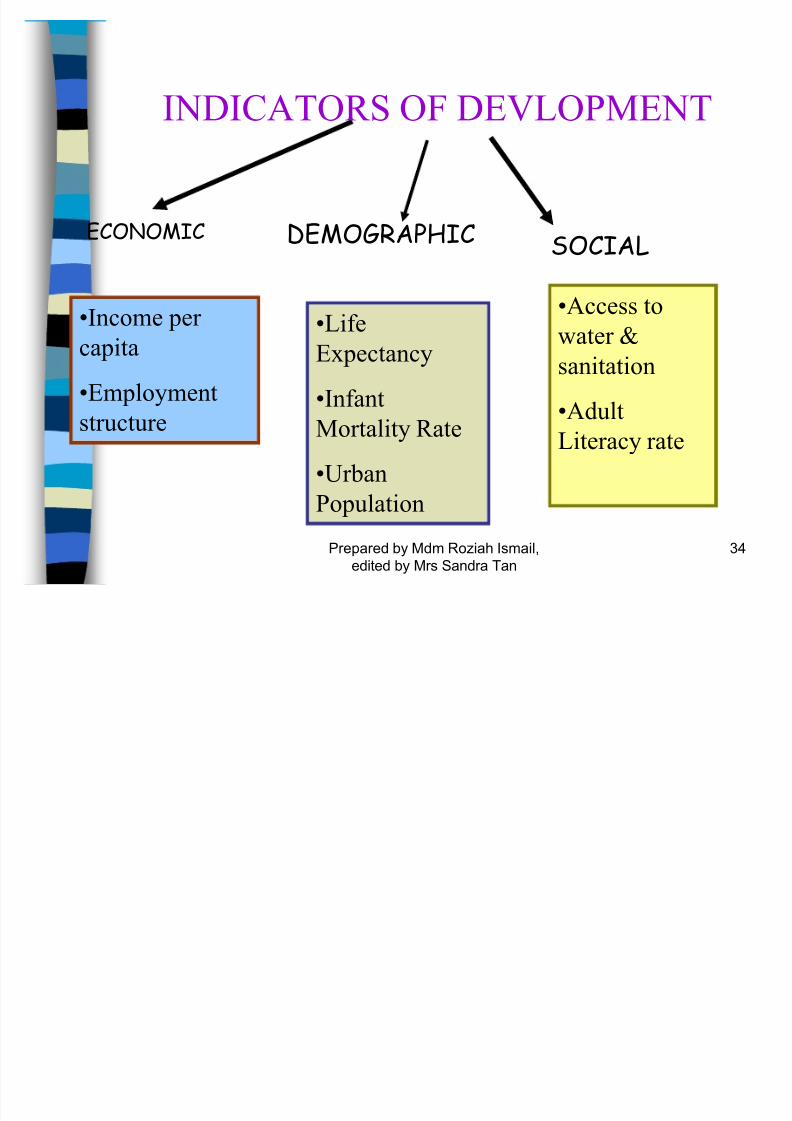
I NDICATORS OF DEVLOPMENT
ECONOMIC DEMOGRAPHIC
Income per
capita
Employment
structure
Life
Expectancy
Infant
Mortality Rate
Urban
Population
Access to
water &
sanitation
AdultLiteracy rate
SOCIAL

8/8/2019 4E.4NA -Chapt 5 Development and the Quality of Life
http://slidepdf.com/reader/full/4e4na-chapt-5-development-and-the-quality-of-life 35/63
Prepared by Mdm Roziah Ismail,
edited by Mrs Sandra Tan
35
Income per capita
Gross National ProductGNP measures the wealth of country.
Annual GNP refers to the total value of goods &
services produced by the country·s citizens in a given year.

8/8/2019 4E.4NA -Chapt 5 Development and the Quality of Life
http://slidepdf.com/reader/full/4e4na-chapt-5-development-and-the-quality-of-life 36/63
Prepared by Mdm Roziah Ismail,
edited by Mrs Sandra Tan
36
GNP per capita
GNP per capita means the average amount of incomeeach citizen earns in the country in a given year.
It is calculated by dividing the GNP by the totalpopulation.
GNP = total income generated in a country in 1 yr
Total population in the country
However GNP per capita is an average figure and doesnot reflect distribution of wealth within a country.

8/8/2019 4E.4NA -Chapt 5 Development and the Quality of Life
http://slidepdf.com/reader/full/4e4na-chapt-5-development-and-the-quality-of-life 37/63
Prepared by Mdm Roziah Ismail,
edited by Mrs Sandra Tan
37
Classification of countries based on
GNP per capita
High-income economies
(US$10 726 more)
Middle income economies
(US$876-$10 725)
Low-income economies(US$875 or less)
8/8/2019 4E.4NA -Chapt 5 Development and the Quality of Life
http://slidepdf.com/reader/full/4e4na-chapt-5-development-and-the-quality-of-life 38/63
Prepared by Mdm Roziah Ismail,
edited by Mrs Sandra Tan
38
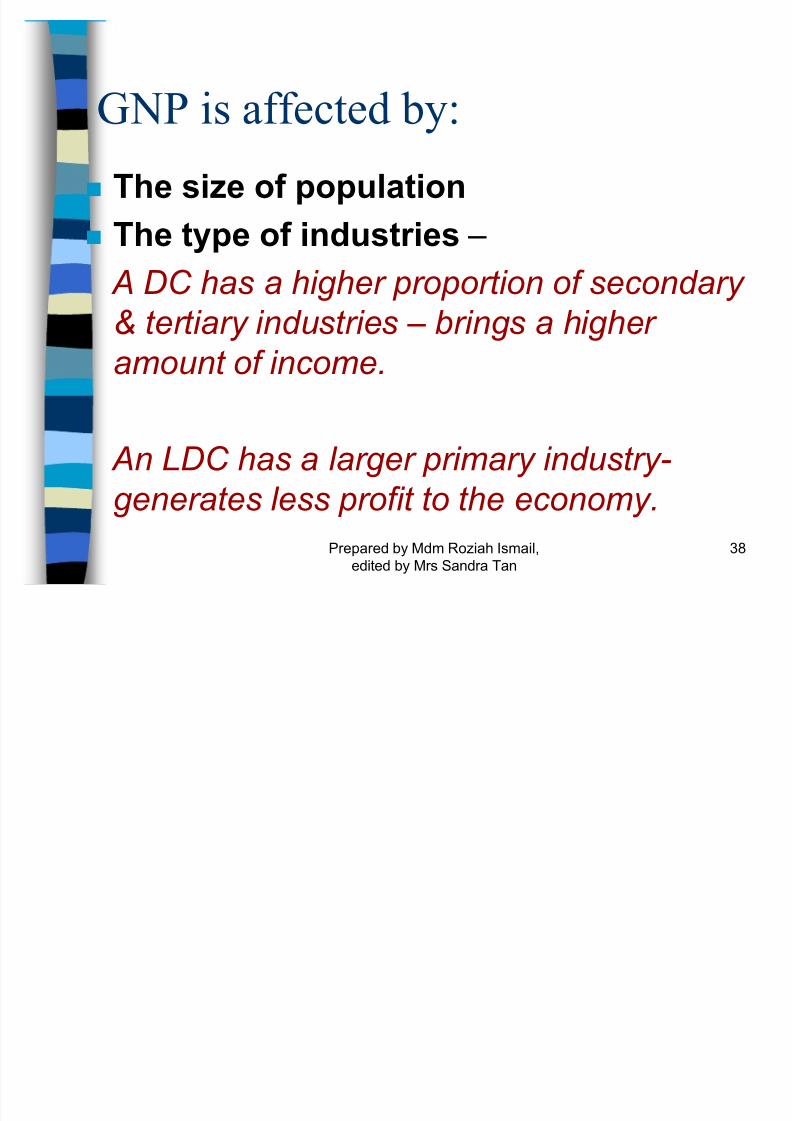
GNP is affected by:
The size of population
The type of industries ±
A DC has a higher proportion of secondary & tertiary industries ± brings a higher
amount of income.
An LDC has a larger primary industry-
generates less profit to the economy.

8/8/2019 4E.4NA -Chapt 5 Development and the Quality of Life
http://slidepdf.com/reader/full/4e4na-chapt-5-development-and-the-quality-of-life 39/63
Prepared by Mdm Roziah Ismail,
edited by Mrs Sandra Tan
39
Why is GNP per capita not an accurate measurement of
development?
It is an average figure and does not show individual andregional differences.(1/4 of Americans are poor)
It does not take into account the local cost of living.
It does not reflect the informal economic activities that arenot registered with the government. (tuition services &street hawking)
It does not take into account the social and environmentalcost brought about by development (income gap, air pollution)

8/8/2019 4E.4NA -Chapt 5 Development and the Quality of Life
http://slidepdf.com/reader/full/4e4na-chapt-5-development-and-the-quality-of-life 40/63
Prepared by Mdm Roziah Ismail,
edited by Mrs Sandra Tan
40
8/8/2019 4E.4NA -Chapt 5 Development and the Quality of Life
http://slidepdf.com/reader/full/4e4na-chapt-5-development-and-the-quality-of-life 41/63
Prepared by Mdm Roziah Ismail,
edited by Mrs Sandra Tan
41

8/8/2019 4E.4NA -Chapt 5 Development and the Quality of Life
http://slidepdf.com/reader/full/4e4na-chapt-5-development-and-the-quality-of-life 42/63
Prepared by Mdm Roziah Ismail,
edited by Mrs Sandra Tan
42

8/8/2019 4E.4NA -Chapt 5 Development and the Quality of Life
http://slidepdf.com/reader/full/4e4na-chapt-5-development-and-the-quality-of-life 43/63
Prepared by Mdm Roziah Ismail,
edited by Mrs Sandra Tan
43
EMPLOYMENT STRUCTURERefers to the distribution of people employed
in the three main industries.
Primary- extraction of natural resourcesdirectly from the earth [ agriculture, mining,forestry, fishing]
Secondary- Industries that convert naturalresources into useful products [ petroleum &food processing industries]
Tertiary- industries that provide services-[tourism, education, banking]

8/8/2019 4E.4NA -Chapt 5 Development and the Quality of Life
http://slidepdf.com/reader/full/4e4na-chapt-5-development-and-the-quality-of-life 44/63
Prepared by Mdm Roziah Ismail,
edited by Mrs Sandra Tan
44
Primary 28%
Tertiary 36%
Secondary 36%
Primary Industries
contribute less to the
country¶s GNP.
In less developed countries,
more than 75% of the people
work in agriculture.
In the developed
countries, less than
5% of the people
work in
agriculture.

8/8/2019 4E.4NA -Chapt 5 Development and the Quality of Life
http://slidepdf.com/reader/full/4e4na-chapt-5-development-and-the-quality-of-life 45/63
Prepared by Mdm Roziah Ismail,
edited by Mrs Sandra Tan
45
TriangularGraph
PrimarySecondary
Tertiary
China
Japan
Nigeria

8/8/2019 4E.4NA -Chapt 5 Development and the Quality of Life
http://slidepdf.com/reader/full/4e4na-chapt-5-development-and-the-quality-of-life 46/63
Prepared by Mdm Roziah Ismail,
edited by Mrs Sandra Tan
46
Employment Structure
Percentage of Workforce
Country Primary Secondary Tertiary
China 49 22 29
Japan 5 25 70
Nigeria 70 10 20

8/8/2019 4E.4NA -Chapt 5 Development and the Quality of Life
http://slidepdf.com/reader/full/4e4na-chapt-5-development-and-the-quality-of-life 47/63
Prepared by Mdm Roziah Ismail,
edited by Mrs Sandra Tan
47
Demographic indicators
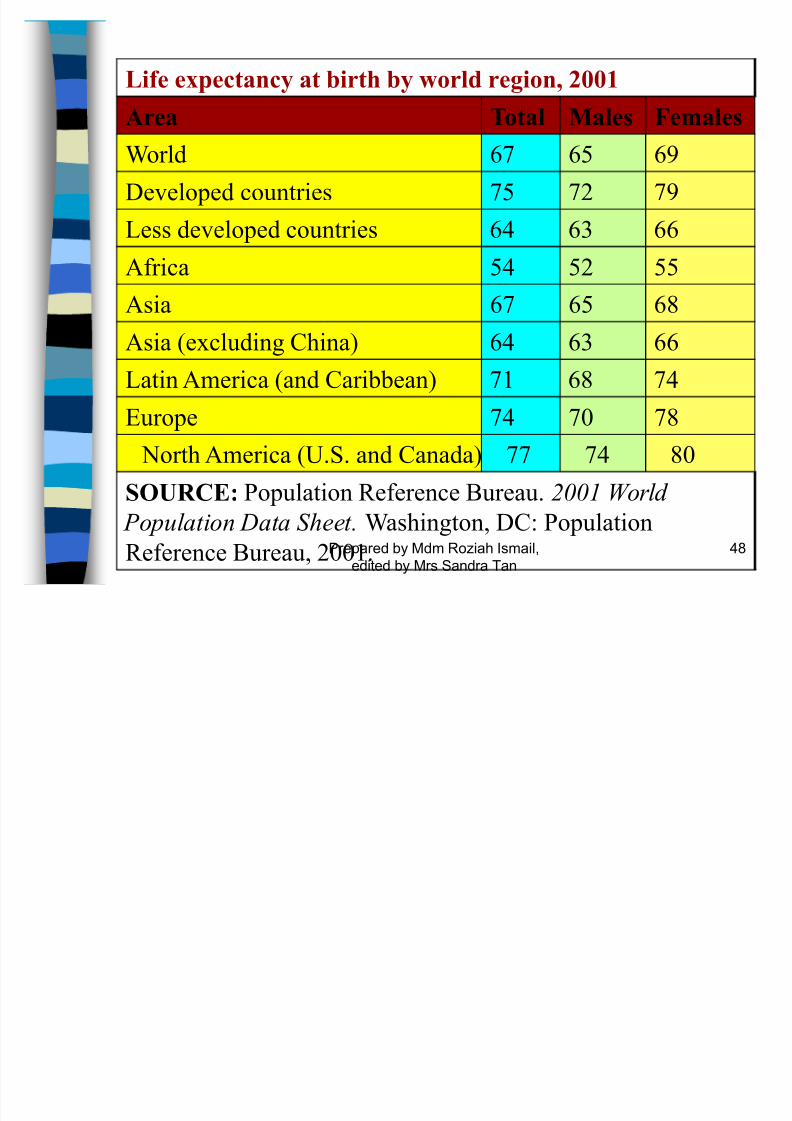
Life Expectancy
Refers to the average number of years that a
person is expected to live in a particular
country.
In the DCs- the life expectancy is much
longer than those in the LDCs.
Reflects the access to healthcare.
8/8/2019 4E.4NA -Chapt 5 Development and the Quality of Life
http://slidepdf.com/reader/full/4e4na-chapt-5-development-and-the-quality-of-life 48/63
Prepared by Mdm Roziah Ismail,
edited by Mrs Sandra Tan
48
Life expectancy at birth by world region, 2001
Area Total Males Females
World 67 65 69
Developed countries 75 72 79
Less developed countries 64 63 66
Africa 54 52 55
Asia 67 65 68
Asia (excluding China) 64 63 66
Latin America (and Caribbean) 71 68 74
Europe 74 70 78 North America (U.S. and Canada) 77 74 80
SOURCE: Population Reference Bureau. 2001 World
Population Data Sheet. Washington, DC: Population
Reference Bureau, 2001.

8/8/2019 4E.4NA -Chapt 5 Development and the Quality of Life
http://slidepdf.com/reader/full/4e4na-chapt-5-development-and-the-quality-of-life 49/63
Prepared by Mdm Roziah Ismail,
edited by Mrs Sandra Tan
49
Percentage of Population which has access to healthcare
services in different countries
Country Population with Access to
Healthcare Services (%)
LDC
Ethiopia 46
Cambodia 53
India 85
Indonesia 80
DC
Singapore 100

8/8/2019 4E.4NA -Chapt 5 Development and the Quality of Life
http://slidepdf.com/reader/full/4e4na-chapt-5-development-and-the-quality-of-life 50/63
Prepared by Mdm Roziah Ismail,
edited by Mrs Sandra Tan
50
Infant Mortality Rate
Refers to the number of deaths of children under the age of one per 1000 live births in a year.
DCs- lower IMR due to availability of good
sanitation and easy accessibility to hospitals anddoctors (Singapore 2 per 1000 live births)
LDCs ± higher IMR due to occurrence of war,
drought, shortage of food, poor nutrition, famineand life threatening diseases
(Ethiopia- 100 per 1000 live births)

8/8/2019 4E.4NA -Chapt 5 Development and the Quality of Life
http://slidepdf.com/reader/full/4e4na-chapt-5-development-and-the-quality-of-life 51/63
Prepared by Mdm Roziah Ismail,
edited by Mrs Sandra Tan
51
8/8/2019 4E.4NA -Chapt 5 Development and the Quality of Life
http://slidepdf.com/reader/full/4e4na-chapt-5-development-and-the-quality-of-life 52/63
Prepared by Mdm Roziah Ismail,
edited by Mrs Sandra Tan
52
Urban population
It refers to the percentage of people living in anurban area. This figure is usually higher in a DCthan a LDC.
Reasons DCs ± have financial resources to develop
cities, modern infrastructure. A large % of workers work in secondary & tertiary industriesin the cities.
LDCs ± lower % of people living in urban areas.Large % work in primary industries.

8/8/2019 4E.4NA -Chapt 5 Development and the Quality of Life
http://slidepdf.com/reader/full/4e4na-chapt-5-development-and-the-quality-of-life 53/63
Prepared by Mdm Roziah Ismail,
edited by Mrs Sandra Tan
53
Level of Urbanisation.
Refers to the change from a rural
countryside to a city landscape
DevelopedCountries
High level of urbanisation anddevelopment
Many high value-addedindustries.
More wealth isgenerated
Further development
Less DevelopedCountries
High level of urbanisation does notlead to higher growthand development
Leads to problems
because of lack of infrastructure to sustainlarge urban population.

8/8/2019 4E.4NA -Chapt 5 Development and the Quality of Life
http://slidepdf.com/reader/full/4e4na-chapt-5-development-and-the-quality-of-life 54/63
Prepared by Mdm Roziah Ismail,
edited by Mrs Sandra Tan
54
% of urban population may not be an accurate
indicator of development
Reasons: An emerging counter-urbanization trend in
some DCs:(In USA, the city people are relocating to the suburbs.
due to congestion & pollution in the cities)
In the LDCs, more people are moving to thecities because of better employment
opportunities. This contributes to rapidgrowth in urban population:(In, Mumbai India, 18m people living in an area of lessthan 500 sq km.)
8/8/2019 4E.4NA -Chapt 5 Development and the Quality of Life
http://slidepdf.com/reader/full/4e4na-chapt-5-development-and-the-quality-of-life 55/63
Prepared by Mdm Roziah Ismail,
edited by Mrs Sandra Tan
55
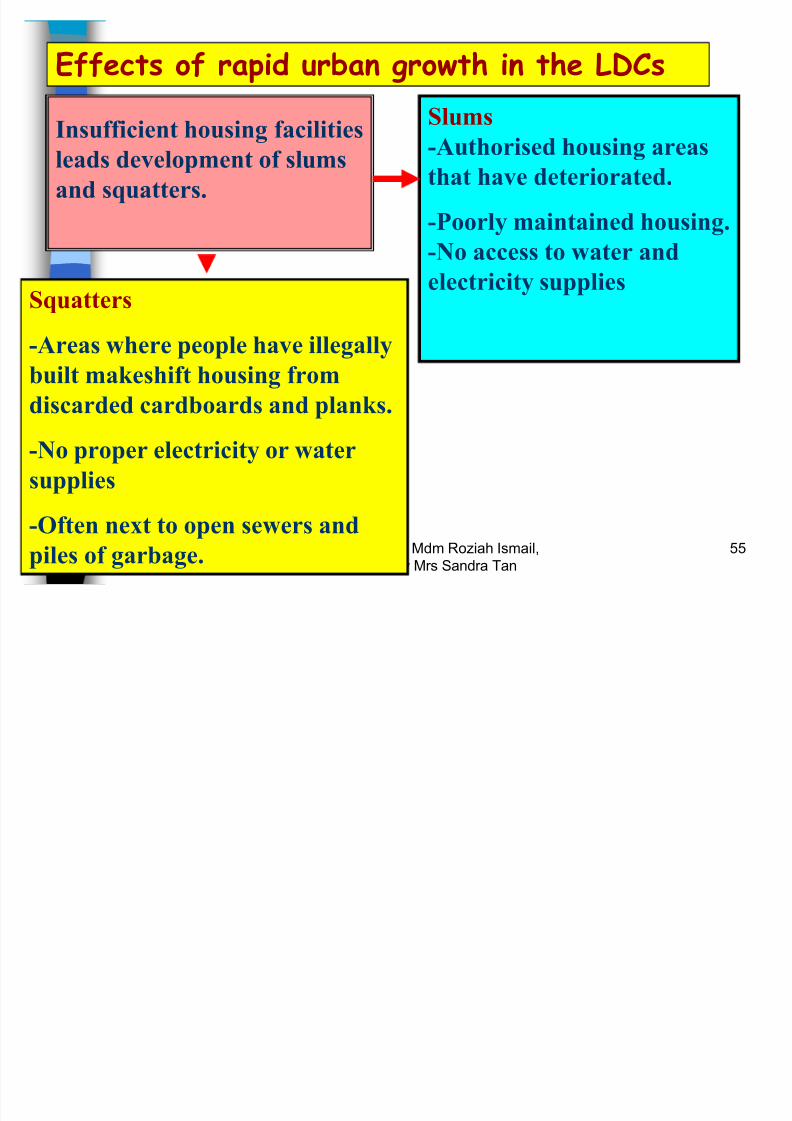
Insufficient housing facilities
leads development of slums
and squatters.
Effects of rapid urban growth in the LDCs
Slums
-Authorised housing areasthat have deteriorated.
-Poorly maintained housing.
-No access to water and
electricity suppliesSquatters
-Areas where people have illegally
built makeshift housing from
discarded cardboards and planks.
-No proper electricity or water
supplies
-Often next to open sewers and
piles of garbage.

8/8/2019 4E.4NA -Chapt 5 Development and the Quality of Life
http://slidepdf.com/reader/full/4e4na-chapt-5-development-and-the-quality-of-life 56/63
Prepared by Mdm Roziah Ismail,
edited by Mrs Sandra Tan
56
SlumsSquatters

8/8/2019 4E.4NA -Chapt 5 Development and the Quality of Life
http://slidepdf.com/reader/full/4e4na-chapt-5-development-and-the-quality-of-life 57/63
Prepared by Mdm Roziah Ismail,
edited by Mrs Sandra Tan
57
Social Indicators
Access to water & sanitation
safe drinking water.
Availability of garbage and
wastewater disposal service.
Contaminated drinking water and poor sanitation are the
leading causes of death in
many LDCs.
% of people who have accessto safe drinking water and
proper sanitation is generally
low in the LDCs.
Country
LDC
Rural
populationwith access
to safe
drinking
water in
2002(%)
Population
with accessto Proper
sanitation in
1999(%)
Nigeria 39 36
Kenya 77 53
Indonesia 62 51
India 81 29

8/8/2019 4E.4NA -Chapt 5 Development and the Quality of Life
http://slidepdf.com/reader/full/4e4na-chapt-5-development-and-the-quality-of-life 58/63
Prepared by Mdm Roziah Ismail,
edited by Mrs Sandra Tan
58
Adult Literacy Rate
8/8/2019 4E.4NA -Chapt 5 Development and the Quality of Life
http://slidepdf.com/reader/full/4e4na-chapt-5-development-and-the-quality-of-life 59/63
Prepared by Mdm Roziah Ismail,
edited by Mrs Sandra Tan
59
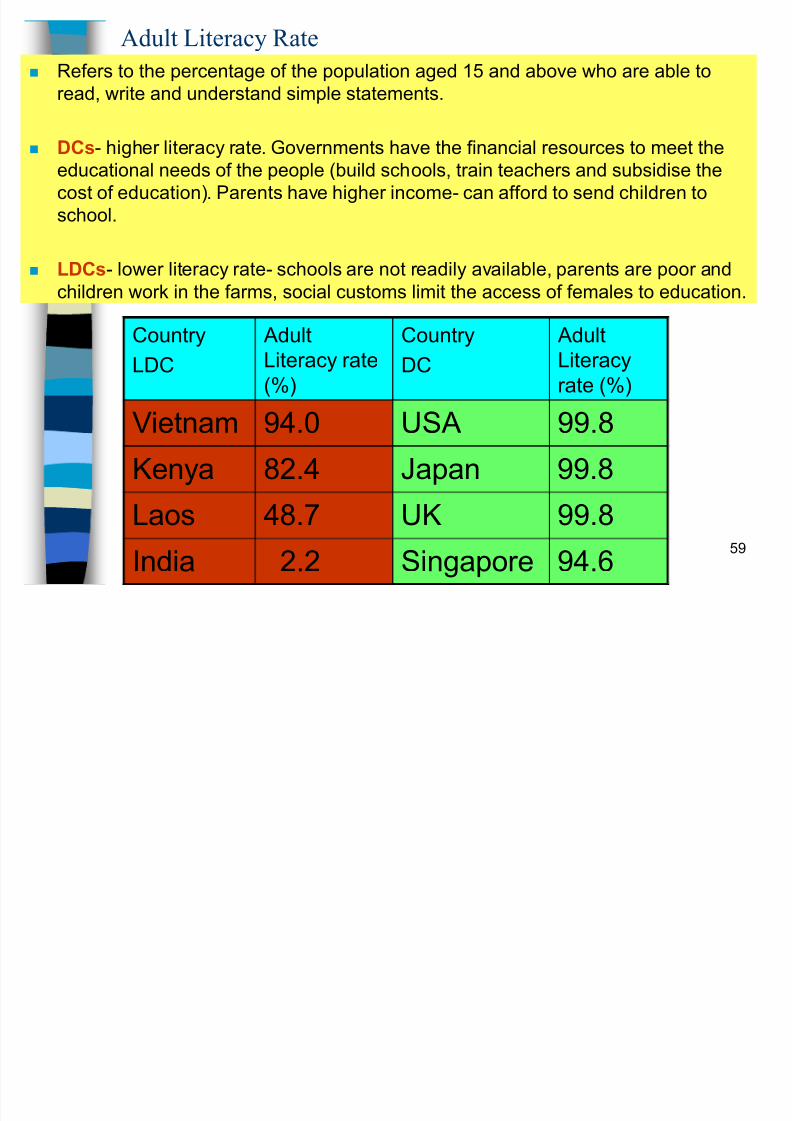
Adult Literacy Rate
Refers to the percentage of the population aged 15 and above who are able to
read, write and understand simple statements.
DCs- higher literacy rate. Governments have the financial resources to meet theeducational needs of the people (build schools, train teachers and subsidise the
cost of education). Parents have higher income- can afford to send children to
school.
LDCs- lower literacy rate- schools are not readily available, parents are poor and
children work in the farms, social customs limit the access of females to education.
Country
LDC
Adult
Literacy rate
(%)
Country
DC
Adult
Literacy
rate (%)
Vietnam 94.0 USA 99.8Kenya 82.4 Japan 99.8
Laos 48.7 UK 99.8
India 52.2 Singapore 94.6

8/8/2019 4E.4NA -Chapt 5 Development and the Quality of Life
http://slidepdf.com/reader/full/4e4na-chapt-5-development-and-the-quality-of-life 60/63
Prepared by Mdm Roziah Ismail,
edited by Mrs Sandra Tan
60
Unmeasurable aspects of development
There are some aspects of development that cannot be
measured.
These are qualities that define the quality of life.
They are non-material benefits:
1. Sense of security2. Fulfilment in life3. Sense of purpose in life
4. Sense of belonging to a community5. Freedom of movement, speech, to choose jobs
and livelihood.6. Liberation from oppression, violence and
exploitation

8/8/2019 4E.4NA -Chapt 5 Development and the Quality of Life
http://slidepdf.com/reader/full/4e4na-chapt-5-development-and-the-quality-of-life 61/63
Prepared by Mdm Roziah Ismail,
edited by Mrs Sandra Tan
61
Human Development IndexHDI combines 3 important
development indicators: Economic indicator- GNP per capita
Social Indicator- Adult Literacy rate
Demographic indicator- Lifeexpectancy
HDI is calculated by averaging the
scores of the 3 indicators in
individual countries.
HDI values ranges from 0 to 1.0
Level ofHumanDevt
HDIValues
High 0.8-1.0
Medium 0.5-0.799
Low 0.499 &
below
8/8/2019 4E.4NA -Chapt 5 Development and the Quality of Life
http://slidepdf.com/reader/full/4e4na-chapt-5-development-and-the-quality-of-life 62/63
Prepared by Mdm Roziah Ismail,
edited by Mrs Sandra Tan
62
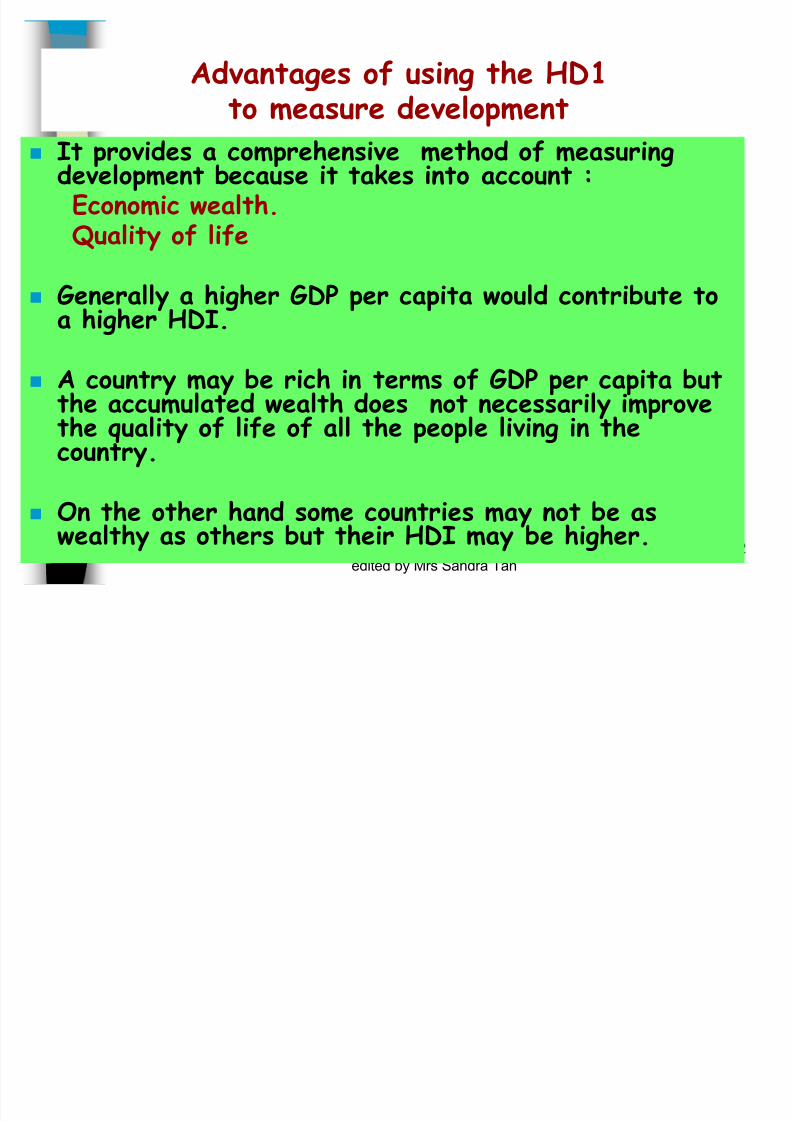
Advantages of using the HD1 to measure development
It provides a comprehensive method of measuringdevelopment because it takes into account :Economic wealth.Quality of life
Generally a higher GDP per capita would contribute toa higher HDI.
A country may be rich in terms of GDP per capita butthe accumulated wealth does not necessarily improvethe quality of life of all the people living in thecountry.
On the other hand some countries may not be aswealthy as others but their HDI may be higher.

8/8/2019 4E.4NA -Chapt 5 Development and the Quality of Life
http://slidepdf.com/reader/full/4e4na-chapt-5-development-and-the-quality-of-life 63/63
Prepared by Mdm Roziah Ismail, 63
INDICATORS OF DEVELOPMENT
Indicators Developed Countries Less Developed
Countries
GNP per capita High Low
Employment Higher % in tertiary
and secondary
industries
Higher % in primary
industries
Infant Mortality Rate Low High
Life Expectancy High Low
Transport networks Well-developed Few transport links
Education High Literacy rates Low Literacy rates
Housing Housing with
amenities
Lack of amenities
Level of urbanisation High Low