4q11 institutional presentation presentation... · representing 49.1% of gdp. ... caxias do sul df...
TRANSCRIPT

4Q11 Institutional Presentation

2
Agenda
Overview and Market Capital
Brazilian Credit Market
Peers
4Q11 Results
Page 3
Page 4
Page 31
Page 8
Appendix Page 36

3
Brazilian Credit Market
Credit Evolution in Brazil (% of GDP)
36.632.0
28.826.8 27.9
24.9 26.4 24.722.0
24.0 24.528.1 30.7
34.841.3
45.0 46.449.1
1994 1995 1996 1997 1998 1999 2000 2001 2002 2003 2004 2005 2006 2007 2008 2009 2010 2011
The balance of the financial system was R$2.029.6 billion in december, an increase of 19.0% over the year,representing 49.1% of GDP.
The average annual interest rate on the credit operations reached 37.1% in december, an increase of 2.1p.p over the year. The rate for the corporate segment reached 28.2%, whereas for the individuals segmentit was 43.8%.
The average maturity of credit operations rose to 495 days in november, an increase of 26 days over the last12 months, the maturity for the corporate segment reached 402 days and it was 595 days for individuals.
The default rate on credit operations in arrears for more than ninety days was 5.5% in december, anincrease of 1.1 pp over the year. The rate related to corporate loans remained stable at 3.9%, and those foroperations involving individuals was 7.3%.
(*) Source: Brazil Central Bank

4Q11
Total Assets R$ 12,104.7 million
Expanded Loan Portfolio R$ 8,828.8 million
Loan Portfolio R$ 7,724.8 million
Funding R$ 7,861.2 million
Shareholders’ Equity R$ 1,952.4 million
Basel Index 16.5% (Tier I)
4Q11 2011
Net Income R$ 90.7 million R$ 305.1 million
Adjusted Net Income R$ 88.8 million R$ 327.0 million
ROAE 18.8% 16.4%
Adjusted ROAE 18.4% 17.6%
ROAA 3.2% 2.9%
NIM-AR (*) 12.4% 11.3%
Efficiency Ratio 33.7% 32.2%
Key Figures
(*) Methodology includes exchange-rate change on passive operations and excludes the result of property protection operations, DAYC4 swaps, portfolio transfers to other banks and matched operations — repurchase agreements-tri-party repos outstanding. 4
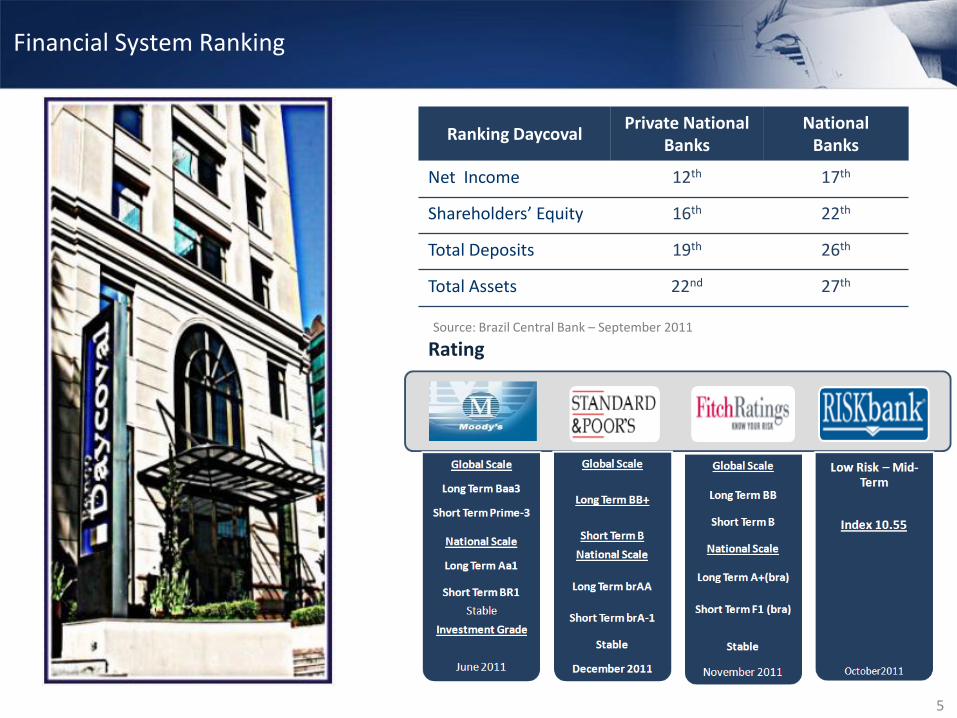
Rating
Financial System Ranking
5
Source: Brazil Central Bank – September 2011
Ranking DaycovalPrivate National
BanksNational
Banks
Net Income 12th 17th
Shareholders’ Equity 16th 22th
Total Deposits 19th 26th
Total Assets 22nd 27th

Corporate Governance: in December 2011, Daycoval began the process ofmigrating to level 2 of the Corporate Governance of the BM&FBovespa
Companies registered at Level 2 are required to have greater transparency in informationdue to the different requirements from those of level 1:
6
Level 1 Level 2 Status
Tag Along concessions80% of common (ON) shares
(pursuant to the legislation)
100% for common (ON) and preferred
(PN) shares
Makeup of the Board of DirectorsMinimum of three members
(pursuant to the legislation)
Minimum of five members, of which at
least 20% must be independent with a
unified mandate of up to two years
Prohibition of accumulation of
positions (Beginning May 10, 2011)
Positions of Chairman of the
Board and President / Chief
Executive Officer held by the same
person (three years grace period
from the date of joining)
Positions of Chairman of the Board and
President / Chief Executive Officer
held by the same person (three years
grace period the date of joining)

Stock Performance – December/11 Capital Structure (%) – December/11
Daycoval’s Market Capital and Capital Structure
DAYC4 (R$) 2011 2010 Chg. %
Closing Quotation 9,40 12,95 -27,4%
High for the quater 12,95 13,05 -0,8%
Average for the quarter 10,17 10,16 0,1%
Low for the quarter 7,90 7,90 0,0%
Market Value (R$)Million 2.033,50 2.801,40 -27,4%
Geographic Distribution – December/11
7

31 BranchesSÃO PAULO – SP HD Av. Paulista
IFP Promotora de Serviços de IntermediaçãoFinanceira Ltda, is a financial intermediation company created to promote operations for
individuals. It has 54 stores in operation throughout Brazil.
34 Daypag Officesin major cities of São Paulo State: Osasco, Barueri, Guarulhos, Americana, Atibaia, Campinas, Ribeirão Preto, Mogi Guaçu e Detran São Paulo
12 exchange bureaus in São Paulo and five correspondents foreign exchange desks distributed strategically in São Paulo and Rio de Janeiro
Distribution: More than 130 points of Sale
8
SP - ALPHAVILLE ES - VITÓRIA CE - FORTALEZA
SP - BOM RETIRO MG - BELO HORIZONTE PE - BOA VIAGEM
SP - BRÁS RJ - RIO DE JANEIRO PE - RECIFE
SP - CAMPINAS PR - LONDRINA RN - NATAL
SP - FARIA LIMA PR - CURITIBA SE- ARACAJU
SP - GUARULHOS RS - CAXIAS DO SUL DF - BRASÍLIA
SP - RIBEIRÃO PRETO RS - PORTO ALEGRE MS - CAMPO GRANDE
SP - SÃO BERNARDO SC - FLORIANÓPOLIS MT - CUIABÁ
SP - SOROCABA AL - MACEIÓ AM - MANAUS
SP - UBERLÂNDIA BA - SALVADOR PA - BELÉM

9
5,567 5,9856,356
6,9637,725
4Q10 1Q11 2Q11 3Q11 4Q11
Loan Portfolio – R$ Million
Loan Portfolio: growth in line with the funding operations
Loan Portfolio by Modality (R$ mn) 4Q11 3Q11 Chg. % 4Q10 Chg. %
Middle Market + Trade Finance 5,283.3 4,684.2 12.8% 3,713.1 42.3%
Payroll Loans 1,784.3 1,657.4 7.7% 1,308.4 36.4%
Auto Loans 605.7 570.6 6.2% 503.3 20.3%
Direct Credit to Consumers (DCC) / Other 51.5 50.7 1.6% 42.6 20.9%
Total 7,724.8 6,962.9 10.9% 5,567.4 38.8%

10
Expanded Loan Portfolio: growth higher than the market average, 41.9% during the year
Expanded Loan Portfolio – R$ Million
Expanded Loan Portfolio (R$ mn) 4Q11 3Q11 Chg. % 4Q10 Chg. %
Middle Market 4,573.7 3,987.0 14.7% 3,380.6 35.3%
Trade Finance 709.6 697.1 1.8% 332.5 113.4%
Avals and Sureties Granted 374.5 378.1 -1.0% 249.4 50.2%
Receivables purchase 665.0 370.6 79.4% 214.3 210.3%
Total Portfolio Middle Market 6,322.8 5,432.8 16.4% 4,176.8 51.4%
Payrol l Loans 1,784.3 1,657.4 7.7% 1,308.4 36.4%
Payrol l Loans Portfol io Ass ignments 57.6 72.8 -20.9% 167.9 -65.7%
Total Payroll Loans 1,841.9 1,730.2 6.5% 1,476.3 24.8%
Auto Loans 605.7 570.6 6.2% 503.3 20.3%
Auto Loans Portfol io Ass ignments 6.9 9.7 -28.9% 23.5 -70.6%
Total Auto Loans 612.6 580.3 5.6% 526.8 16.3%
Direct Credit to Consumers (DCC) 51.5 50.7 1.6% 42.6 20.9%
Total 8,828.8 7,794.0 13.3% 6,222.5 41.9%

6,031 6,4476,957 7,712
8,764191
149 11082
65
4Q10 1Q11 2Q11 3Q11 4Q11
Loan Portfolio Credit Assignments
6,222
Loan Portfolio – R$ Million
13.3%41.9%
6,596 7,0677,794
Expanded Loan Portfolio: growth of 13.3% during the quarter
11
71.6%
20.9%
6.9% 0.6%
Middle Market
Payroll Loans
Auto Loans
DCC
Breakdown Loan Portfolio (*) 3Q11
69.7%
22.2%
7.4% 0.7%Middle Market
Payroll Loans
Auto Loans
DCC
Breakdown Loan Portfolio (*) 4Q11
(*)Includes Credit Assignments, sureties and avals granted and the purchase of credit reghts
8,829

Middle Market: increase of 51.4% over the past 12 months, currently representing 71.6% of the total portfolio
12
Middle Market Portfolio – R$ Million
4.177 4.4024.786
5.433
6.323
4Q10 1Q11 2Q11 3Q11 4Q11
61.8%13.7%
5.0%
9.1%
5.1%5.3%
Receivables
Vehicles / Real Estate
Agricultural Products
Financial Investments
Equipments / Foreign goodsOther
Guarantees Breakdown – 4Q11
42.2%
31.1%
21.7%
5.0%Industry
Services
Commerce
Other
Sectors Breakdown – 4Q11
55.5%
13.0%
14.9%
7.7%
8.9% Southeast
South
Northeast
Mid-West
North
Geographic Distribution – 4Q11
Breakdown Portfolio Middle
Market R$(mn)4Q11 % Loan
Chg. % x
3Q11
Working Capita l 2,867.5 45.4% 20.5%
Guaranteed Account 1,388.8 22.0% 6.2%
Trade Finance 709.6 11.2% 1.8%
Avals and Sureties 374.5 5.9% -1.0%
BNDES 317.4 5.0% 5.6%
Receivables Purchase 665.0 10.5% 79.4%
Total Middle Market 6,322.8 100.0% 16.4%

Daycred Payroll: INSS and Army continue to drive growth
386419
313361 365
4Q10 1Q11 2Q11 3Q11 4Q11
1,4761,617 1,684 1,730 1,842
4Q10 1Q11 2Q11 3Q11 4Q11
(*) Includes credit assignments in all of the quarters (R$ 57.6 million in 4Q11)
Total Origination – R$ Million
Total Loan Portfolio (*) – R$ Million Total Loan Portfolio (*) – R$ 1,842mn – 4Q11 - %
Total Origination – R$ 365 mn – 4Q11- %
13
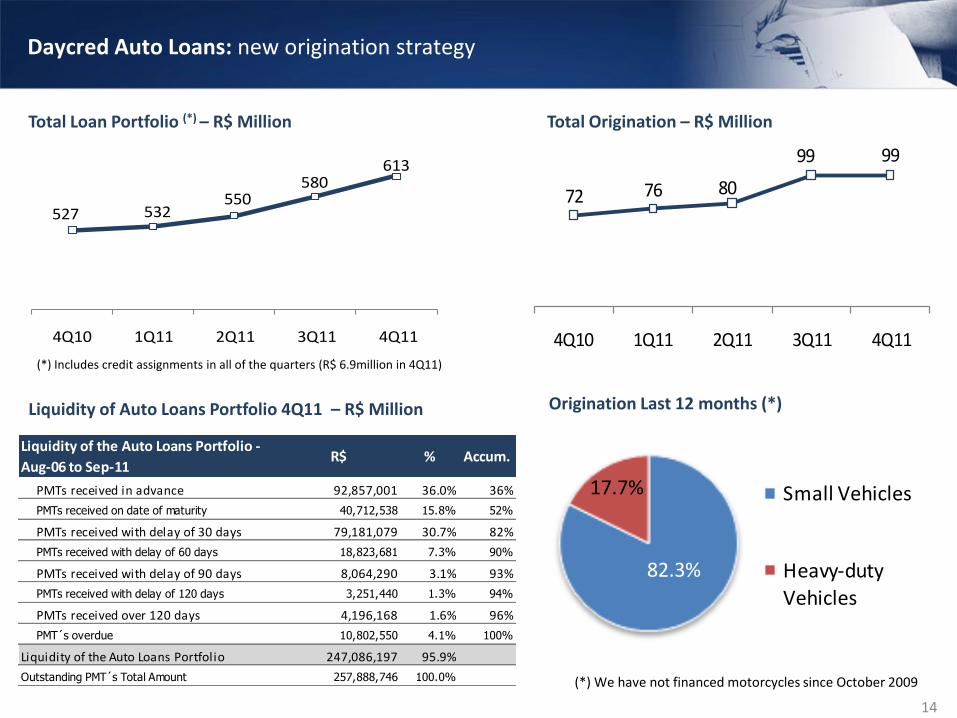
527 532550
580613
4Q10 1Q11 2Q11 3Q11 4Q11
Daycred Auto Loans: new origination strategy
72 76 80
99 99
4Q10 1Q11 2Q11 3Q11 4Q11
Total Loan Portfolio (*) – R$ Million Total Origination – R$ Million
Liquidity of Auto Loans Portfolio 4Q11 – R$ Million
(*) Includes credit assignments in all of the quarters (R$ 6.9million in 4Q11)
14
Origination Last 12 months (*)
82.3%
17.7% Small Vehicles
Heavy-duty Vehicles
(*) We have not financed motorcycles since October 2009
Liquidity of the Auto Loans Portfolio -
Aug-06 to Sep-11R$ % Accum.
PMTs received in advance 92,857,001 36.0% 36%
PMTs received on date of maturity 40,712,538 15.8% 52%
PMTs received with delay of 30 days 79,181,079 30.7% 82%
PMTs received with delay of 60 days 18,823,681 7.3% 90%
PMTs received with delay of 90 days 8,064,290 3.1% 93%
PMTs received with delay of 120 days 3,251,440 1.3% 94%
PMTs received over 120 days 4,196,168 1.6% 96%
PMT´s overdue 10,802,550 4.1% 100%
Liquidity of the Auto Loans Portfolio 247,086,197 95.9%
Outstanding PMT´s Total Amount 257,888,746 100.0%

61%58%
62%58%
59%
26%24%
22% 25%23%
13%18%
16% 17%14%4%
4Q10 1Q11 2Q11 3Q11 4Q11
Total Deposits Borrowing and Onlending Foreign Issuances Banknotes
15
Funding – R$ Million
7,0425,916 6,713
5,241
11.6%50.0%
7,861
Funding: increase of 11.6% over the last quarter

16
3,194 3,422
4,140 4,1224,542
4Q10 1Q11 2Q11 3Q11 4Q11
Total Deposits Breakdown – 4Q11
37.9%
16.2%
27.9%
7.8%10.2%
Corporates + Demand Deposits
Individuals
Investment Funds
Institutional
Financial Institutions + Interbank Deposits
Total Deposits Breakdown – 3Q11
40.7%
14.5%
27.1%
6.5%
11.2% Corporates + Demand Deposits
Individuals
Investment Funds
Institutional
Financial Institutions + Interbank Deposits
Total Deposits - R$ Million
Total Deposits: growth of 42.2% over the past 12 months

Long Term Funding
Long Term Funding - R$ Million
17
Date of
Transaction Maturity Amount (US$ mn)
International Finance
Corporation (IFC) December/2007
January/13
(due of last tranche)115
Syndicated Loan (IFC) June/2010 June/14
(due of last tranche)165
Eurobond March/2010 March/2015 300
Syndicated Loan (IIC) November/2010November/15
(due of last tranche)112.5
Eurobond January/2011 January/2016 300

18
Issuance of Banknotes
First bank to conduct a public issuance of Banknotes, in the amount of R$ 249.9 million maturing in 2 years, concluded on October 18th, 2011.
Banknote Issue on September 15, 2011 (1st Issue)
Issuer Banco Daycoval S.A.
Issue Denominations R$ 249.9 million
Ranking Status Exclusively book value, without the issue of certificates
Term November 15, 2013
Leader Coordinator
Coordinator

33.4%
34.6%
24.8%
6.6%
0.6%
Up to 3 months From 3 to 12 months
From 1 to 3 years From 3 to 5 years
Over 5 years
Outstanding Operations (Loan Portfolio) 4Q11 - % Outstanding Operations (Funding) 4Q11 - %
Liquidity: positive gap of 120 days between the duration of the credit and funding operations
19
(1) From December2011(2) Excludes BNDES
Maturity of 68.0%over the next 12
months
19.0%
34.4%
29.3%
16.6%
0.7%
Up to 3 months From 3 to 12 months
From 1 to 3 years From 3 to 5 years
Over 5 years
Maturity of 53.4%over the next 12
months
Funding Average term to
Maturity (1) days
Total Deposits 264
Interbank Deposits 210
Banknotes 657
Letter of Credit Agribusiness 81
Foreign Issuances 1,189
Borrowing and Onlending (2) 265
Total Funding 472
Loan Portfolio by SegmentAverage term to
Maturity (2) days
Total Portfolio Middle Market 187
Trade Finance 146
Payroll Loans 710
Auto Loans 506
DCC + Other 229
Total Loan Portfolio 352

20
Liquidity
4Q11 Cash Breakdown (%)
4Q11 Total Assets Breakdown (%) 4Q11 Total Assets - R$mn
4Q11 R$ mn
Cash 1,216.9
Liquid Assets 1,610.5
Total Assets 12,104.7
8,9399,787
11,024 11,50212,105
4Q10 1Q11 2Q11 3Q11 4Q11

21
Currently, Asset manages 26 funds, of which 13 are open funds and 13 are exclusivefunds. We closed 4Q11 with total funds administered and/or under management of R$1,338.0 million, an increase of 6.1% during the past 12 months, and gross revenuesthrough the administration of investment funds of R$ 2.5 million and R$9.7 millionduring the year.
Daycoval closed 4Q11 with 12 exchange bureaus and five exchange correspondents.During the quarter we sold 7.132 pre-paid cards in different currencies and our bureaus’turnover totaled R$$ 33.7 million during the period, during the year these numberswere 24,000 pre-paid cards and R$ 107.0 million.
Daypag product, designed to meet the needs of car licensing agents and driving schoolsin São Paulo state by financing fees to be collected, processed over 958,000 paymentslips over the quarter, growth of 102.1% compared to the 3Q11.
In 4Q11, more than 46,000 payment slips were processed through our Dayconnect homebanking system. This involved 3,300 clients and more than 5,000 users who access theiraccounts and interbank investments with Banco Daycoval in a safe and speedy manner.
Service and product revenues
Service revenues totaled 2011 R$ 62.0 million during the year.

Quality of Loan Portfolio (*): establishment of the provision is adequate
Total Provision / Loan Porfolio (%)
(*) Unconsolidated
22
Provision Total Loan Portfolio
4Q11Portfolio R$
mn% Provision R$
mnTotal Provision
/ Loan(%)
Middle Market + Trade Finance 5,283.3 69.3% 119.6 2.3
Payroll 1,784.3 23.4% 46.8 2.6
Auto Loans 444.3 5.8% 26.8 6.0
CDC Retailers / Other 51.5 0.7% 5.1 9.9
Subtotal 7,563.4 99.2% 198.3 2.5
Credit Assignments 64.5 0.8% 0.4 0.1
Total 7,627.9 100.0% 198.7 2.6

Establishment of Provision - R$ mn 4Q10 1Q11 2Q11 3Q11 4Q11 2010 2011
Middle Market + Trade Finance 14.2 24.5 15.3 20.1 29.3 80.7 89.2
Payroll 7.9 9.8 9.6 12.8 13.9 31.2 46.1
Auto Loans 4.8 7.0 6.5 5.4 7.9 32.5 26.8
Direct Credit to Consumers 0.9 1.3 1.7 1.9 1.7 2.9 6.6
Total 27.8 42.6 33.1 40.2 52.8 147.3 168.7
170178 184 174
198
28 43 33 4053
4Q10 1Q11 2Q11 3Q11 4Q11
Balance of Provision Establishment of Provision
Balance and Establishment of Provision - R$ Million
(*) Unconsolidated
23
Quality of Loan Portfolio (*)

84.693.1 99.5 95.7
104.9
201%191% 185% 181%
189%
1.6% 1.6% 1.6% 1.4% 1.4%
0
1
2
3
4
5
6
7
8
-20.0
30.0
80.0
130.0
180.0
230.0
4Q10 1Q11 2Q11 3Q11 4Q11
Past due operations > 14 days (R$mn)
LLP / Past due operations (%)
Past due operations > 14 days / Loan Portfolio (%)
Past due operations more than 60 daysPast due operations more than 14 days
(*) Unconsolidated
24
Quality of Loan Portfolio (*)
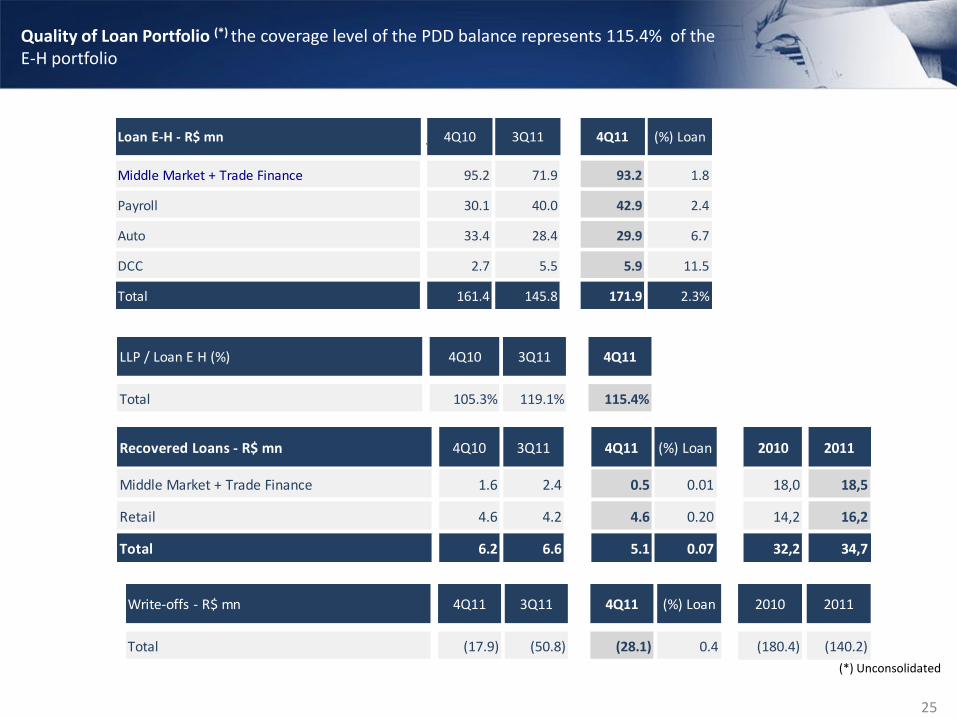
Recovered Loans - R$ mn 4Q10 3Q11 4Q11 (%) Loan 2010 2011
Middle Market + Trade Finance 1.6 2.4 0.5 0.01 18,0 18,5
Retail 4.6 4.2 4.6 0.20 14,2 16,2
Total 6.2 6.6 5.1 0.07 32,2 34,7
Loan E-H - R$ mn3
T4Q10 3Q11 4Q11 (%) Loan
Middle Market + Trade Finance 95.2 71.9 93.2 1.8
Payroll 30.1 40.0 42.9 2.4
Auto 33.4 28.4 29.9 6.7
DCC 2.7 5.5 5.9 11.5
Total 161.4 145.8 171.9 2.3%
(*) Unconsolidated
25
Quality of Loan Portfolio (*) the coverage level of the PDD balance represents 115.4% of the E-H portfolio
LLP / Loan E H (%) 4Q10 3Q11 4Q11
Total 105.3% 119.1% 115.4%
Write-offs - R$ mn 4Q11 3Q11 4Q11 (%) Loan 2010 2011
Total (17.9) (50.8) (28.1) 0.4 (180.4) (140.2)

Efficiency Ratio: despite the 2.9 p.p. increase during the quarter, this ratio remains stable, proving the adequate manner in which we manage operating costs.
27.8
37.6
27.930.8
33.7
24.626.9 27.7
30.6 32.2
4Q10 1Q11 2Q11 3Q11 4Q11
Efficiency Ratio Average Past 12 months
Efficiency Ratio %
26
Personnel and Administrative Expenses (R$ mn) 4Q11 3Q11 Chg.% 4Q10 Chg.% 2011 2010 Chg.%
Total Personnel (exclude IFP) (39.2) (32.9) 19.1% (25.5) 53.7% (125.3) (91.2) 37.4%
Administrative Expenses (exclude IFP) (33.5) (31.8) 5.3% (25.0) 34.0% (117.9) (83.4) 41.4%
Administrative Expenses - Foreign Issuances/Banknotes (1.8) 0.0 n.a. 0.0 n.a. (4.1) (0.3) n.a.
Total Personnel and Administrative Expenses (exclude IFP) (74.5) (64.7) 15.1% (50.5) 47.5% (247.3) (174.9) 41.4%
Total Personnel - IFP (2.2) (2.2) 0.0% (2.8) -21.4% (8.8) (3.0) 193.3%
Administrative Expenses - IFP (1.5) (1.4) 7.1% (1.0) 50.0% (5.6) (1.0) 460.0%
Total Personnel and Administrative Expenses IFP (3.7) (3.6) 2.8% (3.8) -2.6% (14.4) (4.0) 260.0%
Commission Expenses (total) (19.5) (15.3) 27.5% (8.4) 132.1% (55.9) (30.0) 86.3%
Total (97.7) (83.6) 16.9% (62.7) 55.8% (317.6) (208.9) 52.0%
Efficiency Ratio (A/B) (%) 33.7% 30.8% 2.9 p.p 27.8% 5.9 p.p 32.2% 24.6% 7.6 p.p
Efficiency Ratio (considering Profit Sharing) (%) 36.4% 35.3% 1.1 p.p 32.3% 4.1 p.p 35.6% 28.2% 7.4 p.p

3.03.3 3.4 3.6
3.9
4Q10 1Q11 2Q11 3Q11 4Q11
1,777.81,791.2 1,842.4
1,903.41,952.4
4Q10 1Q11 2Q11 3Q11 4Q11
Shareholders’ Equity – R$ Million
Loan Portfolio / Shareholders’ Equity - times
Capital Structure: maintenance of low leverage
27
28
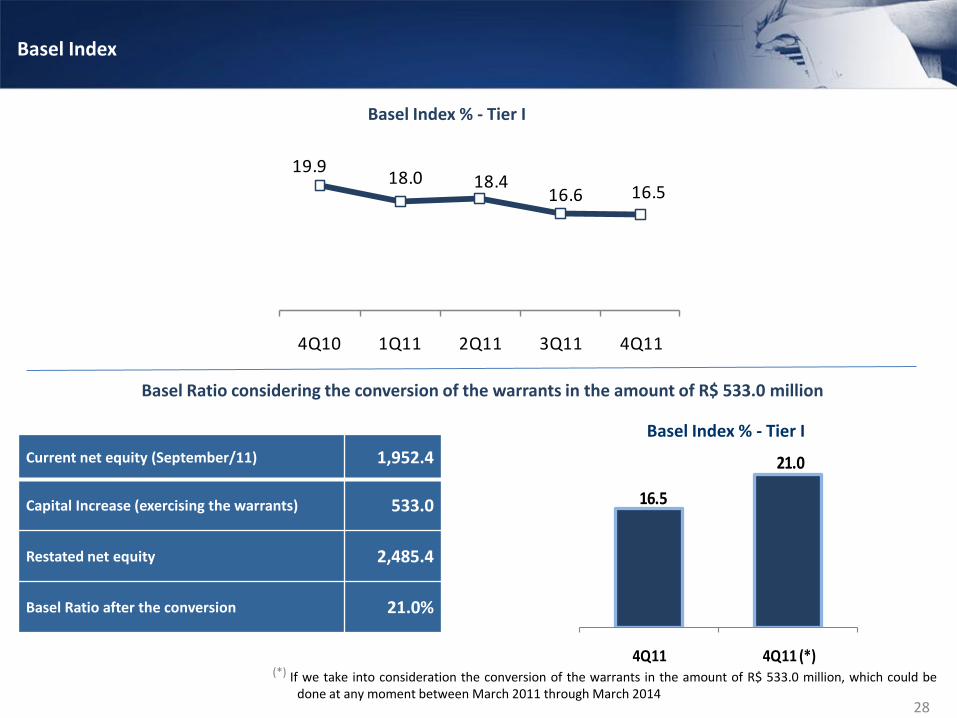
Basel Index
19.918.0 18.4
16.6 16.5
4Q10 1Q11 2Q11 3Q11 4Q11
Basel Index % - Tier I
Basel Ratio considering the conversion of the warrants in the amount of R$ 533.0 million
Current net equity (September/11) 1,952.4
Capital Increase (exercising the warrants) 533.0
Restated net equity 2,485.4
Basel Ratio after the conversion 21.0%
16.5
21.0
4Q11 4Q11 (*)
Basel Index % - Tier I
(*) If we take into consideration the conversion of the warrants in the amount of R$ 533.0 million, which could bedone at any moment between March 2011 through March 2014

11.5 10.912.3 11.6 12.4 11.2 11.3
4Q10 1Q11 2Q11 3Q11 4Q11 2010 2011
3.1
1.8
3.03.6
3.2 3.32.9
4Q10 1Q11 2Q11 3Q11 4Q11 2010 2011
16.1
9.7
16.520.4 18.8
16.0 16.4
4Q10 1Q11 2Q11 3Q11 4Q11 2010 2011
70.9 43.575.2
95.7 90.7
274.7305.1
4Q10 1Q11 2Q11 3Q11 4Q11 2010 2011
29
Return on Average Equity (ROAE) - %
Net Interest Margin Adjusted and Recurring
(NIM-AR) (1) - %Return on Average Assets (ROAA) - %
Net Income – R$ mn
Profitability: Net Income of R$90.7 million, significant growth of 27.9% compared to 4Q10
(1) Methodology includes exchange-rate change on passive operations and excludes the result of property protection operations, DAYC4swaps, portfolio transfers to other banks and matched operations — repurchase agreements-tri-party repos outstanding

30
Reccuring Key Figures
65.4 64.6
85.3 88.3 88.8
4T10 1T11 2T11 3T11 4T11
Adjusted and Recurring Net Income (R$ mn)
14.8 14.418.7 18.8 18.4
4Q10 1Q11 2Q11 3Q11 4Q11
Adjusted and Recurring Return on Average Equity (ROAE) (% p.a.)
Recurring Key Figures (R$ mn) 4Q11 3Q11 Chg. % 4Q10 Chg. % 2011 2010 Chg. %
Net Income 90.7 95.7 -5.2% 70.9 27.9% 305.1 274.7 11.1%
ROAE 18.8% 20.4% -1.6 p.p 16.1% 2.7 p.p 16.4% 16.0% 0.4 p.p
Hedge/MTM (2.6) 19.4 -113.4% (11.3) -77.0% 7.3 4.4 65.9%
Swap DAYC4 5.9 (11.2) -152.7% 7.0 -15.7% (24.1) 15.5 n.a
Credit Assigments (1.4) (0.8) 75.0% 9.8 -114.3% (5.1) 9.8 n.a
Recurring Net Income 88.8 88.3 0.6% 65.4 35.8% 327.0 245.0 33.5%
Shareholders Equity 1,933.4 1,880.8 2.8% 1,766.6 9.4% 1,855.9 1,720.1 7.9%
Total Assets 11,559.3 10,896.1 6.1% 9,318.8 24.0% 10,561.8 8,281.7 27.5%
Recurring ROAA (%) 3.1% 3.3% - 0.2 p.p 2.8% 0.3 p.p 3.1% 3.0% 0.1 p.p
Recurring ROAE (%) 18.4% 18.8% -0.4 p.p 14.8% 3.6 p.p 17.6% 14.2% 3.4 p.p
Adjusted Eficiency Ratio (%) 33.5% 32.3% 1.2 p.p 29.1% 4.4 p.p 30.6% 26.2% 4.4 p.p

Peer Analysis – December 2011
31
Shareholders’Equity (R$ Million) (1)
Loan Portfolio / Shareholders’Equity – times (1)
Basel Index (%) (1)
(1) Source: Bank’s reports as of December 2011

Loan Portfolio (R$ Million) (1)
Loan Loss Provisions / Credit Portfolio (%) (1) Growth of Total Credit Portfolio YoY - (%) (1)
32
Peer Analysis – December 2011
(1) Source: Bank’s reports as of December 2011

33
2011 Net Income (R$ Million) (1)
4Q11 Net Income - R$ Million (1) 2011 Net Income / Loan Porfolio - (%) (1)
(1) Source: Bank’s reports as of December 2011
Peer Analysis – December 2011

34
Return on Average Assets (ROAA) - % (1)
Efficiency Ratio - % (1)
Peer Analysis – 4Q11
Net Interest Margin (NIM) - % (1)
(2) NIM-AR: Methodology includes exchange-rate change on passive operations and excludes the result of property protection operations, DAYC4 swaps, portfolio transfers to other banks and matched operations — repurchase agreements-tri-party repos outstanding.
Return on Average Equity (ROAE) - % (1)
(2)(2)
(1) Source: Bank’s reports as of December 2011

35
Return on Average Assets (ROAA) - % (1)
Efficiency Ratio - % (1)
Peer Analysis – 2011
Net Interest Margin (NIM) - % (1)
(2) NIM-AR: Methodology includes exchange-rate change on passive operations and excludes the result of property protection operations, DAYC4 swaps, portfolio transfers to other banks and matched operations — repurchase agreements-tri-party repos outstanding.
Return on Average Equity (ROAE) - % (1)
(2)(2)
(1) Source: Bank’s reports as of December 2011
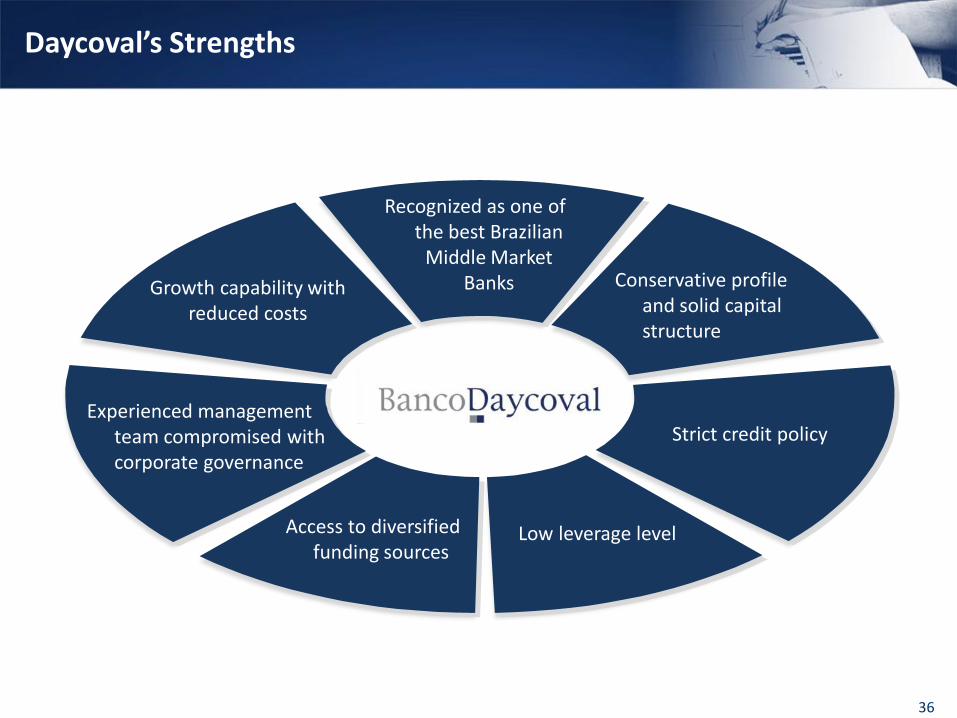
Daycoval’s Strengths
Growth capability with reduced costs
Low leverage levelAccess to diversified funding sources
Experienced management team compromised with corporate governance
Recognized as one of the best Brazilian
Middle Market Banks Conservative profile
and solid capital structure
Strict credit policy
36

37
Recurring Adjusted Net Interest Margin – (NIM-AR)
Recurring Adjusted Net Interest Margin - (NIM-AR) - (R$ mn) 2008 2009 2010 2011
Income from Financial Intermediation adjusted by Loan Loss
Provision and Exchange Rate Variation 706.5 742.6 804.6 917.0
Hedge/MTM (12.2) 13.3 7.4 12.2
Swap DAYC4 0.0 0.0 25.8 (40.2)
Credit Assigments 13.7 - 16.3 (8.5)
Recurring Adjusted Income from Financial Intermediation (A) 705.0 729.3 755.1 953.5
Average Remunerated Assets 6,682.1 6,130.1 7,764.0 9,449.9
(-) repurchase agreements-tri-party repos outstanding (922.6) (363.4) (1,019.7) 1,043.5
Average Remunerated Assets (C) 5,759.5 5,766.7 6,744.3 8,406.4
Recurring Adjusted Net Interest Margin (NIM-AR) (%p.a.) (A/C) 12.2% 12.6% 11.2% 11.3%

Net Income – (R$ mn)
38
57.7 62.2 70.2 62.541.7
20.448.0
38.542.0
82.554.6 64.2 85.070.9
43.5
75.295.7
90.7
231.0
200.2211.1
274.7305.1
3Q
07
4Q
07
1Q
08
2Q
08
3Q
08
4Q
08
1Q
09
2Q
09
3Q
09
4Q
09
1Q
10
2Q
10
3Q
10
4Q
10
1Q
11
2Q
11
3Q
11
4Q
11
20
07
2008
2009
20
10
2011

(*) Unconsolidated
Quality of Loan Portfolio (*) : establishment of Provision R$ (mn)
39
1Q09 2Q09 3Q09 4Q09 1Q10 2Q10 3Q10 4Q10 1Q11 2Q11 3Q11 4Q11 2008 2009 2010 2011
Middle Market + Trade Finance 38,8 41,2 36,8 -4,1 17,2 12,2 37,1 14,2 24,5 15,3 20,1 29,3 102,9 112,7 80,7 89,2
Payroll 7,0 7,1 6,0 8,5 7,1 7,5 8,6 7,9 9,8 9,6 12,8 13,9 18,8 28,6 31,1 46,1
Auto Loans 29,2 30,5 24,9 12,0 12,8 9,1 5,8 4,8 7,0 6,5 5,4 7,9 54,8 96,6 32,5 26,8
DCC + Other 0,2 0,3 0,5 0,6 0,7 0,7 0,6 0,9 1,3 1,7 1,9 1,7 0,4 1,6 2,9 6,6
Establishment of Provision 75,2 79,1 68,2 17,0 37,8 29,5 52,1 27,8 42,6 33,1 40,2 52,8 176,9 239,5 147,2 168,7
LLP/Loan Portfolio (%) 7,1 7,9 7,8 5,6 4,6 3,5 3,2 3,1 3,0 2,9 2,5 2,6 5,3 5,6 3,1 2,6

(*) Unconsolidated
Quality of Loan Portfolio (*): Past due operations more than 60 days
3Q11
40

Quality of Loan Portfolio(*) - Loan Loss Provision
41
(*) Unconsolidated

Balance Sheet
Amounts in R$’000
42
Assets 4Q11 3Q11 4Q10Current Assets 8,475,097 8,019,265 5,903,090 Cash and Cash Equiva lents 26,795 15,038 11,285 Interbank Investments 2,086,753 2,505,003 1,549,266 Securi ties and Derivatives 152,401 163,556 248,117 Interbank Accounts 124,737 106,890 87,340 Lending Operations 4,776,489 4,247,648 3,394,521 Other Receivables 1,227,264 902,543 556,306 Other Assets 80,658 78,587 56,255 Long-Term Assets 3,618,057 3,471,963 3,025,176 Interbank Investments 20,652 33,912 49,102.00 Securi ties and Derivatives 589,097 658,176 878,272 Lending Operations 2,365,275 2,184,889 1,762,784 Other Receivables 568,414 531,988 297,845 Other Assets 74,619 62,998 37,173 Permanent 11,561 11,125 10,244 Investments 581 581 590 Property and Equipment in Use 10,959 10,523 9,616 Intangible 21 21 38
Total Assets 12,104,715 11,502,353 8,938,510
Liabilities 4Q11 3Q11 4Q10Current Liabi l i ties 6,012,897 5,869,243 3,967,838 Depos i ts 2,894,787 2,620,308 1,799,985 Money Market Funding 1,269,531 1,587,261 1,134,528 Funds from Acceptance and Issuance of 121,225 58,387 182,782 Interbank Accounts 583.00 19,517 0 Interbranch Accounts 17,678 17,365 7,863 Borrowings and Onlendings 1,323,907 1,209,492 578,218 Derivatives 29,782 54,144 20,696 Provis ions of Insurance and Pens ion 22,207 23,080 19,531 Other payables 333,197 279,689 224,235 Long-term Liabi l i ties 4,124,558 3,715,108 3,185,892 Depos i ts 1,647,221 1,501,551 1,393,879 Funds from Acceptance and Issuance of 1,371,332 1,094,530 484,726 Borrowings and Onlendings 502,727 557,478 801,493 Derivatives 13,117 7,843 66,341 Other Payables 590,161 553,706 439,453 Deferred Income 14,200 14,014 6,361
Minori ty Interest 633 623 599
Shareholders ´ Equi ty 1,952,427 1,903,365 1,777,820 Capi ta l of Brazi l ian Res idents 1,359,143 1,359,143 1,359,143 Reva luation Reserves 1,313 1,339 1,441 Profi t Reserves 599,605 548,660 424,780 ( - ) Treasury Stocks (5,794) (6,183) (7,900)Adjustments of Shareholders ' Equi ty Securi ties and Derivatives Ava i lable for (1,840) 406 356
Total Liabilities 12,104,715 11,502,353 8,938,510

Income Statement
Amounts in R$’000
43
4Q11 3Q11 Var. % 4Q10 Chg. % 2011 2010 Chg. %Income from Financial Intermediation 492,601 818,969 -39.9% 344,442 43.0% 1,923,903 1,260,160 52.7%Lending Operation 376,872 421,518 -10.6% 294,182 28.1% 1,427,704 980,704 45.6%Securities Operations 93,220 108,390 -14.0% 93,990 -0.8% 371,597 326,525 13.8%Derivatives (1,607) 224,908 -100.7% (49,811) -96.8% 21,930 (67,265) n.a.Foreign Exchange Operations 24,116 64,153 -62.4% 6,081 296.6% 102,672 20,196 n.a.
Expenses of Financial Intermediation (276,930) (605,576) -54.3% (188,650) 46.8% (1,299,488) (708,558) 83.4%Funding Expenses (195,796) (371,870) -47.3% (144,577) 35.4% (868,298) (493,868) 75.8%Borrowing and Onlendings (28,355) (194,070) -85.4% (16,238) 74.6% (259,274) (67,441) 284.4%Loan Losses Provisions (52,779) (39,636) 33.2% (27,835) 89.6% (171,916) (147,249) 16.8%
Gross Profit from Financial Intermediation 215,671 213,393 1.1% 155,792 38.4% 624,415 551,602 13.2%
Other Operating Income (Expenses) (83,486) (67,302) 24.0% (37,531) 122.4% (156,646) (127,406) 23.0%
Income from Services Provided 18,757 16,488 13.8% 11,474 63.5% 62,019 35,735 73.6%Personnel Expenses (41,411) (35,119) 17.9% (28,349) 46.1% (134,058) (94,304) 42.2%Other Administrative Expenses (56,247) (48,468) 16.0% (34,346) 63.8% (183,499) (114,598) 60.1%Tax Expenses (16,347) (14,210) 15.0% (13,243) 23.4% (55,551) (42,939) 29.4%Other Operating Income 39,305 32,497 20.9% 44,056 -10.8% 247,356 153,844 60.8%Other Operating Expenses (27,543) (18,490) 49.0% (17,123) 60.9% (92,913) (65,144) 42.6%
Income from Operation 132,185 146,091 -9.5% 118,261 11.8% 467,769 424,196 10.3%
Non-operating Expenses (2,423) (2,129) 13.8% (1,731) 40.0% (7,198) (9,756) -26.2%
Income before Taxes and Minority Interest 129,762 143,962 -9.9% 116,530 11.4% 460,571 414,440 11.1%
Income and Social Contribution Taxes (31,366) (36,154) -13.2% (35,765) -12.3% (122,088) (110,151) 10.8%
Provision for Income Tax (20,045) (18,885) 6.1% (23,498) -14.7% (89,892) (70,165) 28.1%Provision for Social Contribution Tax (12,357) (11,612) 6.4% (14,564) -15.2% (54,306) (42,474) 27.9%Deferred Taxes 1,036 (5,657) n.a. 2,297 -54.9% 22,110 2,488 n.a.Profit-Sharing (7,672) (12,097) -36.6% (9,874) -22.3% (33,375) (29,555) 12.9%Minority Interest (10) (13) -23.1% (10) 0.0% (48) (39) 23.1%
Net Income 90,714 95,698 -5.2% 70,881 28.0% 305,060 274,695 11.1%
Interest on Shareholders´ Equity (39,668) (39,445) 0.01 (25,022) 0.59 (104,912) (96,528) 0.09Earnings per Share (R$) 0.42 0.44 -5.2% 0.33 n.a. 1.41 1.27 0.11Number of Shares 215,704,049 215,662,382 n.a. 215,478,453 n.a. 215,704,049 215,478,453 n.a.

4Q11 Institutional Presentation
Investor RelationsPhone: +55 (11) 3138.1024/1025/1039
“This report may include estimates and forward-looking statements. These estimates and forward-looking statements are to a large extent based on current expectations andprojections about future events and financial trends that affect or may come to affect our business. Many important factors may adversely affect the results of Banco Daycoval asdescribed in our estimates and forward-looking statements. These factors include, but are not limited to, the following: the Brazilian and international economic conjunctures,fiscal, foreign-exchange and monetary policies, higher competition in the middle-market segment, the ability of Banco Daycoval to obtain funding for its operations, andamendments to Central Bank regulations.The words “believe”, “may”, “could”, “seek”, “estimate”, “continued”, “anticipate”, “plan”, “expect” and other similar words have the objective of identifying estimates andprojections. The considerations involving estimates and forward-looking statements include information related to results and projections, strategies, competitive positioning, theenvironment in the industry, growth opportunities, the effects of future regulations, and the impacts from competitors. Said estimates and projections refer only to the date onwhich they were expressed, and we do not assume any obligation to publicly update or revise any of these estimates arising from the occurrence of new information, futureevents, or any other factors. In view of the risks and uncertainties described above, the estimates and forward-looking statements contained herein may not materialize. Giventhese limitations, shareholders and investors should not make any decisions based on the estimates, projections and forward-looking statements contained in this report”.
44