4q19 earnings conference call · results of the company for the periods indicated. no...
TRANSCRIPT

ITGR: 4Q19 Earnings Conference Call / February 20, 2020 / Page 1
4Q19 Earnings Conference Call
February 20, 2020
ITGR: 4Q19 Earnings Conference Call / February 20, 2020 / Page 2
Integer Holdings CorporationFourth Quarter 2019 Earnings Conference Call9 a.m. Eastern Time, February 20, 2020
Speakers:
Joe Dziedzic
President and Chief Executive Officer
Jason Garland
Executive Vice President, Chief
Financial Officer
Tony Borowicz
Senior Vice President, Strategy,
Corporate Development & Investor
Relations
• A webcast of today’s call can be accessed
in the “Investors” section of the Company’s
website: http://investor.integer.net
• To participate on the call, please dial:
• 833-236-5762 (U.S.)
• 647-689-4190 (International)
• The conference ID is 8069250
• An online archive of the broadcast will be
available at the website three hours after
the live call, and will be available through
Thursday, February 27, 2020, by dialing
• 800-585-8367 (U.S.)
• 416-621-4642 (International)
• The conference ID is 8069250

ITGR: 4Q19 Earnings Conference Call / February 20, 2020 / Page 3
Presentation of Financial Information &
Forward-Looking StatementsImportant Information
This presentation contains summarized information concerning Integer Holdings Corporation (the “Company”) and its business,
operations, financial performance and trends. The historical financial and operating data contained herein reflect the consolidated
results of the Company for the periods indicated. No representation is made that the information in this presentation is complete. For
additional financial and business-related information, as well as information regarding business and product line trends, see the
Company’s most recent Annual Report on Form 10-K (“Form 10-K”) and Quarterly Reports on Form 10-Q filed with the U.S. Securities
and Exchange Commission (the “SEC”), as well other reports filed with the SEC from time-to-time. Such reports are or will be available
in the investor relations section of our corporate website (investor.integer.net) and the SEC’s website (www.sec.gov).
Non-GAAP Financial Measures. This presentation includes financial information prepared in accordance with accounting principles
generally accepted in the United States (“GAAP”) as well as other financial measures referred to as non-GAAP. The non-GAAP
financial measures in this presentation, which include adjusted net income, adjusted diluted earnings per share, earnings before
interest taxes depreciation and amortization (“EBITDA”), adjusted EBITDA, adjusted sales, and organic growth rates should be
considered in addition to, but not as substitutes for, the information prepared in accordance with GAAP. For reconciliations of these
non-GAAP financial measures to the most comparable GAAP measures, please refer to the appendix to this presentation and the
earnings release associated with this period which can be found in the investor relations section of our corporate website
(investor.integer.net).
Forward Looking Statements. Some of the statements contained in this presentation whether written or oral may be “forward-looking
statements” within the meaning of Section 27A of the Securities Act of 1933, as amended, and Section 21E of the Securities Exchange
Act of 1934, as amended, including statements relating to future sales, expenses, profitability, cash flows, debt repayments and
leverage; expected growth of our business and industry; our ability to execute our business model and our business strategy; our
ability to identify trends within our industries and to offer products and services that meet the changing needs of those markets; our
ability to repay existing indebtedness; projected capital expenditures; our expected tax rates; and other events, conditions or
developments that will or may occur in the future. You can identify forward-looking statements by terminology such as “may,” “will,”
“should,” “could,” “expects,” “intends,” “plans,” “anticipates,” “believes,” “estimates,” “predicts,” “see,” “potential” or “continue” or
“variations” or the negative of these terms or other comparable terminology. These statements are based on the Company’s current
expectations and speak only as of as of the date of this presentation. The Company’s actual results could differ materially from those
stated or implied by such forward-looking statements. Except as may be required by law, the Company assumes no obligation to
update forward-looking information, including information in this presentation, to reflect changed assumptions, the occurrence of
unanticipated events or changes in future operating results, financial conditions or prospects.

ITGR: 4Q19 Earnings Conference Call / February 20, 2020 / Page 4
Agenda
• Opening Comments
• Strategy Update
• Financial Results
• Product Line Review
• 2020 Outlook
• Question & Answer Period

ITGR: 4Q19 Earnings Conference Call / February 20, 2020 / Page 5
Opening Comments

ITGR: 4Q19 Earnings Conference Call / February 20, 2020 / Page 6
4Q Financial Results
• +7% sales growth … solid growth in all product lines
• Adj. EBITDA +8%, Adj. EPS +20%
• Debt leverage below 3 times Adjusted EBITDA
Full-Year Financial Results
• +4% sales growth … at low end of original guidance growth rate
• Adj. EBITDA +9%, Adj. EPS +23% … exceeded original guidance
• Paid $117 million debt … exceeded original guidance
Strong 2019 Financial Results …
All product lines posted
solid sales growth
Achieved two strategic
objectives: grew profit
2x sales growth rate
and reduced debt
leverage to 2.9x
(1) Guidance as provided during 4Q 2018 earnings call on February 21, 2019

ITGR: 4Q19 Earnings Conference Call / February 20, 2020 / Page 7
Strategy Update

ITGR: 4Q19 Earnings Conference Call / February 20, 2020 / Page 8
Journey to ExcellenceSales Growth versus Prior Year:
*Represents reported change prior to Advanced Surgical and Orthopedic (AS&O) divestiture
(2)%
(4)%
2015 20162015 2016
Declined
Declined
>6x
• Integrated $1.7B Lake
Region acquisition
• Spun off Nuvectra
• Challenging customer
relationships
Disruption
* *
5%
7%
2017 20182017 2018
Market growth
~1x sales growth
5.6x 3.5x
• New leadership team
• Operational stabilization
• Clear strategy
- Portfolio change
- Multi-year plans
Stabilizing & Building
*
Strategy Financial Objectives
• Sales growth 200 basis
points above market
• Profit growth 2x sales
growth rate
• Debt leverage 2.5x - 3.5x
1
2
3

ITGR: 4Q19 Earnings Conference Call / February 20, 2020 / Page 9
Portfolio StrategyOperational Strategy:
Strategic ImperativesHow we win
in the markets we serveHow we achieve excellence in everything we do
Cardio & Vascular
Neuromodulation
Electrochem
Portable Medical
Invest to Grow
Protect & Preserve
Cardiac Rhythm Management
Strategy Developed in 2nd half of 2017

ITGR: 4Q19 Earnings Conference Call / February 20, 2020 / Page 10
Business Presidents
Payman Khales
President
Cardio & Vascular
February 2018
Joel Becker
President, Cardiac
Rhythm Management
& Neuromodulation
April 2019
Carter Houghton
President, Electrochem
& Power Solutions
May 2019
Kirk Thor
Chief Human
Resources Officer
January 2018
Jason Garland
Chief Financial Officer
October 2018
Joe Flanagan
EVP, Quality &
Regulatory Affairs
2012
Jen Bolt
SVP, Global Operations
2005
Tony Borowicz
SVP, Strategy,
Business Development,
Investor Relations
2002
Functional Leaders
Joe Dziedzic
President & CEO
July 2017
Leadership Team In Place
Elizabeth Giddens
General Counsel and Chief
Ethics & Compliance Officer
August 2019
6 new leaders in 2018/2019

ITGR: 4Q19 Earnings Conference Call / February 20, 2020 / Page 11
Building & Strengthening Culture
Investing in Culture Strategic Imperatives 2018 & 2019 Actions
Building Leadership Capability to Deliver Performance Excellence
Leadership Capability
Performance ExcellenceHR Transformation
• Talent Analytics
• Talent Review / Evaluation
• Selection Process
• Leadership Development
• Succession Planning
• Strategic Workforce Planning
• Associate Engagement
• Performance Management
• Total Rewards
• Organization Effectiveness
• Selection Process− Structured Interview Training
− 430+ Leaders Trained
− 350+ Interviews Conducted
• Candidate Assessment
• Individual Development Plans
• Performance Management
− Psychometric Assessment
− 70+ Candidates
− Baseline for development plans
− 40% of Sr. Leaders/Mgrs
− 60% of HiPo’s + Successors
− HiPo’s + Successors
− Key Role Identification
− Compensation Differentiation
1
2
3
4
Headcount +8%
Dollars spend +13%

ITGR: 4Q19 Earnings Conference Call / February 20, 2020 / Page 12
20 LEAN Diagnosis events
Over 200 participants
140 Projects/Kaizen events
120 Site leaders trained
+50% +190 bps
July 2018 to December 2019 Adj. EBITDA Margin(1)LEAN Headcount
All sites trained & initial
LEAN Diagnosis executed
20.7%
22.6%
Investing in Manufacturing Excellence and LEAN
2017 2019 20192017
(1) Refer to the appendix of this presentation for a reconciliation of Adjusted EBITDA, Adjusted Net Income, Adjusted EPS, and organic growth rates to the most directly comparable GAAP measure

ITGR: 4Q19 Earnings Conference Call / February 20, 2020 / Page 13
Multi-year contracts
signed in 2019
+10% improvement+40% improvement
Delivering for Customers
~$425 million
Quality(1) On Time Delivery Sales
(1) Quality metric reflects improvement in customer complaints rate
Annual sales2017 20192017 2019

ITGR: 4Q19 Earnings Conference Call / February 20, 2020 / Page 14
Portfolio & Product Line Strategy
✓ Divested AS&O … $600 million price; EPS accretive day one
✓ Addressed Portable Medical profitability … “Invest to Grow”
✓ Launched Growth Teams in 4Q18 … Defined strategy
process; own development and oversight of execution
Operational Strategic Imperatives
Strategy Execution … Status
Culture
• Built Leadership
Team
• Aspire to
Excellence
Cost
• LEAN
Deployment
• Operational
Improvements
Customers
• New Sales
Leadership
• Adding
Capabilities

ITGR: 4Q19 Earnings Conference Call / February 20, 2020 / Page 15
Debt to Adj. EBITDA
Leverage Ratio(1)
Significantly Reduced Debt Leverage($ in millions)
(1) Leverage Ratio calculated as total principal amount of debt outstanding less Cash and Cash Equivalents divided by trailing 4 quarter Adjusted EBITDA
(2) Net Total Debt shown is total principal amount of debt outstanding less Cash and Cash Equivalents
Net Total Debt(2) $1,719 $1,598 $916 $812

ITGR: 4Q19 Earnings Conference Call / February 20, 2020 / Page 16
Delivered 67% Adjusted Earnings Per Share Growth
$2.81
$4.68
$3.80
Adjusted Earnings Per Share Up $1.87
+67%
Adjusted EPS(1)
(1) Refer to the appendix of this presentation for a reconciliation of Adjusted EBITDA, Adjusted Net Income, Adjusted EPS, and organic growth rates to the most directly comparable GAAP measure

ITGR: 4Q19 Earnings Conference Call / February 20, 2020 / Page 17
Delivering for Investors … Met or Exceeded Guidance(1)
($ in millions)
N/A $255 $275
to to to
N/A $259 $283
$2.70 $3.35 $4.05
to to to
$3.10 $3.80 $4.25
Adjusted Sales Adjusted EBITDA(2) Adjusted EPS
$1,390 $1,175 $1,260
to to to
$1,430 $1,200 $1,280
Guidance
Consistently Delivering on Commitments
$1,213 $1,258
$1,462
$1,131 $259$284
$295
$234$3.80
$4.68
$3.09
$2.81
With
AS&O
Without
AS&O
(1) Refer to the appendix of this presentation for a reconciliation of Adjusted EBITDA, Adjusted Net Income, Adjusted EPS, and organic growth rates to the most directly comparable GAAP measure
(2) Guidance not provided for 2017 Adjusted EBITDA

ITGR: 4Q19 Earnings Conference Call / February 20, 2020 / Page 18
2017 2018 2019
Profit Growth 2x Sales Growth Rate in 2019 … and Beyond($ in millions)
Adj. EBITDA $234
$259
$284
Continued Progress … Delivered Adj. EBITDA Growth 2.5x Sales Growth in 2019
Adj. EBITDA to
sales growth ratio(1) 0.1x 1.5x 2.5x
Adj. Sales growth 5% 7% 4%
Adj. EBITDA growth 0.1% 11% 9%
(1) Refer to the appendix of this presentation for a reconciliation of Adjusted EBITDA, Adjusted Net Income, Adjusted EPS, and organic growth rates to the most directly comparable GAAP measure

ITGR: 4Q19 Earnings Conference Call / February 20, 2020 / Page 19
Journey to ExcellenceSales Growth versus Prior Year:
(2)%
(4)%
2015 2016
5%
7%
2017 20182015 2016 2017 2018
Market growth
~1x sales growth
5.6x 3.5x
• New leadership team
• Operational stabilization
• Clear strategy
- Portfolio change
- Multi-year plans
Declined
Declined
>6x
• Integrated $1.7B Lake
Region acquisition
• Spun off Nuvectra
• Challenging customer
relationships
Market growth
2x sales growth
2.9x 2.5x - 3.5x
• Leadership team complete
• Executing strategy, including
bolt-on acquisitions
• Deleveraging
4%
2019 2020
3% - 4%
Disruption Stabilizing & Building Profit Expansion
*Represents reported change prior to AS&O divestiture
* * *
Strategy
Financial
Objectives
Sales growth
200 basis
points above
market
Profit growth
2x sales
growth rate
Debt leverage
2.5x – 3.5x
1
2
3

Financial Results

ITGR: 4Q19 Earnings Conference Call / February 20, 2020 / Page 21
(1) Refer to the appendix of this presentation for a reconciliation of Adjusted EBITDA, Adjusted Net Income, Adjusted EPS, and organic growth rates to the most directly comparable GAAP measure
($ in millions, except per share amounts)
Sales Adjusted EBITDA Adjusted Net Income
$326 $73$68
4Q19 Adjusted Financial Results(1)
$303 $34
$41
Adjusted EPS
% Growth 7% 8% 20%
$1.25$1.04
ITGR: 4Q19 Earnings Conference Call / February 20, 2020 / Page 22
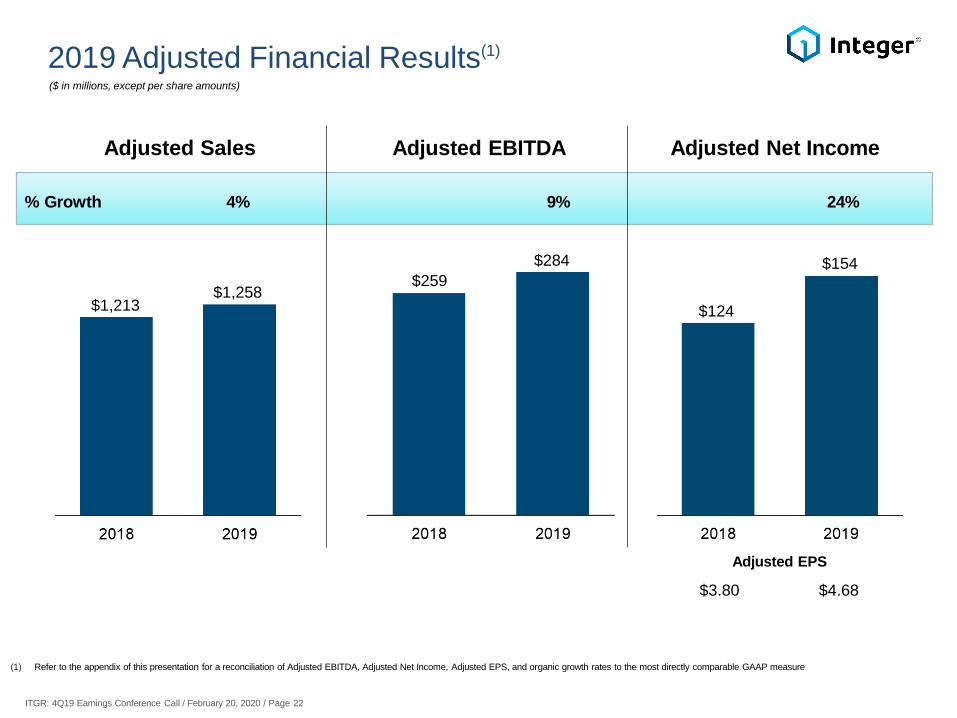
($ in millions, except per share amounts)
Adjusted Sales Adjusted EBITDA Adjusted Net Income
$1,258
$284
$259
$1,213 $124
$154
2019 Adjusted Financial Results(1)
% Growth 4% 9% 24%
(1) Refer to the appendix of this presentation for a reconciliation of Adjusted EBITDA, Adjusted Net Income, Adjusted EPS, and organic growth rates to the most directly comparable GAAP measure
Adjusted EPS
$4.68$3.80
ITGR: 4Q19 Earnings Conference Call / February 20, 2020 / Page 23
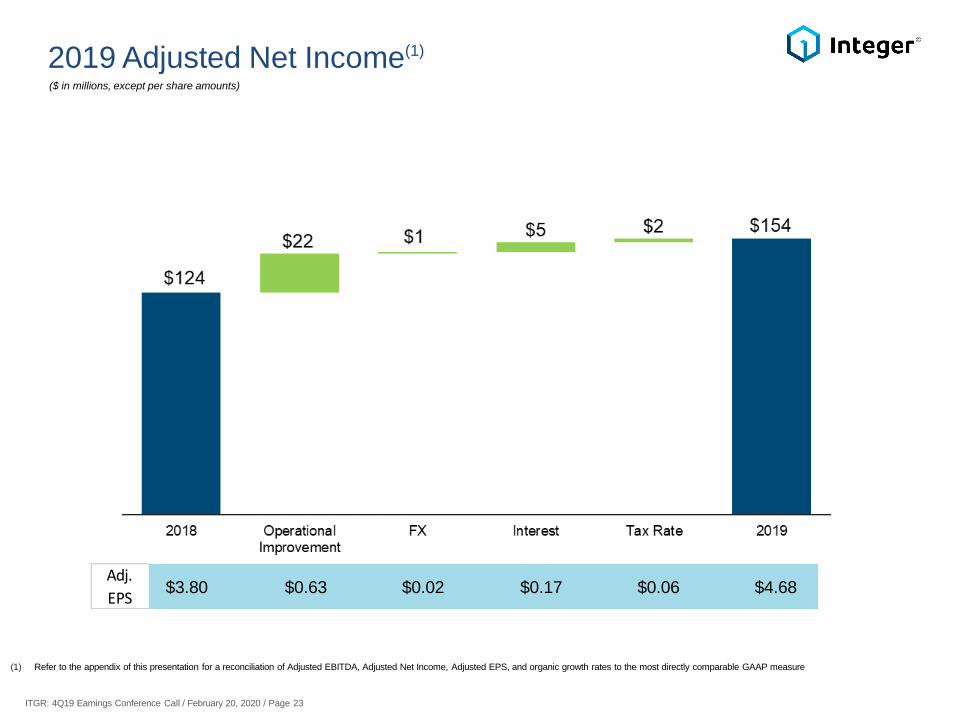
($ in millions, except per share amounts)
2019 Adjusted Net Income(1)
$3.80 $0.63 $0.02 $0.17 $0.06 $4.68Adj.
EPS
(1) Refer to the appendix of this presentation for a reconciliation of Adjusted EBITDA, Adjusted Net Income, Adjusted EPS, and organic growth rates to the most directly comparable GAAP measure

ITGR: 4Q19 Earnings Conference Call / February 20, 2020 / Page 24
2019 Actual Results Compared to Original Guidance
Debt Payments
(1) Free Cash Flow defined as Cash Flow from Operations less Capital Expenditures (acquisition of property, plant, and equipment (PP&E), net of proceeds from sale of PP&E)
(2) Leverage calculated as total principal amount of debt outstanding less Cash and Cash Equivalents divided by Trailing 4 Quarter Adjusted EBITDA
(3) 2019 guidance as provided on February 21, 2019
Cash Flow From Ops Free Cash Flow(1) Leverage(2)
($ in millions, except per share amounts)
Original
Guidance(3) Actual ActualActual Actual
$160 - $170$165
$110 - $120 $117$105 - $115
$117
2.5x - 3.5x
2.9x
Original
Guidance(3)
Original
Guidance(3)
Original
Guidance(3)
Memo:
Bus Dev $15

Product Line Review

ITGR: 4Q19 Earnings Conference Call / February 20, 2020 / Page 26
Cardio & Vascular
Year-over-Year Sales Growth Continues(1)
Trailing 4 Quarters
Integer – Trailing 4 Quarters
(1) Excludes impact from changes in foreign currency exchange rates and US Bio Design Acquisition
Advanced Surgical, Orthopedic & Portable Medical
Electrochem (Non-Medical)
Cardiac & Neuromodulation

ITGR: 4Q19 Earnings Conference Call / February 20, 2020 / Page 27
Offering a full-range of products and services for catheter-based interventional vascular devices and a suite of supply chain solutions to support the
development and manufacturing of complex components, sub-assemblies and finished devices
Steerable Sheaths Catheters & Sheaths Guidewires, Stylets & Accessories
Introducers
Reported Trailing 4 Quarter Sales($ in millions)
Quarterly Adjusted Sales Change(1)
Cardio & Vascular
10% 10% 7% 5% 4%
• 4Q19 growth led by a strong increase in peripheral vascular
demand from a customer launching existing program into new
geography and market growth. Incremental sales from the
signing of a customer contract on existing business fully offset
the impact of an end of life electrophysiology program
• Trailing 4 sales quarter driven by strong growth of peripheral
vascular and structural heart, overcoming a ~200 basis points
headwind from an end of life electrophysiology program
• Expect 2020 to be mid-single-digit growth as product
launches ramp and the impact of the end of life
electrophysiology program lessens
ramp down for
digits through 1H 2020 and increase in 2H 2020 to mid to high single digits
Y-o-Y%
Change
(1) Excludes impact from changes in foreign currency exchange rates and
acquisitions

ITGR: 4Q19 Earnings Conference Call / February 20, 2020 / Page 28
Providing technology solutions for the active implantable medical device industry by partnering with customers to bring high-quality products to
established and emerging markets – from initial concept through high-volume manufacturing
Pulse Generator Components &
Assemblies
Leads & Lead Components, Adaptors & Assemblies
Pulse Generators & External Solutions (Programmers, Chargers,
Patient Devices)
Reported Trailing 4 Quarter Sales($ in millions)
CRM & Neuromodulation
4% 4% 2% (1)% 3%
• 4Q19 growth driven by new and next generation product
launches, underlying strength in existing CRM programs,
and a new customer agreement on existing business,
partially offset by the Nuvectra Chapter 11 filing
• Trailing 4 quarter sales increase driven by CRM growth due
to higher market demand and the new customer agreement
on existing business, which was partially offset by slight
neuromodulation decline due to the Nuvectra Chapter 11
filing and market contraction
• Expect slight decline in total for 2020, as double-digit decline
in neuromodulation from Nuvectra bankruptcy offsets low-
single-digit growth in CRMY-o-Y%
Change
(1) Excludes impact from changes in foreign currency exchange rates
Quarterly Adjusted Sales Change(1)

ITGR: 4Q19 Earnings Conference Call / February 20, 2020 / Page 29
Orthopedic Implants &
Instruments
Core Battery
Pack AssembliesLi-Ion Battery
Packs
Electrosurgical
Accessories
Reported Trailing 4 Quarter Sales($ in millions)
Advanced Surgical, Orthopedics & Portable Medical
Offering a broad portfolio of power solutions and technologies to Portable
Medical markets and supporting the divested AS&O product line
14% 7% 1% 0% 1%
• 4Q19 sales growth driven by increased end-market demand
for Advanced Surgical and Orthopedic base products
• Trailing 4 quarter sales trend remains relatively flat across all
product lines
• Expect 2020 mid-single-digit growth with accelerating
Portable Medical demand
Y-o-Y%
Change
(1) Excludes impact from changes in foreign currency exchange rates
Quarterly Adjusted Sales Change(1)
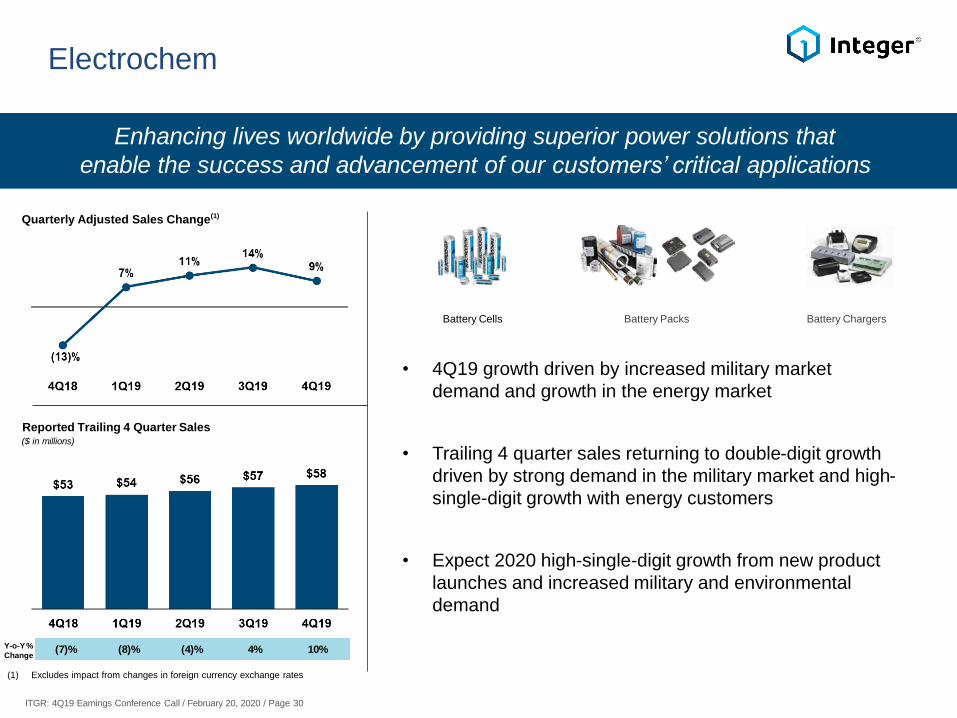
ITGR: 4Q19 Earnings Conference Call / February 20, 2020 / Page 30
Enhancing lives worldwide by providing superior power solutions that
enable the success and advancement of our customers’ critical applications
Battery Packs Battery ChargersBattery Cells
Reported Trailing 4 Quarter Sales($ in millions)
Electrochem
(7)% (8)% (4)% 4% 10%
• 4Q19 growth driven by increased military market
demand and growth in the energy market
• Trailing 4 quarter sales returning to double-digit growth
driven by strong demand in the military market and high-
single-digit growth with energy customers
• Expect 2020 high-single-digit growth from new product
launches and increased military and environmental
demand
Y-o-Y%
Change
(1) Excludes impact from changes in foreign currency exchange rates
Quarterly Adjusted Sales Change(1)

2020 Outlook

ITGR: 4Q19 Earnings Conference Call / February 20, 2020 / Page 32
2020 Sales Outlook($ in millions)
$59 - $79
$1,290 - $1,310
5% - 6% 3% - 4%(2)%% Growth
NuvectraFewer Days
in 2020
5 to 6% Growth Offset by 2% Headwinds
Growth Headwinds
Sales

ITGR: 4Q19 Earnings Conference Call / February 20, 2020 / Page 33
2020 Full-Year Outlook(1)
Adjusted EPS
% Growth 3% - 4% 9% - 13%
Sales
6% - 8%
Adjusted EBITDA
$1,258
$4.68
$1,290 - $1,310
$5.10 - $5.30$284$300 - $307
($ in millions, except per share amounts)
(1) Refer to the appendix of this presentation for a reconciliation of Adjusted EBITDA, Adjusted Net Income, Adjusted EPS, and organic growth rates to the most directly comparable GAAP measure

ITGR: 4Q19 Earnings Conference Call / February 20, 2020 / Page 34
Debt Payments
(1) Free Cash Flow defined as Cash Flow from Operations less Capital Expenditures (acquisition of property, plant, and equipment (PP&E), net of proceeds from sale of PP&E)
(2) Leverage calculated as total principal amount of debt outstanding less Cash and Cash Equivalents divided by Trailing 4 Quarter Adjusted EBITDA, as of end of each year
Cash Flow From Ops Free Cash Flow(1) Leverage(2)
2020 Cash Flow Outlook
$548
$175 - $185
$105 - $125
$90 - $110
$52 - $72
Divestiture Proceeds
Accelerated Repayment
Required Repayment
$700
$117
CAPEX $60 - $70
($ in millions, except per share amounts)
Target
2.5x - 3.5x
Memo:
Bus Dev $15 $10
$44 $48

Summary

ITGR: 4Q19 Earnings Conference Call / February 20, 2020 / Page 36
Journey to ExcellenceSales Growth versus Prior Year:
(2)%
(4)%
2015 2016
5%
7%
2017 20182015 2016 2017 2018
Market growth
~1x sales growth
5.6x 3.5x
• New leadership team
• Operational stabilization
• Clear strategy
- Portfolio change
- Multi-year plans
Declined
Declined
>6x
• Integrated $1.7B Lake
Region acquisition
• Spun off Nuvectra
• Challenging customer
relationships
Market growth
2x sales growth
2.9x 2.5x - 3.5x
• Leadership team complete
• Executing strategy, including
bolt-on acquisitions
• Deleveraging
4%
2019 2020
3% - 4%
Disruption Stabilizing & Building Profit Expansion
*Represents reported growth prior to AS&O divestiture
* * *
200 bps above market
2x sales growth
2.5x – 3.5x
“Excellence in
everything we do”
Market + 2%
Sales Growth Rate Expansion
Strategic Objectives

ITGR: 4Q19 Earnings Conference Call / February 20, 2020 / Page 37
R&D Headcount Sales & Marketing $ SpendCapabilities
Chaska, Plymouth
+C&V quick-turn
US BioDesign (M&A)
+Complex braiding
Salem
+Laser machining
2017 20202017 2020
+30%+25%
Investing in Capabilities for Growth
Inomec (M&A)
+Delivery systems,
catheters
Investing ~$35 million ‘18-’20
+ERP at 4 sites

ITGR: 4Q19 Earnings Conference Call / February 20, 2020 / Page 38
Salem MontevideoJuarez
Tijuana South Tijuana North
+Site expansion +Site expansion +Site expansion
+Build-out +First IPG device manufacturing site in Mexico, FDA approved
+IPG manufacturing capacity
Investing in Capacity for Growth
Investing ~$40 Million 2018 to 2020

ITGR: 4Q19 Earnings Conference Call / February 20, 2020 / Page 39
Attractive Value Proposition
Financial Objectives StatusInteger Strategy
Profit growth
2x sales
growth rate
Profit
• Strong Leadership Team2 • Investing to Execute Strategy4
• Clear Strategy1 • Delivering Strong Operational
& Financial Results3
Sales growth
200 bps above
market
Sales
2.5x – 3.5x
adjusted
EBITDA
Debt Leverage
Earn a valuation premium

ITGR: 4Q19 Earnings Conference Call / February 20, 2020 / Page 40
Questions?

ITGR: 4Q19 Earnings Conference Call / February 20, 2020 / Page 41
APPENDIX

ITGR: 4Q19 Earnings Conference Call / February 20, 2020 / Page 42
4Q19 Adjusted Net Income (1)
($ in millions, except per share amounts)
$1.04 $0.17 $(0.01) $0.05 $0.00 $1.25Adj.
EPS
(1) Refer to the appendix of this presentation for a reconciliation of Adjusted EBITDA, Adjusted Net Income, Adjusted EPS, and organic growth rates to the most directly comparable GAAP measure

ITGR: 4Q19 Earnings Conference Call / February 20, 2020 / Page 43
Debt Payments
(1) Free Cash Flow defined as Cash Flow from Operations less
Capital Expenditures (acquisition of property, plant, and
equipment (PP&E), net of proceeds from sale of PP&E)
(2) Leverage calculated as total principal amount of debt
outstanding less Cash and Cash Equivalents divided by
trailing 4 quarter Adjusted EBITDA
(3) 3Q18 Accelerated Repayments totaled $588M; $548M from
divestiture proceeds plus $40M from operations
Cash Flow From Ops Free Cash Flow (1)
Accelerated Repayment from Divestiture Proceeds
Accelerated Repayment
Required Repayment
• Reduced leverage ratio to
2.9 times adjusted EBITDA
• No significant maturities
until 2022; well within
covenants
Leverage (2)
$595
$40
$548
(3)
2019 Highlights
Cash Flow & Leverage($ in millions)

ITGR: 4Q19 Earnings Conference Call / February 20, 2020 / Page 44
Adjusted Sales Adjusted EPS
(1) Refer to the appendix of this presentation for a reconciliation of Adjusted Sales and Adjusted EPS to the most directly comparable GAAP measure
(2) The quarterly and annual EPS numbers are calculated independently and may not sum to the total
(3) Excludes impact of foreign currency reported in other (income)/loss, net
Impact of foreign currency reported in other (income)/loss, net
Adjusted EPS, as reported
Organic
Adjusted
EPS(3)
(2)
$265
$313 $305 $303$280 $285
$301 $292
$315 $314$304
$(0.05)
$(0.01)
$0.58 $0.91 $0.98 $0.89 $0.66 $1.01 $1.10 $1.04 $1.00 $1.23 $1.19 $1.26
$326
Historical Financial Results(1)
($ in millions, except per share amounts)

ITGR: 4Q19 Earnings Conference Call / February 20, 2020 / Page 45
2020 Full-Year Outlook($ in millions, except per share amounts)

ITGR: 4Q19 Earnings Conference Call / February 20, 2020 / Page 46
Non-GAAP ReconciliationIncome from Continuing Operations and Diluted EPS Reconciliation – QTD
See the Footnotes to this table on page 48 of this presentation
($ in thousands, except per share amounts)
** Watch the page # in the footnote **

ITGR: 4Q19 Earnings Conference Call / February 20, 2020 / Page 47
Non-GAAP ReconciliationIncome from Continuing Operations and Diluted EPS Reconciliation – YTD
See the Footnotes to this table on page 48 of this presentation
($ in thousands, except per share amounts)
ITGR: 4Q19 Earnings Conference Call / February 20, 2020 / Page 48
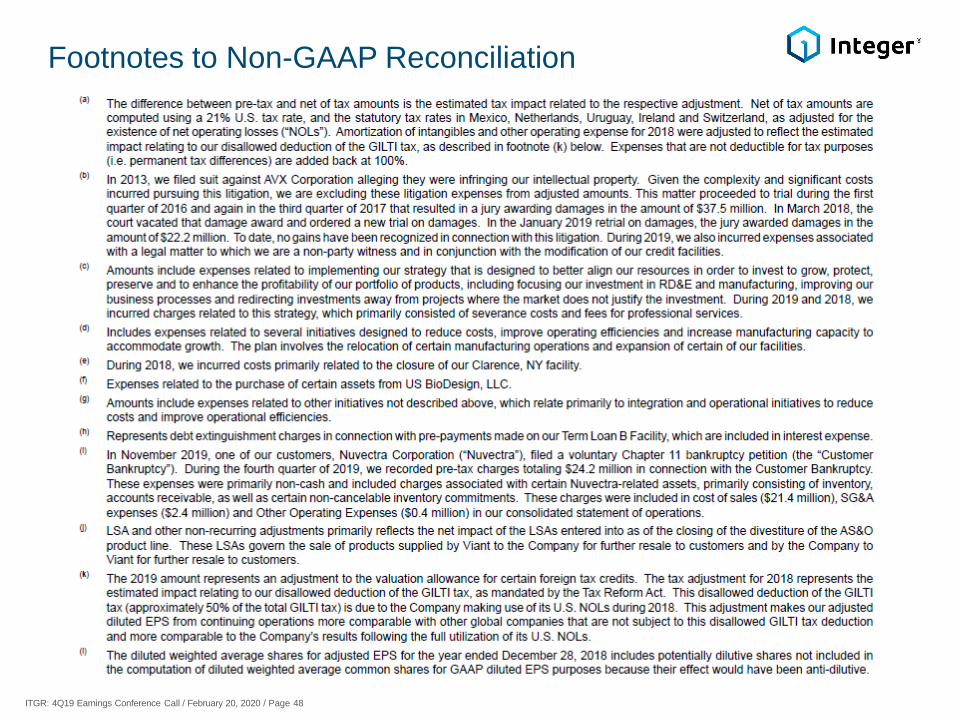
Footnotes to Non-GAAP Reconciliation

ITGR: 4Q19 Earnings Conference Call / February 20, 2020 / Page 49
Non-GAAP Reconciliation4Q19 Income from Continuing Operations and Diluted EPS Reconciliation – Detailed View
($ in thousands, except per share amounts)

ITGR: 4Q19 Earnings Conference Call / February 20, 2020 / Page 50
Non-GAAP ReconciliationYTD Income from Continuing Operations and Diluted EPS Reconciliation – Detailed View
($ in thousands, except per share amounts)
ITGR: 4Q19 Earnings Conference Call / February 20, 2020 / Page 51
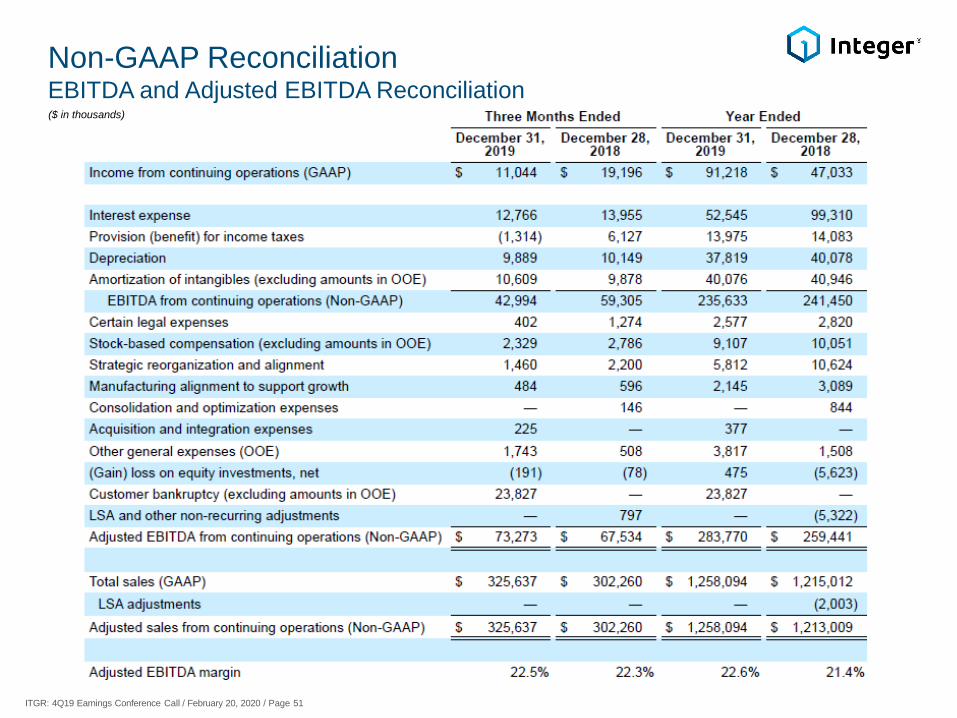
Non-GAAP ReconciliationEBITDA and Adjusted EBITDA Reconciliation($ in thousands)
ITGR: 4Q19 Earnings Conference Call / February 20, 2020 / Page 52
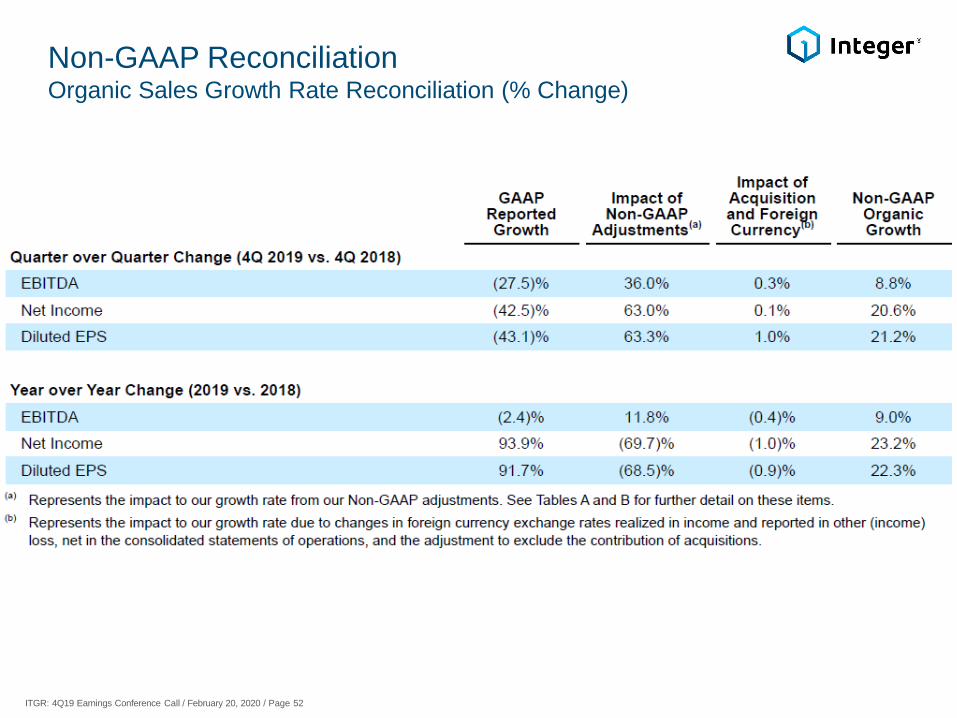
Non-GAAP ReconciliationOrganic Sales Growth Rate Reconciliation (% Change)

ITGR: 4Q19 Earnings Conference Call / February 20, 2020 / Page 53
12/31/19 Original 12/31/19
As Reported Rate Rate
Cash & Cash Equivalents 13$
$200M Revolver [Due 2022] -$ L + 325 L + 200
TLA [Due 2022] 267$ L + 325 L + 200
TLB [Due 2022] 558$ L + 425 L + 250
Total Principal Amount of Debt Outstanding 825$
Deferred Fees and OID (10)$
Total Debt (Principal Amount of Debt Outstanding Less Deferred Fees and Discounts) 815$
Net Total Debt (Principal Amount of Debt Outstanding Less Cash) 812$
Continuing Operations Statistics
Trailing 4 Quarter Adjusted EBITDA 284$
Trailing 4 Quarter Cash Interest Expense 45$
Trailing 4 Quarter Capital Expenditures 48$
Credit Statistics
Net Total Debt / Trailing 4 Quarter Adjusted EBITDA 2.9x
Trailing 4 Quarter Adjusted EBITDA / Cash Interest Expense 6.3x
(1)
(1) Principal amount of debt outstanding, not reduced for unamortized discount and debt issuance costs
(2) Leverage calculated as total principal amount of debt outstanding less Cash and Cash Equivalents divided by trailing 4 quarter Adjusted EBITDA
(2)
Capitalization($ in millions)
ITGR: 4Q19 Earnings Conference Call / February 20, 2020 / Page 54
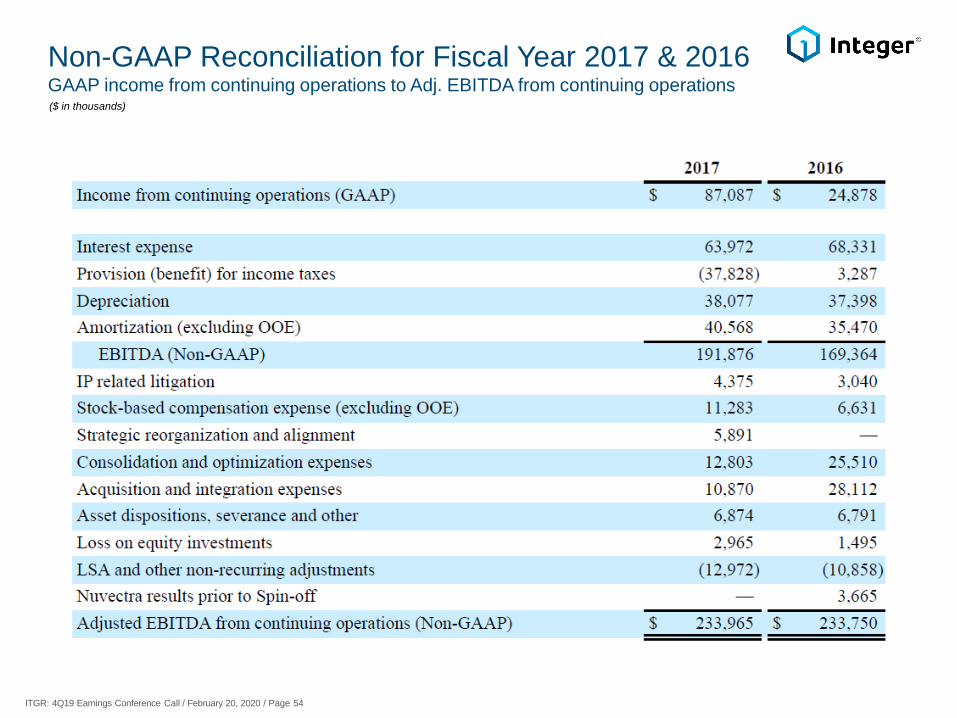
Non-GAAP Reconciliation for Fiscal Year 2017 & 2016GAAP income from continuing operations to Adj. EBITDA from continuing operations($ in thousands)

ITGR: 4Q19 Earnings Conference Call / February 20, 2020 / Page 55
Non-GAAP Reconciliation for Fiscal Year 2017 & 2016GAAP income from total operations to Adj. EBITDA from total operations($ in thousands)

ITGR: 4Q19 Earnings Conference Call / February 20, 2020 / Page 56
Non-GAAP Reconciliation for Fiscal Year 2017YTD Income from Continuing Operations and Diluted EPS Reconciliation – Detailed View($ in thousands, except per share amounts)

ITGR: 4Q19 Earnings Conference Call / February 20, 2020 / Page 57
Non-GAAP Reconciliation for Fiscal Year 2017GAAP net income and diluted EPS to adjusted amounts($ in thousands, except per share amounts)

ITGR: 4Q19 Earnings Conference Call / February 20, 2020 / Page 58
Non-GAAP Reconciliation for Fiscal Year 2017GAAP net income and diluted EPS to adjusted amounts – detailed view($ in thousands, except per share amounts)
(a)
(a)

ITGR: 4Q19 Earnings Conference Call / February 20, 2020 / Page 59
Contact Information
Tony BorowiczSVP, Strategy, Business Development & Investor Relations
www.integer.net
(O) 716.759.5809