4q19 earnings presentation
TRANSCRIPT

4Q19 Earnings Presentation

The following material presents the results for the fourth quarter of 2019 (4Q19 – Dec/2019 to Feb/2020) and of the year
2019 (Mar/2019 to Feb/2020). In this release, financial data is presented in accordance to the International Financial
Reporting Standards and represents the Company’s consolidated results in million reais (R$) with comparisons referring to
the fourth quarter of 2018 (4Q18 – Dec/2018 to Feb/2019; YoY comparisons) and to the year of 2018 (Mar/2018 to
Feb/2019), except when otherwise specified.
Results here presented contemplate the results of SLC Alimentos as of the acquisition´s conclusion, on December 3rd,
2018.
This presentation contains resumed information which shall not be considered complete. This material is published solely
for informational purposes and is not to be construed as a solicitation or an offer to buy or sell any securities or related
financial instruments. Likewise it does not give and should not be treated as giving investment advice. It has no regard to
the specific investment objectives, financial situation or particular needs of any recipient. Certain percentages and other
amounts included in this document have been rounded to facilitate its presentation. Thus, numbers presented as total in
some tables may not represent the arithmetic sum of the numbers that precede them and may differ from those presented
in the financial statements. Operational data are not audited, as they consist in measures which are not recognized by
IFRS or other accounting standards. Nor this presentation, neither anything here contained, should create basis for any
contract or commitment.
All information here contained are subject to adjustments and revisions without notice. By creating this presentation,
neither the Company, nor any of it´s affiliated companies, directors, executives or employees assume any obligation to
supply the receiver access to any additional information, update this presentation or any information, or correct any
inaccuracy in any of these informations. This presentation does not contain all of the relevant information about the
Company.
Disclaimer
2

3
Highlights
Awards
+ over 20 awards achieved by the Company, with highlights:
• IR Magazine 2019 Award– Best CFO (small caps);
• Acknowledgement to the IR Team by Institutional Investor 2019;
• União leader in the Sugar Category - Abase/Nielsen Award 2019
• Sales Leader 2019 Nielsen (União – most recalled brand)
• Camil achieves three trophees EMBANEWS Award 2019;
• Top Of Mind Award 2019 - Amanhã Magazine (Namorado, União);
• Award Companies which best communicate with journalists ;
• Estadão Empresa Mais 2019;
• Época ReclameAqui Award – Food Category (Grocery)
• APAS Acontece Award 2019 – 3rd consecutive year;
• Best in Agribusiness Award 2019 –Globo Rural Magazine.
X-R
ay
Dig
ital
Pla
tfo
rms
News and Announcements
• Covid-19: many measures were taken to address thescenario caused by the pandemic with focus on:
• Employees safety;
• Operations continuity; and
• Liquidity.
• Strengthening of short term financial liquidity: uptake ofR$1.3 billion in resources in Mar/20 and Apr/20, includingthe Pet Food acquisition in Chile
Subsequent Events
• Announcement of the Pet Food Business unit acquisitionfrom Empresas Iansa S.A;
• IOE: total distribution of R$51 million during 2019
• Share Buyback Program: 3rd Program concluded in november2019, acquiring 30.6 million shares held by Warburg Pincus;
• New Unit Launches: Barra Bonita-SP (sugar production andpackaging) and Suape-PE (multicategory)
• CRA IV Issuance of R$600 million for Camil Alimentos;
• SLC Alimentos Incorporation
Highlights 2019
Site: 1,4 mn users
2,5 mn page
visualizations
500 k followers
12 k followers
40,6 k subscribers
Site: 1,3 mn users
3,5 mn page
visualizations
1,2 mn followers
117 k followers
92 k subscribers
Site: 391 k users
1,2 mn page
visualizations
323 k followers
8,7 k followers
7,2 k subscribers
Awards and Brands
Brands
Campaigns which reinforce the long term construction of Brands:
• Vem pra Mesa Brasil Promotion (multicategory)• Beleza na Lata Promotion (Canned Fish)• União: União Secret Santa/ Mara Cakes Fair/ Cake Truck• Masterchef and Me Poupe on TV
4
Main Indicators
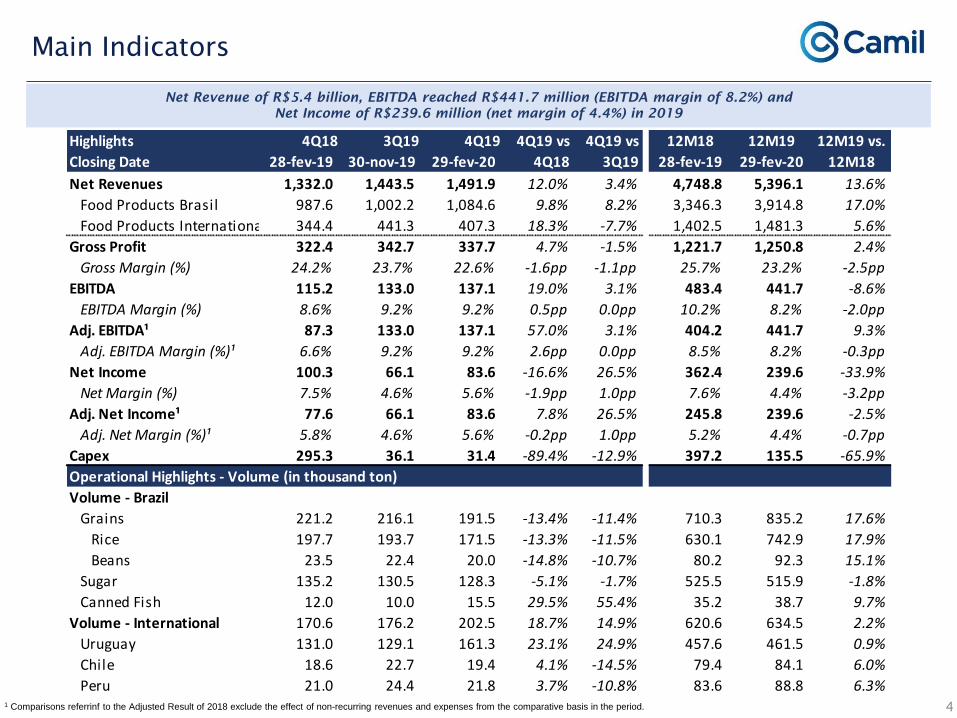
Net Revenue of R$5.4 billion, EBITDA reached R$441.7 million (EBITDA margin of 8.2%) and
Net Income of R$239.6 million (net margin of 4.4%) in 2019
1 Comparisons referrinf to the Adjusted Result of 2018 exclude the effect of non-recurring revenues and expenses from the comparative basis in the period.
Highlights 4Q18 3Q19 4Q19 4Q19 vs 4Q19 vs 12M18 12M19 12M19 vs.
Closing Date 28-fev-19 30-nov-19 29-fev-20 4Q18 3Q19 28-fev-19 29-fev-20 12M18
Net Revenues 1,332.0 1,443.5 1,491.9 12.0% 3.4% 4,748.8 5,396.1 13.6%
Food Products Brasil 987.6 1,002.2 1,084.6 9.8% 8.2% 3,346.3 3,914.8 17.0%
Food Products International 344.4 441.3 407.3 18.3% -7.7% 1,402.5 1,481.3 5.6%
Gross Profit 322.4 342.7 337.7 4.7% -1.5% 1,221.7 1,250.8 2.4%
Gross Margin (%) 24.2% 23.7% 22.6% -1.6pp -1.1pp 25.7% 23.2% -2.5pp
EBITDA 115.2 133.0 137.1 19.0% 3.1% 483.4 441.7 -8.6%
EBITDA Margin (%) 8.6% 9.2% 9.2% 0.5pp 0.0pp 10.2% 8.2% -2.0pp
Adj. EBITDA¹ 87.3 133.0 137.1 57.0% 3.1% 404.2 441.7 9.3%
Adj. EBITDA Margin (%)¹ 6.6% 9.2% 9.2% 2.6pp 0.0pp 8.5% 8.2% -0.3pp
Net Income 100.3 66.1 83.6 -16.6% 26.5% 362.4 239.6 -33.9%
Net Margin (%) 7.5% 4.6% 5.6% -1.9pp 1.0pp 7.6% 4.4% -3.2pp
Adj. Net Income¹ 77.6 66.1 83.6 7.8% 26.5% 245.8 239.6 -2.5%
Adj. Net Margin (%)¹ 5.8% 4.6% 5.6% -0.2pp 1.0pp 5.2% 4.4% -0.7pp
Capex 295.3 36.1 31.4 -89.4% -12.9% 397.2 135.5 -65.9%
Operational Highlights - Volume (in thousand ton)
Volume - Brazil
Grains 221.2 216.1 191.5 -13.4% -11.4% 710.3 835.2 17.6%
Rice 197.7 193.7 171.5 -13.3% -11.5% 630.1 742.9 17.9%
Beans 23.5 22.4 20.0 -14.8% -10.7% 80.2 92.3 15.1%
Sugar 135.2 130.5 128.3 -5.1% -1.7% 525.5 515.9 -1.8%
Canned Fish 12.0 10.0 15.5 29.5% 55.4% 35.2 38.7 9.7%
Volume - International 170.6 176.2 202.5 18.7% 14.9% 620.6 634.5 2.2%
Uruguay 131.0 129.1 161.3 23.1% 24.9% 457.6 461.5 0.9%
Chile 18.6 22.7 19.4 4.1% -14.5% 79.4 84.1 6.0%
Peru 21.0 24.4 21.8 3.7% -10.8% 83.6 88.8 6.3%

5
Financial Highlights of the Quarter
1 Comparisons referrinf to the Adjusted Result of 2018 exclude the effect of non-recurring revenues and
expenses from the comparative basis in the period.
Highlights (var. YoY) Profitability Evolution (R$mm)
4Q19: Gross Revenue Breakdown (R$mm)
R$1.7 billion Gross Revenue( +12.9%)
R$1.5 billion Net Revenue ( +12.0%)
R$1,085 million Brazil Food Segment ( +9.8%)
R$407 million International Food Segment ( +18.3%)
R$338 million Gross Profit ( +4.7%)
22.6% Gross Margin ( -1.6pp)
Sequential Margin Decrease ( -1.1pp QoQ)
Highlights to the Net Revenue of R$1.5 billion, Gross Profit of R$337.7 million (gross margin of 22.6%), EBITDA of R$137.1 million
(EBITDA margin of 9.2%) and Net Income of R$83.6 million (net margin of 5.6%) in the quarter
R$137 million EBITDA ( +19.0%)
vs. Adjusted EBITDA 4Q181( +57.0%)
9.2% EBITDA Margin ( +0.5pp)
vs. Adjusted EBITDA Margin 4Q181( +2.6pp)
Sequential Margin Increase ( +0.0pp QoQ)
R$84 million Net Income ( -16.6%)
vs. Adjusted Net Income 4Q181( +7.8%)
5.6% Net Margin ( -1.9pp)
vs. Adjusted Net Margin 4Q181( -0.2pp)
Sequential Margin Increase ( +1.0pp QoQ)
2.3x Net Debt/EBITDA
Source: Company
Source: Company
11%10%10%10%11%
14%11%
8%10%10%
11%11%8%
12% 12%9%
7% 7%9% 9%
3% 3% 2% 2%
4% 5% 5%
2%
5%3%
6% 7%
3%
7% 12%
8%4% 3%5% 6%
24%24%24%25%26%28%
23%22%24%24%25%26%26%28%
25%24%23%23%24%23%
R$0
R$50
R$100
R$150
R$200
R$250
R$300
1Q152Q153Q154Q151Q162Q163Q164Q161Q172Q173Q174Q171Q182Q183Q184Q181Q192Q193Q194Q19
EBITDA Net Income EBITDA Margin Net Margin Gross Margin
26
14231
GR 4Q18 Volume Price FX GR 4Q19
1,538
1,737
Part % 13% 71% 16%

Highlights (var. YoY) Profitability Evolution (R$mn)
2019: Gross Revenue Breakdown (R$mn)
Net Revenue of R$5.4 billion, Gross Profit of R$1.3 billion (gross margin of 23.2%), EBITDA of R$441.7 million (EBITDA margin of 8.2%)
and Net Income of R$239.6 million (net margin of 4.4%) in 2019
6
Financial Highlights of the Year
1 Comparisons referrinf to the Adjusted Result of 2018 exclude the effect of non-recurring revenues and
expenses from the comparative basis in the period.
R$6.3 billion Gross Revenue ( +13,6%)
R$1.3 billion Gross Profit ( +2.4%)
23.2% Gross Margin ( -2.5pp)
2.3x Net Debt/EBITDA
R$5.4 billion Net Revenue ( +13.6%)
R$3,915 million Brasil Food Segment ( +17.0%)
R$1,481 million International Food Segment ( +5.6%)
R$442 million EBITDA ( -8.6%)
vs. Adjusted EBITDA 4Q181( +9.3%)
8.2% EBITDA Margin ( -2.0pp)
vs. Adjusted EBITDA Margin 4Q181( -0.3pp)
R$240 million Net Income ( -33.9%)
vs. Adjusted Net Income 4Q181( -2.5%)
4.4% Net Margin ( -3.2pp)
vs. Adjusted Net Margin 4Q181( -0.7pp)
Source: Company
Source: Company
10% 10% 10% 11% 11% 10%8%
3% 3% 3%4%
5%7%
4%
R$0
R$100
R$200
R$300
R$400
R$500
R$600
12M13 12M14 12M15 12M16 12M17 12M18 12M19
EBITDA Net Income EBITDA Margin Net Margin
446
21686
5,503
GR 2018 Volume Price FX GR 2019
6,251
Part % 60% 29% 11%

7
Operational Highlights
Annual Volume Evolution (k ton) Quarterly Volume Evolution (k ton)
Volume Breakdown by Country (%) Volume Breakdown by Segment (%)
201920194Q19 4Q19
Quarter highlighted by increase in sales volumes in canned fish +29.5% YoY and international +18.7% YoY. Highlights in 2019 to
volumes increase in rice +17.9% YoY, beans +15.1% YoY, canned fish +9.7% YoY and international +2.2% YoY
Uruguai74%
Chile13%
Peru13%
Uruguai80%
Chile9%
Peru11%
596.119 630.093 742.796
72.418 80.205 92.260
541.185 525.585 515.852
36.132 35.230 38.620
731.895 620.559 634.407
0
500.000
1.000.000
1.500.000
2.000.000
2.500.000
2017 2018 2019Arroz Feijão Açúcar Pescados Internacional
1.891.6722.023.935 1.977.749
197.696 193.700 171.500
23.468 22.388 20.000
135.207 130.548 128.300
11.965 9.976 15.500
170.632 176.192 202.460
0
100.000
200.000
300.000
400.000
500.000
600.000
700.000
4T18 3T19 4T19Arroz Feijão Açúcar Pescados Internacional
532.804 537.760538.968
+0.9% QoQ
-0.2% YoY
+7.0% vs. 2018
+2.3% vs. 2017
Source: Company
Source: Company
Source: Company
Source: Company
630,093 742,796
80,205 92,260
525,585 515,852
35,230 38,620
620,559 634,407
0
500,000
1,000,000
1,500,000
2,000,000
2,500,000
2018 2019
Rice Beans Sugar Fish International
1.891.672
4Q18 3Q19 4Q19
630,093 742,796
80,205 92,260
525,585 515,852
35,230 38,620
620,559 634,407
0
500,000
1,000,000
1,500,000
2,000,000
2,500,000
2018 2019
Rice Beans Sugar Fish International
1.891.672
Brasil62%
International38%
Brasil69%
International31%
187,227 190,369 193,700 171,500
147,554 128,372
197,696 171,500
630,093
742,796 2.1
2.22.3
2.3 2.3
2.02.1
2.3
2.2 2.2
0.0
0.5
1.0
1.5
2.0
2.5
0
100,000
200,000
300,000
400,000
500,000
600,000
700,000
800,000
900,000
1Q19 2Q19 3Q19 4Q19 4Q16 4Q17 4Q18 4Q19
Rice Net Prices (R$/kg)
8
Brazil Food Segment | Rice
Sales Volume
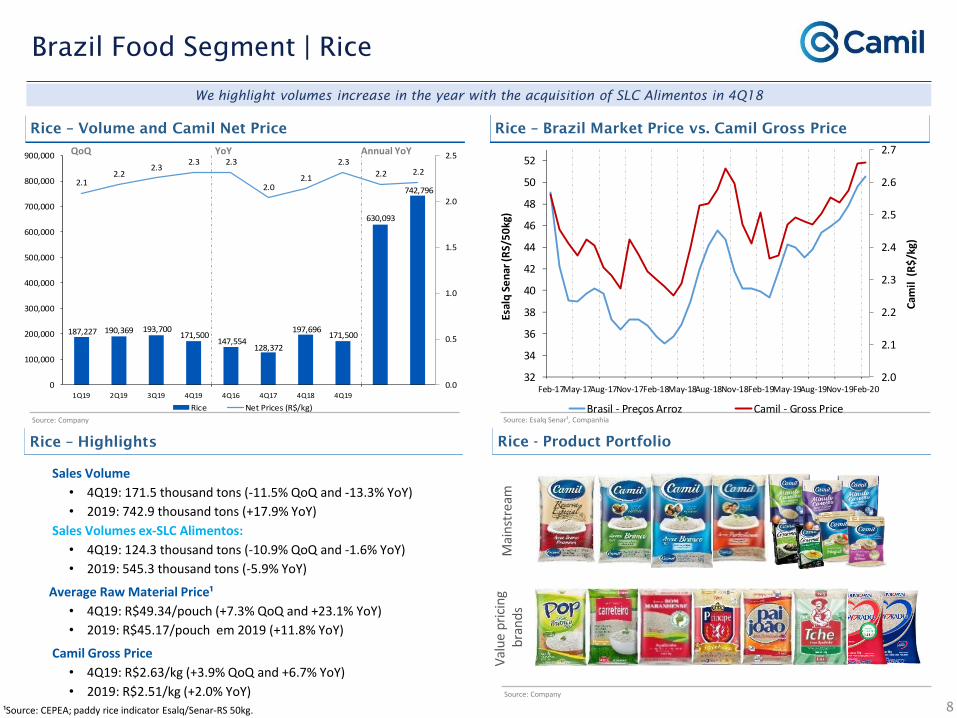
• 4Q19: 171.5 thousand tons (-11.5% QoQ and -13.3% YoY)
• 2019: 742.9 thousand tons (+17.9% YoY)
Sales Volumes ex-SLC Alimentos:
• 4Q19: 124.3 thousand tons (-10.9% QoQ and -1.6% YoY)
• 2019: 545.3 thousand tons (-5.9% YoY)
Average Raw Material Price¹
• 4Q19: R$49.34/pouch (+7.3% QoQ and +23.1% YoY)
• 2019: R$45.17/pouch em 2019 (+11.8% YoY)
Camil Gross Price
• 4Q19: R$2.63/kg (+3.9% QoQ and +6.7% YoY)
• 2019: R$2.51/kg (+2.0% YoY)
Source: Company Source: Esalq Senar¹, Companhia
We highlight volumes increase in the year with the acquisition of SLC Alimentos in 4Q18
Rice – Volume and Camil Net Price Rice – Brazil Market Price vs. Camil Gross Price
Rice - Product Portfolio Rice – Highlights
¹Source: CEPEA; paddy rice indicator Esalq/Senar-RS 50kg.
Source: Company
Mai
nst
ream
Val
ue
pri
cin
gb
ran
ds
QoQ YoY Annual YoY
2.0
2.1
2.2
2.3
2.4
2.5
2.6
2.7
32
34
36
38
40
42
44
46
48
50
52
Feb-17May-17Aug-17Nov-17Feb-18May-18Aug-18Nov-18Feb-19May-19Aug-19Nov-19Feb-20
Cam
il (
R$
/kg)
Esal
q S
en
ar (R
S/5
0kg
)
Brasil - Preços Arroz Camil - Gross Price
23,339 26,533
22,388 20,000 19,293 16,413
23,468 20,000
80,205
92,260
4.6
3.63.8
4.6
3.8
2.9
4.3
4.6
3.3
4.2
0.0
0.5
1.0
1.5
2.0
2.5
3.0
3.5
4.0
4.5
5.0
0
20,000
40,000
60,000
80,000
100,000
120,000
140,000
1Q19 2Q19 3Q19 4Q19 4Q16 4Q17 4Q18 4Q19
Beans Net Prices (R$/kg)
Mai
nst
ream
Val
ue
pri
cin
gb
ran
ds
9
Brazil Food Segment | Beans
Source: Company Source: Agrolink¹, Company
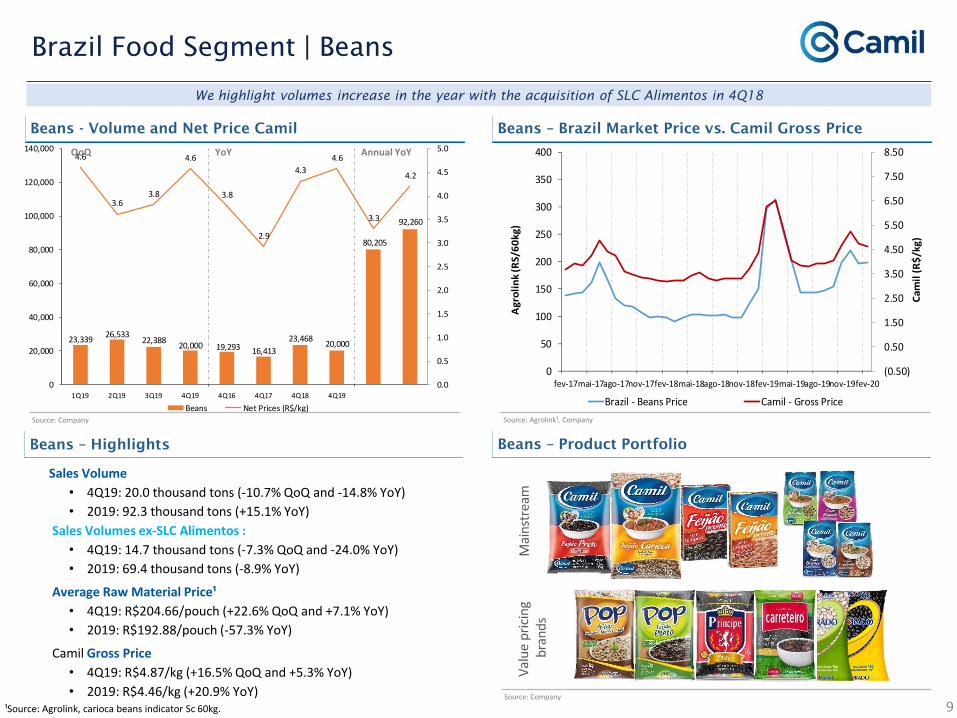
We highlight volumes increase in the year with the acquisition of SLC Alimentos in 4Q18
Beans - Volume and Net Price Camil Beans – Brazil Market Price vs. Camil Gross Price
Beans – Product Portfolio Beans – Highlights
¹Source: Agrolink, carioca beans indicator Sc 60kg.Source: Company
Sales Volume
• 4Q19: 20.0 thousand tons (-10.7% QoQ and -14.8% YoY)
• 2019: 92.3 thousand tons (+15.1% YoY)
Sales Volumes ex-SLC Alimentos :
• 4Q19: 14.7 thousand tons (-7.3% QoQ and -24.0% YoY)
• 2019: 69.4 thousand tons (-8.9% YoY)
Average Raw Material Price¹
• 4Q19: R$204.66/pouch (+22.6% QoQ and +7.1% YoY)
• 2019: R$192.88/pouch (-57.3% YoY)
Camil Gross Price
• 4Q19: R$4.87/kg (+16.5% QoQ and +5.3% YoY)
• 2019: R$4.46/kg (+20.9% YoY)
QoQ YoY Annual YoY
(0.50)
0.50
1.50
2.50
3.50
4.50
5.50
6.50
7.50
8.50
0
50
100
150
200
250
300
350
400
fev-17mai-17ago-17nov-17fev-18mai-18ago-18nov-18fev-19mai-19ago-19nov-19fev-20
Cam
il (
R$
/kg)
Agr
oli
nk
(RS/
60
kg)
Brazil - Beans Price Camil - Gross Price
137,464 119,540 130,548 128,300 125,420 118,028
135,207 128,300
525,585 515,852
1.71.9
2.0 2.0
2.3
1.81.7
2.0
1.81.9
-2.0
-1.5
-1.0
-0.5
0.0
0.5
1.0
1.5
2.0
2.5
0
100,000
200,000
300,000
400,000
500,000
600,000
700,000
1Q19 2Q19 3Q19 4Q19 4Q16 4Q17 4Q18 4Q19
Sugar Net Prices (R$/kg)
10
Brazil Food Segment | Sugar
Source: Esalq Senar Source: Esalq Senar, Companhia
Sugar – Volume and Camil Net Price Sugar – Brasil Market Price vs. Camil Gross Price
Sugar – Product Portfolio Sugar – Highlights
Source: Company
¹Source: CEPEA Cristal sugar indicator Esalq-SP 50kg.
Mai
nst
ream
Val
ue
pri
cin
gb
ran
ds
Sales Volume
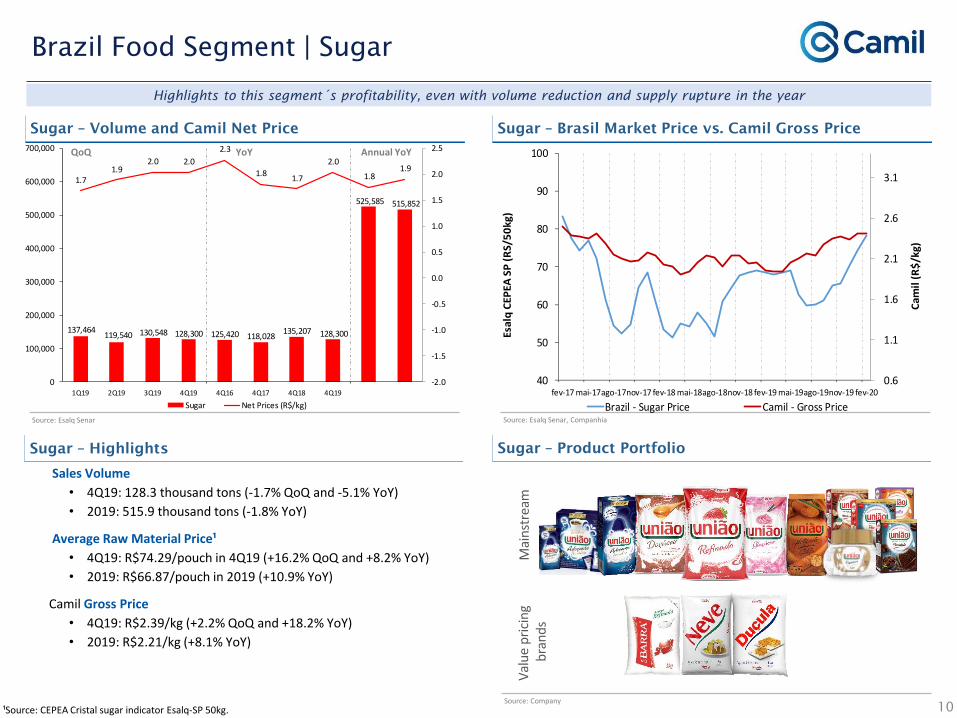
• 4Q19: 128.3 thousand tons (-1.7% QoQ and -5.1% YoY)
• 2019: 515.9 thousand tons (-1.8% YoY)
Average Raw Material Price¹
• 4Q19: R$74.29/pouch in 4Q19 (+16.2% QoQ and +8.2% YoY)
• 2019: R$66.87/pouch in 2019 (+10.9% YoY)
Camil Gross Price
• 4Q19: R$2.39/kg (+2.2% QoQ and +18.2% YoY)
• 2019: R$2.21/kg (+8.1% YoY)
QoQ YoY Annual YoY
Highlights to this segment´s profitability, even with volume reduction and supply rupture in the year
0.6
1.1
1.6
2.1
2.6
3.1
40
50
60
70
80
90
100
fev-17 mai-17ago-17nov-17 fev-18 mai-18ago-18nov-18 fev-19 mai-19ago-19nov-19 fev-20
Cam
il (
R$
/kg)
Esal
q C
EPEA
SP
(R
S/5
0kg
)
Brazil - Sugar Price Camil - Gross Price

11
Brazil Food Segment | Fish
Source: Company Source: Company
Highlights to volume increase in the quarter and in the year
Fish - Volume and Net Price Camil Fish – Gross Price Camil (R$/kg)
Fish – Product Portfolio Fish – Highlights
Source: Company
Mai
nst
ream
Val
ue
pri
cin
gb
ran
ds
Sales Volume
• 4Q19: 15.5 thousand tons (+55.4% QoQ and +29.5% YoY)
• 2019: 38.7 thousand tons (+9.7% YoY)
Raw Material
• Continued difficulties in local fishing
Camil Gross Price
• 4Q19: R$20.94/kg (+2.8% QoQ and +3.1% YoY)
• 2019: R$20.61/kg (+1.1% YoY)
QoQ YoY Annual YoY
16
17
18
19
20
21
22
23
Feb-17 May-17 Aug-17 Nov-17 Feb-18 May-18 Aug-18 Nov-18 Feb-19 May-19 Aug-19 Nov-19 Feb-20
Camil - Gross Price (R$/kg)
7,045 6,099
9,976
15,500 14,020
11,394 11,965
15,500
35,230
38,620
14.55 15.75 15.95 15.80
13.07
15.01 15.33 15.80 15.45 15.60
0.0
2.0
4.0
6.0
8.0
10.0
12.0
14.0
16.0
0
5,000
10,000
15,000
20,000
25,000
30,000
35,000
40,000
45,000
1Q19 2Q19 3Q19 4Q19 4Q16 4Q17 4Q18 4Q19
Fish Net Prices (R$/kg)
0
100,000
200,000
300,000
400,000
500,000
600,000
700,000
1Q19 2Q19 3Q19 4Q19 4Q16 4Q17 4Q18 4Q19
Uruguay Chile Peru
12
International Food Segment
Chile
Uruguay
Domestic
Market
Domestic
Market
Export
Market
Peru
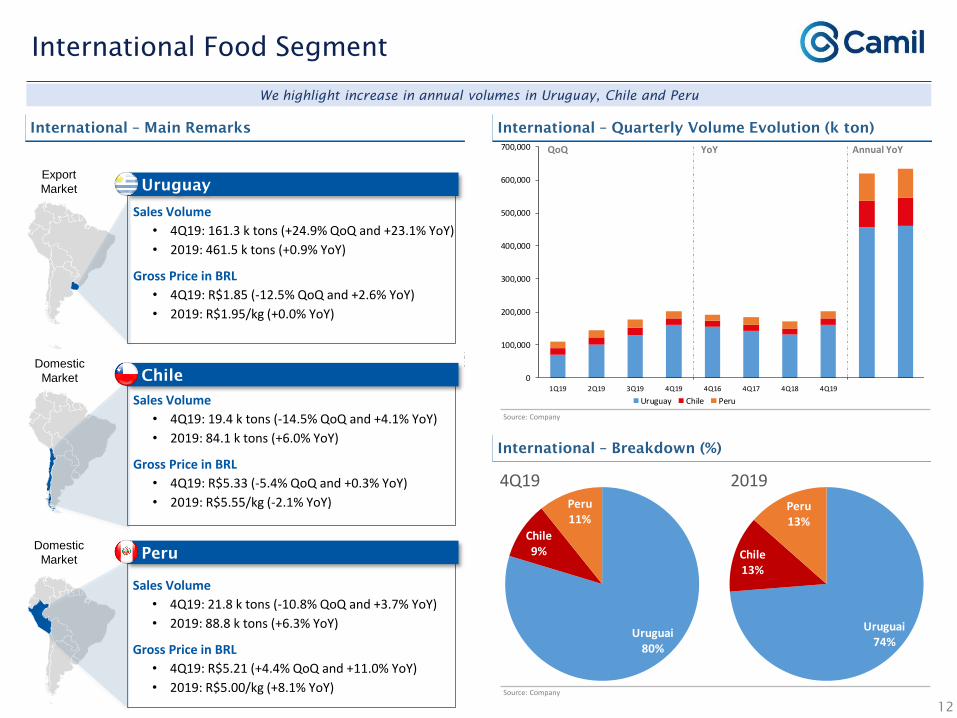
Sales Volume
• 4Q19: 161.3 k tons (+24.9% QoQ and +23.1% YoY)
• 2019: 461.5 k tons (+0.9% YoY)
Gross Price in BRL
• 4Q19: R$1.85 (-12.5% QoQ and +2.6% YoY)
• 2019: R$1.95/kg (+0.0% YoY)
Source: Company
Source: Company
International – Quarterly Volume Evolution (k ton)
International – Breakdown (%)
We highlight increase in annual volumes in Uruguay, Chile and Peru
International – Main Remarks
Sales Volume
• 4Q19: 19.4 k tons (-14.5% QoQ and +4.1% YoY)
• 2019: 84.1 k tons (+6.0% YoY)
Gross Price in BRL
• 4Q19: R$5.33 (-5.4% QoQ and +0.3% YoY)
• 2019: R$5.55/kg (-2.1% YoY)
Sales Volume
• 4Q19: 21.8 k tons (-10.8% QoQ and +3.7% YoY)
• 2019: 88.8 k tons (+6.3% YoY)
Gross Price in BRL
• 4Q19: R$5.21 (+4.4% QoQ and +11.0% YoY)
• 2019: R$5.00/kg (+8.1% YoY)
Uruguai74%
Chile13%
Peru13%
Uruguai80%
Chile9%
Peru11%
20194Q19
QoQ YoY Annual YoY
13
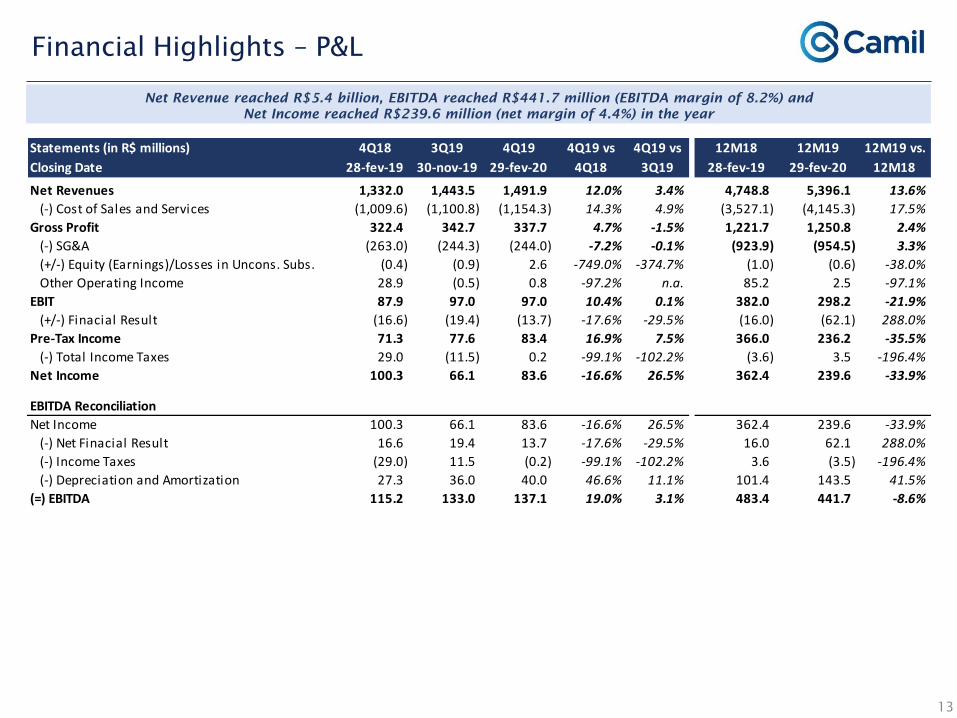
Financial Highlights – P&L
Net Revenue reached R$5.4 billion, EBITDA reached R$441.7 million (EBITDA margin of 8.2%) and
Net Income reached R$239.6 million (net margin of 4.4%) in the year
Statements (in R$ millions) 4Q18 3Q19 4Q19 4Q19 vs 4Q19 vs 12M18 12M19 12M19 vs.
Closing Date 28-fev-19 30-nov-19 29-fev-20 4Q18 3Q19 28-fev-19 29-fev-20 12M18
Net Revenues 1,332.0 1,443.5 1,491.9 12.0% 3.4% 4,748.8 5,396.1 13.6%
(-) Cost of Sales and Services (1,009.6) (1,100.8) (1,154.3) 14.3% 4.9% (3,527.1) (4,145.3) 17.5%
Gross Profit 322.4 342.7 337.7 4.7% -1.5% 1,221.7 1,250.8 2.4%
(-) SG&A (263.0) (244.3) (244.0) -7.2% -0.1% (923.9) (954.5) 3.3%
(+/-) Equity (Earnings)/Losses in Uncons. Subs. (0.4) (0.9) 2.6 -749.0% -374.7% (1.0) (0.6) -38.0%
Other Operating Income 28.9 (0.5) 0.8 -97.2% n.a. 85.2 2.5 -97.1%
EBIT 87.9 97.0 97.0 10.4% 0.1% 382.0 298.2 -21.9%
(+/-) Finacial Result (16.6) (19.4) (13.7) -17.6% -29.5% (16.0) (62.1) 288.0%
Pre-Tax Income 71.3 77.6 83.4 16.9% 7.5% 366.0 236.2 -35.5%
(-) Total Income Taxes 29.0 (11.5) 0.2 -99.1% -102.2% (3.6) 3.5 -196.4%
Net Income 100.3 66.1 83.6 -16.6% 26.5% 362.4 239.6 -33.9%
EBITDA Reconciliation
Net Income 100.3 66.1 83.6 -16.6% 26.5% 362.4 239.6 -33.9%
(-) Net Finacial Result 16.6 19.4 13.7 -17.6% -29.5% 16.0 62.1 288.0%
(-) Income Taxes (29.0) 11.5 (0.2) -99.1% -102.2% 3.6 (3.5) -196.4%
(-) Depreciation and Amortization 27.3 36.0 40.0 46.6% 11.1% 101.4 143.5 41.5%
(=) EBITDA 115.2 133.0 137.1 19.0% 3.1% 483.4 441.7 -8.6%
14
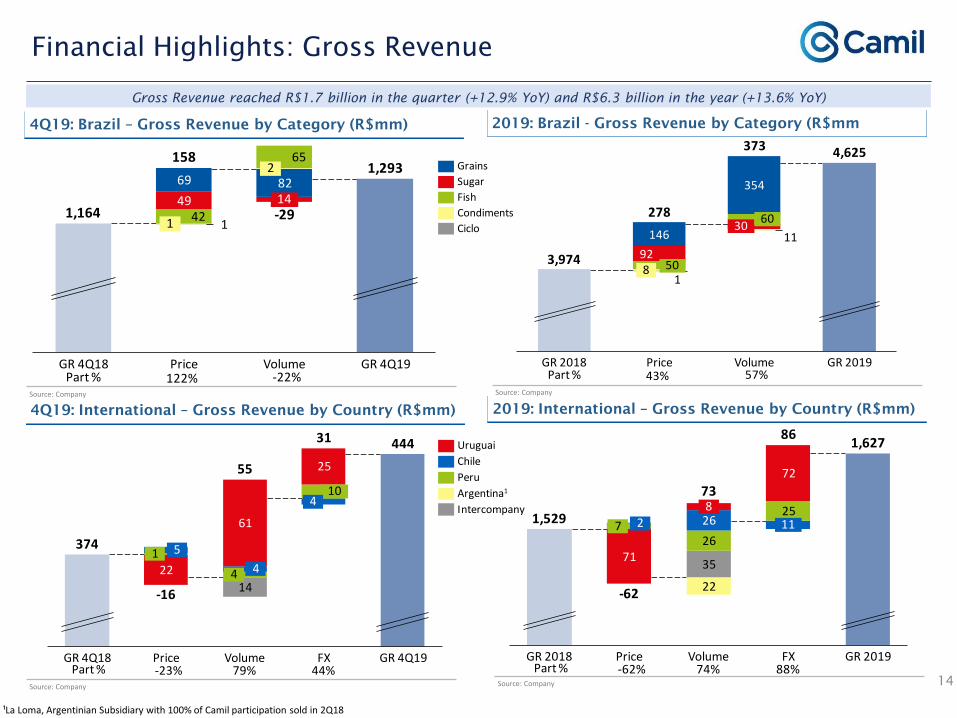
Financial Highlights: Gross Revenue
2019: Brazil - Gross Revenue by Category (R$mm
2019: International – Gross Revenue by Country (R$mm)
4Q19: Brazil – Gross Revenue by Category (R$mm)
4Q19: International – Gross Revenue by Country (R$mm)
Gross Revenue reached R$1.7 billion in the quarter (+12.9% YoY) and R$6.3 billion in the year (+13.6% YoY)
Source: Company
Source: Company
Source: Company
Source: Company
Uruguai
Chile
Argentina1
Peru
Intercompany
¹La Loma, Argentinian Subsidiary with 100% of Camil participation sold in 2Q18
1
82
4249
65
69
GR 4Q18 Price Volume
1
GR 4Q19
1,164
158
-29
1,2932
14
Part % 122% -22%
1
11
92
354
146
50
278
GR 2019GR 2018 Price
373
30
Volume
3,974
4,625
8
60
Part % 43% 57%
Grains
Fish
Sugar
Condiments
Ciclo
22
14
61
25
5
Price FXGR 4Q18 Volume GR 4Q19
10
374
4
-16
444
55
31
14
4
Part % -23% 79% 44%
71
22
35
25
26
72
26
GR 2018
27
Price
11
Volume FX GR 2019
1,529
-62
73
861,627
8
Part % -62% 74% 88%

15
Financial Highlights: COGS and Gross Profit
Net Revenue Quarterly Evolution vs. Costs (R$mm) Net Revenue Annual Evolution vs. Costs (R$mm)
COGS – Highlights
COGS 4Q19: R$1.2 billion (+14.3% YoY)
• Brazil: +11.8% YoY
- Increase in average Market prices
• International: +22.2% YoY
- Volumes increase in Uruguay, Chile and Peru
- Foreign Exchange effect
COGS 2019: R$4.2 billion (+17.5% YoY)
• Brazil: +21.2% YoY
- Increase in average Market prices
- SLC Alimentos Acquisition (as of 4Q18)
• International: +8.4% YoY
- Volumes and prices increase in Uruguay and Peru
- Foreign Exchange effect
Gross Profit reached R$337.7 million (+4.7% YoY) with 22.6% (-1.6pp YoY) in 4Q19 and
R$1.3 billion (+2.4% YoY) with 23.2% margin (-2.5pp YoY) in 2019
Gross Margin Evolution by Segment (%)
Source: Company
Source: Company
Source: Company
24%
24%
24%25%
26%28%
23%22%
24%
24%
25%26%
26%28%
25%24%
23%23%24%23%
R$600
R$700
R$800
R$900
R$1,000
R$1,100
R$1,200
R$1,300
R$1,400
R$1,500
1Q15 2Q15 3Q15 4Q15 1Q16 2Q16 3Q16 4Q16 1Q17 2Q17 3Q17 4Q17 1Q18 2Q18 3Q18 4Q18 1Q19 2Q19 3Q19 4Q19
Net Revenues COGS Gross Margin
25%23%
24% 25% 25%26%
23%
R$0
R$1,000
R$2,000
R$3,000
R$4,000
R$5,000
R$6,000
12M13 12M14 12M15 12M16 12M17 12M18 12M19
Net Revenues COGS Gross Margin
23.6%
24.8%
24.2%24.0%
24.7%
22.0%22.0%
23.7%
25.9%26.4%
28.3%
26.4%
23.2%
24.5%24.7% 24.7%
25.7%
23.2%
20%
22%
24%
26%
28%
30%
12M14 12M15 12M16 12M17 12M18 12M19
Gross Margin Brazil Gross Margin International Gross Margin
16
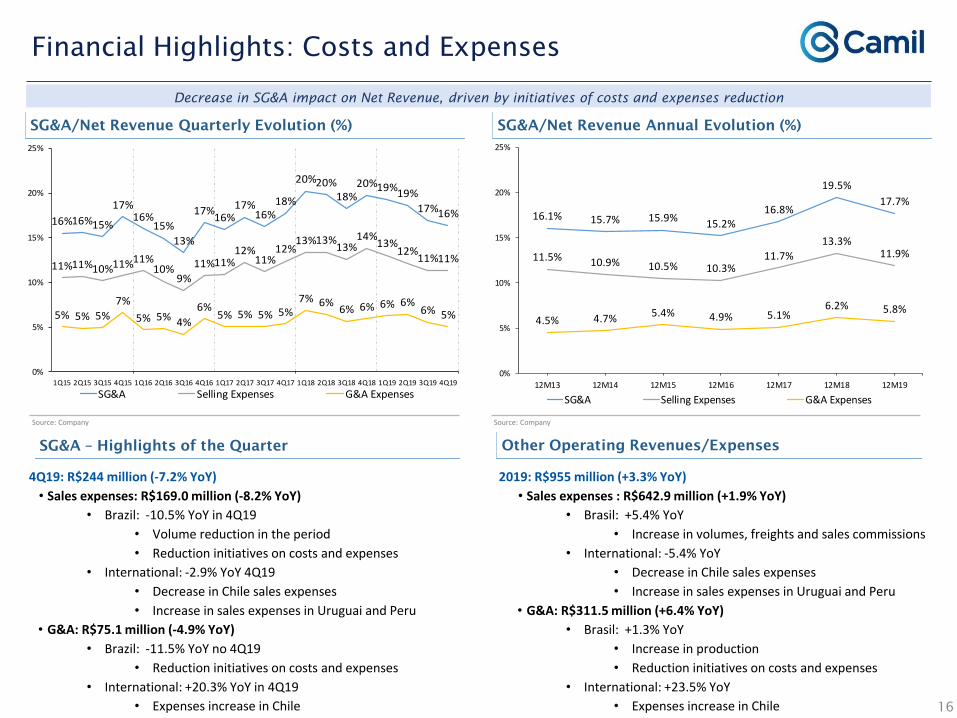
Financial Highlights: Costs and Expenses
SG&A/Net Revenue Quarterly Evolution (%) SG&A/Net Revenue Annual Evolution (%)
SG&A – Highlights of the Quarter
4Q19: R$244 million (-7.2% YoY)
• Sales expenses: R$169.0 million (-8.2% YoY)
• Brazil: -10.5% YoY in 4Q19
• Volume reduction in the period
• Reduction initiatives on costs and expenses
• International: -2.9% YoY 4Q19
• Decrease in Chile sales expenses
• Increase in sales expenses in Uruguai and Peru
• G&A: R$75.1 million (-4.9% YoY)
• Brazil: -11.5% YoY no 4Q19
• Reduction initiatives on costs and expenses
• International: +20.3% YoY in 4Q19
• Expenses increase in Chile
Decrease in SG&A impact on Net Revenue, driven by initiatives of costs and expenses reduction
Source: Company Source: Company
Other Operating Revenues/Expenses
2019: R$955 million (+3.3% YoY)
• Sales expenses : R$642.9 million (+1.9% YoY)
• Brasil: +5.4% YoY
• Increase in volumes, freights and sales commissions
• International: -5.4% YoY
• Decrease in Chile sales expenses
• Increase in sales expenses in Uruguai and Peru
• G&A: R$311.5 million (+6.4% YoY)
• Brasil: +1.3% YoY
• Increase in production
• Reduction initiatives on costs and expenses
• International: +23.5% YoY
• Expenses increase in Chile
16%16%15%
17%16%
15%
13%
17%16%
17%16%
18%
20%20%18%
20%19%19%
17%16%
11%11%10%11%11%10%
9%
11%11%12%
11%12%
13%13%13%
14%13%
12%11%11%
5% 5% 5%
7%
5% 5% 4%
6%5% 5% 5% 5%
7% 6%6% 6% 6% 6%
6% 5%
0%
5%
10%
15%
20%
25%
1Q15 2Q15 3Q15 4Q15 1Q16 2Q16 3Q16 4Q16 1Q17 2Q17 3Q17 4Q17 1Q18 2Q18 3Q18 4Q18 1Q19 2Q19 3Q19 4Q19
SG&A Selling Expenses G&A Expenses
16.1% 15.7% 15.9%15.2%
16.8%
19.5%
17.7%
11.5% 10.9% 10.5% 10.3%11.7%
13.3%11.9%
4.5% 4.7% 5.4% 4.9% 5.1%6.2% 5.8%
0%
5%
10%
15%
20%
25%
12M13 12M14 12M15 12M16 12M17 12M18 12M19
SG&A Selling Expenses G&A Expenses

Profitability Evolution: Net Profit, EBITDA and Margins
We are focused in efficiency and sales increase recovery so that we can increase our profitability
Quarterly Profitability Evolution (R$mn)
Quarterly Profitability Evolution - Margins (%)
17
Source: Company
Source: Company
25.6%24.2%
22.2%
20.6%
24.3% 24.2% 24.4% 25.0%25.9%
27.7%
23.0%22.2%
24.3% 24.3% 24.7%25.5%
26.2%27.6%
25.3%24.2%
23.2% 23.2% 23.7%22.6%
11.2%10.2% 9.6%
8.2%
10.7% 10.3%9.5% 9.6%
11.1%
13.9%
11.4%
7.8%
10.4% 9.8%11.1% 10.7%
8.2%
11.7% 12.0%
8.6%
6.7% 7.3%
9.2% 9.2%
4.3%3.7%
2.3%1.1%
3.5% 3.2%2.4%
1.6%
4.5% 5.0% 5.3%
1.6%
5.0%
3.5%
6.2%6.9%
3.2%
6.9%11.9% 7.5%
4.0%3.3%
4.6%5.6%
0%
5%
10%
15%
20%
25%
30%
1Q14 2Q14 3Q14 4Q14 1Q15 2Q15 3Q15 4Q15 1Q16 2Q16 3Q16 4Q16 1Q17 2Q17 3Q17 4Q17 1Q18 2Q18 3Q18 4Q18 1Q19 2Q19 3Q19 4Q19
Gross Margin EBITDA Margin Net Margin
11.2%10.2% 9.6%
8.2%
10.7% 10.3%9.5% 9.6%
11.1%
13.9%
11.4%
7.8%
10.4% 9.8%11.1% 10.7%
8.2%
11.7% 12.0%
8.6%
6.7% 7.3%
9.2% 9.2%
4.3%3.7%
2.3%1.1%
3.5% 3.2%2.4%
1.6%
4.5% 5.0% 5.3%
1.6%
5.0%
3.5%
6.2%6.9%
3.2%
6.9%
11.9%
7.5%
4.0%3.3%
4.6%5.6%
R$0
R$20
R$40
R$60
R$80
R$100
R$120
R$140
R$160
R$180
R$200
1Q14 2Q14 3Q14 4Q14 1Q15 2Q15 3Q15 4Q15 1Q16 2Q16 3Q16 4Q16 1Q17 2Q17 3Q17 4Q17 1Q18 2Q18 3Q18 4Q18 1Q19 2Q19 3Q19 4Q19
EBITDA Net Income EBITDA Margin Net Margin

Debt R$1.6 billion(+12.2% YoY and -21.9% QoQ):
• Share Buyback: 3rd Programconcluded in november 2019,acquiring 30.6 million shares held byWarburg Pincus;
• CRA IV Emission: R$600mn emissionwith costs near to 100% DI Rate
• Net Debt/EBITDA: 2.3x (<3.5x company´s debt covenants)
18
Other Financial Highlights
Liability Management: lengthening of the amortization profile exchanging financing for ones with smaller costs
through means of CRA emissions in the previous years
Indebtedness (R$mm)
Capex (R$mn) Working Capital Evolution
Source: Company Source: Company
Reduction due to SLC Alimentos Aqcuisition
in the comparative basis of 2018
Quarterly seasonality of the Working Capital due to supplier
advances and inventories
Debt (in R$mn) 4Q18 3Q19 4Q19 4Q19 vs 4Q19 vs
Closing Date 28-Feb-19 30-nov-19 29-Feb-20 4Q18 3Q19
Total Debt 1,428.8 2,052.0 1,602.9 12.2% -21.9%
Loans and financing 448.7 473.6 239.4 -46.6% -49.5%Debentures 980.1 1,578.4 1,363.5 39.1% -13.6%Short Term 514.1 827.7 560.6 9.1% -32.3%Long Term 914.7 1,224.3 1,042.3 13.9% -14.9%
Currency breakdownR$ 1,031.2 1,695.1 1,487.1 44.2% -12.3%USD 281.3 259.9 0.3 -99.9% -99.9%CLP 7.2 1.4 0.3 -95.3% -76.2%PEN 109.1 95.6 115.1 5.5% 20.4%
LeverageGross Debt 1,428.8 2,052.0 1,602.9 12.2% -21.9%
Cash and Cash Equivalents + financial
applications396.7 486.5 570.1 43.7% 17.2%
Net Debt 1,032.1 1,565.5 1,032.8 0.1% -34.0%Net Debt/EBITDA LTM 2.1x 3.7x 2.3x 0.2x -1.4x
R$0
R$250
R$500
R$750
R$1,000
R$1,250
R$1,500
R$1,750
R$2,000
R$2,250
1Q15 2Q15 3Q15 4Q15 1Q16 2Q16 3Q16 4Q16 1Q17 2Q17 3Q17 4Q17 1Q18 2Q18 3Q18 4Q18 1Q19 2Q19 3Q19 4Q19
Accounts Receivable Inventories Adv. to Suppliers Suppliers Total Working Capital
230 213 207
86 100
397
136
6.4%5.8%
4.9%
1.7%2.1%
8.4%
2.5%
R$0
R$50
R$100
R$150
R$200
R$250
R$300
R$350
R$400
R$450
12M13 12M14 12M15 12M16 12M17 12M18 12M19Capex Capex (% of Sales)
19
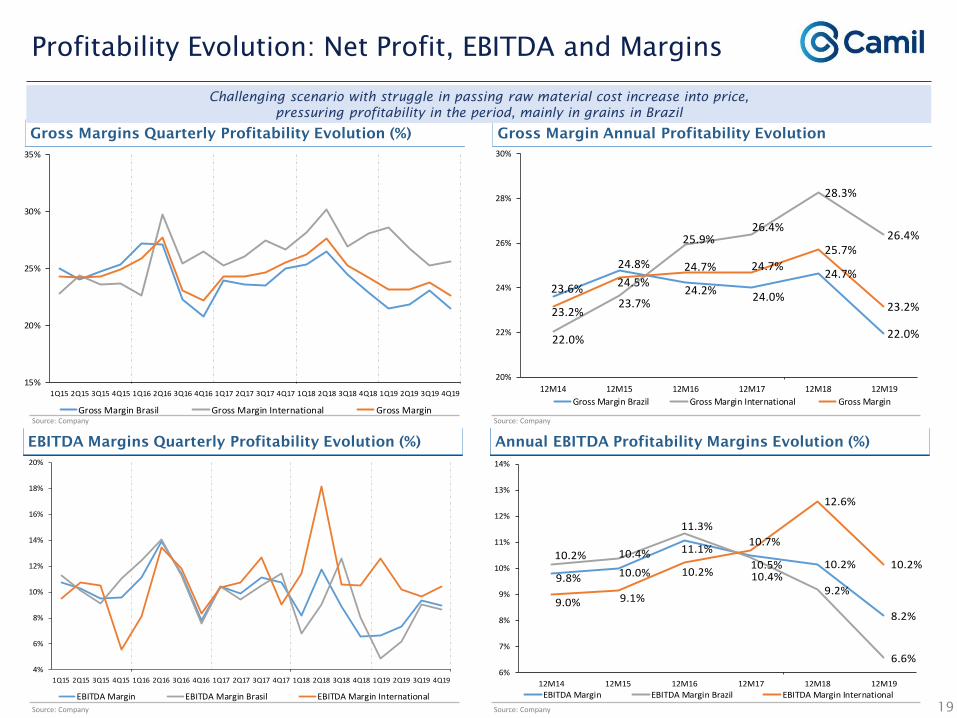
Profitability Evolution: Net Profit, EBITDA and Margins
Gross Margins Quarterly Profitability Evolution (%) Gross Margin Annual Profitability Evolution
EBITDA Margins Quarterly Profitability Evolution (%) Annual EBITDA Profitability Margins Evolution (%)
Challenging scenario with struggle in passing raw material cost increase into price,
pressuring profitability in the period, mainly in grains in Brazil
Source: Company Source: Company
Source: Company Source: Company
4%
6%
8%
10%
12%
14%
16%
18%
20%
1Q15 2Q15 3Q15 4Q15 1Q16 2Q16 3Q16 4Q16 1Q17 2Q17 3Q17 4Q17 1Q18 2Q18 3Q18 4Q18 1Q19 2Q19 3Q19 4Q19
EBITDA Margin EBITDA Margin Brasil EBITDA Margin International
15%
20%
25%
30%
35%
1Q15 2Q15 3Q15 4Q15 1Q16 2Q16 3Q16 4Q16 1Q17 2Q17 3Q17 4Q17 1Q18 2Q18 3Q18 4Q18 1Q19 2Q19 3Q19 4Q19
Gross Margin Brasil Gross Margin International Gross Margin
9.8% 10.0%
11.1%
10.5% 10.2%
8.2%
10.2% 10.4%
11.3%
10.4% 9.2%
6.6%
9.0% 9.1%
10.2%
10.7%
12.6%
10.2%
6%
7%
8%
9%
10%
11%
12%
13%
14%
12M14 12M15 12M16 12M17 12M18 12M19
EBITDA Margin EBITDA Margin Brazil EBITDA Margin International
23.6%
24.8%
24.2%24.0%
24.7%
22.0%22.0%
23.7%
25.9%26.4%
28.3%
26.4%
23.2%
24.5%24.7% 24.7%
25.7%
23.2%
20%
22%
24%
26%
28%
30%
12M14 12M15 12M16 12M17 12M18 12M19
Gross Margin Brazil Gross Margin International Gross Margin

Luciano Quartiero
Chief Executive Officer
Flavio Vargas
Chief Financial and Investor Relations
Officer
Investor Relations
Phones:
+55 11 3039-9238
+55 11 3039-9237
E-mail: [email protected]