5-1 collect & interpret data use spc to maintain current process collect & interpret data...
Post on 22-Dec-2015
218 views
TRANSCRIPT
5-1
Collect & Interpret DataCollect & Interpret Data
Use SPC to Maintain Current Process
Collect & Interpret
Data
Collect & Interpret
Data
Select Measures
Define Process
IsProcessCapable
?
Improve Process
Capability
IsProcessStable
?
Investigate & Fix
Special Causes
No
Yes
No
Yes
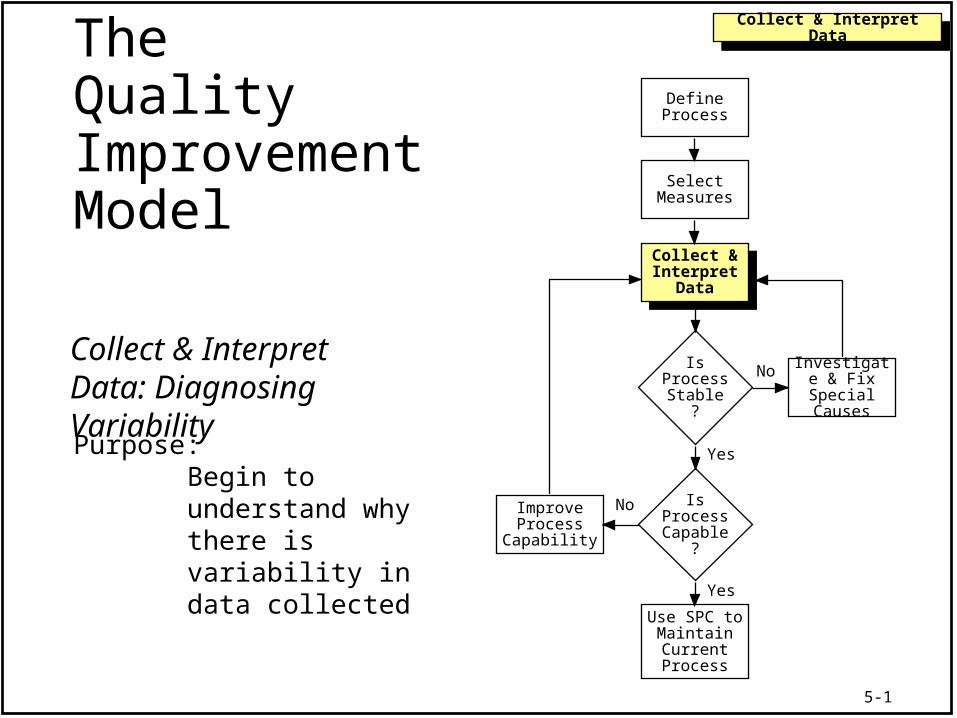
Collect & Interpret Data: Diagnosing VariabilityPurpose:
Begin to understand why there is variability in data collected
TheQualityImprovementModel
5-2
Collect & Interpret DataCollect & Interpret Data
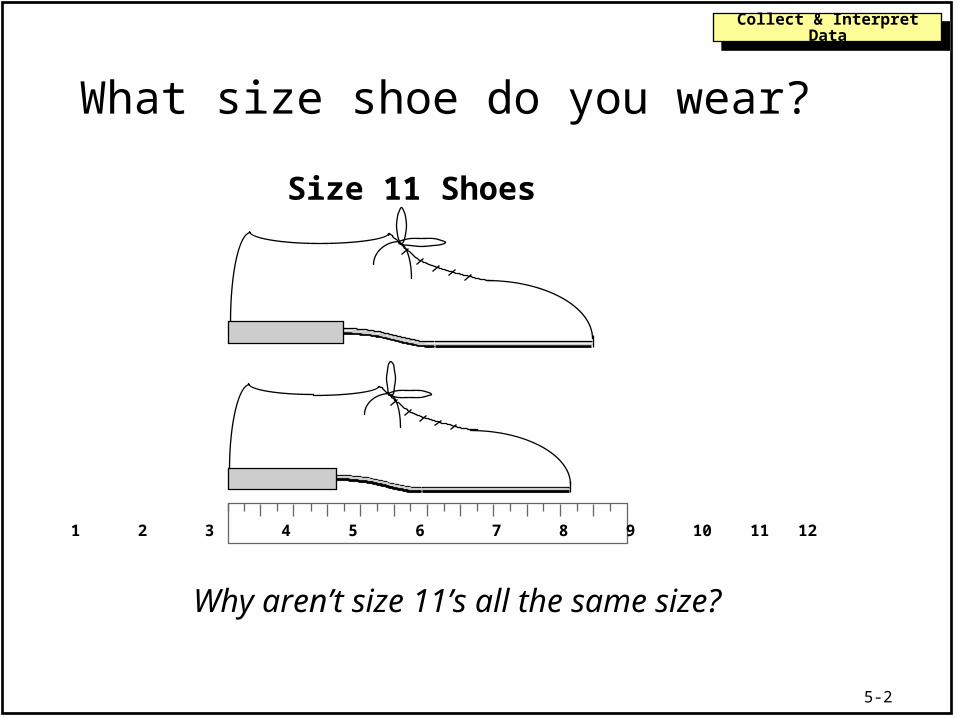
What size shoe do you wear?
1 2 3 4 5 6 7 8 9 10 11 12
Size 11 Shoes
Why aren’t size 11’s all the same size?
5-3
Collect & Interpret DataCollect & Interpret Data
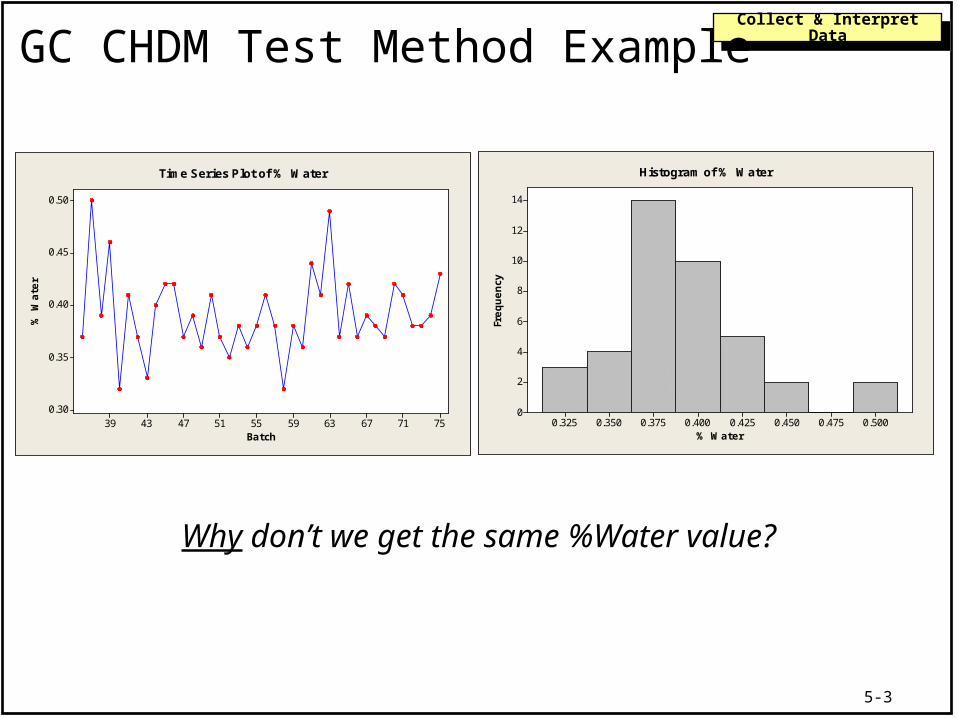
GC CHDM Test Method Example
Why don’t we get the same %Water value?
Batch
% W
ate
r
75716763595551474339
0.50
0.45
0.40
0.35
0.30
Time Series Plot of % Water
% Water
Frequency
0.5000.4750.4500.4250.4000.3750.3500.325
14
12
10
8
6
4
2
0
Histogram of % Water
5-4
Collect & Interpret DataCollect & Interpret Data
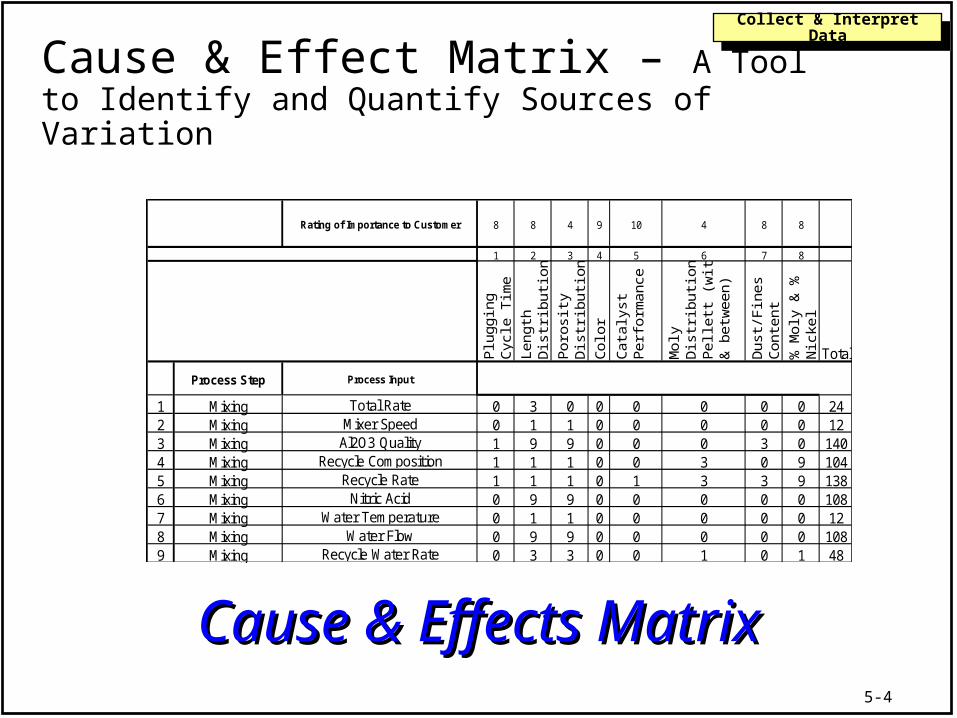
Cause & Effects MatrixCause & Effects Matrix
Rating of Importance to Customer 8 8 4 9 10 4 8 8
1 2 3 4 5 6 7 8
Plu
ggin
g C
ycle
Tim
eLe
ngth
D
istr
ibut
ion
Por
osity
D
istr
ibut
ion
Col
or
Cat
alys
t P
erfo
rman
ce
Mol
y D
istr
ibut
ion
in
Pel
lett
(w
ithin
&
bet
wee
n)
Dus
t/F
ines
C
onte
nt%
Mol
y &
%
Nic
kel
Total
Process Step Process Input
1 Mixing Total Rate 0 3 0 0 0 0 0 0 242 Mixing Mixer Speed 0 1 1 0 0 0 0 0 123 Mixing Al2O3 Quality 1 9 9 0 0 0 3 0 1404 Mixing Recycle Composition 1 1 1 0 0 3 0 9 1045 Mixing Recycle Rate 1 1 1 0 1 3 3 9 1386 Mixing Nitric Acid 0 9 9 0 0 0 0 0 1087 Mixing Water Temperature 0 1 1 0 0 0 0 0 128 Mixing Water Flow 0 9 9 0 0 0 0 0 1089 Mixing Recycle Water Rate 0 3 3 0 0 1 0 1 48
Cause & Effect Matrix – A Tool to Identify and Quantify Sources of Variation

5-5
Collect & Interpret DataCollect & Interpret Data
Relates the key inputs to the key outputs (customer requirements) using the process map as the primary information source
Key outputs are scored as to importance to the customer
Key inputs are scored as to relationship to key outputs
Pareto of key inputs to evaluate in the FMEA and control plans
Input into the initial evaluation of the Process Control Plan
Cause and Effects Matrix

5-6
Collect & Interpret DataCollect & Interpret Data
Identify key customer requirements (outputs) from process map or other sources
Rank order and assign priority factor to each Output (usually on a 1 to 10 scale)
Identify all process steps and materials (inputs) from the Process Map
Evaluate correlation of each input to each output low scorelow score: changes in the input variable (amount,
quality, etc.) have small effect on output variable high scorehigh score: changes in the input variable can greatly
affect the output variable Cross multiply correlation values with priority
factors and sum for each input
Cause & Effect Matrix Steps

5-7
Collect & Interpret DataCollect & Interpret Data
Examples
Bottle Production Big Block Diagram
Bottle ProductionUpstream Inputs Outputs Downstream
Resin IV Regrind % Break % at Molder Break % at FillerOther resin Properties Barrell Temperature Bottle Output Etc…Bottle Design Screw Speed Melt TemperatureEtc… Screw Design Clarity
Etc… WeightWall Thickness VariationEtc…
Note: Only a partial list
5-8
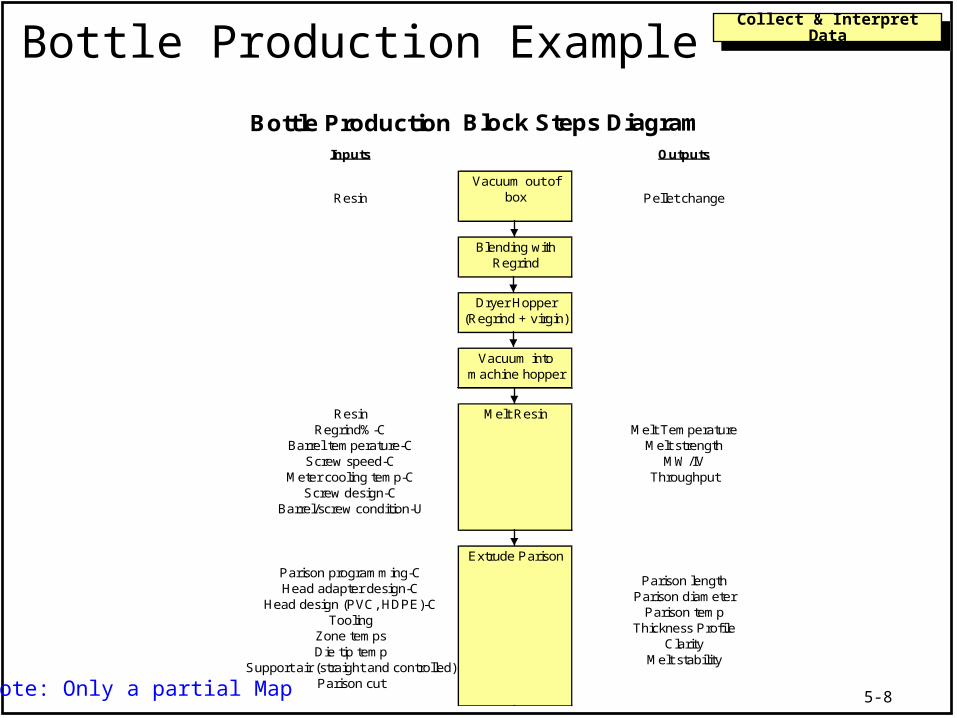
Collect & Interpret DataCollect & Interpret DataBottle Production Example
Bottle Production Block Steps DiagramInputs Outputs
ResinVacuum out of
box Pellet change
Blending with Regrind
Dryer Hopper(Regrind + virgin)
Vacuum into machine hopper
ResinRegrind%-C
Barrel temperature-CScrew speed-C
Meter cooling temp-CScrew design-C
Barrel/screw condition-U
Melt ResinMelt Temperature
Melt strengthMW/IV
Throughput
Parison programming-CHead adapter design-C
Head design (PVC, HDPE)-CTooling
Zone tempsDie tip temp
Support air (straight and controlled)Parison cut
Extrude Parison
Parison lengthParison diameter
Parison tempThickness Profile
ClarityMelt stability
Note: Only a partial Map

5-9
Collect & Interpret DataCollect & Interpret Data
Rating of Importance to
Customer
1 2 3 4 5 6 7 8 9 10 11 12 13 14 15
Req
uire
men
t
Req
uire
men
t
Req
uire
men
t
Req
uire
men
t
Req
uire
men
t
Req
uire
men
t
Req
uire
men
t
Req
uire
men
t
Req
uire
men
t
Req
uire
men
t
Req
uire
men
t
Req
uire
men
t
Req
uire
men
t
Req
uire
men
t
Req
uire
men
t
Total
Process Step Process Input
1 02 03 04 05 06 07 08 0
Excel Template C&E Matrix.XLSExcel Template C&E Matrix.XLS
1. List Key Outputs
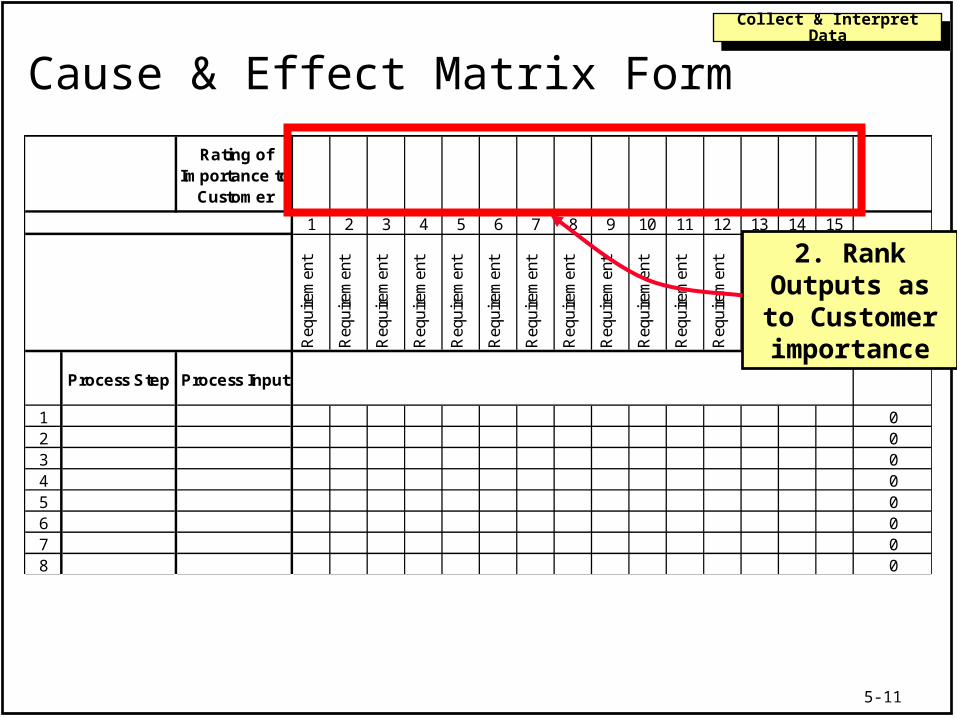
Cause & Effect Matrix Form
5-10
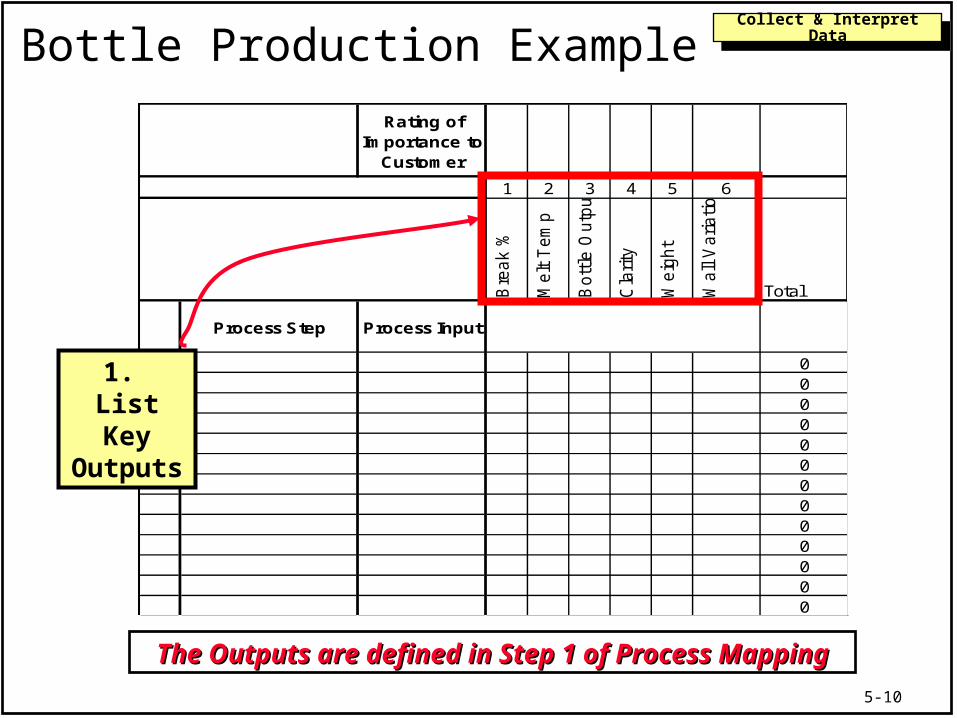
Collect & Interpret DataCollect & Interpret Data
Rating of Importance to
Customer
1 2 3 4 5 6
Bre
ak %
Melt T
em
p
Bott
le O
utp
ut
Cla
rity
Weig
ht
Wall
Variation
Total
Process Step Process Input
0000000000000
1. List Key
Outputs
The Outputs are defined in Step 1 of Process MappingThe Outputs are defined in Step 1 of Process Mapping
Bottle Production Example
5-11
Collect & Interpret DataCollect & Interpret Data
Rating of Importance to
Customer
1 2 3 4 5 6 7 8 9 10 11 12 13 14 15
Req
uire
men
t
Req
uire
men
t
Req
uire
men
t
Req
uire
men
t
Req
uire
men
t
Req
uire
men
t
Req
uire
men
t
Req
uire
men
t
Req
uire
men
t
Req
uire
men
t
Req
uire
men
t
Req
uire
men
t
Req
uire
men
t
Req
uire
men
t
Req
uire
men
t
Total
Process Step Process Input
1 02 03 04 05 06 07 08 0
2. Rank Outputs as to
Customer importance
Cause & Effect Matrix Form
5-12
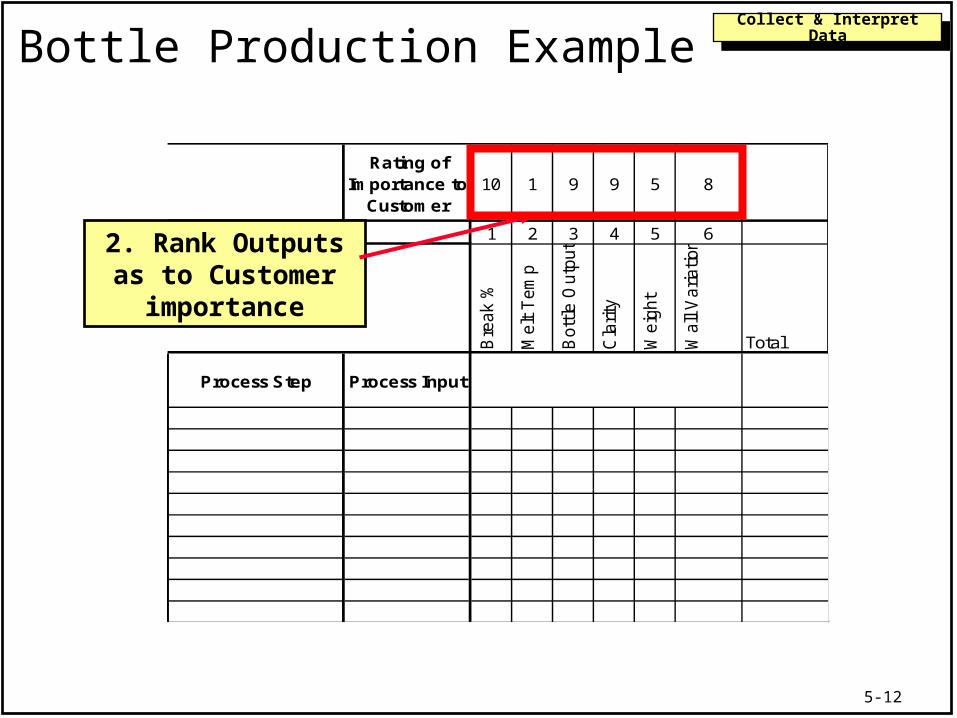
Collect & Interpret DataCollect & Interpret Data
Rating of Importance to
Customer10 1 9 9 5 8
1 2 3 4 5 6
Bre
ak %
Melt T
em
p
Bott
le O
utp
ut
Cla
rity
Weig
ht
Wall
Variation
Total
Process Step Process Input
2. Rank Outputs as to Customer importance
Bottle Production Example
5-13
Collect & Interpret DataCollect & Interpret Data
Rating of Importance to
Customer
1 2 3 4 5 6 7 8 9 10 11 12 13 14 15
Req
uire
men
t
Req
uire
men
t
Req
uire
men
t
Req
uire
men
t
Req
uire
men
t
Req
uire
men
t
Req
uire
men
t
Req
uire
men
t
Req
uire
men
t
Req
uire
men
t
Req
uire
men
t
Req
uire
men
t
Req
uire
men
t
Req
uire
men
t
Req
uire
men
t
Total
Process Step Process Input
1 02 03 04 05 06 07 08 0
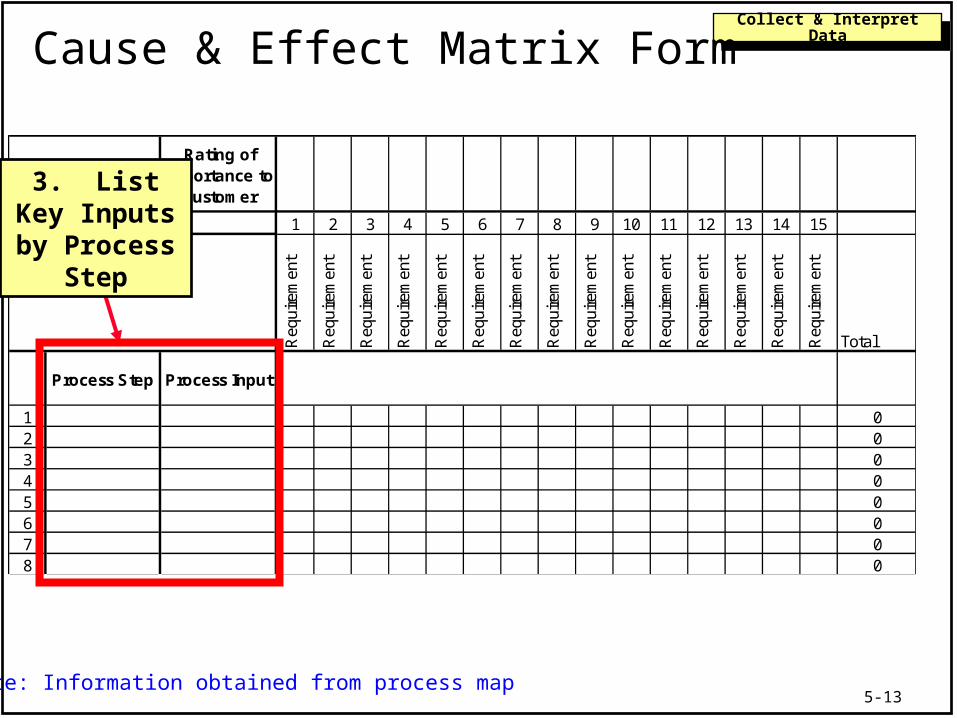
3. List Key Inputs by
Process Step
Cause & Effect Matrix Form
Note: Information obtained from process map
5-14
Collect & Interpret DataCollect & Interpret Data
Rating of Importance to
Customer10 1 9 9 5 8
1 2 3 4 5 6
Bre
ak %
Mel
t T
emp
Bot
tle O
utpu
t
Cla
rity
Wei
ght
Wal
l Var
iatio
n
Process Step Process Input
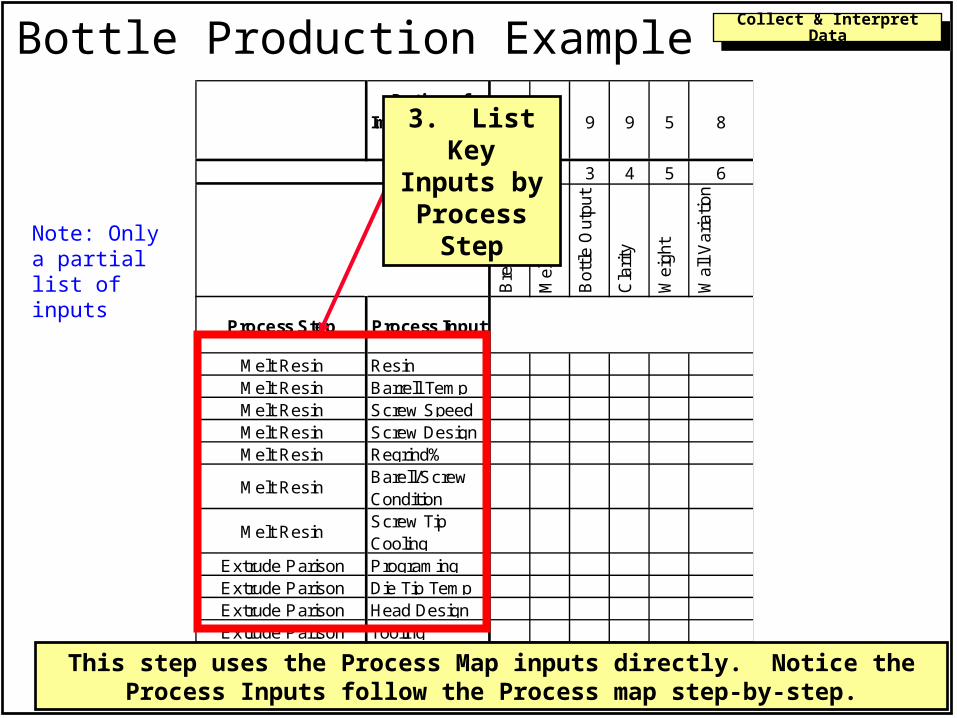
Melt Resin ResinMelt Resin Barrell TempMelt Resin Screw SpeedMelt Resin Screw DesignMelt Resin Regrind%
Melt ResinBarell/Screw Condition
Melt ResinScrew Tip Cooling
Extrude Parison ProgramingExtrude Parison Die Tip TempExtrude Parison Head DesignExtrude Parison Tooling Extrude Parison Support AirThis step uses the Process Map inputs directly. Notice the Process Inputs
follow the Process map step-by-step.
3. List Key Inputs by Process
Step
Bottle Production Example
Note: Only a partial list of inputs
5-15
Collect & Interpret DataCollect & Interpret Data
Rating of Importance to
Customer
1 2 3 4 5 6 7 8 9 10 11 12 13 14 15
Req
uire
men
t
Req
uire
men
t
Req
uire
men
t
Req
uire
men
t
Req
uire
men
t
Req
uire
men
t
Req
uire
men
t
Req
uire
men
t
Req
uire
men
t
Req
uire
men
t
Req
uire
men
t
Req
uire
men
t
Req
uire
men
t
Req
uire
men
t
Req
uire
men
t
Total
Process Step Process Input
1 02 03 04 05 06 07 08 0
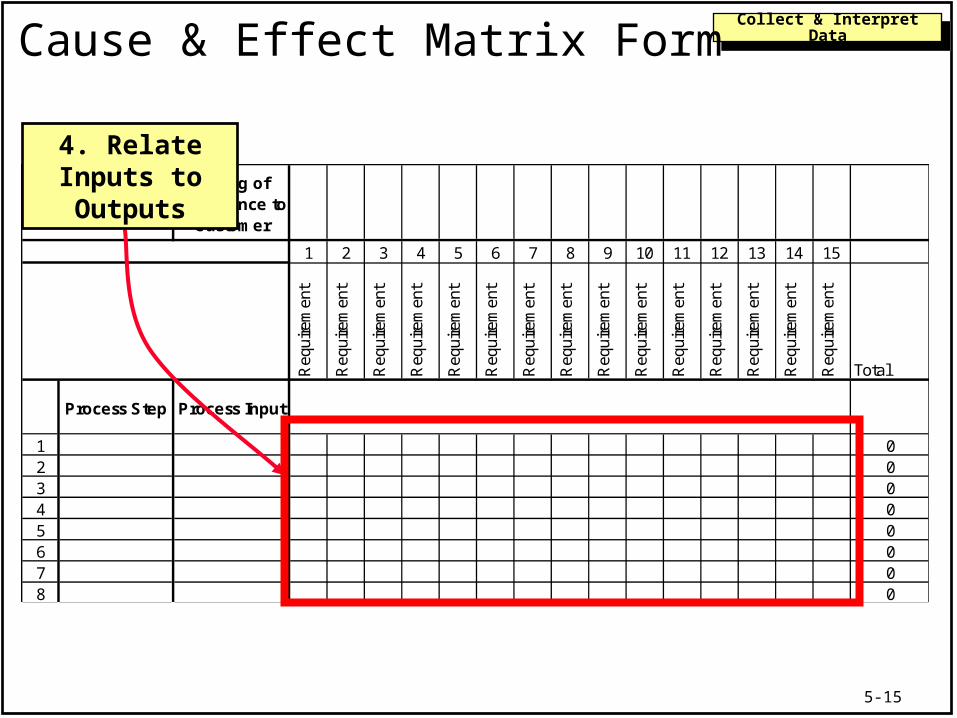
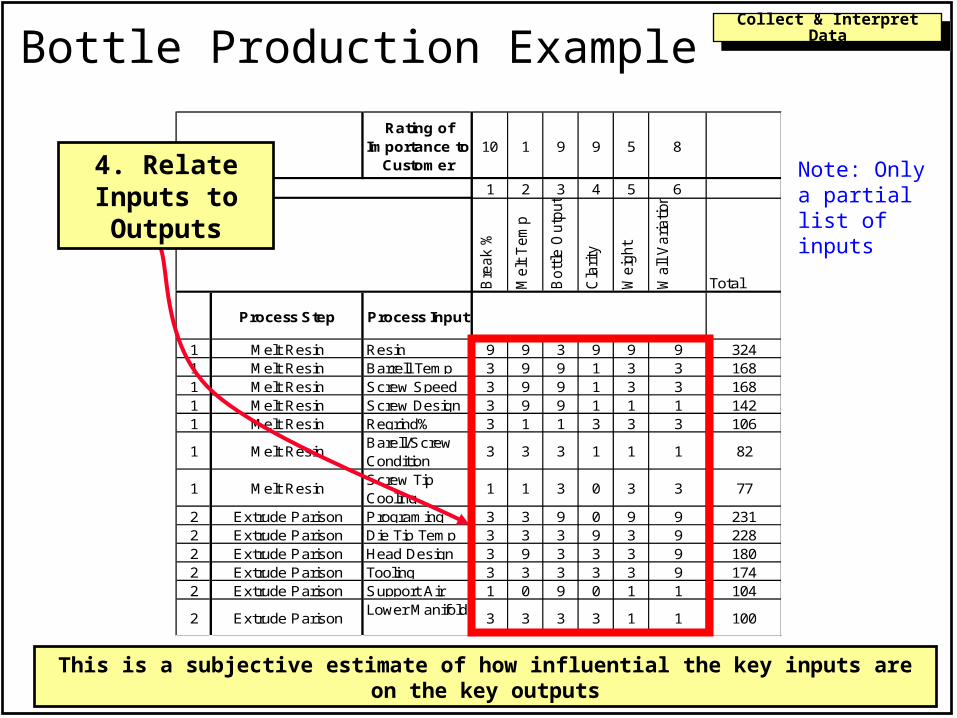
4. Relate Inputs to Outputs
Cause & Effect Matrix Form
5-16
Collect & Interpret DataCollect & Interpret Data
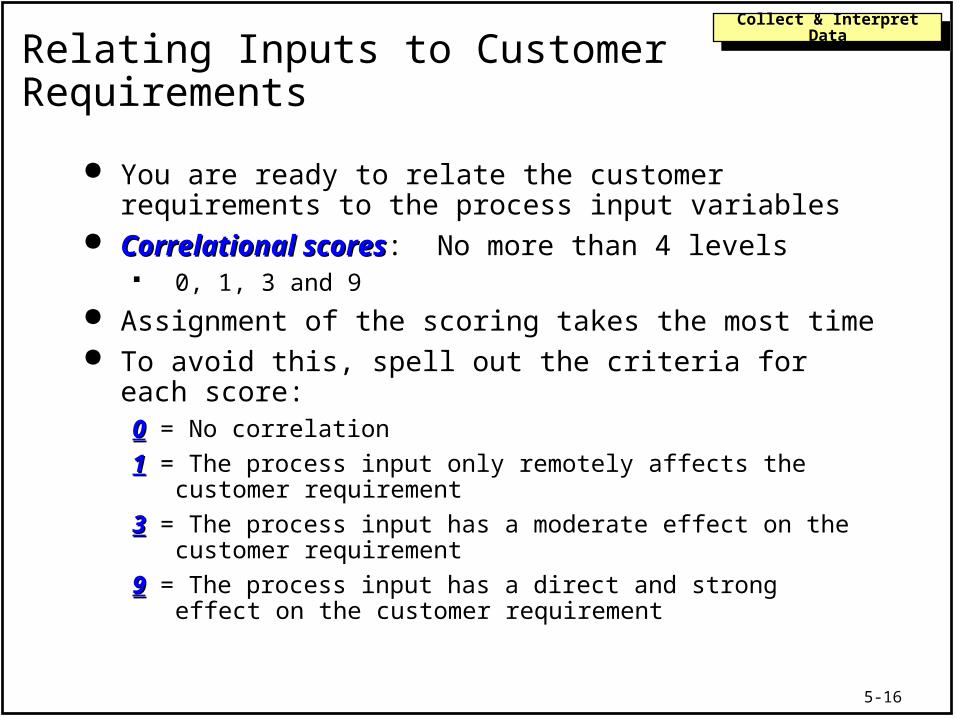
You are ready to relate the customer requirements to the process input variables
Correlational scoresCorrelational scores: No more than 4 levels 0, 1, 3 and 9
Assignment of the scoring takes the most time To avoid this, spell out the criteria for each score:
00 = No correlation
11 = The process input only remotely affects the customer requirement
33 = The process input has a moderate effect on the customer requirement
99 = The process input has a direct and strong effect on the customer requirement
Relating Inputs to Customer Requirements
5-17
Collect & Interpret DataCollect & Interpret Data
Rating of Importance to
Customer10 1 9 9 5 8
1 2 3 4 5 6
Bre
ak %
Melt T
em
p
Bott
le O
utp
ut
Cla
rity
Weig
ht
Wall
Variation
Total
Process Step Process Input
1 Melt Resin Resin 9 9 3 9 9 9 3241 Melt Resin Barrell Temp 3 9 9 1 3 3 1681 Melt Resin Screw Speed 3 9 9 1 3 3 1681 Melt Resin Screw Design 3 9 9 1 1 1 1421 Melt Resin Regrind% 3 1 1 3 3 3 106
1 Melt ResinBarell/Screw Condition
3 3 3 1 1 1 82
1 Melt ResinScrew Tip Cooling
1 1 3 0 3 3 77
2 Extrude Parison Programing 3 3 9 0 9 9 2312 Extrude Parison Die Tip Temp 3 3 3 9 3 9 2282 Extrude Parison Head Design 3 9 3 3 3 9 1802 Extrude Parison Tooling 3 3 3 3 3 9 1742 Extrude Parison Support Air 1 0 9 0 1 1 104
2 Extrude ParisonLower Manifold
3 3 3 3 1 1 100
4. Relate Inputs to Outputs
This is a subjective estimate of how influential the key inputs are on the key outputs
Bottle Production Example
Note: Only a partial list of inputs
5-18
Collect & Interpret DataCollect & Interpret Data
Rating of Importance to
Customer
1 2 3 4 5 6 7 8 9 10 11 12 13 14 15
Req
uire
men
t
Req
uire
men
t
Req
uire
men
t
Req
uire
men
t
Req
uire
men
t
Req
uire
men
t
Req
uire
men
t
Req
uire
men
t
Req
uire
men
t
Req
uire
men
t
Req
uire
men
t
Req
uire
men
t
Req
uire
men
t
Req
uire
men
t
Req
uire
men
t
Total
Process Step Process Input
1 02 03 04 05 06 07 08 0
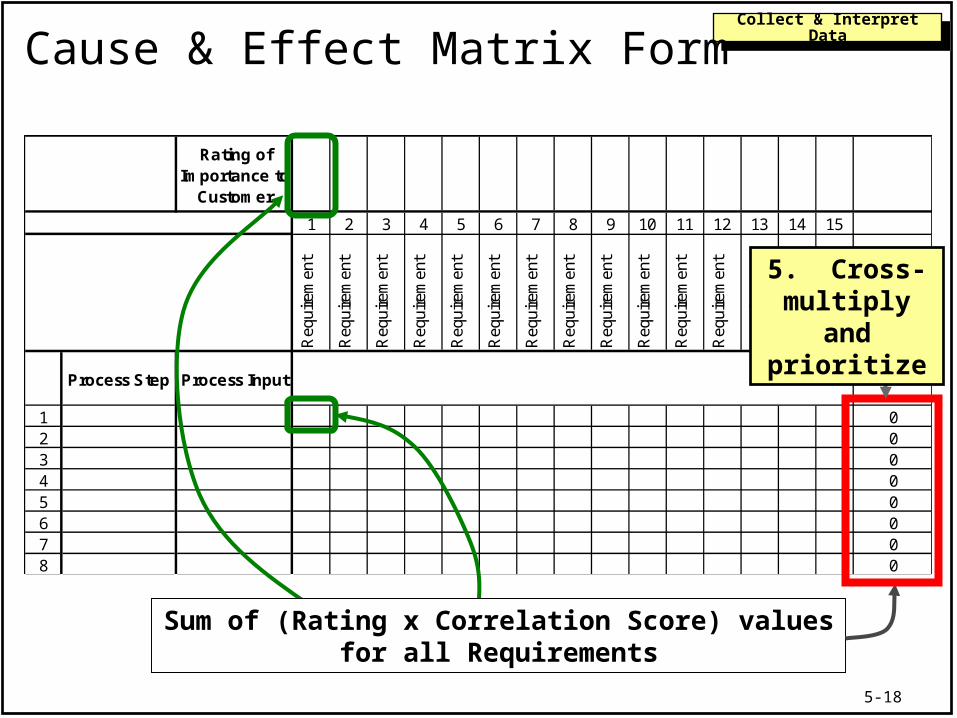
Sum of (Rating x Correlation Score) values for all Requirements
5. Cross-multiply and
prioritize
Cause & Effect Matrix Form
5-19
Collect & Interpret DataCollect & Interpret Data
Rating of Importance to
Customer10 1 9 9 5 8
1 2 3 4 5 6
Bre
ak %
Melt T
em
p
Bott
le O
utp
ut
Cla
rity
Weig
ht
Wall
Variation
Total
Process Step Process Input
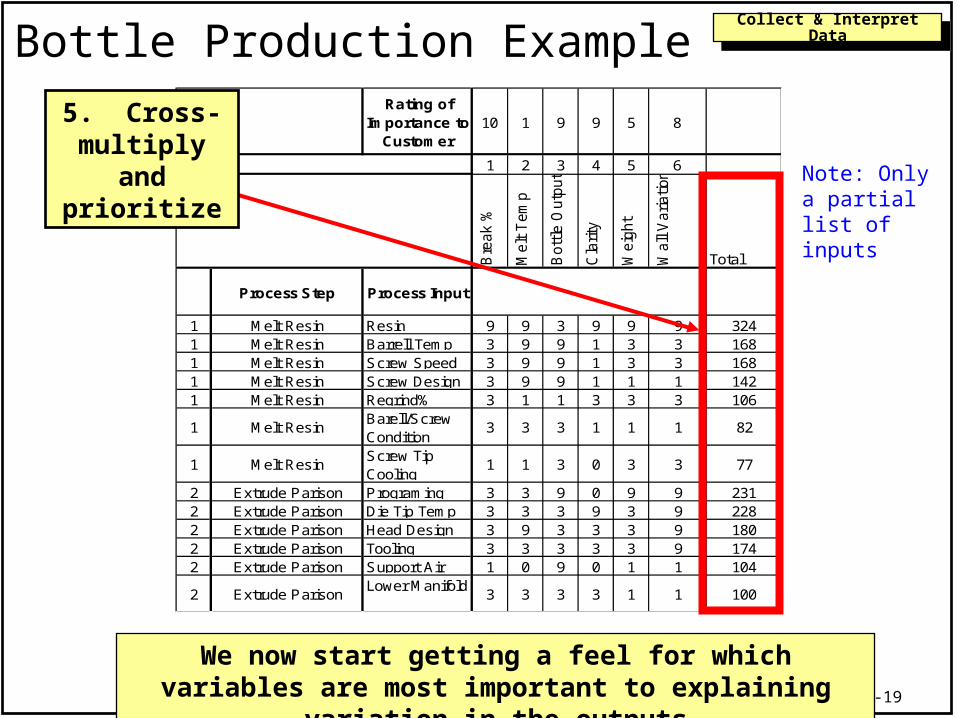
1 Melt Resin Resin 9 9 3 9 9 9 3241 Melt Resin Barrell Temp 3 9 9 1 3 3 1681 Melt Resin Screw Speed 3 9 9 1 3 3 1681 Melt Resin Screw Design 3 9 9 1 1 1 1421 Melt Resin Regrind% 3 1 1 3 3 3 106
1 Melt ResinBarell/Screw Condition
3 3 3 1 1 1 82
1 Melt ResinScrew Tip Cooling
1 1 3 0 3 3 77
2 Extrude Parison Programing 3 3 9 0 9 9 2312 Extrude Parison Die Tip Temp 3 3 3 9 3 9 2282 Extrude Parison Head Design 3 9 3 3 3 9 1802 Extrude Parison Tooling 3 3 3 3 3 9 1742 Extrude Parison Support Air 1 0 9 0 1 1 104
2 Extrude ParisonLower Manifold
3 3 3 3 1 1 100
5. Cross-multiply and
prioritize
We now start getting a feel for which variables are most important to explaining variation in the outputs
Bottle Production Example
Note: Only a partial list of inputs
5-20
Collect & Interpret DataCollect & Interpret Data
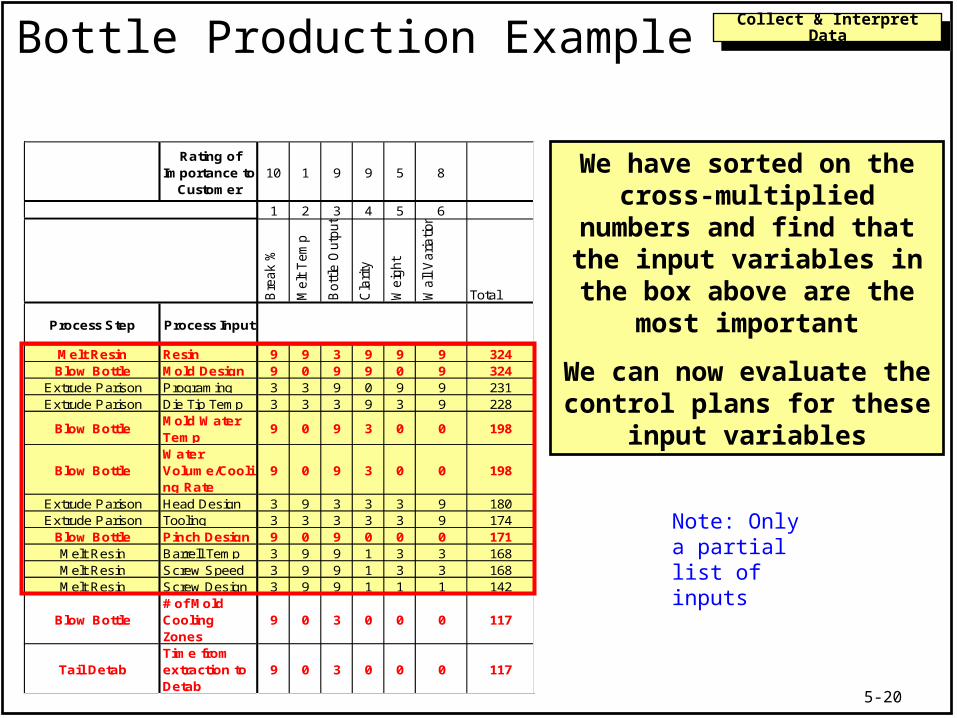
We have sorted on the cross-multiplied numbers and find that the input variables in the
box above are the most important
We can now evaluate the control plans for these input
variables
Rating of Importance to
Customer10 1 9 9 5 8
1 2 3 4 5 6
Bre
ak %
Melt T
em
p
Bott
le O
utp
ut
Cla
rity
Weig
ht
Wall
Variation
Total
Process Step Process Input
Melt Resin Resin 9 9 3 9 9 9 324Blow Bottle Mold Design 9 0 9 9 0 9 324
Extrude Parison Programing 3 3 9 0 9 9 231Extrude Parison Die Tip Temp 3 3 3 9 3 9 228
Blow BottleMold Water Temp
9 0 9 3 0 0 198
Blow BottleWater Volume/Cooling Rate
9 0 9 3 0 0 198
Extrude Parison Head Design 3 9 3 3 3 9 180Extrude Parison Tooling 3 3 3 3 3 9 174
Blow Bottle Pinch Design 9 0 9 0 0 0 171Melt Resin Barrell Temp 3 9 9 1 3 3 168Melt Resin Screw Speed 3 9 9 1 3 3 168Melt Resin Screw Design 3 9 9 1 1 1 142
Blow Bottle# of Mold Cooling Zones
9 0 3 0 0 0 117
Tail DetabTime from extraction to Detab
9 0 3 0 0 0 117
Bottle Production Example
Note: Only a partial list of inputs

5-21
Collect & Interpret DataCollect & Interpret Data
Place the outputs across the top of the matrix and rank Place inputs down the side of the matrix starting
with the first process step and moving to the last This approach is okay for small process with
relatively few steps Should only be used for processes with a
relatively small number of steps and inputs
General Approach

5-22
Collect & Interpret DataCollect & Interpret Data
Phase IPhase I Place the outputs across the top of the matrix and rank Place the process steps down the side of the matrix Correlate process step to outputs Pareto the process steps
Phase IIPhase II Start a new C&E Matrix with the inputs from the top three
or four process steps Recommended when first starting a project
o Focuses the efforts and gives the team a feeling that they’re working on the important process steps first
o Gives you a running start at the FMEA and preliminary Control Plan Analysis
Focused Approach
5-23
Collect & Interpret DataCollect & Interpret Data
Standard Operating ProceduresStandard Operating Procedures Do they exist? Are they understood? Are they being followed? Are they current? Is operator certification performed? Is there a process audit schedule?
Control Plan Evaluation
5-24
Collect & Interpret DataCollect & Interpret Data
Controllable Input VariablesControllable Input Variables: How are they monitored? How often are they verified? Are optimum target values and specifications
known? How much variation is there around the target
value? How consistent are they?
Other QuestionsOther Questions: How often is the input variable out of control? Which input variables should have control charts?
Control Plan Evaluation