52131131 turbulent flow in pipes
TRANSCRIPT

8/7/2019 52131131 Turbulent Flow in Pipes
http://slidepdf.com/reader/full/52131131-turbulent-flow-in-pipes 1/27
CHAPTER 2: TURBULENT FLOW IN PIPES
Characteristics of Turbulent Flow in Pipes
• Re > 4000
• Random movements of eddies which mixes up the layersof fluid
• Particle path is irregular
• Most common type of flow
• Difficult mathematical analysis to describe the flow
Turbulent Shear StressRandom 3-dimensional fluid motions (eddies) produce shearforce for the turbulent flow
3-dimensional eddies conveys mass with average velocity ū.Therefore flow momentum exists. The result of this momentumtransfer is shear force
Shear stress in pipe is given as the summation of laminar shearstress and turbulent shear stress
τ = τlam + τturb

8/7/2019 52131131 Turbulent Flow in Pipes
http://slidepdf.com/reader/full/52131131-turbulent-flow-in-pipes 2/27

8/7/2019 52131131 Turbulent Flow in Pipes
http://slidepdf.com/reader/full/52131131-turbulent-flow-in-pipes 3/27
In viscous sub-layer, velocity profile is written in the form of
( )1yu
u
u...
*
*
ν
=
where ū = average velocity y = distance measured from wall =R – ru* = friction velocity = ( τw /ρ)1/2
υ = kinematic viscosity
This equation is called the Law of Wall which is valid only near
a smooth wall for 5yu
0 <<ν
*
In the overlap region, velocity varies according to the logarithmof y.
( )205
yu
52u
u
....ln.
*
*+
⎟⎟⎠
⎞
⎜⎜⎝
⎛ =
ν
where 2.5 and 5.0 are constants determined by experiments.
For the outer layer, the Power Law is used from the following
expression.
*The power law profile cannotbe valid near the wall becausethe value becomes infinite if we differentiate u with r(du/dr).
( )3R
r 1
V
u n
1
C
...⎟⎠
⎞⎜⎝
⎛ −=
The value of n which indicates the “power” of the equation is a
function of Re and determined experimentally.

8/7/2019 52131131 Turbulent Flow in Pipes
http://slidepdf.com/reader/full/52131131-turbulent-flow-in-pipes 4/27
The relationship between average velocity, volume flowrate andcenterline velocity can be obtained by integrating the power law velocity profile.
( )( )( )
( )( )
( )( )
( )( )( )5
n2
V 1n21nV
1n21n
n2
V
V
1n21n
n
V R2
V
V ππ AV Q
41n21n
nV R2
dr r 2
R
r 1V
dAR
r 1V
dAuQ
2C
2
C
2
C 2
2
2
C
2
n
1
C
R
0
R
0
n
1
C
R
0
...
R
since
...
.
2
++=
++=
++
=
==
++=
⎟
⎠
⎞⎜
⎝
⎛ −=
⎟⎠
⎞⎜⎝
⎛ −=
=
∫
∫
∫
π
π
π
π

8/7/2019 52131131 Turbulent Flow in Pipes
http://slidepdf.com/reader/full/52131131-turbulent-flow-in-pipes 5/27
Example 2.1
Water at 20oC ( ρ = 998 kg/m3 , υ = 1.004 x 10⁻⁶ m2/s) flows
through horizontal pipe of D = 0.1m and Q = 4 x 10⁻²
m3
/s. If the pressure drop over the length of pipe is 2.5 kPa/m,determine:-
(a) the approximate thickness of viscous sub-layer(b) the approximate centerline velocity
(c) the ratio of the turbulent to laminar shear stresslam
turb
τ τ at
a point midway between centerline and the pipe wall (r =0.025)

8/7/2019 52131131 Turbulent Flow in Pipes
http://slidepdf.com/reader/full/52131131-turbulent-flow-in-pipes 6/27
Dimensional Analysis of Pipe Flow
Moody Chart
Pressure drop & head loss of pipes are dependent on τw betweenfluid and the pipe surface.
Shear of turbulent flow is a function of fluid density andviscosity.
Shear stress of laminar flow is independent of fluid density. It isonly dependent on viscosity.
In a functional form, ∆p for incompressible turbulent in ahorizontal circular pipe with diameter D can be written as:
∆p = F (V, D, l, ε , μ , ρ)
where, V - average velocity D - diameter of pipe l - length of pipe ε - equivalent roughness of pipe wall μ - dynamic viscosity ρ - density of fluid
This can be written in dimensionless form
⎟⎟⎠
⎞⎜⎜⎝
⎛ =
Δ
DD
l VD
V 2
1
p2
ε
μ
ρ φ
ρ ,,
μ
ρ VD- Reynolds Number
D
ε - relative roughness

8/7/2019 52131131 Turbulent Flow in Pipes
http://slidepdf.com/reader/full/52131131-turbulent-flow-in-pipes 7/27
Now let’s look at the effect of surface roughness...
We know that the viscous layer is very thin ( δs/D << 1 where δs
is the thickness of the layer). If the wall is rough, the elementson the surface of the wall protrudes far into this layer/ orthrough the layer thus destroying the structure of the sub-layer.
So the properties of the sub-layer including ∆p and τw will beaffected.
For laminar flows, the viscous effects are important throughoutthe entire cross section of pipe (viscous sub-layer does not exist)
On the other hand, for turbulent flow the viscous sub-layer hassignificant importance especially at high Re.
We have seen before that:
( )6 2
V
D
l f p2
...ρ =Δ - Darcy Friction Factor
where f - friction factor l - length of pipe D - diameter ρ - density of fluid
V - average velocity
We also know that for laminar flows, f = 64/Re. This meansthat pressure drop is only dependent on Re.
8/7/2019 52131131 Turbulent Flow in Pipes
http://slidepdf.com/reader/full/52131131-turbulent-flow-in-pipes 8/27
But, for turbulent flows:
⎟
⎠
⎞⎜
⎝
⎛ =
D
f ε
φ Re,
which indicates that pressure drop depends on both Re andrelative roughness.
When we apply the energy equation for steady incompressibleflow in horizontal pipes,
L2
2
22
1
2
11 hz g 2
V pz
g 2
V p+++=++ α
γ α
γ
where h L is head loss between the two locations.
Since the flow is steady, fully developed and horizontal,
( D
1= D
2 , α
1= α
2 andz
1= z
2 ).So we have,
∆p = p1 – p2 = γ h L
Substituting in eq. (6), we get
( )7 g 2
V
D
l f h
2
V
D
l f h
g 2
V
D
l f h
2
L
2
L
2
L
...=
=
=
γ
ρ
γ
This equation is called the Darcy-Weisbach Equation.

8/7/2019 52131131 Turbulent Flow in Pipes
http://slidepdf.com/reader/full/52131131-turbulent-flow-in-pipes 9/27
For inclined pipes,
( )( ) ( )8
2
V
D
l f z z p
hz z pp2
12
L1221
...ρ
γ
γ γ
+−=Δ+−=−
ElevationEffects
FrictionEffects
The Darcy-Weisbach equation for friction loss is valid for:
• fully developed flow in pipe
• steady
• incompressible
• horizontal or inclined
Normally for pipe analysis, we obtain the dependence of frictionfactor on Re & ε/D through the Moody Chart.
To construct this chart the equivalent roughness ε is usually obtained for ‘clean’ and new pipes because after considerableuse, most pipes may have increased roughness.
For high Re flows, the viscous sub-layer is so thin that thesurface roughness completely dominates the character of flow near the walls.
For smooth pipes ( ε = 0), we notice that friction factor (f) is notzero because there is still head loss. These pipes are called“hydraulically smooth”.
8/7/2019 52131131 Turbulent Flow in Pipes
http://slidepdf.com/reader/full/52131131-turbulent-flow-in-pipes 10/27
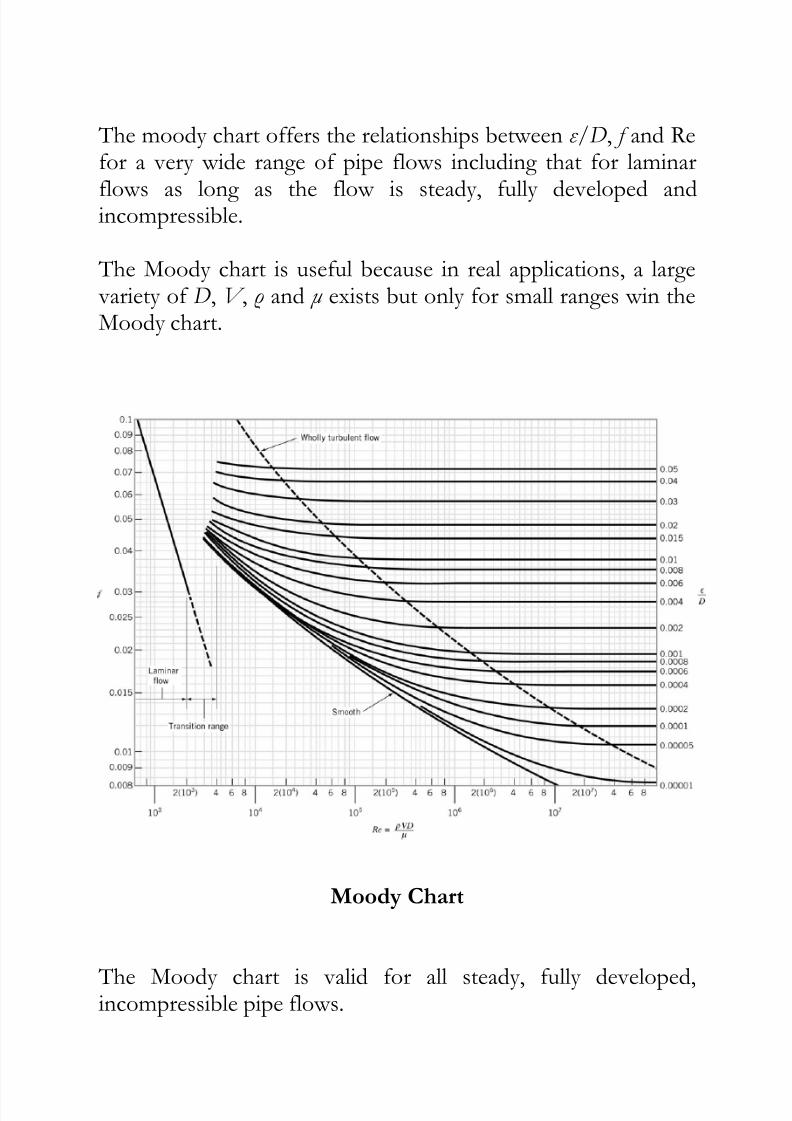
The moody chart offers the relationships between ε /D, f and Refor a very wide range of pipe flows including that for laminar
flows as long as the flow is steady, fully developed andincompressible.
The Moody chart is useful because in real applications, a largevariety of D, V , ρ and μ exists but only for small ranges win theMoody chart.
Moody Chart
The Moody chart is valid for all steady, fully developed,incompressible pipe flows.

8/7/2019 52131131 Turbulent Flow in Pipes
http://slidepdf.com/reader/full/52131131-turbulent-flow-in-pipes 11/27
Another method of measuring the friction factor for turbulentflow in pipes is by using the Blasius formula which is obtained
through empirically.
The Blasius formula is given as:-
( )9...Re
316.0
41
=f
Example 2.2
Water flows through a horizontal cast iron pipe with diameter0.05m with an average velocity of 0.1m/s.
a) If the certain measures were taken to maintain a laminarflow, determine the pressure drop in 5m section of thepipe.
b) Determine the pressure drop along 5m of the pipe for aturbulent flow using the Moody chart and the Blasiusformula and compute the percentage of difference fromthe values obtained.

8/7/2019 52131131 Turbulent Flow in Pipes
http://slidepdf.com/reader/full/52131131-turbulent-flow-in-pipes 12/27
Minor Losses
As fluid flows through a pipe, it loses energy in the direction of flow.
These energy lost consist of two types
• Friction loss
• Minor loss
Total loss is the sum of friction and minor losses.
Friction loss is caused by friction at walls and due to theresistance of fluid particles as they roll, rub and slide each other.
Minor losses are due to the geometry of pipes such as thepresence of valves and fittings such as elbows, tees, bends etc.
In pipeline designs, energy loss doe to friction dominates pipesthat are longer than 30 meters or greater.
For short lengths, minor losses might be equal or even greaterthat friction losses.
Minor losses are commonly expressed in terms of velocity head.
In equation form
( )10...2
2
g
V K h L=
where, K L - loss coefficient

8/7/2019 52131131 Turbulent Flow in Pipes
http://slidepdf.com/reader/full/52131131-turbulent-flow-in-pipes 13/27
Here,
22
21
Δ
2 V ρ
p
g V
hK L
L =
⎟⎠⎞⎜⎝ ⎛
=
Minor loss K L may vary depending on the shapes involved.
Here are a few examples…
Entrance loss
- head loss when liquid enters pipe from a largetank/reservoir
Re-entrantK L = 0.8
Sharp EdgeK L = 0.5
Slightly RoundedK L = 0.2-0.25
Well RoundedK L = 0.05

8/7/2019 52131131 Turbulent Flow in Pipes
http://slidepdf.com/reader/full/52131131-turbulent-flow-in-pipes 14/27
Exit loss
- head loss produced when liquid leaves pipe and enters a
large tank/reservoir- the entire kinetic energy of exiting fluid (V 1) is dissipatedthrough viscous effects and eventually becomes V 2 = 0
- Exit loss from (1) to (2) is equivalent to one velocity head- K L = 1.0
Sudden expansion and contraction- Losses that occur where there is a sudden increase in pipe
diameter (expansion) or where there is a sudden decrease inpipe diameter (contraction)
- loss coefficient is a function of are ratio A2 /A1.- A2 /A1 = 0 K L = 0.5 - extreme sharp edge entrance
- A2 /A1 = 0 K L = 0 - no area change
1.0
1.0A1/A2
K L
0.5
1.0A2/A1
K L
Sudden ContractionSudden Expansion
A2A1 A1 A2

8/7/2019 52131131 Turbulent Flow in Pipes
http://slidepdf.com/reader/full/52131131-turbulent-flow-in-pipes 15/27
Vena Contracta
Consider fluid entering a sharp corner as shown in figure
Fluid cannot through sharp corners. At a sharp corner, the flow will separate and reattaches at the pipe wall
This separation and reattachment forms a bubble (separationbubble) making the area of fluid flow smaller than the actualpipe area.
This causes the velocity of fluid passing through this small area
to increase
Maximum velocity exists at section with minimum area calledthe vena contracta.
Because high speed flows cannot slow down efficiently, thekinetic energy could not be fully converted into pressure.
(Losses occur )

8/7/2019 52131131 Turbulent Flow in Pipes
http://slidepdf.com/reader/full/52131131-turbulent-flow-in-pipes 16/27
Pumps
Pumps are used to increase energy of the fluid (liquid)
40% - 50% of industrial energy is used to drive pumps andcompressors
Proper design construction and selection of pumps areeconomically significant.
One of the most common pipe is the centrifugal pipe.
It consist of rotating elements called impeller which is containedwithin the pump housing
The shaft transfers mechanical energy to the impeller
A system pf bearings and seals are required to complete the
design
Flow enters the machine nearly axial at some radius through theeye of the impeller and leaves radially outward
Energy is added to the fluid by rotating blades and both pressureand absolute velocity are increased as fluid flows from eye to the
periphery of the blades
Fluid discharges into the housing which is designed to reducevelocity

8/7/2019 52131131 Turbulent Flow in Pipes
http://slidepdf.com/reader/full/52131131-turbulent-flow-in-pipes 17/27
Types of pumps
a) Reciprocating pistons or plungerb) Gear pumpc) Double screw pumpd) Sliding vanee) Lobe pumpf) Differential pistong) Flexible squeegee

8/7/2019 52131131 Turbulent Flow in Pipes
http://slidepdf.com/reader/full/52131131-turbulent-flow-in-pipes 18/27
Most of the analysis here will be carried out using the energy equation
2
2
221
2
11 z g 2
V pz g 2
V p ++=++γ γ
This equation is valid only if:
• Incompressible flow
• There are no mechanical devices between two sections(pumps, motors, turbines etc.)
• No energy loss due to friction• No heat transfer
In reality, pumps cause losses. We can use the general energy equation above to estimate the energy of flows involving the useof pumps and motors.
Normally pumps are driven by electric motors, IC engines etc.
In short we can say that pump draws kinetic energy and deliversit to the fluid
If we include energy of pump in the energy equation, we get:
( )11hz g 2
V phz g 2
V p L2
2
22P 1
2
11 ...+++=+++γ γ
Where h p is the energy added to fluid and h L is the head lossdiscussed earlier

8/7/2019 52131131 Turbulent Flow in Pipes
http://slidepdf.com/reader/full/52131131-turbulent-flow-in-pipes 19/27
Power Required by Pump
Power is the rate of work or the rate of which energy is being
transferred and is given by:
Power added to fluid:
P = γhpQ ...(12)
Unit: Watt, Nm/s or J/s
Efficiency of Pump
Defined as the ratio of power delivered by the pump to the fluidto the power supplied to the pump
Not all the input power is delivered to the fluid. This is because
of the losses that occur due to:• mechanical friction in the pump components
• fluid friction
• excessive fluid turbulence in the pump
Mechanical efficiency,
%pump given toPower
fluid todeliveredPower 100
P
P
iM
<==η
For pumps used in hydraulic systems, ηM is usually 70% - 80%
ηM for centrifugal pumps ranges from 50% - 80%

8/7/2019 52131131 Turbulent Flow in Pipes
http://slidepdf.com/reader/full/52131131-turbulent-flow-in-pipes 20/27
Fluid Motors
Fluid motors, turbines, rotary actuators & linear actuators are
several examples of devices that take energy from fluid anddeliver it in the form of work causing rotation of a shaft or thelinear movement of a piston
If we include fluid motors in our energy equation:
( )12hhz
g 2
V phz
g 2
V pRL2
2
22
P 1
2
11 ...++++=+++
γ γ
Efficiency of Motor
Efficiency of fluid motor is given by:
P
P OM == fluidbydeliveredPower
motor fromoutputPower η

8/7/2019 52131131 Turbulent Flow in Pipes
http://slidepdf.com/reader/full/52131131-turbulent-flow-in-pipes 21/27
Parameters Involved in Pump Selection
When selecting a pump for a particular application, the
following factors must be considered
• Nature of fluid
• Required capacity
• Conditions on the suction (inlet)
• Conditions at discharge (outlet)
• The total head on the pump
• The type of system to which the pump is delivering thefluid
• The type of power source (electric motor, diesel engine,steam turbine etc)
• Space, weight and position limitations
• Environmental conditions
• Cost of pump and installation
• Cost of pump operation
• Governing codes and standards

8/7/2019 52131131 Turbulent Flow in Pipes
http://slidepdf.com/reader/full/52131131-turbulent-flow-in-pipes 22/27
Cavitation
The fluid flow enters the pipe at a certain pressure and
temperature.
At a certain operating temperature, the fluid will vaporize if thepressure is sufficiently low.
This vaporized fluid enters the pump in the form of bubbles.
In the pump, pressure is increased, so these bubbles will collapserapidly causing excessive noise, vibration.
This will increase wear and tear of the pump components suchas the blades of the pump.
So, don’t want cavitation laa..
Net Positive Suction Head (NPSH)
So, the condition at the inlet of the pump is important. Thesuction system must allow smooth flow of liquid to enter thepump at a sufficiently high pressure to avoid creating vapor
bubbles in flow.
If pressure of fluid decreases, the bubbles are more likely tooccur because the temperature at which the bubbles are formedalso decreases
Therefore the pressure at inlet (suction pressure) should be wellabove the pressure at which vaporization would occur for theoperating temperature of the fluid

8/7/2019 52131131 Turbulent Flow in Pipes
http://slidepdf.com/reader/full/52131131-turbulent-flow-in-pipes 23/27
This is called providing Net Positive Suction Head (NPSH)
Normally, manufacturers supply data about the required NPSHfor each pump. For operation,
NPSH available > NPSH required
The value of NPSH is dependent on the:
• nature of the fluid
• piping at suction of pump• location of reservoir
• pressure in the reservoir
NPSH = h sp ± h s – h f - h vp
h sp - static pressure head applied to the fluid (hsp = P/ρg)
h s - elevation difference(+ve if pump is below reservoir)(-ve if pump is above reservoir)
h f - friction losses in suction piping h vp - vapor pressure of fluid at pumping temperature
Effect of Vapor Pressure
The pressure at which a liquid and vapor an exist at a giventemperature
If pressure of fluid entering pump is at vapor pressure, vaporbubbles form throughout the flow (boiling)

8/7/2019 52131131 Turbulent Flow in Pipes
http://slidepdf.com/reader/full/52131131-turbulent-flow-in-pipes 24/27
This situation must be avoided to prevent cavitation aspreviously discussed.
T OC 100
Vapor pressure (m)
0
12
Effect of Pump Speed
NPSHoperation = (N2 / N1)2
NPSHgiven
Conditions at new
operating speed
Catalog data
Effect of Vapor Pressure
Vapor pressure is the pressure at the free surface of fluid due tothe formation of a vapor
Temperature ↑, pressure ↑
Pressure inlet must stay above vapor pressure of fluid

8/7/2019 52131131 Turbulent Flow in Pipes
http://slidepdf.com/reader/full/52131131-turbulent-flow-in-pipes 25/27
Others
After pump selection, the following items must be specified:
1. Type of pump and manufacturer2. Size of pump3. Size of suction connection and type (flanged, screw-type
etc)4. Size and type of discharge connection5. Speed of operation6. Specifications for driver (power, speed, voltage etc)7. Types of coupling 8. Mounting details9. etc
Normally manufacturers provide catalogs for the customer tochoose from…

8/7/2019 52131131 Turbulent Flow in Pipes
http://slidepdf.com/reader/full/52131131-turbulent-flow-in-pipes 26/27
Example 2.3
For the pump shown in figure, determine the mechanical
efficiency of the pump if the power input is measured to be2871 Watts when pumping 0.0316 m3/s of oilGiven, s.g Hg = 13.54, γoil = 8797 N/m3, γwater = 9.81 x 10³)
Example 2.4
The volume flow rate through the pump shown in figure below
is 0.014 m3/s. The fluid being pumped is oil with a specificgravity of 0.86. Calculate the energy delivered by the pump tothe oil per unit weight of oil flowing in the system. Energy lossesin the system are caused by the check valve and friction losses asthe fluid flows through the piping. The magnitude of such losseshas been determined as 1.86m. Power delivered to pump is5.68kW. ( γwater = 9.81 x 10³)

8/7/2019 52131131 Turbulent Flow in Pipes
http://slidepdf.com/reader/full/52131131-turbulent-flow-in-pipes 27/27
Example 2.5
Determine NPSH for system shown in figure. Fluid reservoir is
a closed tank with pressure of 20kPa. Water temperature is 70o
C.Atmospheric pressure is 100.5kPa. The water level in the tank is2.5m above pump inlet. The pipe is a 1 ½ in schedule-40 pipewith total length of 12.0m and equivalent roughness ε = 4.6 x10⁻⁵m