538 e. rich street, columbus, oh 43215 55-57 e. moler st
TRANSCRIPT

538 E. Rich Street, Columbus, OH 43215
Gorgeous Professional Office Building;
Doug Tenenbaum, Senior Partner 583 S. 3rd Street, Columbus, OH [email protected] DD (614) 545-1412 Mobile 614-554-4408 Fax (614) 635-1369
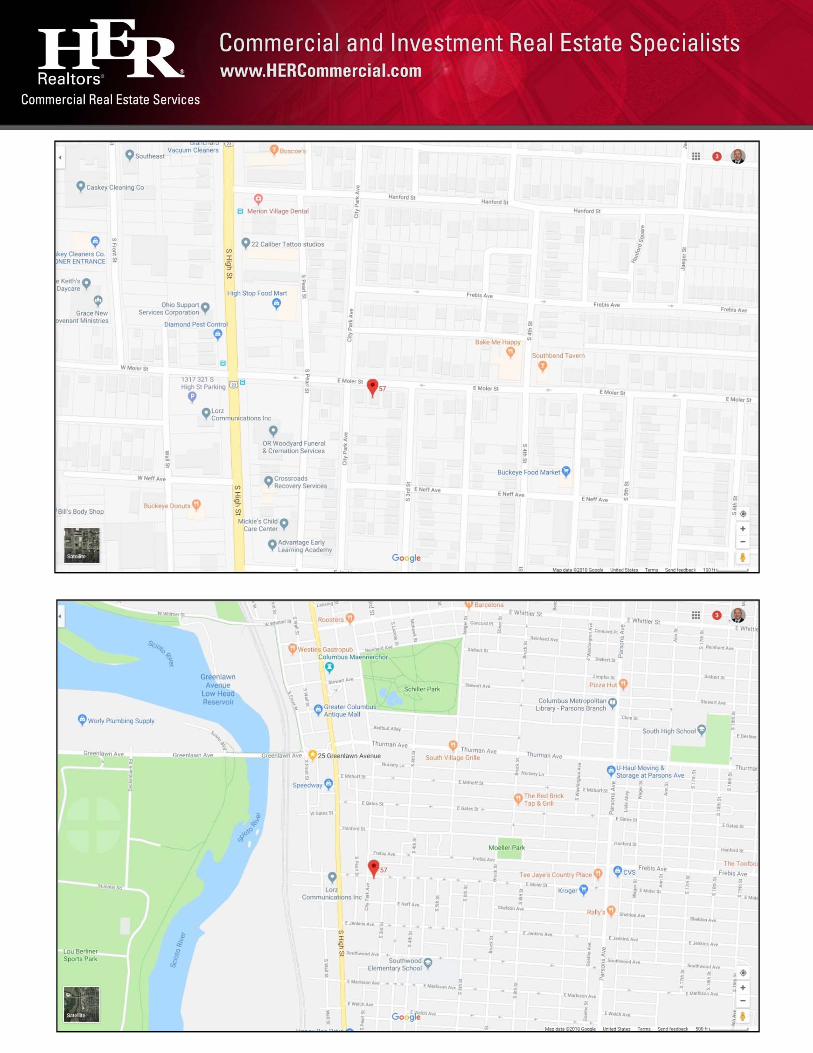
55-57 E. Moler St., Columbus, OH 43207Merion Village Duplex For Sale
Each unit is 1,008 SqFt - 2 BR/1 BA Ideal for Investor or Owner Occupant
In the Merion Village/German Village Corridor
$325,000 Asking Price ($162,500/Unit) – Leases for $900/mo & $1,000/mo
60,000 SF medical office and outpatient building “Under Construction”
Location: Situated on the south side of E. Moler Street just east of City Park Ave.; andlocated east of S. High Street and west of S. 4th Street; and 2 blocks south of Hanford Street

538 E. Rich Street, Columbus, OH 43215
Gorgeous Professional Office Building;Asking Price: $325,000 ($162,500/Unit) ($161/SF)Addresses: 55-57 E. Moler Street, Columbus, OH 43206Municipality: City of Columbus, County of Franklin
Total Square Feet: 2,016 SF (1,008 SF per unit)Number of Units: 2 Unit Mix: 2 Bedrooms and 1 Bathrooms per Unit
Monthly Rents/Unit: Unit 55 (upstairs): $950/mo (increases to $1,000/mo on 1/1/2019) Unit 57 (downstairs): $900/mo;
Total Monthly Rents: $1,850/month (increasing to $1,900/month on 1/1/2019)
Lease Expiry Dates: Unit 55 (upstairs): Expires 1/1/2020Unit 57 (downstairs): Expires 5/31/2019
Unit Description: Each unit is 2 bedroom, 1 bath with a large open living room withdecorative fireplace/mantle and dining room areas, updated kitchens with maple cabinets, granitecounters, stainless steel appliances (dishwasher, range and refrigerator); updated bathrooms, coveredfront porches and large windows throughout. Full basement sectioned off for each tenant, each withindividual washer and dryers (Seller owned) for each tenant and storage.
Updates Include: Roof (2012), electrical panels and plumbing (2014), Insulated windows(2013), forced air gas furnaces and hot water heaters (estimated 2012/2013), central air condenserunits (2014), 2 washers and 2 dryers (2014), kitchen appliances (2014)
Current Zoning: R2F, Z05-022Use Code: 520 – Two Family DwellingArea Commission: Columbus Southside Area CommissionAcres: 0.0565 acresLot Size: 41’ x 60’Year Built: 1910
Tax Parcel Number: 010-006710 Tax Card: https://goo.gl/13bJY9 Tax Map: https://goo.gl/78W4Vu
Annual Real Estate Taxes: $2,738 ($228/month)Google Map Link: https://goo.gl/maps/rtBpLofRYFn
DISCLAIMER: This Marketing Brochure has been prepared to provide summary, unverified information to prospective purchasers, and to establish only a preliminarylevel of interest in the subject property. The information contained herein is not a substitute for a thorough due diligence investigation. HER Realtors Commercial Real EstateServices has not made any investigation, and makes no warranty or representation, with respect to the income or expenses for the subject property, the future projected financialperformance of the property, the size and square footage of the property and improvements, the presence or absence of contaminating substances, PCB's or asbestos, thecompliance with State and Federal regulations, the physical condition of the improvements thereon, or the financial condition or business prospects of any tenant, or any tenant’splans or intentions to continue its occupancy of the subject property. The information contained in this Marketing Brochure has been obtained from sources we believe to bereliable; however, HER Realtors Commercial Real Estate Services has not verified, and will not verify, any of the information contained herein, nor has Real Living Businessconducted any investigation regarding these matters and makes no warranty or representation whatsoever regarding the accuracy or completeness of the information provided. Allpotential buyers must take appropriate measures to verify all of the information set forth herein.
538 E. Rich Street, Columbus, OH 43215
Gorgeous Professional Office Building;

538 E. Rich Street, Columbus, OH 43215
Gorgeous Professional Office Building;

538 E. Rich Street, Columbus, OH 43215
Gorgeous Professional Office Building;

538 E. Rich Street, Columbus, OH 43215
Gorgeous Professional Office Building;

538 E. Rich Street, Columbus, OH 43215
Gorgeous Professional Office Building;Building Sketch

538 E. Rich Street, Columbus, OH 43215
Gorgeous Professional Office Building;

538 E. Rich Street, Columbus, OH 43215
Gorgeous Professional Office Building;

538 E. Rich Street, Columbus, OH 43215
Gorgeous Professional Office Building;

Web AppBuilder for ArcGIS
Franklin County, OH, Esri, HERE, Garmin, INCREMENT P, USGS, EPA,USDA, Columbus GIS
Addresses
Corporate Boundary
Parcels
Base Zoning
Commercial
Downtown District
East Franklinton District
Excavation/Quarrying
Institutional
Manufactured Home
Manufacturing
November 9, 20180 0.03 0.050.01 mi
0 0.04 0.090.02 km
1:2,257
Columbus GIS | Franklin County, OH, Esri, HERE, Garmin, INCREMENT P, USGS, EPA, USDA |

��������� ���� �����
���
������ ���������� ������ ����!""#$%% && ' ()*'+ ,-. /)*0(10,. )2(345467 !""#$%% 8) 1)9 :;<==:/)*0(10, )2 >?<:;@<==:)A6$# *!+B()+' C)+D (83#E$5 FGHI$# J:JJJ=K:JB6 /L5GHIG%M D$%/LG6NO P+!FC*BF������ ������ ����QL6467 QJ&@J<<. +$%4"$6N435. +<P. <RSR<JJ&. 2@?&24%NL#4E T4%N#4EN FL6$,UL#N FL#NU ,V$E435 83#W467 !#$3 )GN/LG6E45 X3#436E$ FL6$1L3#" LY QL6467 !"ZG%NH$6N [1Q!\X3#436E$ FL6$/LHH$#E435 )]$#53O FL6$85366467 )]$#53O FL6$#̂3VU4E% X3#436E$ FL6$!#$3 /LHH4%%4L6 /L5GHIG% ,LGNU%4"$ !#$3 /LHH4%%4L624%NL#4E ,4N$ FLP5LL" QL6$ )GN!4#VL#N )]$#53O '6]4#L6% FL6$_��̀ ��� ������ ab����QL6467 FL6$1L3#" LY QL6467 !"ZG%NH$6N [1Q!\X3#436E$ FL6$/LG6E45 X3#436E$ FL6$#̂3VU4E% X3#436E$ FL6$

Demographic Source: Applied Geographic Solutions 10/2018, TIGER Geography page 1 of 3©2018, Sites USA, Chandler, Arizona, 480-491-1112
Th
is r
ep
ort
wa
s p
rod
uce
d u
sin
g d
ata
fro
m p
riva
te a
nd
go
vern
me
nt
sou
rce
s d
ee
me
d t
o b
e r
elia
ble
. T
he
info
rma
tio
n h
ere
in is
pro
vid
ed
with
ou
t re
pre
sen
tatio
n o
r w
arr
an
ty.
FULL PROFILE2000-2010 Census, 2018 Estimates with 2023 Projections
Calculated using Weighted Block Centroid from Block Groups
Lat/Lon: 39.9350/-82.9944RF1
55 E Moler St1 mi radius 3 mi radius 5 mi radius
Columbus, OH 43207
PO
PU
LA
TIO
N
2018 Estimated Population 17,140 101,514 308,210
2023 Projected Population 19,041 115,676 340,451
2010 Census Population 15,153 87,759 270,289
2000 Census Population 16,721 94,339 275,978
Projected Annual Growth 2018 to 2023 2.2% 2.8% 2.1%
Historical Annual Growth 2000 to 2018 0.1% 0.4% 0.6%
HO
US
EH
OL
DS
2018 Estimated Households 7,991 44,131 125,843
2023 Projected Households 8,542 48,657 135,224
2010 Census Households 7,080 37,381 109,726
2000 Census Households 7,304 39,211 111,764
Projected Annual Growth 2018 to 2023 1.4% 2.1% 1.5%
Historical Annual Growth 2000 to 2018 0.5% 0.7% 0.7%
AG
E
2018 Est. Population Under 10 Years 12.5% 13.4% 12.2%
2018 Est. Population 10 to 19 Years 9.6% 12.1% 14.2%
2018 Est. Population 20 to 29 Years 18.3% 16.5% 19.3%
2018 Est. Population 30 to 44 Years 25.0% 21.1% 19.8%
2018 Est. Population 45 to 59 Years 18.2% 18.7% 17.1%
2018 Est. Population 60 to 74 Years 12.6% 13.5% 12.5%
2018 Est. Population 75 Years or Over 3.9% 4.7% 4.8%
2018 Est. Median Age 33.5 34.3 33.3
MA
RIT
AL
ST
AT
US
&
GE
ND
ER
2018 Est. Male Population 51.3% 50.2% 49.9%
2018 Est. Female Population 48.7% 49.8% 50.1%
2018 Est. Never Married 52.3% 50.6% 53.3%
2018 Est. Now Married 23.7% 22.8% 25.4%
2018 Est. Separated or Divorced 20.9% 21.7% 17.0%
2018 Est. Widowed 3.1% 4.9% 4.3%
INC
OM
E
2018 Est. HH Income $200,000 or More 7.4% 4.2% 4.3%
2018 Est. HH Income $150,000 to $199,999 6.2% 3.2% 3.7%
2018 Est. HH Income $100,000 to $149,999 12.5% 9.5% 10.8%
2018 Est. HH Income $75,000 to $99,999 12.4% 9.8% 10.7%
2018 Est. HH Income $50,000 to $74,999 21.3% 18.0% 18.2%
2018 Est. HH Income $35,000 to $49,999 11.7% 13.3% 13.3%
2018 Est. HH Income $25,000 to $34,999 8.1% 11.0% 11.0%
2018 Est. HH Income $15,000 to $24,999 8.4% 11.7% 11.0%
2018 Est. HH Income Under $15,000 12.1% 19.4% 17.0%
2018 Est. Average Household Income $78,175 $59,547 $62,212
2018 Est. Median Household Income $63,530 $46,624 $52,278
2018 Est. Per Capita Income $36,572 $26,502 $25,894
2018 Est. Total Businesses 722 8,455 16,818
2018 Est. Total Employees 9,407 181,600 388,894

Demographic Source: Applied Geographic Solutions 10/2018, TIGER Geography page 2 of 3©2018, Sites USA, Chandler, Arizona, 480-491-1112
Th
is r
ep
ort
wa
s p
rod
uce
d u
sin
g d
ata
fro
m p
riva
te a
nd
go
vern
me
nt
sou
rce
s d
ee
me
d t
o b
e r
elia
ble
. T
he
info
rma
tio
n h
ere
in is
pro
vid
ed
with
ou
t re
pre
sen
tatio
n o
r w
arr
an
ty.
FULL PROFILE2000-2010 Census, 2018 Estimates with 2023 Projections
Calculated using Weighted Block Centroid from Block Groups
Lat/Lon: 39.9350/-82.9944RF1
55 E Moler St1 mi radius 3 mi radius 5 mi radius
Columbus, OH 43207
RA
CE
2018 Est. White 74.9% 49.7% 58.9%
2018 Est. Black 18.6% 42.2% 31.7%
2018 Est. Asian or Pacific Islander 1.9% 2.5% 3.9%
2018 Est. American Indian or Alaska Native 0.3% 0.4% 0.3%
2018 Est. Other Races 4.2% 5.3% 5.2%
HIS
PA
NIC 2018 Est. Hispanic Population 533 4,188 13,711
2018 Est. Hispanic Population 3.1% 4.1% 4.4%
2023 Proj. Hispanic Population 3.3% 4.2% 4.6%
2010 Hispanic Population 2.6% 3.2% 3.7%
ED
UC
AT
ION
(Ad
ults
25
or
Old
er)
2018 Est. Adult Population (25 Years or Over) 12,338 68,689 196,157
2018 Est. Elementary (Grade Level 0 to 8) 4.4% 4.3% 3.6%
2018 Est. Some High School (Grade Level 9 to 11) 10.6% 13.0% 10.3%
2018 Est. High School Graduate 20.9% 30.2% 28.1%
2018 Est. Some College 16.7% 19.2% 19.6%
2018 Est. Associate Degree Only 5.4% 5.6% 5.9%
2018 Est. Bachelor Degree Only 27.8% 17.8% 20.4%
2018 Est. Graduate Degree 14.2% 9.9% 12.1%
HO
US
ING 2018 Est. Total Housing Units 8,598 49,038 135,529
2018 Est. Owner-Occupied 38.9% 34.6% 40.0%
2018 Est. Renter-Occupied 54.0% 55.4% 52.9%
2018 Est. Vacant Housing 7.1% 10.0% 7.1%
HO
ME
S B
UIL
T B
Y Y
EA
R 2010 Homes Built 2005 or later 1.6% 2.1% 1.7%
2010 Homes Built 2000 to 2004 5.2% 7.8% 7.5%
2010 Homes Built 1990 to 1999 4.9% 8.0% 9.8%
2010 Homes Built 1980 to 1989 3.3% 5.3% 6.5%
2010 Homes Built 1970 to 1979 5.9% 9.5% 12.7%
2010 Homes Built 1960 to 1969 8.1% 15.0% 15.9%
2010 Homes Built 1950 to 1959 11.8% 17.3% 18.5%
2010 Homes Built Before 1949 69.9% 49.0% 39.0%
HO
ME
VA
LU
ES
2010 Home Value $1,000,000 or More 0.6% 0.6% 0.6%
2010 Home Value $500,000 to $999,999 6.5% 5.6% 5.5%
2010 Home Value $400,000 to $499,999 3.4% 3.3% 3.6%
2010 Home Value $300,000 to $399,999 12.8% 7.9% 8.2%
2010 Home Value $200,000 to $299,999 21.0% 15.4% 16.8%
2010 Home Value $150,000 to $199,999 18.1% 13.4% 14.5%
2010 Home Value $100,000 to $149,999 20.6% 19.2% 22.4%
2010 Home Value $50,000 to $99,999 19.9% 32.1% 28.1%
2010 Home Value $25,000 to $49,999 5.2% 8.8% 7.3%
2010 Home Value Under $25,000 2.1% 4.1% 2.8%
2010 Median Home Value $179,847 $132,072 $146,898
2010 Median Rent $757 $698 $727

Demographic Source: Applied Geographic Solutions 10/2018, TIGER Geography page 3 of 3©2018, Sites USA, Chandler, Arizona, 480-491-1112
Th
is r
ep
ort
wa
s p
rod
uce
d u
sin
g d
ata
fro
m p
riva
te a
nd
go
vern
me
nt
sou
rce
s d
ee
me
d t
o b
e r
elia
ble
. T
he
info
rma
tio
n h
ere
in is
pro
vid
ed
with
ou
t re
pre
sen
tatio
n o
r w
arr
an
ty.
FULL PROFILE2000-2010 Census, 2018 Estimates with 2023 Projections
Calculated using Weighted Block Centroid from Block Groups
Lat/Lon: 39.9350/-82.9944RF1
55 E Moler St1 mi radius 3 mi radius 5 mi radius
Columbus, OH 43207
LA
BO
R F
OR
CE
2018 Est. Labor Population Age 16 Years or Over 14,022 81,150 251,093
2018 Est. Civilian Employed 69.4% 59.1% 59.7%
2018 Est. Civilian Unemployed 2.8% 3.9% 3.0%
2018 Est. in Armed Forces 0.1% - 0.1%
2018 Est. not in Labor Force 27.7% 37.0% 37.2%
2018 Labor Force Males 51.2% 50.0% 49.6%
2018 Labor Force Females 48.8% 50.0% 50.4%
OC
CU
PA
TIO
N
2010 Occupation: Population Age 16 Years or Over 9,739 47,584 150,138
2010 Mgmt, Business, & Financial Operations 19.5% 15.5% 15.0%
2010 Professional, Related 27.8% 21.4% 22.9%
2010 Service 16.1% 19.1% 18.8%
2010 Sales, Office 22.8% 24.3% 24.9%
2010 Farming, Fishing, Forestry 0.3% 0.1% 0.2%
2010 Construction, Extraction, Maintenance 3.0% 4.8% 4.6%
2010 Production, Transport, Material Moving 10.4% 14.8% 13.7%
2010 White Collar Workers 70.1% 61.1% 62.7%
2010 Blue Collar Workers 29.9% 38.9% 37.3%
TR
AN
SP
OR
TA
TIO
N
TO
WO
RK
2010 Drive to Work Alone 79.5% 77.8% 77.7%
2010 Drive to Work in Carpool 7.6% 8.3% 7.4%
2010 Travel to Work by Public Transportation 3.5% 3.8% 3.4%
2010 Drive to Work on Motorcycle - 0.1% 0.1%
2010 Walk or Bicycle to Work 4.8% 5.0% 5.8%
2010 Other Means 0.9% 1.2% 1.2%
2010 Work at Home 3.6% 3.8% 4.4%
TR
AV
EL
TIM
E 2010 Travel to Work in 14 Minutes or Less 38.5% 26.5% 27.7%
2010 Travel to Work in 15 to 29 Minutes 44.6% 42.1% 44.1%
2010 Travel to Work in 30 to 59 Minutes 19.4% 16.7% 16.4%
2010 Travel to Work in 60 Minutes or More 3.0% 3.5% 3.2%
2010 Average Travel Time to Work 17.7 18.9 18.7
CO
NS
UM
ER
EX
PE
ND
ITU
RE
2018 Est. Total Household Expenditure $465 M $2.13 B $6.27 B
2018 Est. Apparel $16.3 M $74.5 M $219 M
2018 Est. Contributions, Gifts $33.5 M $142 M $423 M
2018 Est. Education, Reading $19.3 M $83.6 M $247 M
2018 Est. Entertainment $26.1 M $118 M $349 M
2018 Est. Food, Beverages, Tobacco $70.1 M $330 M $965 M
2018 Est. Furnishings, Equipment $16.2 M $71.6 M $212 M
2018 Est. Health Care, Insurance $40.1 M $190 M $553 M
2018 Est. Household Operations, Shelter, Utilities $144 M $665 M $1.95 B
2018 Est. Miscellaneous Expenses $6.82 M $32.0 M $93.4 M
2018 Est. Personal Care $6.04 M $27.8 M $81.6 M
2018 Est. Transportation $86.5 M $400 M $1.18 B
